F2. Rail Traffic - Southampton VTS Projects/17F2... · updated by Further Information 259 F2. Rail...
26
Environmental Statement for Port of Southampton: Berth 201/202 Works updated by Further Information 259 F2. Rail Traffic Executive Summary: Chapter F2: Rail Traffic The impacts of the proposed Berth 201/202 Works on rail traffic and infrastructure have been assessed against relevant national guidance, and have included consultation with relevant bodies and organisations, policy review and an assessment of existing and proposed changes to the rail environment within the context of the national rail network. The capacity of the Container Terminal at Southampton as a result of the project is considered to be 2.8m TEU, expected to be reached in 2027/8. The number of containers to rail is anticipated to grow progressively from 318,000 containers in 2011 to 640,000 in 2027/8, resulting in an increase from 19 train paths per day in 2011, to 24 paths per day in 2027/8. Efficiency measures to achieve this growth include train lengthening, improved utilisation and increasing operation to 6 days per week. These measures are fully supported by Network Rail. The conclusions drawn from potential impacts that will arise from the increase in capacity at the Container Terminal in Southampton are outlined below: 1) Network Capacity Network Rail are carrying out nationwide enhancements and major improvements to the rail network in order to significantly develop intermodal freight capacity and capability throughout the country. These enhancements will increase capacity on routes from Southampton, improve pathing options for freight and improve journey times. As a result of these infrastructure commitments (many of which are in the process of being delivered), the necessary network capacity can reasonably be expected to be available to accommodate the pathing requirements generated by increased capacity at Southampton. 2) Southampton Rail Terminal Capacity Investment in new cranes and improved infrastructure along with increased train length and better utilisation at the Southampton rail terminals will result in the ability to handle projected levels of 640,000 containers per annum by 2027/8. The overall impact is therefore considered to be insignificant. 3) Inland Terminal Capacity Adequate inland terminal capacity is available throughout the UK for services from Southampton, with the magnitude of impact in terms of additional trains operating to inland terminals considered to be negligible. The overall impact of the berth 201/202 works in respect of total capacity of inland intermodal rail terminals is considered to be insignificant. Conclusion The capacity of rail resources at the Southampton rail terminals, on the national rail network,
-
Upload
nguyenquynh -
Category
Documents
-
view
213 -
download
0
Transcript of F2. Rail Traffic - Southampton VTS Projects/17F2... · updated by Further Information 259 F2. Rail...
Environmental Statement for Port of Southampton: Berth 201/202 Works updated by Further Information
259
F2. Rail Traffic
Executive Summary: Chapter F2: Rail Traffic The impacts of the proposed Berth 201/202 Works on rail traffic and infrastructure have been assessed against relevant national guidance, and have included consultation with relevant bodies and organisations, policy review and an assessment of existing and proposed changes to the rail environment within the context of the national rail network. The capacity of the Container Terminal at Southampton as a result of the project is considered to be 2.8m TEU, expected to be reached in 2027/8. The number of containers to rail is anticipated to grow progressively from 318,000 containers in 2011 to 640,000 in 2027/8, resulting in an increase from 19 train paths per day in 2011, to 24 paths per day in 2027/8. Efficiency measures to achieve this growth include train lengthening, improved utilisation and increasing operation to 6 days per week. These measures are fully supported by Network Rail. The conclusions drawn from potential impacts that will arise from the increase in capacity at the Container Terminal in Southampton are outlined below: 1) Network Capacity Network Rail are carrying out nationwide enhancements and major improvements to the rail network in order to significantly develop intermodal freight capacity and capability throughout the country. These enhancements will increase capacity on routes from Southampton, improve pathing options for freight and improve journey times. As a result of these infrastructure commitments (many of which are in the process of being delivered), the necessary network capacity can reasonably be expected to be available to accommodate the pathing requirements generated by increased capacity at Southampton. 2) Southampton Rail Terminal Capacity Investment in new cranes and improved infrastructure along with increased train length and better utilisation at the Southampton rail terminals will result in the ability to handle projected levels of 640,000 containers per annum by 2027/8. The overall impact is therefore considered to be insignificant. 3) Inland Terminal Capacity Adequate inland terminal capacity is available throughout the UK for services from Southampton, with the magnitude of impact in terms of additional trains operating to inland terminals considered to be negligible. The overall impact of the berth 201/202 works in respect of total capacity of inland intermodal rail terminals is considered to be insignificant. Conclusion The capacity of rail resources at the Southampton rail terminals, on the national rail network,

Environmental Statement for Port of Southampton: Berth 201/202 Works updated by Further Information
260
and at the inland terminals have been demonstrated to be sufficient to accommodate rail requirements generated as a result of the berth 201/202 works.
Introduction F2.1 This chapter, which has been prepared by Geldard Consulting, considers the impacts of the
project on rail transportation conditions. Other possible impacts associated with rail freight movements, such as noise, vibration and air quality impacts, are addressed elsewhere within relevant assessment chapters.
The Study Area F2.2 The Port of Southampton is already an established generator of rail freight movements, with the
Container Terminal being the main generator of rail freight traffic. The existing rail related infrastructure (both routes and terminals) which are currently used to handle the rail freight traffic generated by the terminal have therefore effectively defined the geographical extent of the assessment.
Methodology F2.3 The methodology which has been adopted for this assessment takes account of the guidance
on Transport Assessment issued jointly by the Department for Transport (DfT) and the Department for Communities and Local Government (DCLG) in March 2007. It also draws on guidance given in Volume II Section 2 Part 5 of the Design Manual for Roads and Bridges in respect of assisting in the determination of the significance of rail related environmental effects.
F2.4 In summary, the methodology that has been used for this rail assessment has followed the
different stages set out in the following paragraphs. These various stages, and the outcomes from them, are detailed throughout the rest of this chapter.
F2.5 Consultation - Consultation with relevant bodies and organisations has formed a key part of
the assessment. Within this chapter details are provided on who has been consulted, along with details of how the results of such consultation has informed the assessment undertaken.
F2.6 Policy Context - The next stage of the assessment is an analysis of the policy position that is
of relevance to rail matters. This is undertaken in order to determine the policy framework against which the assessment takes place.
F2.7 Understanding the existing rail environment - This section of the chapter describes the
existing rail environment of relevance to the berth 201/202 works. In addition to providing details of the wider rail network and rail terminals relevant to the works, information is provided on rail operation aspects such as utilisation, the length of trains and the volume of freight transported.
F2.8 Change in the absence of the works – This section of the chapter describes the future
changes that are likely to occur to the rail environment in the absence of the works.
Environmental Statement for Port of Southampton: Berth 201/202 Works updated by Further Information
261
F2.9 Impact Identification and Assessment – This section of the chapter identifies the possible impacts on the rail environment that could be generated by the project. The approach followed in this assessment follows that detailed in Chapter 7, in that the consequences of the Container Terminal operating at the maximum capacity achievable with the works has been assessed (2.8m TEU).
F2.10 The methodology that has been used to determine the significance of impacts is along similar
lines to that which has been used in respect of road traffic impacts, which is described in detail in chapter F1. In summary impacts are classified as either insignificant or of minor, moderate or major significance, having regard to the sensitivity of the receptor and the magnitude of the impact.
Consultation F2.11 The following organisations were consulted during this assessment:
Network Rail Freightliner Limited DB Schenker (UK) Ltd GB Railfreight Ltd DP World Southampton
Policy Context National Policy and Guidance F2.12 Planning Policy Guidance 13 was published in March 2001 and updated in January 2011. One
of the key objectives identified in the guidance is to promote more sustainable transport choices for both people and freight. In order to achieve this, the guidance supports the increase in freight movements by rail or water wherever possible.
F2.13 The White Paper, “The Future of Rail” was published in July 2004 and set out the then
Government’s commitment to revitalising the rail industry. The document acknowledges the benefits offered by rail freight traffic and outlines plans to secure access to the national network. It also notes the growth in the market share of rail traffic as apart of overall freight movements, which has made an important contribution to the Government’s sustainable distribution strategy.
F2.14 “Towards a Sustainable Transport System” was published in October 2007 in response to the
Eddington Study and the Stern review and discusses measures to improve transport’s contribution to economic prosperity whilst reducing emissions. The movement of freight by rail is viewed as contributing towards this approach. As part of taking these measures forward the Government produced a consultation document, ‘Delivering a Sustainable Transport System’, which outlined how the approach was to be put into practice. The document acknowledges the increase of freight movements by rail and states the Government’s commitment to supporting surface access to ports and airports.
F2.15 The DfT’s July 2007 White Paper “Delivering a Sustainable Railway” proposed the development
of a Strategic Freight Network (SFN) in England and Wales as part of its high level strategy to

Environmental Statement for Port of Southampton: Berth 201/202 Works updated by Further Information
262
address the growing demands on the network for moving passengers and freight. The intention was to provide a framework for investment and network management to meet better the requirements of freight. Network Rail has coordinated the development of the SFN on behalf of the industry and the DfT. It has taken the concept proposed by the DFT and translated it into a vision for a future SFN and developed the steps for implementation.
Regional Policy and Guidance F2.16 The South East Plan is the Regional Spatial Strategy for the South East. The Government are
intending to revoke Regional Strategies but at the time of writing, they still form part of the statutory development plan.
F2.17 The South East Plan acknowledges the importance of the region’s ports for the UK economy.
Policy T10 emphasises the need for supporting infrastructure in order to maintain and enhance this position. The importance of moving freight by rail is set out in Policy T11. This policy encourages the increase in rail freight and identifies key corridors, including Southampton to the West Midlands, where enhanced capacity is needed.
Local Policy and Guidance South Hampshire Joint Strategy F2.18 This Strategy forms part of Hampshire’s Local Transport Plan. One of the key challenges
identified in the document is to ensure continued reliable access to the area’s international gateway ports. The increasing significance of rail is noted and policies seek to promote measures, which will increase the share of onward movement of container traffic by rail.
South Hampshire Freight Strategy F2.19 The strategy aims to facilitate the sustainable movement of freight and support the economy of
the sub region whilst considering the needs of society and the environment. The document notes that an increase in the volumes of rail freight traffic is predicted and that investment in additional capacity is necessary.
Southampton Core Strategy F2.20 The Core Strategy outlines the key planning strategy for the city up until 2026. The document
identifies the vital role of the Port of Southampton, in terms of its international, national and regional significance. The city’s approach to the port is set out in Policy CS9, which supports the growth and encourages the increase in the movement of freight by rail. Policy Conclusion
F2.21 The proposal, by increasing the amount of freight moved by rail, is considered to be in
accordance with the relevant aspects of policy.

Environmental Statement for Port of Southampton: Berth 201/202 Works updated by Further Information
263
The Existing Rail Environment F2.22 The following section describes the existing rail environment of relevance to the project. Determining Rail Capacity National Rail Network F2.23 Access to the national rail network is controlled by Network Rail. There are a number of key
factors that determine the capacity of any rail route. These are:
Physical Factors
Destination terminal. The number and limitations of tracks on the route. The design of signalling on the route which determines the minimum possible headway
(the distance between the tail of one train and the front of a following train) between services.
The formation of junctions on the route, as the extent to which services make conflicting moves will impact on capacity.
Operational Factors
The number and mix of service types on the route, as capacity can be more difficult to manage when there is a mix of fast and slow services.
Time of day when paths are required. The match of network paths and terminal access. Network Rail’s maintenance and enhancement plans. Type of equipment, (including locomotives) to be used and related train speed and
acceleration. F2.24 In practice the ability to identify additional train paths over a route is influenced by a mix of
these various factors. F2.25 As well as a routine half-yearly timetable review, Network Rail has a number of other
mechanisms to model and plan capacity. These attempt to incorporate such details as the route characteristics, passenger timetable, and allocated freight paths. Network Rail’s annual Network Statement provides guidance on path allocation whilst their Strategic Access Planning (SAP) team looks at current and future capacity requirements. In addition, work undertaken through the Route Utilisation Strategy (RUS) process provides the opportunity for wide industry consultation and is aimed to plan and maximise capacity.
F2.26 Rail capacity is never a straightforward issue. For example access may be possible in one part
of the network at one time of day and at a different time of day elsewhere. Whilst any analysis highlights issues that exist in identifying additional freight paths, it is always likely that additional paths can be identified through a trade-off between end to end journey times and the time of day the services will run. As a general rule daytime access is more difficult than evening or overnight. This is particularly the case on main passenger routes that try to combine freight with

Environmental Statement for Port of Southampton: Berth 201/202 Works updated by Further Information
264
high speed and local passenger services especially on a 2-track railway line or in large conurbations. These issues would certainly occur on routes leading to the North West, the Midlands and the Scottish Central Belt.
F2.27 It is important to recognise the significance of gauge in the context of the capacity of the
national rail network. In simple terms, gauge is the height between the rails and any overhead structure such as bridges, tunnels, signals and platform canopies. Most of the main routes in the past have operated at W8 gauge which will allow an 8ft 6in high container to pass on a standard height wagon.
F2.28 With an ever growing use of 9ft 6in containers by the major deep sea container lines, improving
the available gauge has become increasingly important because these containers are too high to be carried on a W8 route without the use of special low height wagons, see paragraph F2.36. Network Rail is now progressing with a major programme of gauge enhancement to develop routes at W10 gauge which allow high cube containers to be carried on standard height wagons. As over 30% of the maritime box fleet is now high cube, gauge enhancement significantly increases the potential traffic that can be carried by each train thereby increasing network capacity by means other than building extra tracks and signals.
Rail Terminals F2.29 Intermodal rail terminals throughout the UK vary considerably in terms of size, and the available
rail infrastructure and craneage. All of these factors, as well as operating methods and service details will have a bearing on terminal capacity. Facilities which are closely located to one another will also provide alternate, as well as additional capacity to customers within the same area.
F2.30 Currently around 30 locations are listed as providing intermodal terminals in the UK. Of these
15 are inland terminals and the remaining are at 15 port locations, several with more than one operating rail terminal. Details are shown at Table F2.5.
F2.31 There are five key features that will determine the capacity of any rail container terminal:
Rail Access – this relates to access to and from the main national network. Access can be a restricting factor when terminals are located close to a busy main line such as the West Coast Main Line (WCML).
Terminal Rail Infrastructure – the number and length of sidings will impact on capacity. Working sidings should be long enough to avoid splitting trains whilst reception sidings are required to stable trains before or after loading.
Craneage – the number and type of cranes will impact on the speed of loading and the use of available land for container pre-positioning and storage. Overhead cranes such as rail mounted gantries (RMGs) or rubber tyred gantries (RTGs) provide good cycle speeds (moves per hour) and efficient land use whilst reachstackers are more versatile and flexible.
Terminal size – clearly large unrestricted sites provide the best option to maximise efficiencies through the provision of working sidings, equipment and vehicle access and container storage capacity.

Environmental Statement for Port of Southampton: Berth 201/202 Works updated by Further Information
265
Operations – as with the national rail network it is possible to increase terminal capacity through the efficiency of operations. Planned train arrival and departure times throughout a full 24hour period is essential whilst maximising terminal layout and the use of IT based control systems can significantly influence terminal capacity.
F2.32 Whilst a combination of all the above factors will impact on terminal capacity many of these
factors are within the direct control of the terminal operator. Investment in infrastructure and craneage as well as IT systems can markedly increase terminal capacity.
Rail Operations - Equipment F2.33 The main locomotive being used on most intermodal services is the Class 66. This vehicle has
proved to be reliable and capable of handling most services on most routes. It should be noted that intermodal traffic is by nature much lighter than traditional bulk freight traffic. Normally, weight is not therefore a major issue.
F2.34 Nevertheless plans for longer trains may have implications on the weight of trains and
consequently on the future use of the Class 66 locomotive. Two options are available to address this. The first option is to use the new Class 70 locomotive which has recently been introduced into the UK. This locomotive provides lower emissions and greater power to accommodate heavier loads. The second option is to use two Class 66 locomotives (double-heading).
F2.35 A wide variety of wagon types are used for intermodal traffic. Three key issues determine the
capacity that can be achieved with differing wagon types.
Maximising the number of container platforms available for a set train length – this is a function of wagon design and is best illustrated through two examples:
Many of the newer standard 60ft wagons which are capable of carrying 1 x 20ft
and 1 x 40ft container are “twinned”. This is achieved through joining two twinned wagons with a rigid bar coupling rather than buffers and normal couplings. The effect is to reduce the length of the twin as compared with two normally coupled wagons with drawgear at both ends.
On some services it has been necessary to use European style intermodal wagons. These wagons are generally designed to carry 45ft as well as 40ft and 2 x 20ft containers. Clearly, with a 45ft platform being used for deep sea traffic dominated by 40ft and 20ft containers; these wagons are inefficient with 5ft of wasted space per wagon.
Wagon suitability for container mix – this relates to the ability to provide a balance of 20ft
and 40ft containers when using 60ft platform wagons. Generally the growth in the market is in 40ft containers whilst 20ft containers are not growing at the same pace. The result is that it is currently becoming increasingly difficult to fill all the 20ft slots on 60 ft wagons.
Wagon availability – both of the two points above are compounded by the current inability
to source and operate with the most efficient wagon types. As has been stated, 45ft
Environmental Statement for Port of Southampton: Berth 201/202 Works updated by Further Information
266
wagons have to be used on some services whilst much needed 40ft wagons are not yet available.
F2.36 The issue of gauge as explained in paragraph F2.27 has significant implications on wagon type
and capacity on the W8 routes. Where gauge clearance to W10 has not been achieved the only way of transporting high cube containers by rail is on special low height wagons. The well-wagon provides a low height platform situated between standard-height bogies. This is particularly inefficient as a significant part of the wagon length is unproductive.
F2.37 A second alternative is a wagon with a low height platform mounted on small wheel bogies. In
some cases these are 40ft platforms and have been twinned as described above. Unfortunately, these wagons have proved to be disproportionately expensive to purchase and to maintain although a new design has recently been type approved and is soon to enter service.
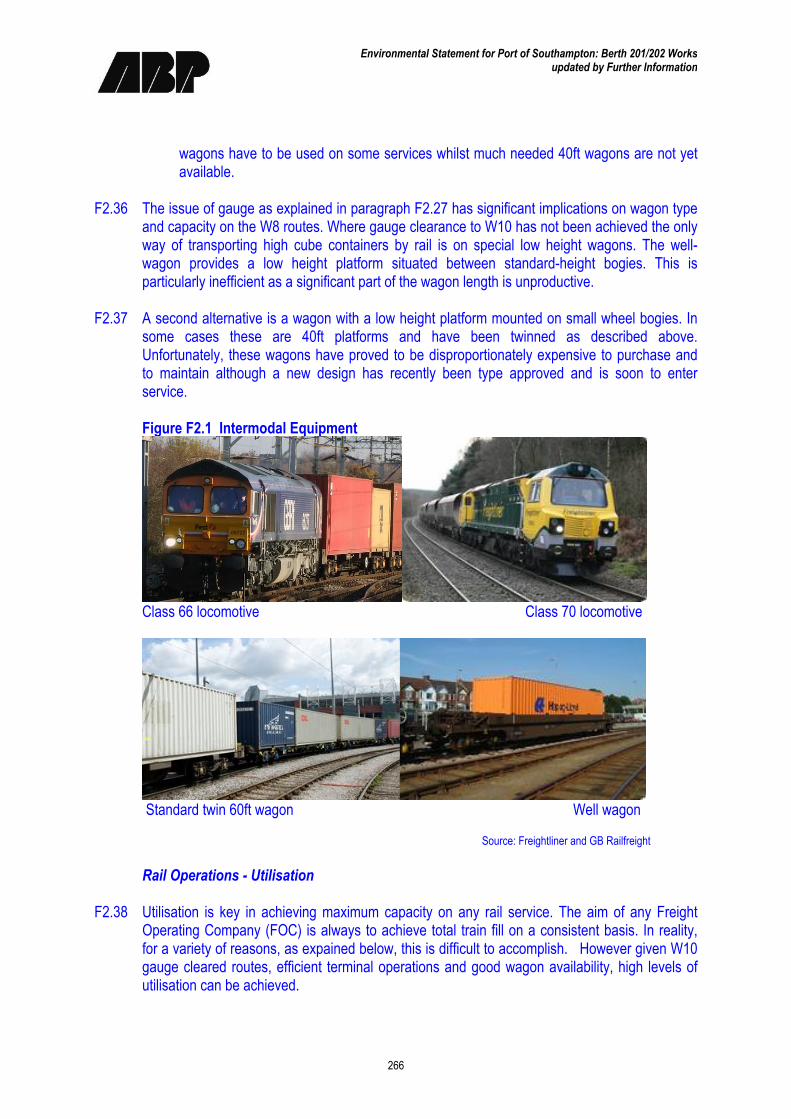
Figure F2.1 Intermodal Equipment
Class 66 locomotive Class 70 locomotive
Standard twin 60ft wagon Well wagon
Source: Freightliner and GB Railfreight
Rail Operations - Utilisation
F2.38 Utilisation is key in achieving maximum capacity on any rail service. The aim of any Freight
Operating Company (FOC) is always to achieve total train fill on a consistent basis. In reality, for a variety of reasons, as expained below, this is difficult to accomplish. However given W10 gauge cleared routes, efficient terminal operations and good wagon availability, high levels of utilisation can be achieved.

Environmental Statement for Port of Southampton: Berth 201/202 Works updated by Further Information
267
F2.39 Ideally, volumes per service would be consistent on a day-by-day and season-by-season basis. This, however, is not the case. When large deep-sea container services make, for example, their weekly port call a significant volume of containers to be moved by rail is immediately available. The availability of containers for rail movement will diminish as the week progresses and this may well reduce utilisation. In addition, deep sea container traffic from the Far East is also prone to seasonality. Peak periods are predictably in line with main British holidays although the slack periods at other times of year can impact on levels of utilisation.
Rail Operations - Train length F2.40 Train length is one of the most important issues in determining service capacity. Recognising
any limitations in path or terminal slot availability is essential to maximise train length to make best use of available path and slot capacity. The following are key factors in determining train length:
Network passing loops - Network Rail makes use of passing loops to allow freight trains
to pull off the main line to allow faster passenger services to pass. Passing loops must be long enough to accommodate longer freight trains. A dynamic loop is sufficiently long to allow this manoeuvre to take place without the need for the freight train to stop and is the most efficient option.
Terminal siding length - this should ideally match the length of trains thereby avoiding the need to “split trains”. Where splitting is necessary some reduction in operational efficiency is inevitable due to increased siding occupancy and extended terminal turn-round times. However, terminals are generally able to plan and organise their operations to accommodate longer services.
Equipment - as described in paragraph F2.35 train length can impact on locomotive choice. This is a manageable situation as is the case with increased wagon numbers for longer services.
The Current Situation F2.41 The preceding paragraphs have provided general background information relating to rail freight
operations. The following paragraphs provide detailed information on rail freight information specific to container operations at Southampton.
Volumes and Services F2.42 The total volume of containers handled by the container terminal at Southampton in 2010 was
1,539,000 TEU. The total volume of these containers moved by rail was 415,530 TEU which represented a 27% share to rail.
F2.43 Two FOCs operate rail services for container traffic from the Port of Southampton. In 2010 the
split in volume was as follows:
DB Schenker (UK) Ltd 59,000 containers Freightliner Ltd 230,000 containers

Environmental Statement for Port of Southampton: Berth 201/202 Works updated by Further Information
268
F2.44 The intermodal services currently operated by DB Schenker from the port are summarised in Table F2.1.
Table F2.1: Services currently operated by DB Schenker.
Destination Departure Time Departure Day Days per week Number of wagons
Trafford Park, Manchester 00.42 Tues - Sat 5 32
BIFT, Birmingham 09.32 Mon - Fri 5 30
Wakefield 16.10 Mon - Fri 5 30 incl lpw
Hams Hall, Birmingham 20.11 Mon - Thu & Sat 5 32
F2.45 DB Schenker therefore timetable a total of 4 daily round trip services all operating 5 days per
week. Many of the European type 45ft wagons currently used by DB Schenker are being replaced by standard 60ft wagons to maximise capacity. Low-platform wagons (lpw) must be used for hi-cube containers on the Wakefield service. All DB Schenker services are operated with Class 66 locomotives.
F2.46 The intermodal services currently operated by Freightliner from the port are summarised in
Table F2.2. Table F2.2: Services currently operated by Freightliner.
Destination Departure Time Departure Day Days per week Number of
wagons 19.01 Mon - Fri 5 26
00.01 Tues - Sun 6 26
Leeds
02.14 Mon - Fri 5 26 lpw
03.48 Mon - Fri 5 .24
12.55 Mon - Fri 5 24
17.02 Mon - Fri 5 24
Trafford Park, Manchester
20.34 Mon - Fri & Sun 6 24
08.58 Mon - Fri 5 24 Lawley Street, Birmingham
22.55 Mon - Fri 5 24
BIFT, Birmingham 14.55 Mon - Sat 6 30
Daventry, East Midlands 00.56 Tues - Sat 5 26
Garston, Liverpool 18.00 Mon - Fri 5 26
Ditton, Widnes 09.34 Mon - Fri 5 14
Coatbridge, Glasgow 09.34 Mon - Fri 5 14
Cardiff 03.00 Mon -Sat 6 26 lpw
F2.47 Freightliner therefore timetable a total of 15 daily round trip services with 11 of them operating 5
days per week and 4 operating 6 days per week. All services operate with standard 60ft wagons other than the use of lpw to Leeds and Cardiff. Between two and three, depending on
Environmental Statement for Port of Southampton: Berth 201/202 Works updated by Further Information
269
circumstances, Class 70 locomotives are deployed on the Southampton services whilst the remaining services are hauled by Class 66 locomotives.
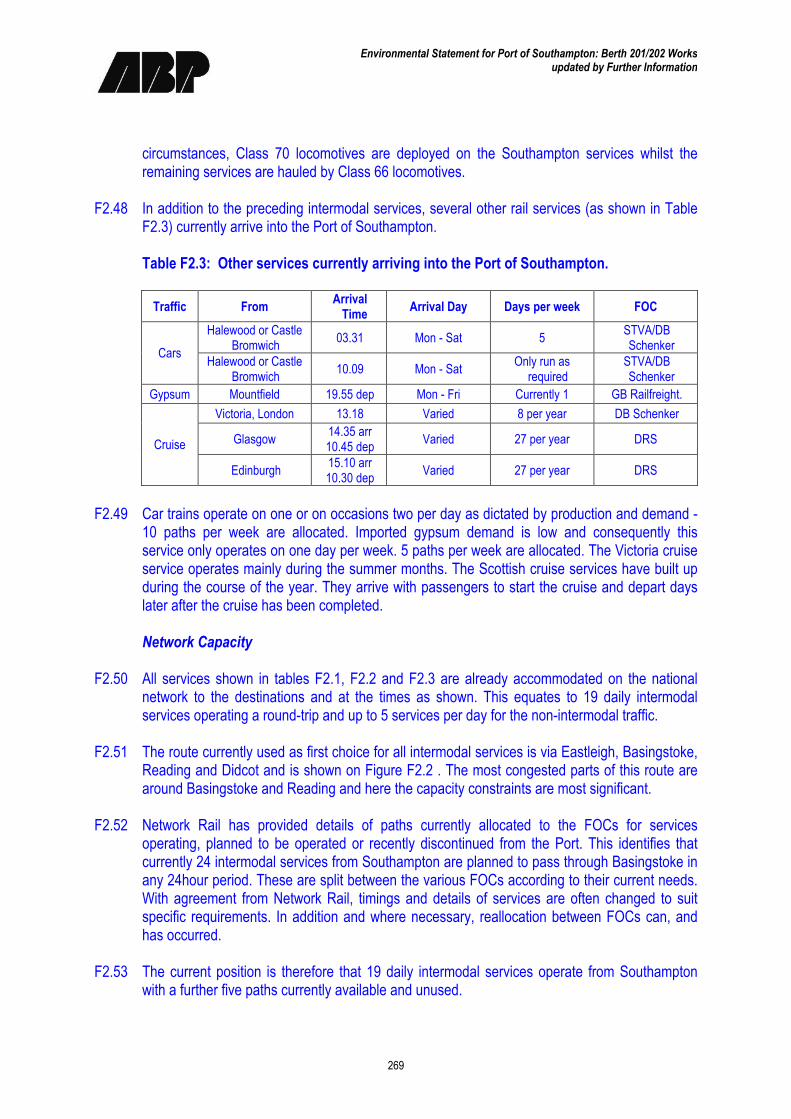
F2.48 In addition to the preceding intermodal services, several other rail services (as shown in Table
F2.3) currently arrive into the Port of Southampton. Table F2.3: Other services currently arriving into the Port of Southampton.
Traffic From Arrival Time Arrival Day Days per week FOC
Halewood or Castle Bromwich
03.31 Mon - Sat 5 STVA/DB Schenker
Cars Halewood or Castle
Bromwich 10.09 Mon - Sat
Only run as required
STVA/DB Schenker
Gypsum Mountfield 19.55 dep Mon - Fri Currently 1 GB Railfreight.
Victoria, London 13.18 Varied 8 per year DB Schenker
Glasgow 14.35 arr 10.45 dep
Varied 27 per year DRS Cruise
Edinburgh 15.10 arr 10.30 dep
Varied 27 per year DRS
F2.49 Car trains operate on one or on occasions two per day as dictated by production and demand -
10 paths per week are allocated. Imported gypsum demand is low and consequently this service only operates on one day per week. 5 paths per week are allocated. The Victoria cruise service operates mainly during the summer months. The Scottish cruise services have built up during the course of the year. They arrive with passengers to start the cruise and depart days later after the cruise has been completed.
Network Capacity F2.50 All services shown in tables F2.1, F2.2 and F2.3 are already accommodated on the national
network to the destinations and at the times as shown. This equates to 19 daily intermodal services operating a round-trip and up to 5 services per day for the non-intermodal traffic.
F2.51 The route currently used as first choice for all intermodal services is via Eastleigh, Basingstoke,
Reading and Didcot and is shown on Figure F2.2 . The most congested parts of this route are around Basingstoke and Reading and here the capacity constraints are most significant.
F2.52 Network Rail has provided details of paths currently allocated to the FOCs for services
operating, planned to be operated or recently discontinued from the Port. This identifies that currently 24 intermodal services from Southampton are planned to pass through Basingstoke in any 24hour period. These are split between the various FOCs according to their current needs. With agreement from Network Rail, timings and details of services are often changed to suit specific requirements. In addition and where necessary, reallocation between FOCs can, and has occurred.
F2.53 The current position is therefore that 19 daily intermodal services operate from Southampton
with a further five paths currently available and unused.

Environmental Statement for Port of Southampton: Berth 201/202 Works updated by Further Information
270
F2.54 In addition, it is important to note the work that has been undertaken to achieve gauge enhancement to W10 on the main route from Southampton. This is clearly illustrated on Figure F2.2. In April 2011 the main route from Southampton to the West Midlands was opened to W10 at a cost of approximately £62m. ABP along with other funding partners made a significant contribution to the cost of this project. Today 16 of the 19 services from the port can accommodate hi-cube containers on standard height wagons. It should be noted that W10 gauge is currently not available to the following destinations which are serviced daily from Southampton:
Wakefield Leeds Cardiff
Southampton Terminal Capacity F2.55 The movement of containers by rail at the Port of Southampton is undertaken at three terminals
within, or close to, the port estate. These are the Maritime Terminal, the Millbrook Terminal and the Herbert Walker Avenue Terminal. These are all discussed in turn in the following paragraphs.
Maritime Terminal F2.56 The Maritime Terminal is situated on the Southampton port estate adjacent to the Container
Terminal and is operated by Freightliner. It occupies a site of approximately 13.5 hectare (33 acre) and is accessed directly from the main line from Southampton to Bournemouth between Redbridge and Millbrook Stations.
F2.57 The rail infrastructure comprises an arrival and departure line with access in both easterly and
westerly directions. The adjoining maintenance depot offers reception sidings and the main terminal operating area provides 4 working sidings under the cranes, each of 480 metres. Two further working sidings of 280 metres are also available outside the crane reach. Wagon repair and stabling sidings are also available.
F2.58 Train loading is undertaken by two rail mounted gantry cranes operating across the longer
working sidings. These are supplemented by one reachstacker to provide additional capacity on the shorter sidings. The delivery of containers to and from the Container Terminal is provided by the terminal operator using “sprinter” straddle carriers which have dedicated access across the main dock road.
F2.59 The terminal currently handles 11 services per day with a further 4 services operating at
weekends. In terms of daily services the operator advises that this is close to the current terminal capacity. The handling of increased volumes on these services, partly resulting from the recent W10 gauge enhancement, is being achieved through better utilisation and train lengthening on certain routes. Terminal throughput in 2010 was 158,000 lifts.

Environmental Statement for Port of Southampton: Berth 201/202 Works updated by Further Information
271
Figure F2.2 W10 Network as at April 2011
Source: Network Rail

Environmental Statement for Port of Southampton: Berth 201/202 Works updated by Further Information
272
Millbrook Terminal F2.60 The Millbrook Terminal is situated to the north of Southampton port estate alongside Millbrook
Road and is operated by Freightliner. It occupies a site of approximately 3.5 hectare (8 acre) and is accessed directly from the main line from Southampton to Bournemouth to the east of Millbrook Station.
F2.61 The rail infrastructure comprises access in both easterly and westerly directions. There are
limited reception sidings and the main terminal operating area provides 3 working sidings each of 440 metres of which only 320 metres is accessible under the crane.
F2.62 Train loading is affected by two rail mounted gantry cranes operating across the working
sidings. The delivery of containers to and from the Container Terminal is provided by shunting tractors and trailers which access the site via Dock Gate 20 and the public highway.
F2.63 The terminal is currently handling 4 services per day. Similar to the Maritime Terminal the
operator advises that this is close to the current terminal capacity in terms of daily services. However, the handling of increased volumes on these services, partly resulting from the recent W10 gauge enhancement, is proving possible through better utilisation and train lengthening on certain routes. Terminal throughput in 2010 was 72,000 lifts.
Herbert Walker Avenue Terminal F2.64 This terminal is situated on the port estate to the east of the Container Terminal and is operated
by Pentalver on behalf of DB Schenker. It occupies a long narrow site of only 3.6 hectares (9 acres) but is adjacent to an approximate 6.4 hectare (16 acre) area within the Port estate used for container storage. It is accessed directly from the main line from Southampton to Bournemouth close to Millbrook Station.
F2.65 The rail infrastructure comprises an arrival and a departure line with access to the national
network only in a westerly direction. There are no direct reception sidings although the arrival and departure lines can provide stabling capacity for limited periods. The main terminal operating area provides 2 working sidings of almost 700 metres and a third runround line. Further lines on the adjacent site can be used for limited stabling.
F2.66 Train loading is undertaken by three sideloaders operating from the narrow terminal pad
constructed within and alongside the working sidings. The delivery of containers to and from this terminal is undertaken by a fleet of internal movement vehicles (IMVs) and trailers operating between the terminal and the adjacent container storage area. This area also provides a buffering facility as containers are collected from the Container Terminal and held in this area in readiness for timed delivery for train loading.
F2.67 The terminal is currently handling 4 services per day including some Saturday working. It has
the capacity to handle an increased number of daily services, although currently efforts are focused on increasing capacity through the use of more efficient wagons and also through a programme of train lengthening. In the past, up to 8 services per day have been operated from this facility with shorter trains and much lower levels of utilisation. The current view is that the

Environmental Statement for Port of Southampton: Berth 201/202 Works updated by Further Information
273
terminal is capable of servicing up to a maximum of 7 longer, well utilised trains per day. Terminal throughput in 2010 was 59,000 lifts.
Inland terminals F2.68 The following terminals, shown on Figure F2.2, are currently handling Southampton intermodal
services:
Freightliner Leeds (Leeds) Freightliner Trafford Park (Trafford Park, Manchester) Freightliner Birmingham (Lawley Street, Birmingham) Freightliner Garston (Garston, Liverpool) Freightliner Coatbridge (Coatbridge, Glasgow) Freightliner Cardiff (terminal not shown on Figure F2.2 but to the east of Cardiff) DB Schenker Wakefield (Wakefield) DB Schenker Trafford Park (Trafford Park, Manchester) ABP Hams Hall (Hams Hall, east of Birmingham) WH Malcolm Daventry (Daventry, south of Rugby) Roadways BIFT (Birch Coppice, east of Birmingham)
F2.69 The map at Figure F2.2 shows all the major intermodal terminals in England and Scotland. It
provides a clear illustration of how terminals are grouped and how alternate facilities are readily available. There are currently no known issues with inland terminal capacity and further capacity is also being planned, as further explained in paragraph F2.104.
Environmental Change without the Project Volumes and assumptions F2.70 As explained in Chapter 7 of this ES, the maximum capacity of the Container Terminal at
Southampton that is considered possible with the berth 201/202 works is 2.8m TEU (referred to as the Future Position with the Works scenario). Table F2.4 provides calculations of the projected rail volumes associated with throughput at the Container Terminal up to 2.8m TEU, which is predicted to occur in 2027/8.

Environmental Statement for Port of Southampton: Berth 201/202 Works updated by Further Information
274
Table F2.4 Projected Rail Volumes
Year TEU per annum
TEU to
cont-ainer ratio
Containers % to rail Containers
to rail
Av containers per train
round trip
Trains per
annum
Av trains per
week
Av working
days per
week
Trains per day
2011 1,600,000 1.66 963,855 33% 318,072 66 4,747 95 5.0 19
2012 1,656,000 1.67 991,617 34% 332,192 67 4,958 99 5.1 19
2013 1,713,960 1.68 1,020,214 34% 344,322 68 5,064 101 5.2 19
2014 1,773,949 1.69 1,049,674 34% 356,364 69 5,165 103 5.3 19
2015 1,836,037 1.70 1,080,022 35% 372,607 71 5,248 105 5.4 19
2016 1,900,298 1.72 1,104,824 35% 386,689 76 5,088 102 5.5 19
2017 1,966,809 1.73 1,136,884 35% 400,751 77 5,205 104 5.6 19
2018 2,035,647 1.74 1,169,912 36% 415,319 78 5,325 106 5.7 19
2019 2,106,894 1.75 1,203,940 36% 430,408 79 5,448 109 5.8 19
2020 2,180,636 1.75 1,246,078 36% 448,588 80 5,607 112 5.9 19
2021 2,256,958 1.75 1,289,690 37% 473,703 81 5,848 117 6.0 19
2022 2,335,952 1.75 1,334,829 38% 500,561 82 6,104 122 6.0 20
2023 2,417,710 1.75 1,381,548 39% 531,896 83 6,408 128 6.0 21
2024 2,502,330 1.75 1,429,903 40% 564,812 84 6,724 134 6.0 22
2025 2,589,911 1.75 1,479,949 40% 591,980 85 6,964 139 6.0 23
2026 2,680,558 1.75 1,531,748 40% 612,699 86 7,124 142 6.0 24
2027 2,774,378 1.75 1,585,359 40% 634,143 87 7,289 146 6.0 24
20281 2,800,000 1.75 1,600,000 40% 640,000 88 7,272 145 6.0 24 F2.71 A number of key assumptions have been made in compiling this table:
Container growth is based on the current growth forecasts of 3.5% per annum provided by the operator of the Container Terminal
TEU to container conversion for 2011 is 1.66:1. This increases on a gradual basis until 2019 when at 1.75:1 the conversion remains constant. The increase reflects the increased use of 40ft, especially high cube containers and the reduced proportion of 20ft containers.
% to rail is a variable figure beginning at 33% a reflection of current predicted 2011 levels and increasing year on year to 40% as a projected maximum. This is explained further in paragraphs F2.82 to F2.83.
Average containers per train, round trip is a key function of rail economics which is being pursued by all FOCs and Network Rail. The number initially reflects current levels and increases gradually until 2015 when network enhancements will increase the opportunity for train lengthening, see paragraph F2.77. In addition, through operational improvements it is expected that all FOCs will achieve higher levels of utilisation, see paragraph F2.73.
Average trains per week is based on the railfreight industry norm of 50 working weeks per annum.
1 A throughput of 2.8m TEU per annum is achieved at a point in time between 2027 and 2028

Environmental Statement for Port of Southampton: Berth 201/202 Works updated by Further Information
275
Average working days per week commences at 5 with a gradual increase to 6 by 2021. The justification for this assumption is explained in paragraph F2.78 below.
The resultant number of trains-per-day in 2028 is only a modest increase from 2011 as TEU growth and percentage to rail increases are balanced by the increase in containers per train and 6 day working.
F2.72 Significantly and based on the assumptions above, it is clear that the current 19 trains will be
capable of accommodating rail demand until 2021, and the available 5 paths will accommodate demand up to 2028.
Services Changes to existing services F2.73 There are three main developments that are expected to impact on existing services. The first
relates to utilisation. The principles of train utilisation have earlier been explained (paragraphs F2.38 to F2.39). Both FOCs operating from Southampton are already engaged in programmes to optimise wagon type to conform to the mix of traffic. Twinned and tripled 40ft wagons are being introduced to compensate for a proportional reduction in 20ft containers and resultant empty 20ft slots on 60ft wagons. The first batch of 200 x 40ft wagons is due for delivery to Freightliner in April 2012. In addition, the less efficient well-wagons and eurotwins are also being phased out.
F2.74 A good example of mixing wagon types to maximise utilisation is shown in Table F2.5. Table F2.5: Wagon type, train length and utilisation
Train option
60ft wagon (number)
Twin length (m)
40ft wagon (number)
Twin length (m)
Train length incl loco (m)
Utilisation %
Containers per train, round trip
1 24 40 0 27.8 501 73% 70
2 30 40 0 27.8 621 73% 88
3 18 40 16 27.8 603 90% 94 F2.75 The table shows with train option 1, how current services with 24 x 60ft wagons can, with a 73%
utilisation achieve 70 containers per train round trip. With train option 2, by increasing train length to 30 x 60ft wagons this increases to 88 containers. In option 3 by mixing wagon types, slightly reducing train length but increasing utilisation to 90%, containers per round trip increase to 94.
F2.76 FOCs are also working to reduce poor utilisation resulting from daily and seasonal volume
fluctuations. Poor utilisation is currently partly a result of overall reduced container volumes. However, it expected that growth in container volumes will, over time, increase from the current position and that utilisation of available space will increase.

Environmental Statement for Port of Southampton: Berth 201/202 Works updated by Further Information
276
F2.77 The second development that will impact on existing services is train lengthening. As described in paragraph F2.40 this is mainly a function of suitable infrastructure on the route and at terminals. Generally, terminals are able to operate with longer trains through a mix of splitting and shunting manoeuvres. On the main rail network the solution is less simple. This issue has been recognised by Network Rail and a significant programme of enhancements is already planned. This enhancement programme is further described in paragraphs F2.88 to F2.89. The impact of this programme of work is reflected in the step change in containers per train between 2015 and 2016 shown in Table F2.4.
F2.78 The third factor that will improve existing service levels will be the extension into regular 6 day
working. As can be seen from Table F2.2, Freightliner is already running some services 6 days per week. This maximises equipment utilisation as well as network capacity and is a clear objective of all FOCs. The industry has now formed a “Joint Network Availability Plan” (JNAP) which charts a plan to migrate towards greater network opening hours for freight over the medium to long term. This will be achieved through;
Improved engineering processes which will shorten line closures. Better planning processes to ensure that diversionary routes are made available. Enhancement of diversionary routes – in particular their gauge to match the capability of
the primary route. F2.79 Network Rail has recognised that freight has a growing need for 6 (and 7) day access and has
committed to deliver improvements that achieve this through its leadership of the industry JNAP process. It is therefore considered realistic to assume that over time the average number of working days per week will increase to 6.
F2.80 The significance of these three points is reflected in Table F2.4. The average number of
containers per round trip is a function of longer and better filled trains. Similarly, by operating for 6 rather than 5 days per week, growth and demand can be regulated and path requirements controlled. The net effect is that despite a growth in container throughput of 3.5% per annum and an increase in the percentage of traffic to rail, the increase in the number of daily services required will be relatively low.
New services F2.81 Despite the efficiency changes detailed above it is inevitable that, over time, there will be the
need to increase the number of rail services operating from the port, see Table F2.4. Indications from the FOCs reveal that the introduction of new routes looks unlikely and new services will augment some of the routes that are currently operated.
F2.82 To reach the level of 24 daily services only a further 5 services are required. As previously
explained paths to accommodate these extra services are available. The following are considered the most likely routes from which additional services could be chosen by each of the FOCs:
Freightliner – Leeds, Trafford Park, Midlands, North West . DB Schenker – Wakefield, Trafford Park, Scotland.

Environmental Statement for Port of Southampton: Berth 201/202 Works updated by Further Information
277
Percentage to rail F2.83 A further factor to be recognised is the overall percentage of containers handled by the
container terminal being carried by rail. Table F2.4 predicts the percentage to rail will gradually increase from current levels of 33% to a maximum of 40% by 2024. This growth is an established trend and reflects the increase in service quality now being provided by the railfreight industry through infrastructure and operational improvements and the policy support encouraging modal shift from road to rail.
F2.84 It could be argued that this percentage may increase beyond 40%, however when taking into
account some of the key geographical features that influence the rail share from Southampton it is not expected that this percentage will be exceeded within the period being considered. Such factors include:
Economically viable rail distance for rail services from Southampton is unlikely to be
reduced below 100 miles. The competitiveness of road transport will in general be maintained. Road will continue to offer greater levels of flexibility than can normally be offered by rail. Most of the large volumes of traffic to the London area are unlikely to switch to rail.
F2.85 It should be noted that an increase in percentage to rail does not necessarily reflect an increase
in overall container volumes through the ports, in fact the opposite is often true. When rail services are contracted on a term basis to a container line, the line takes the risk to fill the train. Therefore if the line’s overall volumes were to decrease, they still have the incentive to fill the train in order to utilise the fixed cost of their contracted rail service. The result is that the line is likely to consequently reduce its use of road transport, and correspondingly the percentage to rail will increase.
Network Capacity F2.86 Through their “Strategic Freight Network” programme Network Rail are seeking to significantly
develop intermodal freight capacity and capability throughout the country. Despite the general reduction in public expenditure, the planned enhancements identified for the period 2009 to 2014 (known by Network Rail as their Control Period 4 (2009 - 2014)) received Government support in the recent Comprehensive Spending Review. Beyond 2014 and into the next Control Period (CP5 (2014 – 2019)) the situation is still to be determined, but Network Rail is engaged with industry partners to prioritise their wishes for further freight enhancements during the next control period.
F2.87 The current “Strategic Freight Network” programme focuses on three main areas of
enhancement. The first area is in respect of operating longer trains on all the main routes. This involves the lengthening of passing loops to accept trains of up to 665 metres by 2014 and 775 metres by 2019. The second area relates to specific major infrastructure enhancements and the third area is to continue gauge enhancement to W10 on the remaining routes to the main destinations.
F2.88 In respect of the first area of enhancement (operating longer trains), works to accommodate
train lengthening to 665 metres by March 2014 will include extension loops with an anticipated

Environmental Statement for Port of Southampton: Berth 201/202 Works updated by Further Information
278
final cost (AFC) of £45m, have been approved in the following locations of relevance to Southampton:
Southampton Maritime Southampton Western Dock Eastleigh up loop Waller’s Ash up loop Oxford to Wolvercot down loop Dorridge down loop Washwood Heath down goods
F2.89 In addition, train lengthening to 775m is planned for 2015 after completion of the Reading area
remodelling work and the Oxford resignalling work, which is further discussed in paragraphs F2.90 and F2.91. This additional train lengthening is subject to approval in CP 5 for Strategic Freight Network funding and includes loops at:
Fenny Compton Hatton Waller’s Ash down loop
F2.90 In respect of the second area of enhancements (specific infrastructure enhancements), there
are certain major improvements to the network which are approved and progressing. Most significant is the complete Reading area remodelling scheme with a cost of £850m. This involves upgrading the station, building a viaduct, constructing new bridges and embankments, making some significant alterations to track layout, renewing signalling and building a train depot. The completion of grade separation at Reading West will significantly improve freight capacity. Completion is planned for 2015.
F2.91 In addition, the Oxford area resignalling scheme, planned to complete in 2015, will close
headways between Oxford and Heyford. Furthermore, the Banbury area resignalling scheme, planned to complete a year later, will close the headways between Heyford and Banbury.
F2.92 Gauge enhancement is the third area in which significant enhancements are planned. As
already described, the core route from Southampton to the West Midlands completed its W10 gauge enhancement in April 2011. It was always recognised that further robustness to the network was required from Southampton and plans are already progressing to provide a W10 diversionary route via Laverstock (near Salisbury) to Basingstoke.
F2.93 The gauge enhancement on the Laverstock diversionary route is scheduled to be completed in
April 2013 at a cost of £34m. This route avoids Southampton station and tunnel, providing capacity at weekends when maintenance is being undertaken and accommodating an extra 6 high cube trains per night.
F2.94 Further from Southampton, although relevant to some of Southampton’s daily services, is
gauge enhancement to W10 to terminals at Leeds, Wakefield, Doncaster, Burton-on-Trent and Castle Donnington, via Water Orton. This work is also under way with a cost of £31m and is programmed to be completed by April 2014.

Environmental Statement for Port of Southampton: Berth 201/202 Works updated by Further Information
279
F2.95 Full details of all the committed gauge enhancement schemes are shown on the map at Figure F2.3
F2.96 All of these various enhancements listed above will increase capacity on routes from
Southampton. Major infrastructure improvements on the network, particularly at Reading will improve pathing options for freight, improve journey times and thereby increase overall capacity. Significantly, wherever W10 gauge becomes available, the removal of low-platform wagons could increase train capacity on some services by up to 20%.
Southampton Terminal Capacity Maritime Terminal F2.97 The operator of this terminal recognises that there are current capacity constraints at this
facility, which stem from the craneage and layout of the site area, and has identified a series of improvements which are to take place.
F2.98 Investment in new craneage is proposed, and this will have the greatest impact on the capacity
of the terminal. The operator is proposing to replace the current cranes with three new rail mounted gantry cranes capable of operating at 29 lifts per hour (lph) as compared with the current 16 lph (an 81% increase in productivity). In addition to new cranes the operator is also seeking to undertake improvements to the site layout and introduce additional track and working sidings.
F2.99 In total, a budget of £9m has been approved for the recraneage and infrastructure
improvements at the terminal. Overall capacity is expected to increase to 470,000 lifts per annum with 3 cranes.
Millbrook Terminal F2.100 There are no plans to further develop the Millbrook Terminal due to the restrictions of the site.
The long term requirement may involve the replacement of the existing 2 cranes at some stage in the future.
F2.101 Overall the plan for the Millbrook Terminal is to continue the current operation, as required and
with an annual throughput of around 72,000 lifts per annum. Possible longer term crane replacement would not significantly increase capacity.

Environmental Statement for Port of Southampton: Berth 201/202 Works updated by Further Information
280
Figure F2.3: W10 Network as at April 2014
Source: Network Rail
Environmental Statement for Port of Southampton: Berth 201/202 Works updated by Further Information
281
Herbert Walker Avenue Terminal Developments F2.102 The Herbert Walker Avenue Terminal, will maintain its current mode of operation with the
benefit of longer and better utilised trains. It is considered that the terminal will be able to service a maximum of 7 trains per day, that would result in the movement of around 100,000 containers per annum.
Inland terminals F2.103 As has already been demonstrated a number of inland rail freight terminals are currently
available. As summarised below several of these terminals are currently undergoing capacity improvements and several are seeking consent for development through the planning process or are soon to commence construction.
Castle Donnington (planning approved) DIRFT 3 (planning application) Rossington (planning approved) Port Salford (planning approved) Trafford Park x 2 (DB Schenker re-opened and Freightliner improvements being
undertaken) Lawley Street (improvements being undertaken) Widnes (improvements being undertaken)
F2.104 All of the above except DIRFT 3 (which has recently been subject to an application for planning
permission) have either received development consent or can develop within existing permitted powers.
Impact Identification and Assessment F2.105 The capacity of the Container Terminal at Southampton as a result of the project is considered
to be 2.8m TEU. Based on forecast growth of 3.5% per annum, this capacity is expected to be reached around 2028. In considering the impact of this growth on rail resources for inland movement of containers by rail the key issues revolve around container volume and required train paths.
F2.106 In assessing the impacts on rail resources the rail growth considered likely to occur in the future
takes account of the predicted growth in container trade at the Container Terminal of 3.5% per annum and a gradual increase in the percentage of movements being undertaken by rail mode increasing from a current level of 33% to 40% in 2024. This results in the number of containers to rail growing progressively from 318,000 containers in 2011 to 640,000 by 2028.
F2.107 In considering the potential impacts of this increase in respect of the number of trains required,
the assessment has demonstrated that the FOCs are, and will continue to, put in place measures to improve the use that is made of each train in transporting containers.
F2.108 Table F2.4 demonstrates that a growth in containers to rail from 318,000 to 640,000 would
result in an increase from 19 train paths per day (2011) to 24 paths per day (2028). Table F2.4

Environmental Statement for Port of Southampton: Berth 201/202 Works updated by Further Information
282
and the text which follows the table explains that this is achieved through the following three main realistic operational efficiencies which the industry is currently progressing with:
Train lengthening, by increasing from an average of 24 wagons per train to 30 wagons
per train. Improved utilisation, through the use of more space efficient wagons and a better match
of wagon lengths to suit the mix of 20ft and 40ft containers. Increasing all services to operate 6 days per week rather than the current 5 days per
week. F2.109 These efficiency measures are fully supported by Network Rail and the FOCs as such
efficiencies reflect current railfreight policy of maximising existing resources and minimising the need for major capital expenditure.
F2.110 Having identified the number of trains that would be required to serve the rail freight
requirements of the project the assessment has gone on to consider whether this would generate any significant impacts on rail resources, which have been broken down into consideration of network capacity, local rail freight terminal capacity and wider inland rail freight terminal capacity.
Network Capacity F2.111 The position in respect of network capacity can be summarised as;
Currently, network capacity accommodates 19 intermodal services operating from the Port of Southampton. A further 5 paths are also available but currently unused.
Committed investment in passing loops improvements to allow the deployment of longer trains, which will be completed by 2015.
The improvement of the Laverstock diversionary route to W10 gauge will be completed by 2014.
The major remodelling scheme at Reading will be completed by 2015. Further gauge enhancements to W10 are expected to be completed by 2014 such that
high cube containers will be able to be carried to all inland destinations served by the Port on standard wagons, with the exception of Cardiff.
F2.112 As previously indicated, these improvements referred to above are already at different stages of
being delivered. The assessment concludes that as a result of the gradual increase in path requirements to the known inland destinations that is predicted to occur from Southampton over time and the above infrastructure commitments that are already programmed and in the process of being delivered, the necessary network capacity can reasonably be expected to be available to accommodate the pathing requirements that would be generated.
F2.113 The magnitude of the impact in terms of the number of additional trains operating on the
network as a result of the project, taking all of the above into account, is considered to be negligible. The overall impact of the project in respect of the capacity of the rail network is therefore considered to be insignificant.

Environmental Statement for Port of Southampton: Berth 201/202 Works updated by Further Information
283
Southampton Rail Terminal Capacity F2.114 The position in respect of rail terminal capacity at Southampton can be summarised as follows.
The Maritime Terminal currently operates up to 11 services per day. Increased train length and better utilisation (measures which are being taken forward by the FOCs) and the investment in new cranes and improved infrastructure will provide additional capacity such that 470,000 containers will be able to be handled per annum.
The Millbrook Terminal currently operates up to 4 services per day. As with the Maritime Terminal, measures being taken to lengthen trains and improve utilisation will provide some additional capacity such that 72,000 containers will be able to be handled per annum.
At the Herbert Walker Avenue Terminal an increase from 4 to 7 trains per day is forecast as well as increasing train length and better utilisation, such that 100,000 containers will be able to be handled per annum.
F2.115 Overall the current capacity at the rail terminals at Southampton is sufficient to accommodate a
volume of 340,000 containers per year handled by rail. With the various future changes described above, the overall capacity provided by the three existing rail terminals at Southampton will be capable of handling the projected levels of 640,000 containers on 24 services by 2027/8.
F2.116 The overall impact of the project in respect of the capacity of the Southampton rail freight
terminals is therefore considered to be insignificant. The assessment has demonstrated that the number of containers to rail predicted to be generated as a result of the berth 201/202 works can be accommodated by the capacity that will be available at the existing rail terminals at Southampton.
Inland Terminal Capacity F2.117 In considering the impacts of the project on inland terminal capacity it is clear that projected
growth over a 16 year period, on the specified routes, will be able to be accommodated at existing, extended and new terminals that will be available. In total 20 terminals are available in the areas of the 11 destinations served from Southampton.
F2.118 Overall and recognising the numerous developments that are taking place to develop efficient
and cost effective solutions for the carriage of railfreight from the Port of Southampton it is concluded that the timely growth in demand for rail services generated by container operations at the Port can be met by the inland intermodal rail terminal capacity that will be available.
F2.119 Essentially, adequate inland terminal capacity, with a growing portfolio of options is available
throughout the UK for services from Southampton. F2.120 The magnitude of the impact in terms of the number of additional trains operating to a wide
choice of inland terminals as a result of the project and taking all of the above into account, is considered to be negligible. The overall impact of the project in respect of the total capacity of inland intermodal rail terminals is therefore considered to be insignificant.

Environmental Statement for Port of Southampton: Berth 201/202 Works updated by Further Information
284
Conclusion F2.121 Although port container volumes are forecast to increase year on year and the percentage of
traffic being carried by rail is also forecast to increase, the capacity of rail resources at the Southampton rail terminals, on the national rail network and at the inland terminals have been demonstrated to be sufficient to accommodate the rail requirements generated as a result of the berth 201/202 works.