f TKj (' I.. - apps.dtic.mil · f TKj (' I.. LA DOT/FAA/DS-S8/11 TERMINAL CONTROL AREA Advanced...
34
LA f TKj (' I.. DOT/FAA/DS-S8/11 TERMINAL CONTROL AREA Advanced System Design DESIGN AND AIR TRAFFIC Servic. LOADINGS Washington, D.C. 20591 oThomas H. Higgins Ln g Advanced System Design Service Federal Aviation Administration IWashington, D.C. 20591 August 1988 0 Final Report This document is available to the public J through the National Technical Information Service, Springfield, Virginia 22161 S OCT 1 1 1988 j US. Depjf i ii ent of Transportation Federal Aviation Administration 88 1012 00o :OS p ~ .I.., * . . . . . *P j~ d ~r'*~. *.,~.* . * -' A I I*t, N~v
Transcript of f TKj (' I.. - apps.dtic.mil · f TKj (' I.. LA DOT/FAA/DS-S8/11 TERMINAL CONTROL AREA Advanced...

LA
f TKj (' I..
DOT/FAA/DS-S8/11 TERMINAL CONTROL AREAAdvanced System Design DESIGN AND AIR TRAFFICServic. LOADINGSWashington, D.C. 20591
oThomas H. HigginsLn g
Advanced System Design ServiceFederal Aviation Administration
IWashington, D.C. 20591
August 1988 0
Final Report
This document is available to the public Jthrough the National Technical InformationService, Springfield, Virginia 22161
S OCT 1 1 1988 j
US. Depjf i ii ent of TransportationFederal Aviation Administration
88 1012 00o :OSp ~ .I.., * . . . . .*P j~ d ~r'*~. *.,~.* . * -' A
I I*t, N~ v

NOTICE
This document is disseminated in the interest of information
exchange. The United States Government assumes no liability for
the contents or use thereof.
A N111;N

Technical keport Documentation Page
1. Report No. 2. Government Accession No. 3. Recipient's Catalog No.
DOT/FAAIDS-88 /11
4. Title and Subtitle 5. Report Date
Terminal Control Area Design and Air Traffic Loadings a. August 15, 19886.Performing Organization Code
8. Performing Organization Report No.
7. Author's)
Thomas H. Higgins9. Perf.orming Organization Name and Address 10. Work Unit No. (TRAIS)
Requirements and CNS Concepts Branch, ADS-IO _7
Federal Aviation Administration 11. Contract or Grant No.
800 Independence Avenue, SW.Washington, DC 20591 13. Type of Report and Period Covered
12. Sponsoring Agency Name and Address
Same14. Sponsoring Agency Code
15. Supplementary Notes
16. Abstract
' The response probability density function (pdf) technique adapted here uses the pdf's
of the variables governing both the air traffic loadings of stress and the terminalairspace design configurations sensitivity or strengths. This technique is proposedas a method which may be used to predict the relative level of safety and collisionrisk for TCA design configurations and air traffic loadings. For the first time,a strong relationship was found between near midair collision reports and midaircollisions for annual operations within the fifty states. Operations, airports andairspace area were found to relate to these criteria of safety and provide usefulinteractive predictor equations. [1._ .,
/
17. Key Words 18. Distribution Statement
A 1 system design criteria, near midair This document is available to the public
collision reports, midaiL collisions, through the National Technical Informationoperations, aiiports, airspace area,. Service, Springfield, Virginia 22161system response mode . a.i. r"I '1iC , (1, .,
19. Security Classif. (of this report) 20. Security Classif. (of this page) 21. No. of Pages 22. Pr...
Unclassified Unclassified 31
Form DOT F 1700.7 (8-72) Reproduction of completed page authorized
A'. e.,t : - ' "I

Application of the response probability density function technique to D
predicting the level of safety and collision risk for terminal control
area (TCA) design and air traffic loadings
Thomas H. Higgins
Federal Aviation Administration
Washington, D.C. 20591
Summary
The response probability density function (pdf) technique adapted here
from reference number 1,2 uses the pdf's of the variables governing both
the air traffic loadings or stress and the terminal airspace design
configuraLions sensitivity or strengths. This technique is proposed as a
method which may be used to predict the relative level of safety and
collision risk for TCA design configurations and air traffic loadings. For
the first time, a strong relationship was found between near midair
collision reports and midair collisions for annual operations within the
fifty states. Operations, airport and airspace area were found to relate
to these criteria of safety and provide useful interactive predictor
equations of the actual near midair collision reports and midair collision
occuring annually within the fifty states.
•I

Introduction
The safe and effective performance of many systems is predicated on the
ability of the designer to predict the useful load range in which the
systems material characteristics and geometry affect the sensitivity or
strengths of the system. To determine the range of applicability, a factor
of safety is usually introduced.
This factor of safety is employed to account for the unknown or random
elements which can affect the ability of the systems material
characteristics and geometry to withstand its expected loads. Examination
of real-life, real-time systems shows that both the stresses to which the
systems material characteristics are subjected and their inherent strength
to withstand them are random variables, often with large variances.
So the effective factor of safety N e the strength s divided by
the stress e for any given system examined is also a random variable.
AThus, the proper design question is "What is the probability that a load
having a certain statistical variation will cause a material having
strength that varies in another statistical manner to fail?"
'I
In order to answer this question, one must determine the statistical
properties of both the applied loads and the strengths of the materials
themselves. In particular, if the loadings and the material properties
2
P, F A - .- -

give rise to an effective factor of safety with a lognormal pdf (log has a
normal pdf), then the probability of failure can be easily determined. The
present analysis extends the general response technique to the TCA
viewed as a system whereby the air traffic (system loads) and the TCA
design (system strength) each are the product of several factors. This
response pdf technique is then applied to determine the relative TCA
collision risk probability and level of safety for alternative TCA designs
and traffic loads.
S
Accession For
I..
Acc tt essi ,on FoNTI'3 GRA&I ..
*D71C TAB
Elr0
*~~~~~ ~~~ ALJ ~ *_________
___S.'
'K D 1 s.t
3it~m~n _-

1. Application of the response pdf Technique to the TCA viewed as a
Response System in order to predict the level of safety and collision risk
for various TCA designs and traffic loadings.
Consider the TCA system to have a certain strength or sensitivity (s)
and a given excitation or load (e). The response (R) of the system is
of the form
R = s/e (1)
with s and e statistically independent of one another. In the
preliminary example which follows, the sensitivity or strength s
represents the TCA design variable of area, the excitation or load e is
the number of operations variable, and the response R is an effective
factor of safety of the TCA system. Let the sensitivity s of the TCA
system be the product of n statistically independent
factors Sj, i=1,2...,n. Similarly, assume that the excitation of the TCA
system e is the product of m statistically independent factors
ei,i=1,2...,m. The goal of future R and D work is to test and verify
that the strength and stress in the TCA collision risk/safety system can
0both be expressed as products of this form. Thus,
m (2)
e=;l e5,jol
s=I si. (3)J01
4

The TCA system response function or the effective level of safety N e
therefore, is
R= IIS . (4)
Taking the logarithm of Eq. 4 yields
logo R a lOg10 o s - log1 , ej. (5)
If it can be shown to a reasonably good approximation that the logarithm of
each random variable ei similar to the number of operations in the TCA -
per unit of time and a. similar to the area of the TCA is normally
distributed, then the pdf of the response is lognormal. With statistical
independence of the random variables, R will tend to be lognormal from
the central limit theorem with (m+n) moderately large. For the case of
small (m+n) demonstrated here, however, it is necessary to check the pdf of -
each factor.
5
I*V

p.x .W WZ
TI'e eypected (mean) value E of the logarithm of the TCA system response
R, or its effective level of safety N eis simply
Re
E {log10R} D E 10g 10 s, S - E Ioglo e1 (6)
and the total TCA system variance (Var) is
Var flog10R) u Var flogloei I + LDVar f1ogj sj. (7)
To find the resulting probability for the normal pdf of the
log O0R, the normalized Gaussian variable z with unit varian~ce is
introduced:
z=E{og 10R} /[Var (1og 10AR )j"(8
If R is considered to be the effective factor of safety N then when
log 10 R - 0, the TCA system load, e is equal to the TCA systems design
strength's. Hence, negative values of N correspond to instances when
e
the effective factor of safety is less than one (see Fig. 1). .6
- i1~ ,~VN

AREA 3E?3ZSENING Area representing probabilityFROBSILIY OFassociated with havins collision free
defined IrCA Operations.collis ionrisk
FIG. 1. Area repreeotLoa probabilily of collision free TCA operations and associatedlevel of defi',4 collision risk.
Consequently, the area to the left of zero is the probability that the TCA
load (for example, the number of operations/time plus, other to be
determined load variables in the TCA) has exceeded the TCA systems design
configuration strength (for example the TCA area + other to be determined
strength variables of the TCA) and that overload or failure of some type,
such as a defined risk of collision (one or more NMAC reports/time), has
occurred.
This proposed technique will be used in future TCA analytic Research and
Development, R&D studies to determine the effective level of safety
associated with various terminal air traffic loads and alternative TCA
design configurations.
7
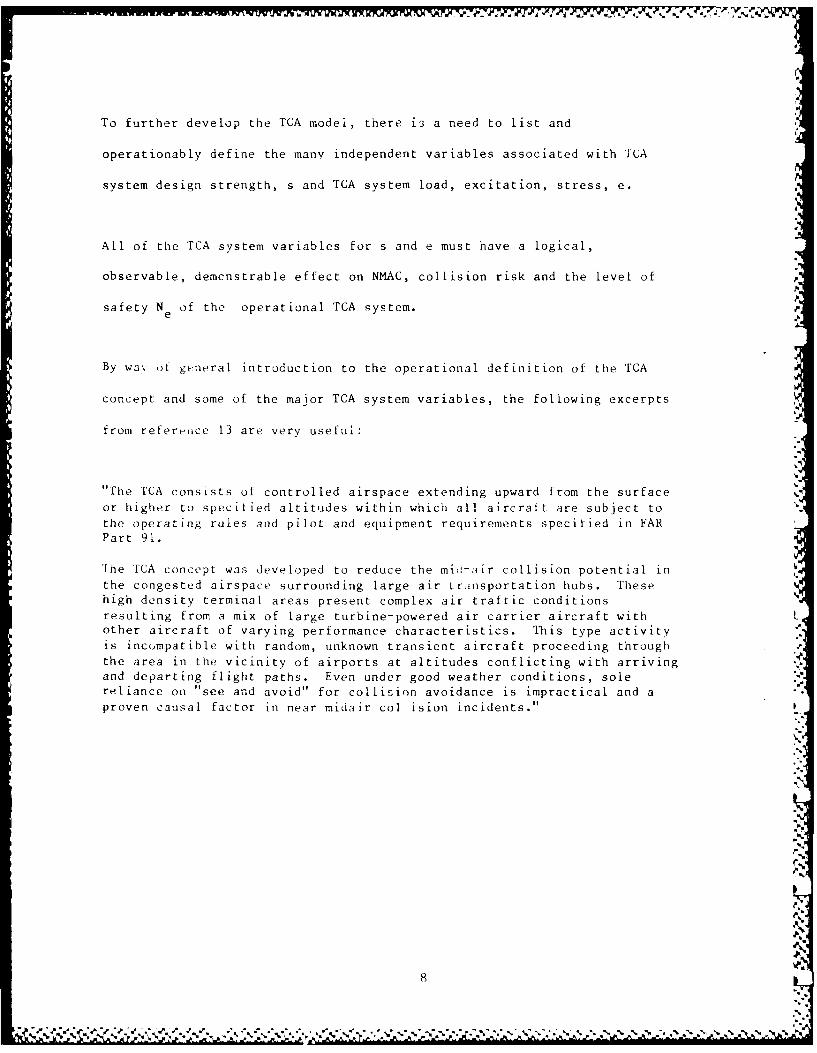
To further develop the TCA model, there is a need to list and
operationably define the many independent variables associated with TICA
system design strength, s and TCA system load, excitation, stress, e.
All of the TCA system variables for s and e must have a logical,
observable, demenstrable effect on NMAC, collision risk and the level of
safety N of the operational TCA system.e
By wav% of general introduction to the operational definition of the TCA
concept and some of the major TCA system variables, the following excerpts
from refereace 13 are very usefui:
"The [CA consists of controlled airspace extending upward from the surfaceor higher to specified altitudes within which all aircraft are subject tothe operating rules and pilot and equipment requirements specified in FARPart 91.
Ihe TCA concept was developed to reduce the mid-air collision potential inthe congested airspace surrounding large air Lransportation hubs. Thesehigh density terminal areas present complex air traftic conditions
resulting from a mix of large turbine-powered air carrier aircraft withother aircraft of varying performance characteristics. This type activityis incompatible with random, unknown transient aircraft proceeding throughthe area in the vicinity of airports at altitudes conflicting with arrivingand departing flight paths. Even under good weather conditions, solereliance on "see and avoid" for collision avoidance is impractical and aproven causal factor in near midair col ision incidents."
k4- I

"The risk of a midair collision in a given segment of airspace is directly
related to the number of aircraft therein, and of those aircraft to theproportion that are relying solely upon seeing and avoiding other aircraft, as
well as to the weather conditions, the operating characteristics of theaircraft, the dispersal of aircraft within the given airspace, and whether theaircraft are climbing, descending, or in level flight.
The regulatory requirements of TCA airspace afford the greatest protection forthe greatest number of people by providing ATC with an increased capability toprovide aircraft separation service within the airspace, thereby, minimizing
the hazardous mix of controlled and uncontrolled aircraft. The criteria forconsidering a given terminal area as a TCA candidate is based on factors, orcombinations of factors, that include the number of people and aircraft in the
airspace, the area's potential for midair collision because of trafficdensity, and the type or nature of operations being conducted. Accordingly,guidelines have been established to identify TCA locations based on two basic
elements--the number of enplaned passengers and the number of aircraftoperations.
Safety factors, traffic counts, complexity, and projected growth shall betaken into consideration when evaluating a site for TCA actions. Thefollowing criteria are applicable for a site to be considered as a new TCAcandidate or for upgrading to a Group I TCA.
a. Group 1:
(1) 3,500,000 annual enplaned passengers from terminal area hub
(satellite and primary airports).
(2) 300,000 annual instrument operations at the primary airport of -
which 60 percent must be air carrier.
b. Group II:
(1) 650,000 annual enplaned passengers from terminal area hub.
(2) 150,000 annual instrument operations at the primary airport.
(Note: Passengers and operations should include commuter, air taxi, and
intra-state air carrier categories).i%
Regarding the configuration of a TCA: %
a. General Design. Simplification of the TCA airspace configuration isa prime requisite. Vertical and lateral limits should be standardized and, to %the extent practicable, be designed to retain all published instrumentprocedures once their flight track enters the TCA. The number of subareasshall be kept to a minimum."
,I.
,
9
%Si

" b. Lateral Limits. TCA airspace should initially be designed as acircular configuration centered on the primary airport, preferably at theVORTAC site if located on the primary airport. However, analysis of the
terminal area operations may necessitate tailoring the airspace in a different
manner depending upon the operational needs at the primary airport and theunderlying satellite airports. The outer limits of the TCA should be
predicated on a 300-foot per nautical mile climb and normally extend toapproximately 20-25 NM from the primary airport. However, the outer limitsmust be determined by individual site operational, safety, and airspacerequirements. Wherever possible, VHF Omnidirectional Range radials anddistance measuring equipment arcs shall be used to define the boundaries of aTCA and its subareas. It is important, however, that prominent visuallandmarks also be considered as aids to the VFR traffic desiring to remain
clear of the area.
c. Vertical Limits. The ceiling of the TCA should be designated as lowas possible depending on safety. The center of the TCA or that portion of thearea covering the primary airport is normally designated to include altitudesfrom the surface to the ceiling. A 5 to 7 NM radius area for this purpose isgenerally sufficient. Beyond the designated TCA core, the floor is raised byadditional designated areas as dictated by operational considerationsincluding requirements for satellite airports within the overall planned TCA.
Normally, the controlling factor in determining TCA floors is the rate ofclimb capability of departing aircraft. This capability varies widely betweendifferent types of aircraft under various conditions. Therefore,consideration should be given to the lower performance turbine-poweredaircraft operating under adverse conditions. For planning purposes, the base
*of the TCA should be designed for the lowest climb rate of the turbojetaircraft that operate from the airport, normally, a 300-foot per NM rate ofclimb should be used.
d. VFR Corridors. The establishment of VFR corridors through the TCAis site sensitive in that their appropriateness depends on the operationalrequirements of individual locations. Generally, VFR corridors are believedto be only an alternative for access through TCA's n support of the generalpremise of the public's right to freedom of transit through the airspace. VFRoperations over/around a TCA may be more palatable to the VFR user than beingconfined to a tunnel with less flexibility to maneuver. Frugal planning, suchas simplicity of TCA design and designation of only essential airspace, shouldminimize any operational need for VFR corridors.
10 0

e. Satellite Airports. When establishing a TCA floor, consider theadverse effect on satellite airport operations as well as operations at theprimary airport. When airspace directly over a satellite airport is notrequired, appropriate airspace surrounding the airport should be excluded fromthe TCA. Special published traffic patterns and/or procedures may be requiredfrom the satellite airport.
Air Traffic has the responsibility to coordinate all efforts concerning
implementation of the TCA program.
a. Regional Directors prepare all documents and provide staff studies foreach location to determine justification for either withdrawing or proceeding
with a notice of proposed rule making, NPRM. This applies to new TCA sitesand modifications to existing TCA sites. This responsibility includescompletion of all companion actions associated with the proposed site; i.e.,
studies, reports, analyses, etc.
b. To ensure that all regions apply a uniform approach to arrive at
individual conclusions, a staff study which results in a conclusion to proceedor withdraw the location from further consideration shall be completed foreach TCA proposal. Among other things, the staff study should contain:
(1) A description of the terminal area being studied including:
(a) VFR traffic flow in and through the area.
(b) IFR traffic flow in the affected en route structure includi,
transition routes.
(c) IFR traffic flows in conjuction with runway
configurations/SlAP's, SID's, STAR's and preferential arrivaland departure routes.
(d) Names of airports and numbers and types of operations for each.
CL) General description of area traffic operations.
(2) Complete analysis of options and issues, such as:
(a) Lowest feasible top altitude that TCA operations can be safely
conducted based on traffic flow, airport, and navigation aid locations.
(b) Major proposals submitted by user groups and an analysis of each.
(c) TRSA versus TCA, advantages and disadvantages of both.
(d) Near midair collisions analysis."
.9
.1
1 1

it (e) Impact on air traffic and air navigation facilities (new or
modified control positions required, if any, and new or relocation ofnavigational aids including communication equipment).
(f) Withdrawal of the TCA proposal versus implementation. Candidate
locations may be withdrawn when commensurate levels of safety can be sustained
without ATC and or operational considerations do not justify such
establishment.
(3) Economic assessment.
(4) Environmental considerations.
(5) Conclusions:
(a) Explanation of the conclusion reached based on the analysis of the
options and issues.
(b) The need to enhance safety shall be the key factor in evaluating
issues and options and should be reflected in the conclusion."
This source provides a list of candidate operational system variables to be
examined. It is then necessary to analyze them and establish the degree of
relationship of all major independent variables with NMAC reports
i.e., collision risk and the level of safety.
It is, also, necessary to define and exercise criteria for showing a casual
connection especially when there is a statistically significant mathematical
relationship between any variable and collision risk.
Each of the system variables must be analyzed, quantified and their
statistical nature i.e., the population, the frequency and magnitude of their
occurrence in the TCA system established. The aim of this intermediate step
12
...........

I
is to establish a probability density function for each TCA system strength,
s variable and stress, e variable, which is found to be related to NMAC
reports.
After this search and identification of the appropriate s and e variables, the
model may be exercised following the procedures outlined here and in
reference 2. Results can be compared with available real-world data. Based
on the outcome of this comparison the model may be revised and tested.
Testing of results as well as initial development of various hypothetical TCA
operational system variables may be accomplished using computers and observing
fast-time computer simulation of hypothetical TCA systems in operation.
Therefore, a necessary first step is to examine candidate system stress and
strength variables and determine their relationship, if any, to near midair
collision (AMAC) reports.
The ultimate goal of this in-house research is to determine and better
understand the basic relationships between operational variables in the
national airspace system and safety criteria which occur rarely (i.e. I time
in 70,000 events to I time in over 2 million events). The initial criterion
selected to measure the level of safety was near midair collisions reports and
finally actual midair collisions which have occurred in the fifty states
during the 1983 to 1988 time period. This view of the system provided a big
picture and the opportunity for the first time to determine the relationship
between these two important criteria for establishing the level of safety
which is affected when the system design is changed. The usefulness of the
13

operational variables, for future R&D regarding alternative design changes,
was tested by 'predicting' the near midair collision reports and the midair
collisions and comparing results with actual experienced reports and
collisions occurring within the fifty states.
An important first variable to check is the one discussed in the aerospace
handbook as being directly related to safety. That variable is the number of
operations.
A preliminary look at the rank ordered data regarding the number of total
operations and the number of reported NMAC reports for a year is shown in
figure 2 for the fifty states.
NMA--.------- +-----------+---------------+------------- -------------- 4---------------€4.
6' +
MID AIR **COLLISION 50 +
REPORTS * * *
40 * *• ** -,I
304'- * ** ** '.
+20 + +
10 +
S* * *
0 +---- +----------9-------- -- +-----------------------------------------
0 10 20 30 40 50 60'OF'S
FIG. 2. Plot of NMAC Reports and Total Operations (RANKED)
for the fifty states
14- -

The raw data of NMAC reports and number of operations yielded a Pearson r
correlation coefficient of 0.963. This is a surprisingly high degree of
statistical relationship between NMAC reports and the total number of
operations per state per year. The square of the Pearson r 0.963 is an
estimate of the amount of common variance between NMAC reports and total
number of operations. That figure is 0.927. Therefore, the number of
operations accounts for greater than 92% of the common variance for operations
and NMAC reports. This relationship will of course be examined further using
refined local area data as it becomes available. If it holds up, and there is
a confirmed steady relationship, it provides as an important clue. It could
be reasoned that if the model is indeed NMAC (number of reports) = OPS (i.e.,
the total number of operations) times a constant for the airport control areas
where the reports occur; then, it follows that NMAC reports will decline as
number of operations decline. The total number of operations per year
however, is increasing with a 42 percent increase anticipated between 1982 and
2000, with itinerant operations outside the airport local operating area
increasing 66 percent.
It is interesting to examine the language of the airspace handbook regarding
the relationship of the number of instrument flight rule (IFR) and visual
flight rule (VFR) operations which are pinpointed as the real problem, i.e.,
"see and be seen" uncontrolled VFR flight versus controlled IFR flight.
Further examinations of historical information is warranted to determine the
ratio of VFR operations to the total operations per state or other area per V
year. Most important is an examination of the annual number of VFR operations
within the fifty states that are associated with annual NMAC reports as well
as for controlled IFR traffic. Can it be shown that there is historically a
15
*4 J

disproportionate percentage of the total NMAC reports involving "see and be
seen" uncontrolled VFR flights? If so, this poses a system problem in that
VFR NMAC reports may not be directly associated with the TCA design
characteristics or the TCA system strength variables, s.
A preliminary look at the relationship between VFR and annual IFR operations
in the fifty states and near mid air collision reports and mid air collision
has disclosed no significant differences as correlations of 0.83 and 0.90 were
found for IFR and VFR related to annual near mid air collision reports and
0.80 and 0.87 related to annual mid air collisions.
This relationship with the criteria of safety was explored further by
examining the correlation between the mid air collisions reports and whether
the aircraft were VFR, IFR, unknown or combinations of these variables. Again
there was less than 4 percent common variance between the VFR and IFR aircraft
and both criteria of safety, NMAC's and MAC's.
One of the prime characteristics of a control area to be examined is its
physical size and geometry. For example, the number of square miles involved
in each area of consideration should affect the density of airspace operations
i.e., the number of aircraft, instantaneous airborne count (IAC) per square
mile.
A preliminary look is possible using the area of each state and annual
operations. The question posed is as follows: Is there a significant
relationship between the size of the area of operations and NMAC reports for
these areas?
16
2L l
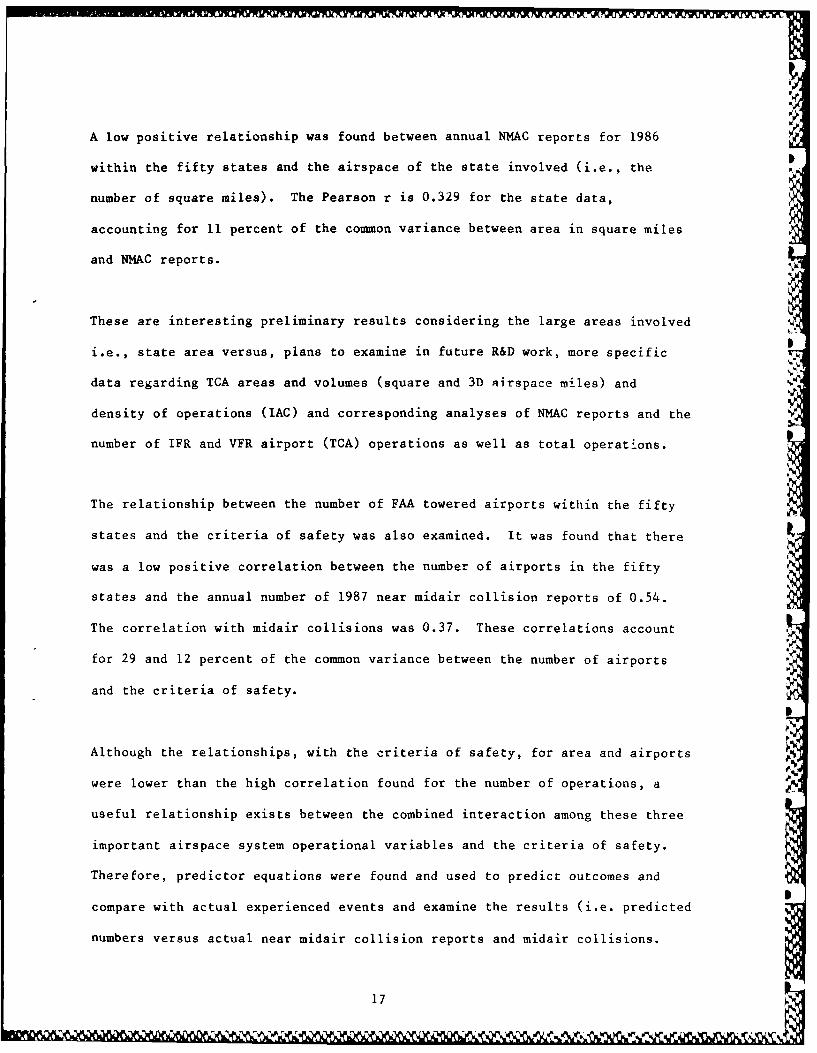
A low positive relationship was found between annual NMAC reports for 1986
within the fifty states and the airspace of the state involved (i.e., the
number of square miles). The Pearson r is 0.329 for the state data,
accounting for 11 percent of the common variance between area in square miles
and NMAC reports.
These are interesting preliminary results considering the large areas involved
i.e., state area versus, plans to examine in future R&D work, more specific
data regarding TCA areas and volumes (square and 3D Rirspace miles) and
density of operations (IAC) and corresponding analyses of NMAC reports and the
number of IFR and VFR airport (TCA) operations as well as total operations.
The relationship between the number of FAA towered airports within the fifty
states and the criteria of safety was also examined. It was found that there
was a low positive correlation between the number of airports in the fifty
states and the annual number of 1987 near midair collision reports of 0.54.
The correlation with midair collisions was 0.37. These correlations account
for 29 and 12 percent of the common variance between the number of airports
and the criteria of safety.
S
Although the relationships, with the criteria of safety, for area and airports
were lower than the high correlation found for the number of operations, a
useful relationship exists between the combined interaction among these three
important airspace system operational variables and the criteria of safety.
Therefore, predictor equations were found and used to predict outcomes and
compare with actual experienced events and examine the results (i.e. predicted
numbers versus actual near midair collision reports and midair collisions.
17

These results are presented graphically in figures 3, 4, 5, and 6. Each graph
is followed by a Pearson correlation matrix which quantifies the relationship
shown in each graph. All graphs and statistics were accomplished using
reference 16. Additional analyses will be completed in the near future using
different methods to verify the relationships found here. These results are
published to paint a picture of broad relationships found which provide leads I
to be followed in later work in TCA design studies.
FIG.3--THE RELAIIONSHIP BETWEEN NEAR MID AIR COLLISION REPORTS (1986)AND THE CALCULATED NUMBER USING THE PREDICTOR EQUATION WITH
OPERATIONS, AIRPORTS AND SQUARE MILES (1986).NMA
-+----------+----------+---------------------+-------------------- ----------------------- 4-
250 + +
NEAR MID AIR
COLLISION *
REPORTS 200 + + S
(1986) 0
150 + +
100 + 4,I 2 I 4
50 + * +I *3** *
I 9986****0 + +
----------------------------------------- --- +--------------------
0 50 100 150 200 250CN
CALCULATED NUMBER OF NEAR MID AIR COLLISION
PEARSON CORRELATION HATRIX
hl1MA CM ,
CN ') 98C)286582 1 (DiU
18
-. - -,~ %N-%

FIG.4--THE RELATIONSHIP BETWEEN NEAR MID AIR COLLISIONSREPORTS (1987) AND THE CALCULATED NUMBER USING THEPREDICTOR EQUATION WITH OPERATIONS, AIRPORTS AND
SQUARE MILES (1987)NMA87
- +---- ---------------------------- +-------------------- ------------------------
300 + +NEAR MID AIR tCOLLISION I *
REPORTS 250 + +(1987) I
200 + +
150 + +
100- ** +
50+ *2 +I **2233 .13958
0+2 +--......-----------------------------------------------------
0 50 10 150 200 250PRN67
CALCULATED NUMBER OF NEAR MID AIR COLLISION REPORTS (1987)
P-R7,DFi f-nRPF.-ATION MOTRIX
PRNO)7 C . 989 1 n(V
19
'N

FIG. 5--THE RELATIONSHIP BETWEEN COLLISONS (1986) AND CALCULATEDCOLLISIONS USING THE PREDICTOR EQUATION WITH OPERATIONS,
176 AIRPORTS AND SQUARE MILES.----------------- . ..
8+
COLLISIONS I(1986) + * S
4+ +
* I
2 + 2 * * "4
*2**22*2 .
0 + *269552* *----------------------------------- ------ ------ 4--
CALCULATED 0 2 4 6 8
COLLISIONS (1986) PCSo*
f'Dt R[J-A rTO 'II'rT
f- qt
PE '~F c-rJ f F R t ! V I A ~r~ io I '- TR X"-
20 0"
,- i- a I miD mm Hi m'V.-

FIG°6 .-THE RELATIONSHIP BETWEEN COLLISIONS (1987) AND THECALCULATED COLLISIONS USING THE PREDICTOR EQUATION WITH
OPERATIONS, AIRPORTS, AND SQUARE MILES (1987)
C7
-- -- -- -- -- -- -- - -- -- -- -- -- -- -- - ---------------- ,.*.
6 +
COLLISIONS
(1987)
4 +
3 + "
2_ + +
I + 3224,** * *+ ?
0 + *896* 2
-5 0-
PC? 7
CALCALATED COLLISIONS (1987) WI
pE rF ]; ri. F AF []. MATF iK .
ff~~F -"-.7''l"
Pf.l
21'
I I
.,. .' -, -.. V -.. :,.,. . - ",% - N ,- -, . ,/, ,. ,* ¢ ',.'. ', €¢4 ,

The most interesting findings are presented graphically in figures 7 through
12 which show and establish, for the first time, that annual near mid air
collision reports for the fifty states are strongly and significantly related
to mid air collisions occurring annually within the fifty states.
FIG.7 --THE RELATIONSHIP BETWEEN COLLISIONS (1986) AND NEAR Nor
MID AIR COLLISION REPORTS (1986)
COLLI SIONS
(1986)
6+
4
224 24
0 50 10 150 2
I . 0
0.4
O~997~* ..22
-. 4- --- --- ---- --- --- ---- --- -2%

FIG. 8--THE RELATIONSHIP BETWEEN COLLISIONS (1987) ANDNEAR MIP AIR COLLISION REPORTS (1987)
C-7----------------------------------- ----- ----- +-
5 + +
COLLISIONS IQ
(1987) 1.+*
3 + +
+ +
+22233 **+
0 +69654 ***+
4 --------------- +--------------------------+------------------+------------------
0 50 100 150 200 250 300NMA87
NEAR MID AIR COLLISION REPORTS (1987) 5
23..5

FIG.9--THE RELATIONSHIP BETWEEN COLLISIONS (1986 AND 1987)AND NEAR MID AIR COLLISION REPORTS (1986 AND 1987)
C67-- - - -------------------------------- +----------------------+---------------------
20 +COLLISIONS I
1986 IAND1987 15 + +
* ISI
10 +
5 +
+ *2*I 2
1*3433 ** * -
0 +4954*-+ ----------------------+-- --------- ------ +------ -0 100 200 300 400 500
N67
NEAR MID AIR COLLISIONS 1986 AND 1987
PEARSON CORRELATION MATRIX
C67 N67
C67 1.000N67 0.940 1.000
24
q, Y
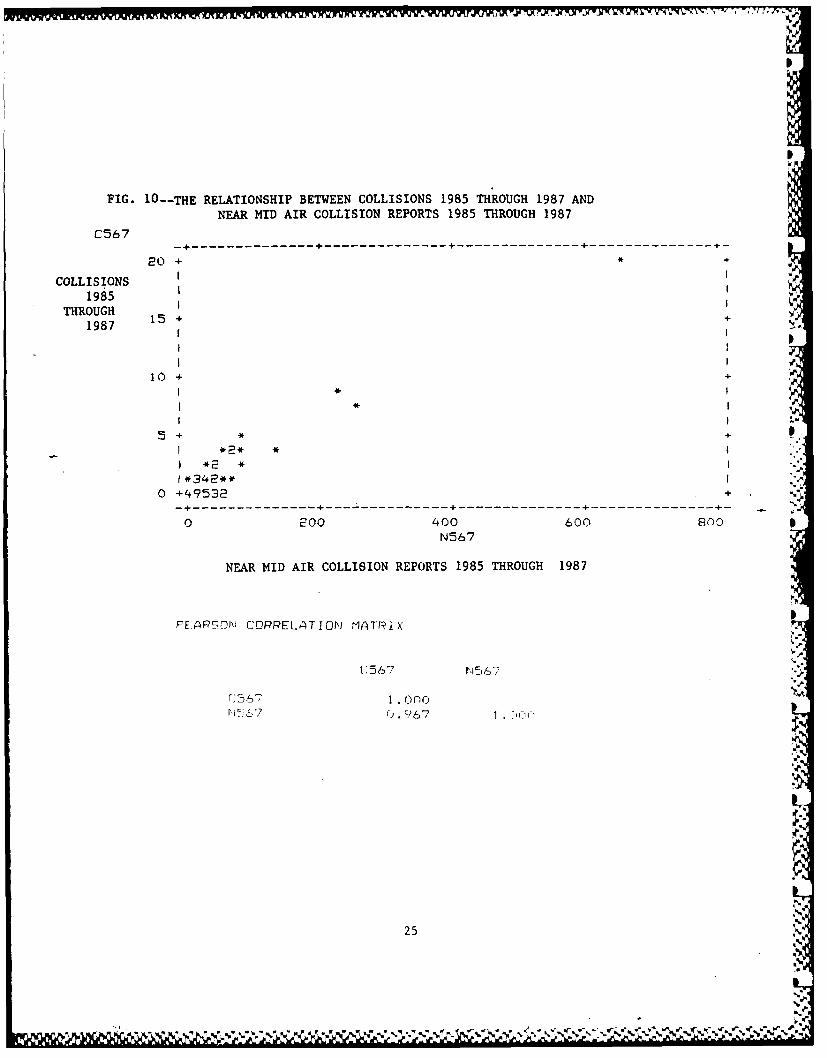
FIG. 1O--THE RELATIONSHIP BETWEEN COLLISIONS 1985 THROUGH 1987 AND
NEAR MID AIR COLLISION REPORTS 1985 THROUGH 1987
C567------------------------------ ---------------- -
20 * +
COLLISIONS1985
THROUGH1987
10+*)
* .I
5O + !
5 + * + I
I *2* *
I *2 * i1 *342** I
0 +49532 +
-------------- - ---------------------- -------- 4- -
0 200 400 600 8(0
N567
NEAR MID AIR COLLISION REPORTS 1985 THROUGH 1987
PEAPSOI CORRELATION MOTRIX
%'V
('567 S~j/- 6,..
25
i"JS.i,'7!L'. 6? I. :'US. V
~* ~ V sj .. .9. . ~ f ~~ ~ ..f~fY V~fif%~VV -

I-g
FIC.11--THE RELATIONSHIP BETWEEN COLLISIONS 1983 THROUGH 1987AND NEAR MID aiR COLLISION REPORTS 1983 THROUGH 1987
C34567-+----------------------+--------------------+---------------------------------------------
30 + +S* I
COLLISIONS I1983 THROUGH 25 + +
1987
20+
15 + +
10 + * +
5 + +*
297720 + +
-+ - - ------------ +--------------------+-------------------- --------------------------
0 200 400 600 80n 1000
N34567 0
NEAR MID AIR COLLISION REPORTS 1983 THROUGH 1987.
PEARSON*J CORRELAT-ION MATRIY
[34567 N 3.+56" ,.
U ~1 C 000N34567 0. 94.3 1. 0,,
% le
26

FIG. 12--THE RELATIONSHIP BETWEEN COLLISIONS 1983 THROUGH 1988AND NEAR MID AIR COLLISIONS 1983 THROUGH 1988.
(FIRST QUARTER '88)C345678
-------------------------------------- +------------
30 + * +
COLLISIONS I1983 I I
THROUGH 25 +1988
(1st Qtr'88) +20 i
15+ +, I10+ * +
I ** I5..- *** +~
1 *2*3** * !
12977* I0 +
0+------+--------------------+-------------------------------------------- re
0 200 400 600 800 1000N345678
NEAR MID AIR COLLISIONS 1983 THROUGH 1988(1st Qtr '88)
PEARS0rI CORRELATION M.ATRIX
CF34567e t\345, 70
C3%57F I .cc<(:I %
~4L5L,,S7 E 0 .9?44 c~i .
27

This finding provides an extremely useful criterion of safety. That is near
midair collision reports which will be useful measures to be used in the
search for operational variables which strengthen the design of the national
airspace system and its component parts. The usefulness stems from the
finding that these reports occur approximately I in 70,000 operations as
opposed to collisions which occur approximately 1 in over 2 million
operations. As they are shown to be highly related, the criterion occurring
30 times or more often has the greater utility in determining the level of
safety in the smaller components of the national airspace system when changes
in the design are made. For example, before and after comparisons of TCA
design may be examined using changes in the number of near midair collision
reports as a real criterion or measure of the level of safety attained. This
is because it has been shown here that near midair collision reports correlate
highly with midair collisions, which although perhaps the ultimate criterion
of the safety level achieved, occur rarely.
This preliminary analysis provides an example of the additional R&D work
needed and planned to be carried out during 1989 and 1990. The goal is to
determine and quantify the relationship of other unknown but equally important
airspace system stress and strength variables in the National Airspace System
design and establish their significant relationship to safety criteria: NMAC
reports, midair collisions and other yet to be discovered criteria. The
ultimate goal is to verify the utility of this proposed model and other
mathematical models using real time and fast time computer simulations that
calculate or demonstrate the overall level of safety achieved and collision
risk probabilities.
28

References
1. Thomas H. Higgins, "Terminal Control Area Design and Air Traffic
Loadings" DOT/FAA/ES-87/4 (September 1987)
2. Robert L. Hershey, Thomas H. Higgins, and Edward B. Magrab,
"Application of the Response Probability Density Function Technique to
Predicting the Probability of Sonic-boom Glass Breakage" J. Acoust.
Soc. Am., Vol. 55, No. 5, 1009-1017, May 1974 *Portions of this paper
were presented at the 86th Meeting of the Acoustical Society of
America, 1 November 1973, Los Angeles, and in Refs., 4 and 5 by the
authors.
3. A. M. Freudenthal et al. "The Analysis of Structural Safety,"J Structural Div., Proc. Am. Soc. Civil Eng. 92, No. ST i1,
267-325 (Feb. 1966).
4. Robert L. Hershey and Thomas H. Higgins, "Application of the Response
Probability Density Function Technique to Biodynamic Models" Aviation,
Space, and Environmental Medicine. 49(l):234-239, 1978
5. R. L. Hershey, "Statistical Model of the Rupture of Brittle Rectangular
Plates Under Loading by Transient Overpressures," Ph. D. Dissertation,
Catholic University of America (1973).
29

6. R. L. Hershey and T. H. Higgins, "Statistical Prediction Model for
Glass Breakage from Nominal Sonic Boom Loads," Booz, Allen Applied
Research, FAA-RD-73-79 (1973).
7. R. L. Hershey, "Analysis of the Difference Between Log Mean and Mean
Log Averaging," J. Acoust. Soc. Am. 51, 1194-1197(L) (1972).
8. T. H. Higgins, "Analysis of U. S. Air Force SR-71 Sonic Boom Damage
Complaints and Flight Data," presented to the Committee on SST-Sonic
Boom NAS-NRC (13 Nov. 1967).
9. T. H. Higgins, "A Survey of Sonic Boom Community Overflight Program
Overpressure Distribution, Community Reaction, and Material Failure
Data Related to the Supersonic Transport," Federal Aviation Admin.
(7 Apr. 1967).
10. E. Huntington, "Frequency Distribution of Product and Quotient,"
Ann. Math. Stat. 10, 125 (1939).
Ii. A. M. Freudenthal et al. "The Analysis of Structural Safety," X
J. Structural Div., Proc. Am. Soc. Civil Eng. 92, No. ST 1, 267-325J. Strctura Div.
(Feb. 1966).
12. T. I. Smits and R. F. Lambert, "System-Reliability Prediction in
Impulsive-Noise Environments, Based on Wear-Dependent Failure Rates,
Using Response 'Peak' Statistics," J. Acoust. Soc. Am. 43, 1344-1350
(1968).
30 S
Nf

II13. Order 7400.2C "Procedures for Handling Airspace Matters"
dated May 1, 1984.
14. "FAA Air Traffic Activity Report" 1986
15. "FAA Air Traffic Activity Report" 1987
16. "MYSTAT Version 2.0: A Personal Version of Systat."
31I
"i
'I
!y
5,