
F REPORTS OF FINNISH ENVIRONMENT INE PARTI cl E Fine ...
36
Finnish Environment Institute REPORTS OF FINNISH ENVIRONMENT INSTITUTE 21 | 2006 Fine particle emissions and emission reduction potential in Finnish industrial processes Antti Tohka and Niko Karvosenoja
Transcript of F REPORTS OF FINNISH ENVIRONMENT INE PARTI cl E Fine ...

Finnish Environment Institute
REPORTS OF FINNISH ENVIRONMENT INSTITUTE 21 | 2006
ISBN 952-11-2503-9 (pbk.)
ISBN 952-11-2504-7 (PDF)
ISSN 1796-1718 (print)
ISSN 1796-1726 (online)
FIN
NIS
H E
NV
IRO
NM
EN
T IN
ST
ITU
TE
Fine particle emissions and emission reduction potential in Finnish industrial processes
Antti Tohka and Niko Karvosenoja
FIN
E P
AR
TIc
lE
EM
ISS
ION
S A
ND
EM
ISS
ION
RE
DU
cT
ION
PO
TE
NT
IAl
IN F
INN
ISH
IND
US
TR
IAl
PR
Oc
ES
SE
S


REPORTS OF FINNISH ENVIRONMENT INSTITUTE 21 | 2006
Fine particle emissions and emission reduction potential in Finnish industrial processes
Antti Tohka and Niko Karvosenoja
Helsinki 2006
Finnish Environment Institute

REPORTS OF FINNISH ENVIRONMENT INSTITUTE 21 | 2006 Finnish Environment InstituteResearch Department
Page layout: Ritva Koskinen
The publication is also available in the Internet:www.environment.fi/publications
Edita Prima Ltd, Helsinki 2006
ISBN 952-11-2503-9 (pbk.)ISBN 952-11-2504-7 (PDF)ISSN 1796-1718 (print)ISSN 1796-1726 (online)

�Reports of Finnish Environment Institute 21 | 2006
Acknowledgements
The authors gratefully acknowledge the financial support from the Ministry of the Environment and integrated assessment modeling project ”KOPRA” in the technological programme ”FINE Particles - Technology, Environment and Health 2002-2005” of the National Technology Agency of Finland (Tekes). We also thank Zbigniew Klimont from IIASA for sharing his knowledge with us as well as all the people from industry’s side, who have been kind enough to answer our questions.

� Reports of Finnish Environment Institute 21 | 2006

5Reports of Finnish Environment Institute 21 | 2006
CONTENTS
Acknowledgements ...................................................................................... 3
Introduction................................................................................................... 7
Process descriptions .................................................................................... 8Oil refineries ................................................................................................................8
Coking plants ................................................................................................................8
Sintering plants ............................................................................................................9
Blast furnaces ...............................................................................................................9
Basic oxygen furnace ...................................................................................................9
Electric arc furnaces and ferrochromium production ........................................10Electric arc furnaces ........................................................................................ 10Ferrochromium production ........................................................................... 11
Casthouse .....................................................................................................................11
Non ferrous metal production ................................................................................12Flash smelting................................................................................................... 12Zinc production ................................................................................................ 1�Secondary aluminium production ................................................................ 1�
Nitric and sulphur acid production, fertilizers .................................................. 14Nitric Acid and Ammonium Nitrate............................................................. 1�
Sulphur Acid ...............................................................................................................15
Cement production ....................................................................................................15
Lime production ........................................................................................................ 16
Mineral processing .................................................................................................... 16
Wood pulping limekilns, smelt dissolving tanks. .............................................17
Plywood and chip board production .....................................................................17
Glass wool and fibre production .............................................................................18
Methodology and data sources ................................................................. 19The Finnish Regional Emission Scenario (FRES) model ..................................19
PM Control Options ..................................................................................................21Cyclones / multi-cyclones .............................................................................. 21Electrostatic precipitators (ESPs) ................................................................... 21Wet scrubbers ................................................................................................... 21Fabric filters....................................................................................................... 21Removal efficiencies of different control technologies ...............................22
PM size distribution ..................................................................................................22
� Reports of Finnish Environment Institute 21 | 2006
Results and discussion ................................................................................ 23PM Emissions in 2000 ...............................................................................................23
Spatial distribution of emissions ...........................................................................25
Comparison to RAINS model .................................................................................25
Emission reduction potential for TSP and PM2.5 ...............................................26
Discussion on emission uncertainties ...................................................................27
Conclusions and future work ..................................................................... 29
References ................................................................................................... 30
Documentation pages ................................................................................ 31

�Reports of Finnish Environment Institute 21 | 2006
Introduction
Exposure to particulate matter (PM) has been associated with health effects (respiratory symptoms, morbidity and mortality) concentrations commonly encountered in Europe. PM and especially fine particles with a diameter less than 2.5 micrometres (PM2.5) are associated with increased mortality, especially from cardiovascular and cardiopulmonary diseases. Fine particles penetrate deep into lugns. Furthermore, particles carry harmful substances, e.g. trace elements that condense onto particle surfaces in combustion and other hot processes. These harmful substances enrich mainly to PM size fractions that entail largest particle surface area, i.e. typically from 0.1 to 0.5 micrometres. Still it is unclear which of PM properties (size, form, chemical composition, etc.) would be most responsible for harmful effect (EEA 2005, Andersson et. al 2005).
In Finland domestic combustion and transport are the most important sources for PM2.5 emissions (Karvosenoja et al. 200�). However, the role of non-fuel activities has been only superficially studied, and the magnitude and chemical composition of PM2.5 emissions is uncertain. In previous studies Finnish fine PM emissions from industrial processes have been roughly estimated using the Finnish Regional Emission Scenario (FRES) model (Karvosenoja et al. 2002). However, the technical description of the plants was incomplete at the time of this study.
In this work the FRES model was used to estimate PM emissions from chosen industrial point sources. The industrial non-fuel point sources existing in FRES were reviewed and essential missing sources were added. The technical description of the point sources was refined based on contacts with the plant operators. The emission factors were reviewed using VAHTI (Korkia-aho et al. 1995) and other data. Finally, Finnish primary emissions of, total suspended particles (TSP), PM10 and PM2.5 were calculated for the year 2000 and technical emission reduction potential was estimated.
� Reports of Finnish Environment Institute 21 | 2006
Process descriptions
In this section the most significant process types in terms of PM or other air pollution emissions in Finland are described and the main emission sources inside these processes explained. Mainly “hot” processes are considered, where volatile emission occur because chemical decomposition due process heat. “Cold” processes such as painting and product handling were not included in this work. This study also includes emissions from point sources, where process and process heat conversion happens in a same point, meaning they share same stag and could not have individual flue gas cleaning system (distinct from process, where process heat is converted elsewhere and lead to process).
�� large non-fuel point sources were selected and investigated for this study. Readers have to bear in mind that there are many differences between processes even inside same source sector and following descriptions are more representational for some source sectors than others as a whole. The whole process can be strongly facility specific and there can be several variations based on purpose and age of the process.
Oil refineries
The oil refining industry converts crude oil into thousands of refined products including liquid fuels, by-product fuels, primary petrochemicals and different feedstock.
Listed below are 5 categories of general refinery processes and associated operations (EPA 199�):
1. Separation processes2. Petroleum conversion processes�. Petroleum treating processes�. Feedstock and product handling5. Auxiliary facilities
Most of the particles are emitted in phase 2 during the fluid catalytic cracking (FCC) (Hästbacka et al. 1992), where reaction occurs in 510-5�0C°C temperature under 1.5 bar pressure and under the influence of catalytic. Coke is one of the products of cracking and it stays on the surface of catalytic and it is burned regenerator, which is situated next to reactor. (Hästbacka et al. 1992). PM emissions are mainly originated from catalyst materials (Olmez et al. 19��).
Coking plants
Metallurgical coke is produced by destructive distillation of coal in coke ovens. Prepared coal is pyrolized until all volatile components in the coal evaporate. The

9Reports of Finnish Environment Institute 21 | 2006
material remaining is called coke. Most metallurgical coke is used in iron and steel industry processes such as blast furnaces, sinter plants, and foundries to reduce iron ore to iron. (EPA 199�). Emissions originate from several by-product coking operations: (1) coal preparation, (2) coal preheating (if used), (�) coal charging, (�) oven leakage during the coking period, (5) coke removal, (�) hot coke quenching and (�) underfire combustion stacks. (EPA 199�). PM emissions are mainly from pre-heating (pyrolizing) and coke ovens. (EPA 199�).
Sintering plants
The sintering process converts fine-sized raw materials, including iron ore, coke breeze, limestone, mill scale, and flue dust, into an agglomerated product, sinter, of suitable size for charging into the blast furnace. The raw materials are sometimes mixed with water to provide a cohesive matrix, and then placed on a continuous, travelling grate called the sinter strand. A burner hood, at the beginning of the sinter strand ignites the coke in the mixture, after which the combustion is self supporting and it provides sufficient heat, 1250 to 1�00°C , to cause surface melting and agglomeration of the mix. Combustion zone travels trough moving sinter strand igniting sinters. In the end of the strand sinter drop down and sinters are cooled before crushing and sieving (EPA 199�, Metallinjalostajat 200�)
Emissions from sinter plants are generated from raw material handling, windbox exhaust, discharge end (associated sinter crushers and hot screens), cooler, and cold screen. The windbox exhaust is the primary source of particulate emissions, mainly iron oxides, sulfur oxides, carbonaceous compounds, aliphatic hydrocarbons, and chlorides. At the discharge end, emissions are mainly iron and calcium oxides. (EPA 199�).
Blast furnaces
Iron is produced in blast furnaces by the reduction of iron bearing materials with a hot gas. The large, refractory lined furnace is charged through its top with iron as ore, pellets, and/or sinter; flux as limestone, dolomite, and sinter; and coke for fuel. Iron oxides, coke and fluxes react with the blast air to form molten reduced iron, carbon monoxide (CO), and slag. The molten iron and slag collect in the hearth at the base of the furnace. The by-product gas is collected through off-takes located at the top of the furnace and is recovered for use as fuel. (EPA 199�)
The primary source of blast furnace emissions is the casting operation. Particulate emissions are generated when the molten iron and slag contact air above their surface. Casting emissions also are generated by drilling and plugging the taphole. The occasional use of an oxygen lance to open a clogged taphole can cause heavy emissions. During the casting operation, iron oxides, magnesiumoxide and carbonaceous compounds are generated as particles. (EPA 199�)
Basic oxygen furnace
In the basic oxygen process (BOP), molten iron from a blast furnace and iron scrap are refined in a furnace by lancing (or injecting) high-purity oxygen. The input material is typically �0 percent molten metal and �0 percent scrap metal. The oxygen reacts with carbon and other impurities to remove them from the metal. The reactions are exothermic, i. e., no external heat source is necessary to melt the scrap and to raise

10 Reports of Finnish Environment Institute 21 | 2006
the temperature of the metal to the desired range for tapping. The large quantities of CO produced by the reactions in the BOF can be controlled by combustion at the mouth
of the furnace and then vented to gas cleaning devices, as with open hoods, or combustion can be suppressed at the furnace mouth, as with closed hoods. BOP steelmaking is conducted in large refractory lined pear shaped furnaces. There are 2 major variations of the process. Conventional BOFs have oxygen blown into the top of the furnace through a water-cooled lance, this process is called LD- converter. In the newer, Quelle Basic Oxygen process (Q-BOP), oxygen is injected through tuyeres located in the bottom of the furnace. This process is called in the literature also OBM- converter. The most modern converters are combinations of these two processes, where blowing techniques is developed. LD- converters are equipped with bottom lances, which blow inert gas (nitrogen or argon) to the furnace and OBM- converters are equipped with upper lance. A typical BOF cycle consists of the scrap charge, hot metal charge, oxygen blow (refining) period, testing for temperature and chemical composition of the steel, alloy additions and reblows (if necessary), tapping, and slagging. The full furnace cycle typically ranges from 25 to �5 minutes. (EPA 199�, Metallinjalostajat 200�).
The most significant emissions from the BOF process occur during the oxygen blow period. The predominant compounds emitted are iron oxides, although heavy metals and fluorides are usually present. Charging emissions will vary with the quality and quantity of scrap metal charged to the furnace and with the pour rate. Tapping emissions include iron oxides, sulphur oxides, and other metallic oxides, depending on the grade of scrap used. Hot metal transfer emissions are mostly iron oxides. (EPA 199�)
Electric arc furnaces and ferrochromium production
Ferroalloy is an alloy of iron with some element other than carbon. Ferroalloy is used to physically introduce or ”carry” that element into molten metal, usually during steel manufacture. In practice, the term ferroalloy is used to include any alloys that introduce reactive elements or alloy systems, such as nickel and cobalt-based aluminum systems. In Finland ferroalloys are ferrochromium, which are manufactured in Tornio plants.
Electric arc furnaces
Electric arc furnaces (EAF) are used to produce carbon and alloy steels. The input material to an EAF is typically 100 percent scrap. Cylindrical, refractory lined EAFs are equipped with carbon electrodes to be raised or lowered through the furnace roof. With electrodes retracted, the furnace roof can be rotated aside to permit the charge of scrap steel by overhead crane. Alloying agents and fluxing materials usually are added through the doors on the side of the furnace. Electric current of the opposite polarity electrodes generates heat between the electrodes and through the scrap. After melting and refining periods, the slag and steel are poured from the furnace by tilting.
The operations which generate emissions during the electric arc furnace steelmaking process are melting and refining, charging scrap, tapping steel, and dumping slag. Iron oxide is the predominant constituent of the particulate emitted during melting. During refining, the primary particulate compound emitted is calcium oxide from the slag. Emissions from charging scrap are difficult to quantify, because they depend on the grade of scrap utilized. Scrap emissions usually contain iron and other metallic
11Reports of Finnish Environment Institute 21 | 2006
oxides from alloys in the scrap metal. Iron oxides and oxides from the fluxes are the primary constituents of the slag emissions. During tapping, iron oxide is the major particulate compound emitted. (Metallinjalostajat 200�)
Many new electric arc furnaces incorporate the canopy hood with one of the other � systems. The full furnace enclosure completely surrounds the furnace and evacuates furnace emissions through hooding in the top of the enclosure. (Metallinjalostajat 200�)
Ferrochromium production
Ferrocromite is produced as a continuous process. Pre-heated pellets, coke and dolomite are feed to process, where charge is heated to 1�00-1�00ºC. Coke reduces oxides. Melted ferrochromium is poured into the furnace. In the production of ferrochromium (FeCr) , the most important stage is the reduction of chromite. The reduction process is a typical high-temperature process. The final reduction is made by electrical power or fossil fuel. The reduction rate and chromium recovery depend on temperature, charge material sizes, chromite particle sizes and specific surface areas. The chromite itself and the feed mixture should have high melting points for the correct operation of the submerged arc furnace. Ferrochromium is produced in open, semi closed or closed submerged arc furnaces and D.C. plasma furnaces. Charge is cold, preheated or pre-reduced. The submerged arc furnaces include three-phase A.C. operations with three Söderberg electrodes and energy generation by electric resistance heating. Close control of the charge composition and its sizing, as well as of the slag composition are essential for effective operation of the submerged arc furnace. The D.C. arc furnace includes a single central hollow graphite electrode. A water-cooled refractory or metal roof covers the totally closed electric furnace. The smelting charge flows continuously from the tubes to the hearth so that the material in the tubes at the same time forms a gas tight seal. Chromite is reduced both in solid and liquid state. Smelted products go on to the bottom of the furnace. The smelting practice may be based on resistance or current control so that the electrodes are lifted and lowered when necessary to keep resistance or current constant. This means certain requirements to the electrode sealings to prevent air leakage into the furnace. Alternatively is the practice where the electrodes move only during slipping and stand otherwise in place. The smelting process produces metal and slag, and CO rich off-gas. The products are tapped at regular intervals of 2–� hours. The produced metal is of charge chrome or high carbon ferrochrome with chrome content 50–�0 %, carbon �–9 % and silicon 0.5–� %. The slag consists mainly of SiO2, Al2O� and MgO in different phases but also smaller amounts of CaO, chromium and iron oxides and metalfragments. The chrome content in slag is 2–12 %, in oxide and metal form. The slag/metal amount ratio in smelting varies from 1.0 to 1.�, depending on raw materials. The solid products obtained from the smelting of ferrochromium are metal, slag and dust. In open top and semiclosed furnaces the dust is collected as such in a bag filter plant, whereas in a closed top and plasma furnace, the dust is scrubbed in a venturi system and is produced as a slurry. (Metallinjalostajat 200�, Riekkola-Vanhanen 1999b).
Casthouse
When the melting process is complete, the molten metal is tapped and poured into a ladle. The molten metal may be treated in the ladle by adding alloys and/or other chemicals. The treated metal is then poured into molds and allowed to partially cool under carefully controlled conditions. When cooled, the castings are placed

12 Reports of Finnish Environment Institute 21 | 2006
on a vibrating grid and the sand of the mold and core are shaken away from the casting. Most steel follows one of two major routes to final processing. The most common finishing method is continuous casting. In this process, a ladle with molten steel is lifted to the top of the continuous caster, where it flows into a reservoir, or tundish, and then into the molds of the continuous casting machine. As the steel passes through the molds and is cooled, a thin skin forms on the outside of the steel. Various designs of the casters shape the steel as it continues to flow. The steel is shaped into semi finished products such as blooms, billets, or slabs, and subsequently into more finished products. Another finishing route, which is not used as frequently as continuous casting, is ingot casting. Molten steel is poured from the ladle into an ingot mold, where it cools and begins to solidify. The molds are stripped away, and the ingots are transported to a soaking pit or reheat furnace where they are heated to a uniform temperature. The ingots are shaped by rolling into semi finished products, usually blooms, billets, slabs, or by forging. Continuous casting is the preferred method of semi finished product production because the soaking-reheating step is eliminated. The semi finished products may be fur forming, cold rolling, pickling, galvanizing, coating, or painting. Some of these steps require additional heating or reheating. For example, one type of furnace used for heating is a tunnel furnace, which has cars that are moved slowly through the furnace. Annealing furnaces are another example. (EPA 199�)
At some facilities, fugitive particulate emissions may be emitted through a roof monitor during transfer from the ladle to the tundish and the continuous caster. No information is available on any control devices employed for these processes. (EPA 199�)
Non ferrous metal production
Flash smelting
Flash smelting is part of copper production. Dried copper concentrate is fed to hot reaction shaft. Concentrate particles react rapidly with suspension with oxygen. The smelting takes place without any external fuel addition, i.e. the chemical energy of the concentrate is utilized for smelting. Fuel burners in the furnace are available to ensure furnace temperature during interruptions. The reaction products from the reaction shaft are separated in the settler part of the furnace. Rich copper matte and slag separate further in the bath formed in the settler. They are tapped out of the furnace separately through tapping holes and launders. The fumes and SO2 from launders are collected in hoods. Copper matte is further oxidised in converters to blister copper. It is then fed into the anode furnace for final oxidation and reduction before anode casting. The slag is cooled in large ladles and crushed and ground before flotation for copper recovery. The slag concentrate is fed into the Flash Smelting Furnace together with the primary concentrate. The remaining concentration sand is stable, because the remaining small amounts of metals are vitrified in the silicate matrix. (Riekkola-Vanhanen 1999a).

1�Reports of Finnish Environment Institute 21 | 2006
Zinc production
Reduction of zinc sulfide concentrates to metallic zinc is accomplished through either electrolytic deposition from a sulfate solution or by distillation in retorts or furnaces.
The first method is called Hydrometallurgical and second pyrometallurgical. Only hydrometallurgical method is in use in Finland.
Both of these methods begin with the elimination of most of the sulfur in the concentrate through a roasting process.
The process operated by electrolytic zinc plants is fairly standard. The majorequipment and techniques used and the major process steps are common practice
world-wide. The major steps are:1. Roasting of sulphide concentrate to convert the sulphides to acid soluble
oxides and utilising the SO2 gas for acid production.2. Leaching of the oxides in recycled sulphuric acid solution to produce a zinc
sulphate solution.�. Purification of the zinc solution.�. Electrowinning of the zinc as cathodes with simultaneous regeneration of
sulphuric acid, the so-called spent acid, which is recycled to leaching.5. Melting and casting of the cathodes to commercial shapes.
Typical emissions from this process are:1. Dust from the mechanical and pneumatic handling of concentrates, calcine
and zinc dust.2. Gas emission from roasting equipment, with SO2 as the major constituent,
during all, (also emergency and unscheduled ) start-ups and shutdowns of the roaster.
�. Vent air from ventilation, cooling and evaporation in the hydrometallurgical part of the process.
�. Vent air from all process buildings.
The main emission elements are: Zn, Fe, Cu, Cd, Hg and sulphides. (Fugleberg 1999)
Secondary aluminium production
Secondary aluminum producers recycle aluminum from aluminum-containing scrap, while primary aluminum producers convert bauxite ore into aluminum. There is no primary aluminium production in Finland.
After scrap pre-treatment, smelting and refining is performed. Smelting and refining in secondary aluminum recovery takes place primarily in reverberatory furnaces. These furnaces are brick-lined and constructed with a curved roof. The term reverberatory is used because heat rising from ignited fuel is reflected (reverberated) back down from the curved furnace roof and into the melted charge. A typical reverberatory furnace has an enclosed melt area where the flame heat source operates directly above the molten aluminum. The furnace charging well is connected to the melt area by channels through which molten aluminum is pumped from the melt area into the charging well. Aluminum flows back into the melt section of the furnace under gravity.
1� Reports of Finnish Environment Institute 21 | 2006
Nitric and sulphur acid production, fertilizers
Nitric Acid and Ammonium Nitrate
Nitric acid is produced by 2 methods. The first method utilizes oxidation, condensation, and absorption to produce a weak nitric acid. Weak nitric acid can have concentrations ranging from �0 to �0 percent nitric acid. The second method combines dehydrating, bleaching, condensing, and absorption to produce a high-strength nitric acid from a weak nitric acid. High-strength nitric acid generally contains more than 90 percent nitric acid.
Ammonium nitrate (NH�NO�) is produced by neutralizing nitric acid (HNO�) with ammonia (NH�). Prilling and granulation are the most common processes used to produce solid ammonium nitrate. To produce prills, concentrated melt is sprayed into the top of a prill tower. In the tower, ammonium nitrate droplets fall countercurrent to a rising air stream that cools and solidifies the falling droplets into spherical prills. Prill density can be varied by using different concentrations of ammonium nitrate melt. Rotary drum granulators produce granules by spraying a concentrated ammonium nitrate melt (99.0 to 99.� percent) onto small seed particles of ammonium nitrate in a long rotating cylindrical drum. As the seed particles rotate in the drum, successive layers of ammonium nitrate are added to the particles, forming granules. Granules are removed from the granulator and screened. Offsize granules are crushed and recycled to the granulator to supply additional seed particles or are dissolved and returned to the solution process. Pan granulators operate on the same principle as drum granulators, except the solids are formed in a large, rotating circular pan. Pan granulators produce a solid product with physical characteristics similar to those of drum granules. The temperature of the ammonium nitrate product exiting the solids formation process is approximately �� to 12�°C .Rotary drum or fluidized bed cooling prevents deterioration and agglomeration of solids before storage and shipping. Low density prills have a high moisture content because of the lower melt concentration, and therefore require drying in rotary drums or fluidized beds before cooling.Since the solids are produced in a wide variety of sizes, they must be screened for consistently sized prills or granules. Cooled prills are screened and offsize prills are dissolved and recycled to the solution concentration process. Granules are screened before cooling. Undersize particles are returned directly to the granulator and oversize granules may be either crushed and returned to the granulator or sent to the solution concentration process. Following screening, products can be coated in a rotary drum to prevent agglomeration during storage and shipment. (EPA 199�)
Emissions from ammonium nitrate production plants are particulate matter (ammonium nitrate and coating materials), ammonia, and nitric acid. Ammonia and nitric acid are emitted primarily from solution formation and granulators. Particulate matter (largely as ammonium nitrate) is emitted from most of the process operations and is the primary emission addressed here. (EPA 199�)
The emission sources in solution formation and concentration processes are neutralizers and evaporators, primarily emitting nitric acid and ammonia. The vapor stream off the top of the neutralization reactor is primarily steam with some ammonia and NH�NO� particulates present. (EPA 199�)
Specific plant operating characteristics, however, make these emissions vary depending upon use of excess ammonia or acid in the neutralizer. Since the neutralization operation can dictate the quantity of these emissions. Particulate emissions from these operations tend to be smaller in size than those from solids production and handling processes and generally are recycled back to the process. (EPA 199�)
15Reports of Finnish Environment Institute 21 | 2006
Emissions from solids formation processes are ammonium nitrate particulate matter and ammonia. The sources of primary importance are prill towers (for high density and low density prills) and granulators (rotary drum and pan). Emissions from prill towers result from carryover of fine particles and fume by the prill cooling air flowing through the tower. These fine particles are from microprill formation, from attrition of prills colliding with the tower or with one another, and from rapid transition of the ammonia nitrate between crystal states. The uncontrolled particulate emissions from prill towers, therefore, are affected by tower airflow, spray melt temperature, condition and type of melt spray device, air temperature, and crystal state changes of the solid prills. The amount of microprill mass that can be entrained in the prill tower exhaust is determined by the tower air velocity. (EPA 199�)
Increasing spray melt temperature causes an increase in the amount of gas-phase ammonium nitrate generated. Thus, gaseous emissions from high density prilling are greater than from low density towers. (EPA 199�)
Sulphur Acid
The contact process incorporates � basic operations, each of which corresponds to a distinct chemical reaction. First, the sulfur in the feedstock is oxidized (burned) to sulfur dioxide (SO2):The resulting sulfur dioxide is fed to a process unit called a converter, where it is catalytically oxidized to sulfur trioxide (SO�):Finally, the sulfur trioxide is absorbed in a strong 9� percent sulfuric acid solution: Nearly all the acid mist emitted from sulfuric acid manufacturing can be traced to the absorber exit gases. Acid mist is created when sulfur trioxide combines with water vapor at a temperature below the dew point of sulfur trioxide. Once formed within the process system, this mist is so stable that only a small quantity can be removed in the absorber. (EPA 199�)
In general, the quantity and particle size distribution of acid mist are dependent on the type of sulfur feedstock used, the strength of acid produced, and the conditions in the absorber. Because it contains virtually no water vapor, bright elemental sulfur produces little acid mist when burned. However, the hydrocarbon impurities in other feedstocks (i. e., dark sulfur, spent acid, and hydrogen sulfide) oxidize to water vapor during combustion. The water vapor, in turn, combines with sulphur trioxide as the gas cools in the system. (EPA 199�)
Cement production
The heart of the cement manufacturing process is the pyroprocessing system. This system transforms the raw mix into clinkers. The chemical reactions and physical processes that constitute the transformation are quite complex, but they can be viewed conceptually as the following sequential events:
1. Evaporation of free water;2. Evolution of combined water in the argillaceous components;�. Calcination of the calcium carbonate (CaCO�) to calcium oxide (CaO);�. Reaction of CaO with silica to form dicalcium silicate;5. Reaction of CaO with the aluminum and iron-bearing constituents to form the
liquid phase;�. Formation of the clinker nodules;�. Evaporation of volatile constituents (e. g., sodium, potassium, chlorides, and
sulfates) and�. Reaction of excess CaO with dicalcium silicate to form tricalcium silicate.

1� Reports of Finnish Environment Institute 21 | 2006
This sequence of events may be conveniently divided into four stages, as a function of location and temperature of the materials in the rotary kiln.
1. Evaporation of uncombined water from raw materials, as material temperature increases to 100°C;
2. Dehydration, as the material temperature increases from 100°C to approximately ��0°C to form oxides of silicon, aluminum, and iron;
�. Calcination, during which carbon dioxide (CO2) is evolved, between 900°C (1�50°F) and 9�2°C to form CaO; and
�. Reaction, of the oxides in the burning zone of the rotary kiln, to form cement clinker at temperatures of approximately 1510°C.
The raw material mix enters the kiln at the elevated end, and the combustion fuels generally are introduced into the lower end of the kiln in a countercurrent manner. The materials are continuously and slowly moved to the lower end by rotation of the kiln. As they move down the kiln, the raw materials are changed to cementitious or hydraulic minerals as a result of the increasing temperature within the kiln. The most commonly used kiln fuels are coal, natural gas, and occasionally oil. The use of supplemental fuels such as waste solvents, scrap rubber, and petroleum coke has expanded in recent years. (EPA 199�)
There are five different processes are used in the cement industry, but in Finland processes are dry processes equipped with a pre heater.
Dry process pyroprocessing systems have been improved in thermal efficiency and productive capacity through the addition of one or more cyclone-type pre heater vessels in the gas stream exiting the rotary kiln. This system is called the pre heater process. In Finnish processes there are � to 5-stage pre heaters with inline calciner and cooler. Hot exhaust gases from the rotary kiln pass counter currently through the downward-moving raw materials in the pre heater vessels. (EPA 199�)
Lime production
The basic processes in the production of lime are: (1) quarrying raw limestone; (2) preparing limestone for the kilns by crushing and sizing; (�) calcining limestone; (�) processing the lime further by hydrating; and (5) miscellaneous transfer, storage, and handling operations. (EPA 199�)
The heart of a lime plant is the kiln. This kiln is a long, cylindrical, slightly inclined, refractory-lined furnace, through which the limestone and hot combustion gases pass counter currently. Coal, oil, and natural gas may all be fired in rotary kilns. Product coolers and kiln feed preheaters of various types are commonly used to recover heat from the hot lime product and hot exhaust gases, respectively. (EPA 199�)
The largest ducted source of pm is the kiln. The properties of the limestone feed and the ash content of the coal (in coal-fired kilns) can significantly affect PM emission rates.(EPA 199�).
Mineral processing
Metallic mineral processing typically involves the mining of ore from either open pit or underground mines; the crushing and grinding of ore; the separation of valuable minerals from matrix rock through various concentration steps; and at some operations, the drying, calcining, or pelletizing of concentrates to ease further handling and refining. The concentrated mineral products may be dried to remove surface moisture. Drying is most frequently done in natural gas-fired rotary dryers.
1�Reports of Finnish Environment Institute 21 | 2006
Calcining or pelletizing of some products, such as alumina or iron concentrates, is also performed (EPA 199�)
Particle emissions occur from a number of operations in stone quarrying and processing. A substantial portion of these emissions consists of heavy particles that may settle out within the plant. As in other operations, crushed stone emission sources may be categorized as either process sources or fugitive dust sources. Process sources include those for which emissions are amenable to capture and subsequent control. Fugitive dust sources generally involve the re-entrainment of settled dust by wind or machine movement. Emissions from process sources should be considered fugitive unless the sources are vented to a baghouse or are contained in an enclosure with a forced-air vent or stack. Factors affecting emissions from either source category include the stone size distribution and the surface moisture content of the stone processed, the process throughput rate, the type of equipment and operating practices used, and topographical and climatic factors. (EPA 199�)
Wood pulping limekilns, smelt dissolving tanks.
Wood pulping limekilns are cylinder shape rotary kilns, A lime kiln calcines lime mud to reactive lime by drying and subsequent heating. A furnace is brick-lined with 2-� meter diameter and it is 20-150 meter long. Furnace is working with upstream principle, where burners are situated on the lower end of kiln and flue gases leave from upper end to flue gas cleaning.
After recovery boiler smelt from reduced black liquor is dissolved in lime mud wash the resulting solution is referred to as “green liquor”. The dust emitted from lime kiln is generated by two main mechanisms. One part of the lime mud is not transformed into calsium oxide, which results dust being formed. The other mechanism is a vaporizing of sodium thet is present due to poor washing of lime mud. (Projekti-Insinöörit Oy 199�) Particle emissions from lime kiln are CaO dust and fumes from dissolving tank vent are different natrium compounds such as Na2S, Na2CO�, Na2SO� and NaCl. (Hocking 2005)
Plywood and chip board production
The manufacture of softwood or hardwood plywood consists of nine main processes: log storage, log debarking and bucking, heating the logs, peeling the logs into veneers, drying the veneers, gluing the veneers together, pressing the veneers in a hot press, plywood cutting, and other finishing processes such as sanding. The initial step of debarking is accomplished by feeding logs through one of several types of debarking machines. The purpose of this operation is to remove the outer bark of the tree without substantially damaging the wood. After the bark is removed, the logs are cut to appropriate lengths in a step known as bucking.
The logs (now referred to as blocks) then are heated to improve the cutting action of the veneer lathe or slicer, thereby generating a product from the lathe or slicer with better surface finish. Blocks are heated to around 9�°C using a variety of methods--hot water baths, steam heat, hot water spray, or a combination of the three. After heating, the logs are processed to generate veneer. For most applications, a veneer lathe is used, but some decorative, high quality veneer is generated with a veneer slicer. (EPA 199�)
Veneers are taken from the clipper to a veneer dryer where they are dried to moisture contents that range from around 1 to 15 percent, dry basis. Face veneer moisture contents can range up to 25 percent, dry basis. Target moisture content

1� Reports of Finnish Environment Institute 21 | 2006
depends on the type of resin used in subsequent gluing steps. The typical drying temperature ranges from 150° to 200°C.(EPA 199�)
Operations such as log chipping, in addition to chip piles and bins, and chip handling systems generate particulate matter emissions in the form of sawdust and wood particles. (EPA 199�)
Glass wool and fibre production
Glass fibre manufacturing is the high-temperature conversion of various raw materials into a homogeneous melt, followed by the fabrication of this melt into glass fibers. The two basic types of glass fibre products, textile and wool, are manufactured by similar processes. Glass fibre production can be segmented into � phases: raw materials handling, glass melting and refining, and wool glass fibre forming and finishing, this last phase being slightly different for textile and wool glass fibre production. (EPA 199�)
Wool dissolves insulation production lines usually consist of the following processes: (1) preparation of molten glass, (2) formation of fibers into a wool dissolves mat, (�) curing the binder-coated dissolves mat, (�) cooling the mat, and (5) backing, cutting, and packaging the insulation. (EPA 199�)
Emissions generated during the manufacture of wool fiberglass insulation include solid particles of glass and binder resin, droplets of binder, and components of the binder that have vaporized. Glass particles may be entrained in the exhaust gas stream during forming, curing, or cooling operations. Test data show that approximately 99 percent of the total emissions from the production line are emitted from the forming and curing sections. Even though cooling emissions are negligible at some plants, cooling emissions at others may include fugitives from the curing section. This commingling of emissions occurs because fugitive emissions from the open terminal end of the curing oven may be induced into the cooling exhaust ductwork and be discharged into the atmosphere. Solid particles of resin may be entrained in the gas stream in either the curing or cooling sections. (EPA 199�)
Droplets of organic binder may be entrained in the gas stream in the forming section or may be a result of condensation of gaseous pollutants as the gas stream is cooled. Some of the liquid binder used in the forming section is vaporized by the elevated temperatures in the forming and curing processes. Much of the vaporized material will condense when the gas stream cools in the ductwork or in the emission control device. (EPA 199�)

19Reports of Finnish Environment Institute 21 | 2006
Methodology and data sources
The aim of this study was to refine and update the calculation of non-fuel process industry in FRES model. The main data sources were VAHTI- databases (Korkia-aho et al. 1995), literature sources and contacts with industry. Primary emission and activity data was got from VAHTI- database. More detailed fine tuning and estimations of PM size distributions was based on literature study and correspondence with industry and local environment officials. Results calculated in this study were compared and later updated to RAINS model data of IIASA (Klimont et al. 2002).
The Finnish Regional Emission Scenario (FRES) model
The Finnish Regional Emission Scenario (FRES) model has been developed to work as a part of the integrated assessment model (IAM) system of air pollution (Figure 1). FRES model includes the annual emission calculation of primary particles in different size classes (total suspended particles TSP, and fine particles PM10, PM2.5 and PM1), and precursor gases of secondary PM (SO2, NOx, NH� and NMVOCs). In addition, the estimates of primary PM chemical composition have been added to the model lately, including black and organic carbon and sulphates. Furthermore, the additions of particulate main heavy metals and gaseous mercury (Hg) are going on at the moment. This study is part of that FRES development work concentrating on updating technical description of industrial process plants.
Figure 1. The schematic description of integrated assessment model (IAM) system of air pollution.

20 Reports of Finnish Environment Institute 21 | 2006
The basic structure of the FRES model is a combined top-down approach of aggregated emission source sector description with more detailed bottom-up calculation of large point sources. The top-down feature makes a relatively light model structure possible, while the annual activity rate inputs of the source sectors are described in a relatively aggregated level. Large point sources and their emission control facilities are described in more technical detail, which enables the estimation of emissions more accurately both spatially and in the terms of emission quantities.
Large energy production and industrial plants (i.e. plants utilizing boilers with thermal capacity exceeding 50 MWth or plants with emissions >20 Mg(PM, SO2 or NOx) a-1) are described as point sources. Point source emissions are located at actual stack height and geographical coordinates. The main features of the model are presented in the following. A more detailed description with the data sources of calculation parameters can be found from Karvosenoja et al. (200�), Karvosenoja and Johansson (200�), Karvosenoja et al. (2002) and Karvosenoja (2001).
Point source emission emp is calculated from the annual activity rate ap, the plant specific unabated emission factor ef (i.e. the emission factor before emission control devices) and the emission removal efficiency η of the emission control technologies used in the plant.
where t = time, i = pollutant, j = fuel/activity, k = sector, l = control technology and m = plant.
The activity data in 2000 of plants were based on the data register on air pollutant permits of the Finnish environment administration VAHTI (Korkia-aho et al. 1995) containing technical and emission information on Finnish industrial plants.
Average emission factors were calculated from average emissions between years 1995-200� derived from VAHTI, so that emission factors would present typical average value. In unclear cases (for example yearly emission factor varied significantly) technical experts of this point source was approached and a help provided by industry sources usually solved problem of inconsistency. PM emission factors of fine particles were calculated from TSP emission factors and fine particle fractions PM10/TSP and PM2.5/TSP derived based on literature survey reported in Karvosenoja et al. (2002) and refinements of this study.
The emission removal effienciences for PM of various control technologies are different for different particle size ranges (see Table 1). The emission removal efficiencies of various control technologies were determined using information from the literature reported mainly in Karvosenoja (2001) and Klimont et al. (2002).
Data on the utilization of emission abatement options/equipment in application were collected from the databases of Finnish environment institute, VAHTI (Korkia-aho et al. 1995), available company information (environmental reports, etc) or via e-mail from companies. In some cases, no information was found and no control situation was alleged.
Table 1 Removal efficiencies used in calculations for different particle fractions.
Application PM10plus PM2.5plus PM2.5
1 stage electrostatic precipitator ESP1 97.00% 95.00% 93.00%
2-3 stage electrostatic precipitator ESP2 99.90% 99.00% 96.00%
electrostatic precipitator with scrubber ESP+ 99.95% 99.70% 99.00%
fabric filter FABR 99.90% 99.70% 99.70%
Wet scrubber WSCR 99.90% 99.00% 96.00%
Multicyclone CYCL 90.00% 70.00% 50.00%

21Reports of Finnish Environment Institute 21 | 2006
PM Control Options
Cyclones / multi-cyclones
Cyclones and multi-cyclones are typically used in relatively small plants and/or with low concentrations of fine PM. Removal efficiencies are relatively high for coarse particles, but decrease sharply for fine particles (Flagan and Seinfeld 19��).
Electrostatic precipitators (ESPs)
The most typical devices in large plants are electrostatic precipitators (ESPs) that can be used to high PM concentrations with low pressure drop. Removal efficiencies are high, up to 99.9% for coarse particles, but lower, around 9�%, for fine particles at a size range of about 0.1-�.0 µm (e.g. Mohr et al. 199�, Ylätalo and Hautanen 199�). ESP use combined with some other emission reductions, e.g. flue gas desulphurization techniques result in considerably lower emissions than using only ESP.
ESPs combined with other emission reduction technologies decreasing particulate emissions, e.g. flue gas desulphurization techniques (in text as ESP+)
Wet scrubbers
In wet scrubbers, the flue gas enters a large vessel (spray tower or absorber), where it is sprayed with water slurry (approximately 10 percent lime or limestone). This is measure primary meant SO2 control. The calcium in the slurry reacts with the SO2 to form calcium sulfite or calcium sulfate. (EPA) Althought not as Wet scrubbers are able to effectively remove fine particles and also certain gaseous components from a gas stream by selecting a proper washing liquid. (Zevenhoven and Kilpinen 2002) In wet scrubbers, the flue gas enters a large vessel (spray tower or absorber), where it is sprayed with water slurry (approximately 10 percent lime or limestone or other reactant). The calcium in the slurry reacts with the SO2 to form calcium sulfite or calcium sulfate. A portion of the slurry from the reaction tank is pumped into the thickener, where the solids settle before going to a filter for final dewatering to about 50 percent solids. (Zevenhoven and Kilpinen 2002 In recovery boilers are equipped scrubbers that are based aborption in an alkali solution. The highest reduction rates are reached with a soluble alkali such as sodium hydroxide or carbonate. (Projekti-insinöörit Oy 199�)
Fabric filters
Fabric filters are more equally efficient for all particle sizes with removal efficiencies up to 99.� - 99.9% (Ohlström et al. 2005). Fabric filters are competitive in investment, but retain higher pressure loss and maintenance need than ESPs. Fabric filters bags need to be changes every 2 or � years. Furthermore, high moisture content or temperature of flue gases might restrict applicability. If filter is working in high temperature, the cost of the filter material is high. For example glass wool can be used up to 290°C. Newer materials such as Teflon tolerate also acids, but highest use temperature is 250°C. Ammonium emissions and high sulfur content of processed materials/fuels are also harmful for fabric filter. High temperature filters are made from ceramic or metal based fabrics. These can be used up to 1000°C. (Ohlström et al. 2005)

22 Reports of Finnish Environment Institute 21 | 2006
Removal efficiencies of different control technologies
Different emission control technologies have different removal efficiencies. The removal efficiencies of control technologies vary also as a function of particle sizes. Control technology dependent removal efficiencies were estimated for the size classes 0-2.5 µm, 2.5-10 µm and >10 µm using available literature (Table 1).
PM size distribution
The PM size distributions PM10/TSP and PM2.5/TSP were estimated using particle size distribution data drawn from literature reported in Karvosenoja et al. (2002), faculty specific measurements or other refinements of this study. The PM size distributions used in calculations are presented in Table 2. In case only “controlled” distribution was available, unabated distribution was calculated using size distribution and efficiency of used control technology (see Table 1).
Table 2 The “unabated” PM size distributions used in calculations.
PM10/TSP, unabated
PM2.5/TSP unabated
Oil refineries1 98 79
Coking plants2 25 22
Sintering plants3 32 6
Blast furnaces2 24 15
Basic oxygen furnace2 46 22
Electric arc foundries2 58 43
Zinc production2 92 82
Casthouse2 49 24
Secondary aluminium production2 60 60
Fertilizer production1 60 36
Cement production2 42 18
Lime and mineral production2 12 1
Wood pulping limekilns, smelt dissolve.2 17 11
Plywood and chip board production4 18 0
Glass wool production2 75 53
1Klimont et al. 2002, 2Passant et al 1999, �Lerssi, P. 200�, �EPA 199�
2�Reports of Finnish Environment Institute 21 | 2006
Results and discussion
PM Emissions in 2000
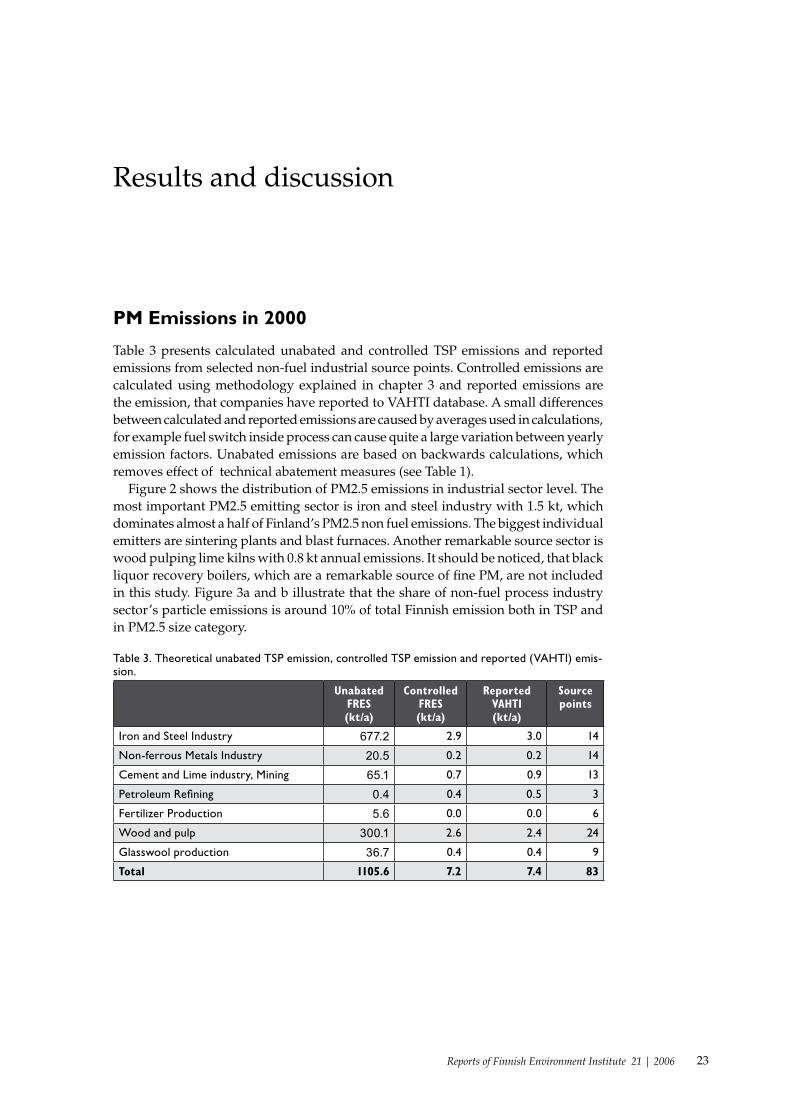
Table � presents calculated unabated and controlled TSP emissions and reported emissions from selected non-fuel industrial source points. Controlled emissions are calculated using methodology explained in chapter � and reported emissions are the emission, that companies have reported to VAHTI database. A small differences between calculated and reported emissions are caused by averages used in calculations, for example fuel switch inside process can cause quite a large variation between yearly emission factors. Unabated emissions are based on backwards calculations, which removes effect of technical abatement measures (see Table 1).
Figure 2 shows the distribution of PM2.5 emissions in industrial sector level. The most important PM2.5 emitting sector is iron and steel industry with 1.5 kt, which dominates almost a half of Finland’s PM2.5 non fuel emissions. The biggest individual emitters are sintering plants and blast furnaces. Another remarkable source sector is wood pulping lime kilns with 0.� kt annual emissions. It should be noticed, that black liquor recovery boilers, which are a remarkable source of fine PM, are not included in this study. Figure �a and b illustrate that the share of non-fuel process industry sector’s particle emissions is around 10% of total Finnish emission both in TSP and in PM2.5 size category.
Table 3. Theoretical unabated TSP emission, controlled TSP emission and reported (VAHTI) emis-sion.
UnabatedFRES(kt/a)
ControlledFRES(kt/a)
ReportedVAHTI(kt/a)
Sourcepoints
Iron and Steel Industry 677.2 2.9 3.0 14
Non-ferrous Metals Industry 20.5 0.2 0.2 14
Cement and Lime industry, Mining 65.1 0.7 0.9 13
Petroleum Refining 0.4 0.4 0.5 3
Fertilizer Production 5.6 0.0 0.0 6
Wood and pulp 300.1 2.6 2.4 24
Glasswool production 36.7 0.4 0.4 9
Total 1105.6 7.2 7.4 83

2� Reports of Finnish Environment Institute 21 | 2006
Figure3. (a) TSP and (b) PM2.5 emissions from non-fuel industrial processes compared to other PM emission sources in Finland in year 2000. PP & IN is power plant and industrial combustion, DOM domestic combustion, TRA is traffic and machinery.
Figure 2. Percentage values of calculated PM2.5 emissions in Finland in 2000 of total emission of 3.2kt .

25Reports of Finnish Environment Institute 21 | 2006
Spatial distribution of emissions
Figure 4a-c. Spatial distribution of TSP, PM10 and PM2.5 emissions from non-fuel industrial pro-cesses in Finland in year 2000.
Figure � a-c presents spatial distribution of TSP, PM10 and PM2.5 emissions from non-fuel industrial processes. There are only a few emission spots, where yearly PM2.5 emissions exceeds 500 tons.
Comparison to RAINS model
Results were compared to other calculations using same methodology (activity, emission factor, technology). In this study results were compared to RAINS calculations, where sector specific emission factors are used. Table � compares TSP, PM10 and PM2.5 emissions to RAINS- calculations. In RAINS the calculation takes aggregated to a sector specific level, where all certain process types have uniform emission factor, which is used to multiply sector specific activity (for example amount of cement manufactured in Finland in year 2000).

2� Reports of Finnish Environment Institute 21 | 2006
Table 4 PM emissions from different process types in year 2000 in Finland and comparison to RAINS data (2005 data based on KIO2 scenario)
TSPFRES
(kton)
TSP RAINS (kton)
PM10 FRES
(kton)
PM10 RAINS (kton)
PM2.5 FRES
(kton)
PM2.5 RAINS (kton)
Source points (FRES)
Oil refineries 0.4 0.1 0.4 0.1 0.3 0.1 3
Coking plants 0.3 0.2 0.1 0.1 0.1 0.1 1
Sintering plants 1.4 1.5 1.2 0.3 0.6 0.2 2
Blast furnaces 0.7 1.9 0.6 0.3 0.5 0.2 2
Basic oxygen furnace 0.6 0.8 0.4 0.7 0.3 0.6 3
Electric arc foundries 0.1 0.4 0.1 0.3 0.1 0.3 3
Zinc production 0.0 0.0 0.0 2
Casthouse 0.2 0.2 0.1 0.1 0.1 0.1 13
Secondary aluminium production
0.0 0.0 0.0 1
Fertilizer production 0.0 1.4 0.0 1.1 0.0 0.8 6
Cement production 0.2 0.4 0.1 0.4 0.1 0.3 2
Lime production 0.3 0.0 0.1 0.0 0.0 0.0 6
Mining and mineral pro-duction
0.2 0.0 0.1 0.0 0.0 0.0 6
Wood pulping limekilns, smelt dissolv.
1.3 0.9 0.8 15
Plywood and chip board production
1.3 0.3 0.0 8
Glass wool production 0.4 0.0 0.4 0.0 0.4 0.0 10
Other process emissions from large source points (RAINS)
0.2 0.2 0.2
Total 7.4 6.7 4.8 3.6 3.2 2.9 83
As from the Table � can be noticed, the estimates calculated with RAINS methodology are relatively convergent with FRES estimates. The most significant differences can be found in emission estimates from sintering plants, fertilizer production and pulp and wood industries sectors. Differences in emissions from sinters are probably caused by high fugitive emissions estimated in RAINS calculations which result in different assumption in PM size distribution.
The most interesting differences are in fertilizer sector, where almost none emissions are reported from Finnish plants, but RAINS calculations show relatively high emission volumes. The main difference is the emission factor, which is much lower in FRES than in RAINS- model.
RAINS data is validated by country experts during yearly bilateral consultations. The results of this study will be used, as far as possible in future consultations in order to update the RAINS model data.
Emission reduction potential for TSP and PM2.5
Table 5 shows actual (controlled) emissions from selected point sources. Table 5 also shows how much emissions would be in maximal theoretical control situation and in totally unabated situation. In all cases fabric filter was used as a reference to maximum reduction technology. However use of fabric filter may not always be a technically feasible solution. There where plenty of source points that emit less than 50 TSP ton/a but were included to FRES model as point sources because of their high emissions of other air pollutants (such as heavy metals, SO2 or NOx).

2�Reports of Finnish Environment Institute 21 | 2006
Table 5 Actual and unabated TSP emissions from different actual TSP emitting category sources.
TSP ton/a controlled
number of
emitters
Unabated kton (TSP)
Controlled 2000 kton
(TSP)
Controlled 2000 kton (PM2.5)
Controlled theoretical maximum kton (TSP)
Controlled theoretical maximum
kton (PM2.5)
>300 4 330.9 3.0 1.3 0.7 0.3300-100 14 382.0 2.7 1.1 0.3 0.2100-50 10 328.0 0.7 0.3 0.3 0.2<50 55 64.8 0.8 0.4 0.2 0.1Total 83 1105.6 7.2 3.1 1.5 0.8
Table 6 Number of emitters (as point sources) in different emitting categories according to their process sources.
>300kt
TSP/a
300-100kt
TSP/a
100-50kt
TSP/a
<50kt
TSP/a
Total
Iron and Steel Industry 2 3 1 8 14Non-ferrous Metals Industry 0 1 1 12 14Cement and Lime industry, Mining 0 2 3 8 13Petroleum Refining 0 2 0 1 3Fertilizer Production 0 0 0 6 6Wood and pulp 2 6 3 13 24Glasswool production 0 1 2 6 9Total 4 15 10 54 83
As from the Table 5 can be noticed, emission reduction potential is limited on industrial non-fuel sectors. Table � shows that the largest individual emitters (emitting point sources) are from iron and steel industry and from wood and pulp industry. All the major emitters had already invested to efficient flue gas cleaning systems, however, there is still possibility to reduce more than �0% of current PM2.5 emissions. The most of PM2.5 emissions are emitted by the 1� largest point sources and the biggest abatement potential lies also in these sources. This is due to a significant improvement in abatement level for smaller particle fractions. For example if ESP2 is changed to fabric filter, it has better removal efficiency for smaller (<PM2.5) fractions (see Table 1) and in this way it is favourable for processes that emit mainly very small particles. As from table 2 can be noticed, particle size distribution vary greatly from process to another and usefulness of more efficient flue gas cleaning system is depending of this distribution.
Technical limitations can affect to a possibility to install better flue gas cleaning equipment into these faculties. These possible limitations or problems can cause for example, that certain technique is not feasible for certain process or simply the is no space of larger flue gas cleaning system. For example it is not very feasible to combine fabric filter and wet scrubber to same system. A flue gas properties can also be such that it would be impossible or too expensive option to install theoretically more efficient flue gas cleaning system. These limitations were not taken into account in this work.
Discussion on emission uncertainties
There are still many uncertainties in estimating emissions from industrial sources. One fundamental uncertainty is linked to approach, which stress the importance of correctness of reported emission data. Firstly it is sometimes unclear, how operators
2� Reports of Finnish Environment Institute 21 | 2006
are estimating or measuring their particle emissions and how these are reported to VAHTI data register. Second problem with use of VAHTI as the only data source is that the most of the plants don’t report fugitive emissions or at least they don’t do it separately from reported stack emissions. If reported fugitive emissions are included to stack emission, this affects to accuracy of estimations of particle size distribution and control potential. Fugitive (or in some literature sources diffusive emissions) emissions are emissions, that are not cleaned by a flue gas cleaning system, but they escape to environment for example through ventilation system. These types of emissions can count around �0% of total particle emissions from a plant (Doorn and Kimmel 200�) and affect remarkable to working conditions inside the plant. This kind of emissions are usually hard to control with conventional technical measures described in chapter �. It is difficult to create an accurate estimation methodology of volume of these emissions. Typical example sources for fugitive emissions are between change of process stages, tapping and charging. Fugitive emissions can also occur as a dust from raw material pile-ups or during control equipment malfunction. Physical and chemical composition of fugitive emissions are strongly process dependent, but typically they are mainly coarse particles.
Most of the size distribution percentages used in this study were based on measurements that do not necessarily correspond to the condition of the point sources where they were used on. There are also in some sectors significant differences in approach of defining particle emissions, mainly through misunderstanding or lack of knowledge. Some companies can estimate only very coarse particles (like coarse dust) to emissions due a misunderstanding the definition of a particle emission.
Methodology used in calculations is accurate only if all reported emissions were measured from the stack and reflect total emissions from examined process. If some part of reported emissions is caused by malfunction of process or control equipment and reported in context of sources “normal” emissions, estimation of control potential would be inaccurate. If existing flue gas gleaning device for certain point source would have been left out from calculations because the lack of information, PM10 and PM2.5 emissions estimates would be too low.

29Reports of Finnish Environment Institute 21 | 2006
Conclusions and future work
In this work particulate matter (PM) emissions from non-fuel process industry sources were studied. The technical description of the most important plants in the FRES model were refined and emission factor and size distribution information was reviewed.
Emissions from non-fuel industrial sources account approximately 10% of total TSP and PM 2.5 emissions in Finland. In general PM emissions from process emission sources are reduced significantly from unabated situation, however, non fuel process emissions in some areas are relatively high and there is still emission reduction potential.
The results of this study were compared with respective RAINS estimates. The most significant differences between estimations in this work and RAINS calculations were perceived in fertilizer manufacturing, chip board production and pulp industry’s lime kilns. Although these differences overrule each other while calculating Finland’s total TSP and PM2.5 emissions, these sectors should be taken specially into account while carrying out national RAINS emissions review process
There were several sources of emission uncertainty detected, e.g. estimation of fugitive emissions and companies reporting practices.
It is important to continue study health effects of non fuel process emissions by combining them to other emission sources, atmospheric transport, and population exposure on critical areas. This type of activity has been carried out in KOPRA- project (An integrated model for evaluating the emissions, atmospheric dispersion and risks caused by ambient air fine particulate matter, 2002-2005) that developed an integrated PM model system for both regional and local levels in Finland The FRES model is used in KOPRA to estimate current and future emissions, emission reduction potential and reduction costs at regional level (Karvosenoja et al. 200�).
Future work on industrial sources will include adding of trace element emissions to FRES. Preliminary results are already published (Tohka and Karvosenoja 2005), but more detailed approach is necessary in order to obtain clearer picture of relation between trace element amounts in particulate matter. Chemical composition analysis of particles from different process sources would help to evaluate harmfulness of different size classes from different sources. It is also important to develop the estimation methodology for fugitive emissions from non fuel industrial sources.

�0 Reports of Finnish Environment Institute 21 | 2006
References
Anderson R., Atkinson R., Peacock J., Marston L. and Konstantinou K., Meta-analysis of time-series studies and panel studies of Particulate Matter (PM) and Ozone (O�) Department of Community Health Sciences, Epidemiology, St. George’s Hospital Medical School, London, United Kingdom, 2005
Flagan R. C. and Seinfeld J. H. 19��. Fundamentals of air pollution engineering. New Jersey, USA, Pren-tice-Hall, Inc. 5�2 pp.
Fugleberg S. Finnish expert report on best available techniques in zinc production. The Finnish Envi-ronment �15.
EEA, European Environment Agency, Europe and Health, EEA Report number 10/2005,�0p, http://re-ports.eea.europa.eu/eea_report_2005_10/en/EEA_report_10_2005.pdf
EPA (Environmental Protection Agency) (199�a) Compilation of Air Pollutant Emisson Factors AP �2, Volume I, Fifth Edition. United States Environmental Protection Agency. Research Triangle Park, North Carolina, U.S.
Hocking M. Handbook of Chemical Technology and Pollution Control, Department of Chemistry, Uni-versity of Victoria, Canada, �00p.
Hästbacka K., Arina A., Haapalinna H., Kytökivi A., Komi R. (editors), Neste öljystä muoveihin. Toim. Neste, Espoo, 1992. (in Finnish)
Karvosenoja N, Klimont Z, Tohka A, Johansson M. 200�. Fine primary particle emission reduction po-tential and cost efficiency in Finland. Manuscript
Karvosenoja N. and Johansson M. 200�. The Finnish Regional Emission Scenario model – a base year calculation. Proceedings of Air Pollution XI Conference, Catania, Italy, pp. �15-�2�.
Karvosenoja, N. Johansson, M. Kupiainen, K. 2002. The Importance of Primary Particulate Emissions from Non-Combustion Sources in Finland. Conference paper New Zeeland 2002
Karvosenoja N. 2001. Primary particulate emissions from stationary combustion processes in Finland. Finnish Environment Institute Mimeograph 2�2. Helsinki, Finland, Finnish Environment Institute.
Klimont, Z. Cofala, J. Bertok, I. Amann, M. Heyes, C. Gyarfas, F. 2002, Modelling Particulate Emissions in Europe- A Framework to Estimate Reduction Potential and Control Costs. 2002. IIASA Interim Report IR-02-0��, Laxenburg, Austria.
Korkia-aho, S. Koski, O. Meriläinen, T. Nurmio, M. 1995. VAHTI description. West Finland Regional Environmental Centre 29.9.1995, Memorandum. (In Finnish)
Lerssi, P. environmental manager Rautaruukki Raahe, personal communication through emailMetallinjalostajat ry, Teräskirja �:th pressing, 200� (in Finnish) Mohr M., Ylätalo S., Knippel N., Kauppinen E. I., Riccius O. and Burtscher H. 199�. Submicron Fly Ash
Penetration Through Electrostatic Precipitator at Two Coal Power Plants. Aerosol Science and Technolo-gy 2�:191-20�.
Ohlström M, Tsupari E., Lehtilä A. Raunemaa T. Pienhiukkaspäästöt ja niiden vähentämismahdollisuu-det Suomessa – Kasvihuonekaasujen rajoittamisen vaikutukset, VTT Tiedotteita 2�00, 91p, 2005
Olmez, I. Sheffield, A.E. Gordon, G.E., Houck, J.E. Pritchett, L.C., Cooper, J.A., Dzubay, T.G., Bennett, R.L. 19��. Composition of Particles from Selected Sources in Philadelphia Modelling Applications. Journal of Air Pollution Control Association. JAPCA ��: 1�92-1�02 (19��).
Riekkola-Vanhanen 1999a Finnish expert report on best available techniques in ferrochromium produc-tion. The Finnish Environment �1�.
Riekkola-Vanhanen 1999b Finnish expert report on best available techniques in copper production and by-production of precious metals The Finnish Environment �1�.
Zevenhoven R., Kilpinen P. Control of pollutants in flue gases and fuel gases (2:nd edition), Energy Engineering and Environmental Protection Publications, TKK-ENY-�, Espoo 2002
�1Reports of Finnish Environment Institute 21 | 2006
DOCUMENTATION PAGE
Publisher Finnish Environment Institute (SYKE) DateNovember 2006
Author(s) Antti Tohka and Niko Karvosenoja
Title of publication Fine particle emissions and emission reduction potential in Finnish industrial processes
Publication seriesand number
Reports of Finnish Environment Institute 21/2006
Theme of publication
Parts of publication/other projectpublications
The publication is available in the Internet:www.environment.fi/publications
Abstract Particulate matter (PM) and trace elements in ambient air has been associated with human health effects. Com-bustion of fuels is the most important source for these emissions in Finland. However, the role and magnitude of particle emissions from non-fuel activities in the industrial sector has been studied only superficially.
In this study the Finnish primary emissions of, total suspended particles (TSP) and finer particle fractions PM10 and PM2.5 were calculated for industrial non-fuel sources in 2000 using the Finnish Regional Emission Scenario (FRES) model. FRES includes the most significant industrial processes described technically and spatially as a individual point sources. The purpose of this study was to review and refine the technical description of the non-fuel processes and their operational control techniques and applicability of further control potential, as well as complement the list of significant sources of emissions. The number of non-fuel point sources after the review was 83.
Process types were divided to 16 sectors including wood pulping lime kilns, various ferrous and non-ferrous metal production sectors, oil refineries, fertilizer manufacturing, plywood and chip board production, glass wool production, cement and lime industry. The emission and control technical information of individual plants were based on VAHTI system and direct contacts with the entrepreneurs. All the results calculated in this study were compared and updated to the RAINS model emission data of IIASA.
Total emissions in 2000 from selected source points were 7.2kton of TSP and 3.1 kton of PM2.5. The most im-portant emitters were iron and steel industry and wood pulping lime kilns, which are together counting for 61% of TSP emissions and 74% of PM2.5 emission. Based on the current use emission control measures, estimates for hypothetical emission reduction potential in 2000 were made. Results show, that even if reduction of total sus-pended particle emissions is already now more than 99% compared to theoretical uncontrolled situation, there is a significant potential for further reduction. Missing technical information and missing information on fugitive emissions are causing uncertainty .
The results of this study are used in the integrated assessment modeling framework developed in KOPRA project in order to link the information of emission reductions, reduction costs, atmospheric dispersion and inducted health impacts.
Keywords fine particles, emission, industrial processes, environmental technology, modeling
Financier/ commissioner
ISBN952-11-2503-9 (pbk.)
ISBN952-11-2504-7 (PDF)
ISSN1796-1718 (print)
ISSN 1796-1726 (online)
No. of pages33
LanguageEnglish
RestrictionsPublic
Price (incl. tax 8 %)
For sale at/distributor
Finnish Environment Institute, Custom service, P.O. Box 140, FIN-00251 Helsinki, Finland Tel. +358 20 490 123, Fax +358 20 490 2190 e-mail: [email protected]
Financierof publication
Finnish Environment Institute, P.O.Box 140, FIN-00251 Helsinki, Finland
Printing place and year
Edita Prima Ltd, Helsinki 2006

�2 Reports of Finnish Environment Institute 21 | 2006
KUVAILULEHTI
Julkaisija Suomen ympäristökeskus (SYKE) JulkaisuaikaMarraskuu 2006
Tekijä(t) Antti Tohka ja Niko Karvosenoja
Julkaisun nimi Fine particle emissions and emission reduction potential in Finnish industrial processes(Teollisuusprosessien pienhiukkaspäästöt ja niiden vähennyspotentiaali Suomessa)
Julkaisusarjan nimi ja numero
Reports of Finnish Environment Institute 21/2006
Julkaisun teema
Julkaisun osat/muut saman projektin tuottamat julkaisut
Julkaisu on saatavana myös Internetistä:www.environment.fi/publications
Tiivistelmä Ilmakehän pienhiukkasten on havaittu aiheuttavan vakavia terveysvaikutuksia. Palamisprosessit ovat tärkein pien-hiukkaslähde Suomessa. Ei-polttoperäisiä prosessipäästöjä on tutkittu mallintamisen näkökulmasta aiemmin vain pintapuolisesti.
Tässä raportissa arvioidaan teollisuuden ei-polttoprosessien hiukkaspäästöjä ja niiden vähennyspotentiaalia. Päästöt laskettiin Finnish Regional Emission Scenario (FRES) mallilla. Työn tarkoituksena oli päästöarvioiden lisäksi päivittää prosesseja koskeva tieto mallissa. Tutkittuja teollisuusprosessityyppiin perustuvia sektoreita oli 16, mukaan lukien meesauunit, kalkin ja sementin valmistus, erilaiset metalliteollisuuden prosessit, öljynjalostamot, lannoitetehtaat, lastulevyjen valmistus ja lasivillan valmistus. Tutkittuja pistelähteitä oli yhteensä 83. Tutkittuja hiukkaskokoluokkia olivat kokonaishiukkaspäästöjen (TSP) lisäksi PM10 ja PM2.5. Laskentadata perustuu VAHTI tietokantaan ja yhteydenottoihin toimijoiden kanssa. Tuloksia verrattiin RAINS- mallin antamiin tuloksiin.
Tutkittujen sektorien kokonaishiukkaspäästöiksi arvioitiin vuonna 2000 7,2 kilotonnia(TSP) ja PM2.5 hiuk-kasten osalta 3,1 kilotonnia. Päästöt vastaavat noin 10% Suomen sekä TSP että PM2.5 päästöistä. Tärkeimpiä päästösektoreita olivat metsäteollisuuden meesauunit ja metalliteollisuus, jotka vastasivat ei-polttoperäisten prosessipäästöjen osalta 61% TSP- päästöistä ja 74% PM2.5 päästöistä. Nykyisiin vähennysmenetelmiin perustuen arvioitiin hypoteettinen vähennyspotentiaali vuoden 2000 päästöille. Verrattuna teoreettiseen kontrolloimat-toman tilanteeseen, nykyinen vähennystilanne oli TSP päästöjen osalta 99%. Vähennyspotentiaali on kuitenkin edelleen merkittävä. Työssä huomioitiin myös, että arvioihin liittyy epätarkkuuksia, jotka johtuvat mm. puuttuvista teknisistä tiedoista ja hajapäästöjen määrän arvioimatta jättämisestä.
Tämän tutkimuksen tuloksia käytetään osana Tekesin ja ympäristöministeriön rahoittamaa projektia KOPRA, jossa yhdistetään tiedot päästövähennyksistä ja -kustannuksista, hiukkasten leviämisestä ja aiheuttamista terveys-vaikutuksista yhtenäiseen mallinnuskehikkoon.
Asiasanat pienhiukkaset, päästöt, teollisuusprosessit, ympäristöteknologia, mallintaminen
Rahoittaja/ toimeksiantaja
ISBN952-11-2503-9 (nid.)
ISBN952-11-2504-7 (PDF)
ISSN1796-1718 (pain.)
ISSN 1796-1726 (verkkoj.)
Sivuja33
KieliEnglanti
LuottamuksellisuusJulkinen
Hinta (sis.alv 8 %)
Julkaisun myynti/ jakaja
Suomen ympäristökeskus (SYKE), asiakaspalvelu, PL 140, 00251 Helsinki puh. 020 490 123, faksi 020 490 2190 e-mail: [email protected]
Julkaisun kustantaja Suomen ympäristökeskus, PL 140, 00251 Helsinki
Painopaikka ja -aika Edita Prima Oy, Helsinki 2006

��Reports of Finnish Environment Institute 21 | 2006
PRESENTATIONSBLAD
Utgivare Finlands miljöcentral (SYKE) DatumNovember 2006
Författare Antti Tohka och Niko Karvosenoja
Publikationens titel Fine particle emissions and emission reduction potential in Finnish industrial processes(Utsläpp av mikropartiklar och minskningpotential i industriprocesser)
Publikationsserieoch nummer
Reports of Finnish Environment Institute 21/2006
Publikationens tema
Publikationens delar/andra publikationerinom samma projekt
Publikationen finns tillgänglig på Internet:www.environment.fi/publications
Sammandrag Atmosfärens mikropartiklar (PM2.5) har förknippats med allvarliga hälsoeffekter. Förbränningsprocesserna är den viktigaste källan till mikropartiklar i Finland. Processutsläpp från andra än källor än förbränning har under-sökts endast ytligt ur modelleringssynpunkt.
I denna rapport beräknas partikelutsläpp från andra källor än förbränning och förutsättningarna att minska dem. Utsläppen kalkylerades med modellen Finnish Regional Emission Scenario (FRES). Syftet med arbetet var att vid sidan om uppskattningar om utsläpp också uppdatera data om processerna i modellen. 16 sektorer, som base-rade sig på typ av industriprocess, undersöktes, inklusive mesaugnar, framställning av kalk och cement, olika proc-esser i metallindustrin, oljeraffinerier, gödselfabriker, framställning av spånskivor och framställning av glasull. 83 punktutsläppskällor undersöktes. Partikelklasser som undersöktes var totalutsläpp (TSP) och PM10 och PM2.5. Kalkyldata baserar sig på databanken VAHTI och på kontakter med andra aktörer. Resultaten jämfördes med dem man fått med RAINS-modellen.
De totala partikelutsläppen (TSP) från de undersökta sektorerna var år 2000 7,2 kiloton, och 3,1 kiloton för PM2.5 partiklarnas del. Utsläppen motsvarar cirka 10 % av Finlands TSP- och PM2.5-utsläpp. De viktigaste ut-släppssektorerna var skogsindustrins mesaugnar och metallindustrin, som stod för 61 % av TSP-utsläppen och 74 % av PM2.5-utsläppen från andra processer än förbränning. Utgående från nuvarande minskningsmetoder uppskattades en hypotetisk minskningspotential för utsläppen år 2000. Jämfört med en teoretisk okontrollerad situation är den nuvarande minskningen för TSP-utsläpp 99 %. Potentialen att minska mera är dock fortfarande betydande. I arbetet togs dessutom i beaktande, att beräkningarna har inexaktheter som beror på bl.a. bristfälliga tekniska data och att diffusa utsläpp inte uppskattades.
Resultaten av denna undersökning används som en del av projektet KOPRA, som finansieras av Tekes och miljöministeriet och där uppgifter om utsläppsminskningar och -kostnader, spridning av partiklar och orsakade hälsoeffekter kombineras i en enhetlig modelleringsram.
Nyckelord mikropartiklar, utsläpp, miljöteknologi, modellering
Finansiär/ uppdragsgivare
ISBN952-11-2503-9 (hft.)
ISBN952-11-2504-7 (PDF)
ISSN1796-1718 (print)
ISSN 1796-1726 (online)
Sidantal33
SpråkEngelska
OffentlighetOffentlig
Pris (inneh. moms 8 %)
Beställningar/ distribution
Finlands miljöcentral (SYKE), kundservice, PB 140, 00251 Helsingfors Tel. +358 20 490 123, Fax +358 20 490 2190 e-mail: [email protected]
Förläggare Finlands miljöcentral, PB 140, 00251 Helsingfors, Finland
Tryckeri/tryckningsortoch -år
Edita Prima Ab, Helsingfors 2006

Finnish Environment Institute
REPORTS OF FINNISH ENVIRONMENT INSTITUTE 21 | 2006
ISBN 952-11-2503-9 (pbk.)
ISBN 952-11-2504-7 (PDF)
ISSN 1796-1718 (print)
ISSN 1796-1726 (online)
FIN
NIS
H E
NV
IRO
NM
EN
T IN
ST
ITU
TE
Fine particle emissions and emission reduction potential in Finnish industrial processes
Antti Tohka and Niko Karvosenoja
FIN
E P
AR
TIc
lE
EM
ISS
ION
S A
ND
EM
ISS
ION
RE
DU
cT
ION
PO
TE
NT
IAl
IN F
INN
ISH
IND
US
TR
IAl
PR
Oc
ES
SE
S


![[3] AirborneSAR PartI](https://static.fdocuments.in/doc/165x107/61f0f26fc60ddc0856045b0c/3-airbornesar-parti.jpg)


