F INANCIAL S TATEMENTS ANALYSIS. Financial Statement Analysis Who analyzes financial statements? –...
35
FINANCIAL STATEMENTS ANALYSIS
-
Upload
alban-oliver -
Category
Documents
-
view
220 -
download
2
Transcript of F INANCIAL S TATEMENTS ANALYSIS. Financial Statement Analysis Who analyzes financial statements? –...
FINANCIAL STATEMENTS ANALYSIS

Financial Statement Analysis
Who analyzes financial statements?
– Internal users i.e., Management, Shareholders,
Internal auditors, Budget Analyst,
– External users• Examples?• Investors, creditors, regulatory agencies & …• stock market analysts, Business analysts,
Financial Analyst, Investment Analyst and • auditors

Financial Statement Analysis
• What do internal users use it for? Planning, evaluating and controlling company
operations
• What do external users use it for? Assessing past performance and current financial
position and making predictions about the future profitability and solvency of the company as well as evaluating the effectiveness of management

Financial Statement Analysis
Information is available from
– Published annual reports • (1) Financial statements• (2) Notes to financial statements• (3) Letters to stockholders• (4) Auditor’s report (Independent accountants)• (5) Management’s discussion and analysis
– Reports filed with the government Taxation Department, SECP.
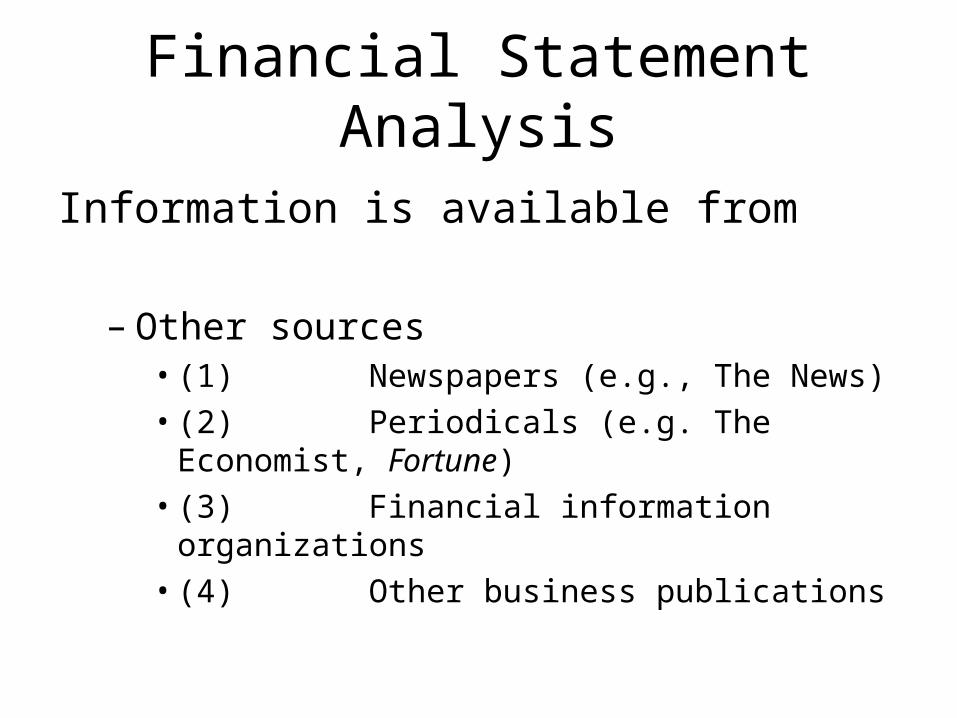
Financial Statement Analysis
Information is available from
– Other sources• (1) Newspapers (e.g., The News)• (2) Periodicals (e.g. The Economist, Fortune)• (3) Financial information organizations• (4) Other business publications
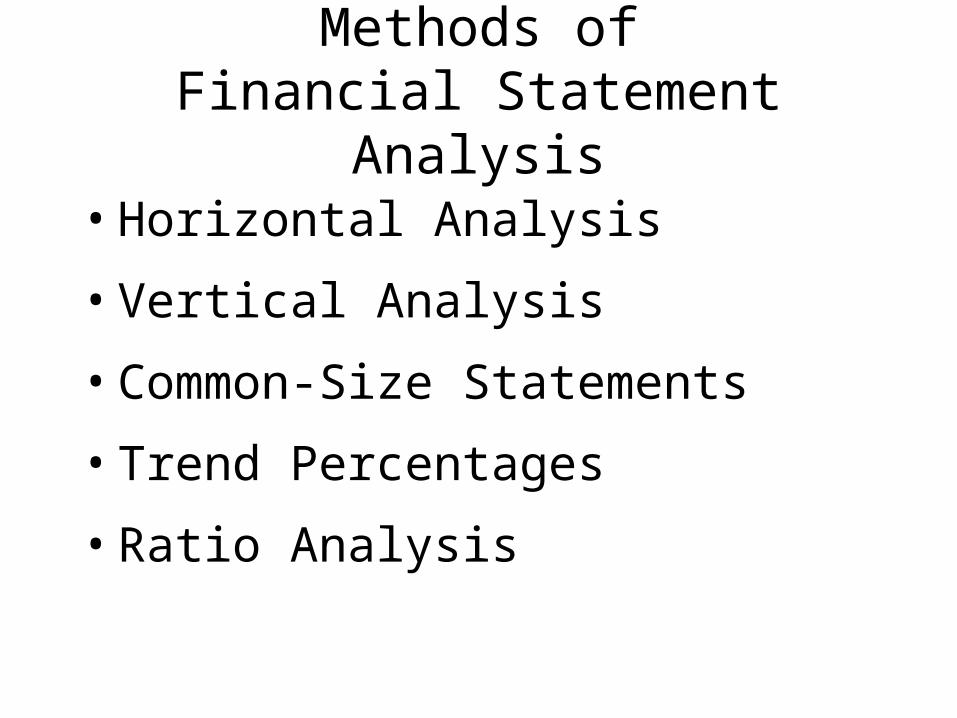
Methods ofFinancial Statement Analysis
• Horizontal Analysis
• Vertical Analysis
• Common-Size Statements
• Trend Percentages
• Ratio Analysis

Horizontal Analysis
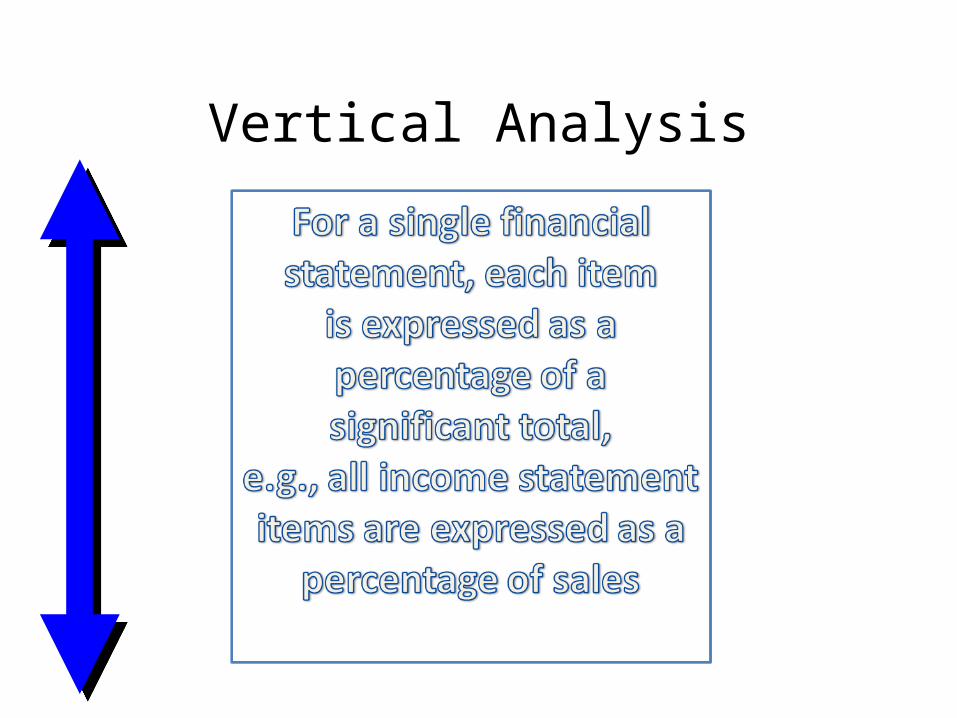
Vertical Analysis

Common-Size Statements

Trend Percentages

Ratio Analysis

Horizontal Analysis Example
The management of ABC Company provides you with comparative balance sheets of the years ended
December 31, 2009 and 2010. Management asks you to prepare a horizontal analysis horizontal analysis on the
information.


Horizontal Analysis Example
Calculating Change in Dollar Amounts
Since we are measuring the amount of the change between 2010 and 2009, the dollar amounts for 2009 become the “base” year
figures.
DollarChange
Current YearFigure
Base YearFigure
= –

Horizontal Analysis Example
Calculating Change as a Percentage
PercentageChange
Dollar Change Base Year Figure 100%= ×

$12,000 – $23,500 = $(11,500)
Horizontal Analysis Example

($11,500 ÷ $23,500) × 100% = 48.9%
Horizontal Analysis Example

Horizontal Analysis Example

Let’s apply the sameprocedures to the
liability and stockholders’equity sections of the
balance sheet.
Horizontal Analysis Example
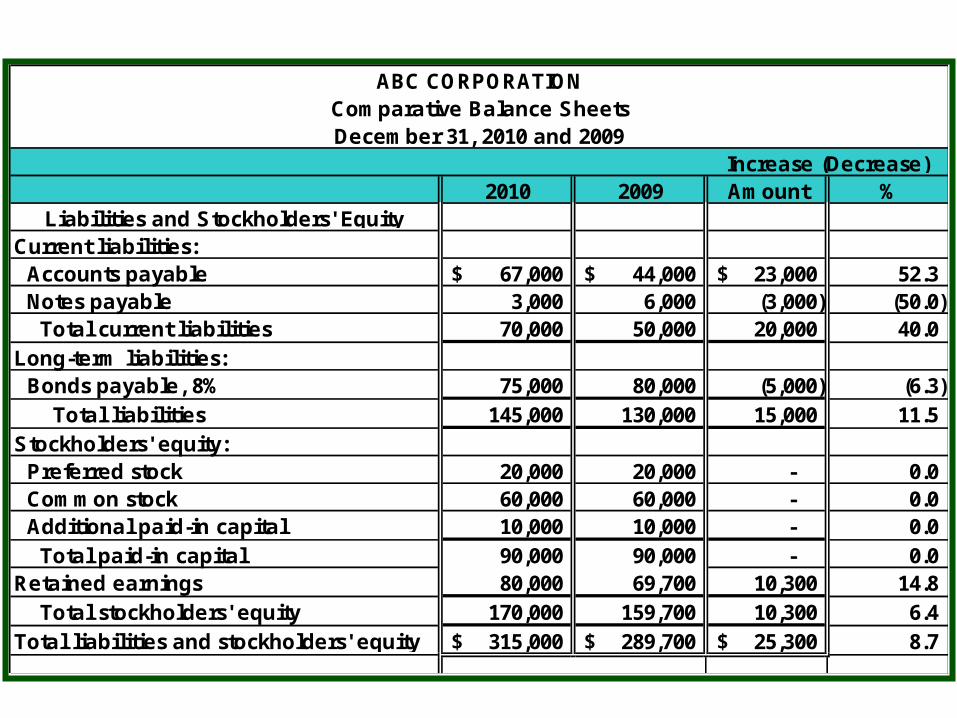
ABC CORPORATIONComparative Balance SheetsDecember 31, 2010 and 2009
Increase (Decrease)2010 2009 Amount %
Liabilities and Stockholders' EquityCurrent liabilities: Accounts payable 67,000$ 44,000$ 23,000$ 52.3 Notes payable 3,000 6,000 (3,000) (50.0) Total current liabilities 70,000 50,000 20,000 40.0Long-term liabilities: Bonds payable, 8% 75,000 80,000 (5,000) (6.3) Total liabilities 145,000 130,000 15,000 11.5Stockholders' equity: Preferred stock 20,000 20,000 - 0.0 Common stock 60,000 60,000 - 0.0 Additional paid-in capital 10,000 10,000 - 0.0 Total paid-in capital 90,000 90,000 - 0.0Retained earnings 80,000 69,700 10,300 14.8 Total stockholders' equity 170,000 159,700 10,300 6.4Total liabilities and stockholders' equity 315,000$ 289,700$ 25,300$ 8.7
Now, let’s apply the procedures to theincome statement.
Horizontal Analysis Example
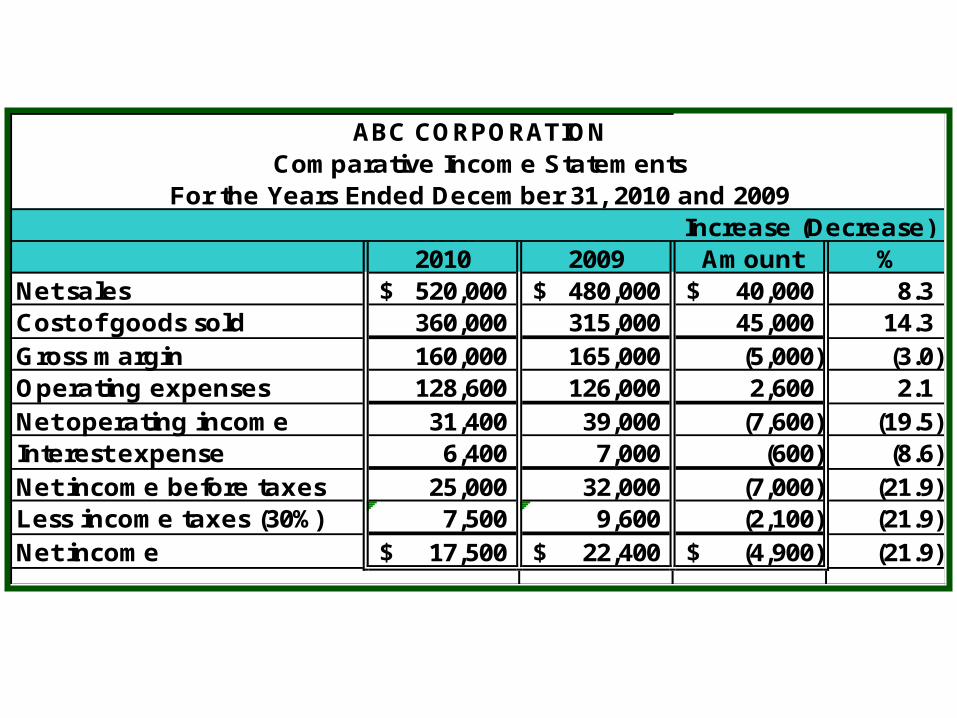
ABC CORPORATIONComparative Income Statements
For the Years Ended December 31, 2010 and 2009Increase (Decrease)
2010 2009 Amount %Net sales 520,000$ 480,000$ 40,000$ 8.3Cost of goods sold 360,000 315,000 45,000 14.3Gross margin 160,000 165,000 (5,000) (3.0)Operating expenses 128,600 126,000 2,600 2.1Net operating income 31,400 39,000 (7,600) (19.5)Interest expense 6,400 7,000 (600) (8.6)Net income before taxes 25,000 32,000 (7,000) (21.9)Less income taxes (30%) 7,500 9,600 (2,100) (21.9)Net income 17,500$ 22,400$ (4,900)$ (21.9)
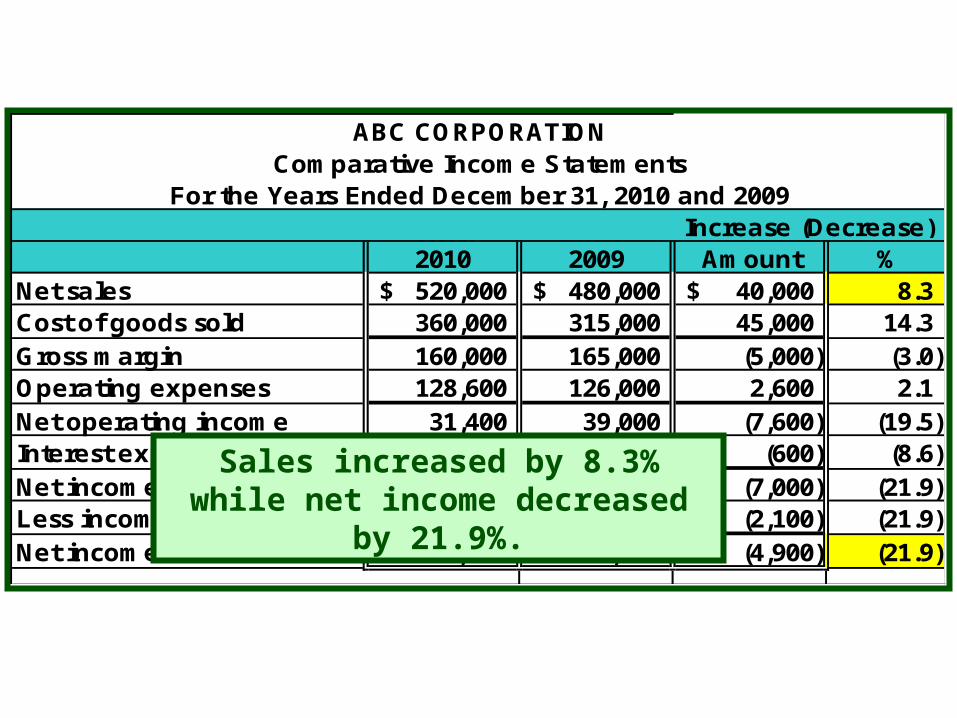
Sales increased by 8.3% while net income decreased by 21.9%.

ABC CORPORATIONComparative Income Statements
For the Years Ended December 31, 2010 and 2009Increase (Decrease)
2010 2009 Amount %Net sales 520,000$ 480,000$ 40,000$ 8.3Cost of goods sold 360,000 315,000 45,000 14.3Gross margin 160,000 165,000 (5,000) (3.0)Operating expenses 128,600 126,000 2,600 2.1Net operating income 31,400 39,000 (7,600) (19.5)Interest expense 6,400 7,000 (600) (8.6)Net income before taxes 25,000 32,000 (7,000) (21.9)Less income taxes (30%) 7,500 9,600 (2,100) (21.9)Net income 17,500$ 22,400$ (4,900)$ (21.9)
There were increases in both cost of goods sold (14.3%) and operating expenses (2.1%). These increased costs more than offset the
increase in sales, yielding an overall decrease in net income.
Vertical Analysis Example
The management of Sample Company asks you to prepare a vertical analysis vertical analysis for the comparative
balance sheets of the company.
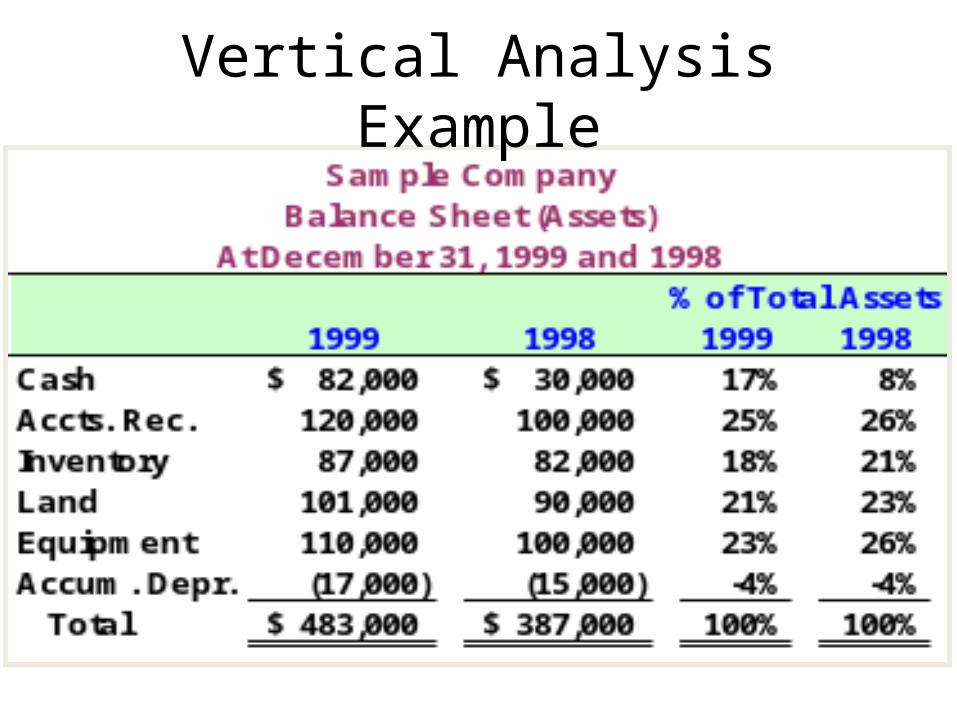
Vertical Analysis Example

Vertical Analysis Example
$82,000 ÷ $483,000 = 17% rounded$30,000 ÷ $387,000 = 8% rounded

Vertical Analysis Example
$76,000 ÷ $483,000 = 16% rounded

Trend Percentages Example
Wheeler, Inc. provides you with the following operating data and asks that you prepare a trend
analysis.

Trend Percentages Example
Wheeler, Inc. provides you with the following operating data and asks that you prepare a trend
analysis.
$1,991 - $1,820 = $171$1,991 - $1,820 = $171
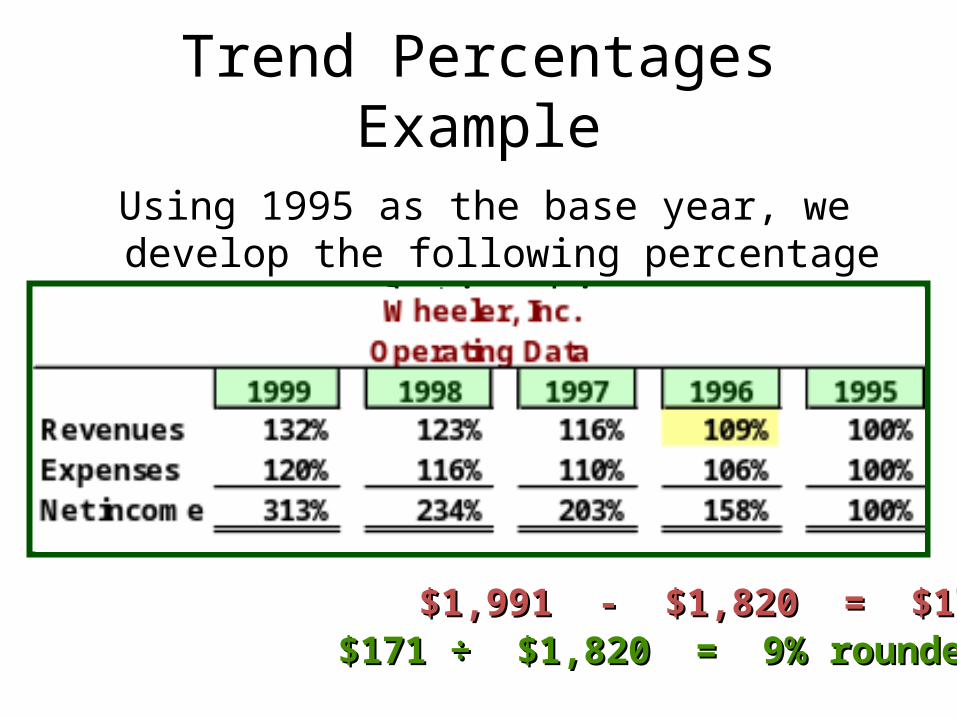
Trend Percentages Example
Using 1995 as the base year, we develop the following percentage relationships.
$1,991 - $1,820 = $171$1,991 - $1,820 = $171$171 ÷ $1,820 = 9% rounded$171 ÷ $1,820 = 9% rounded
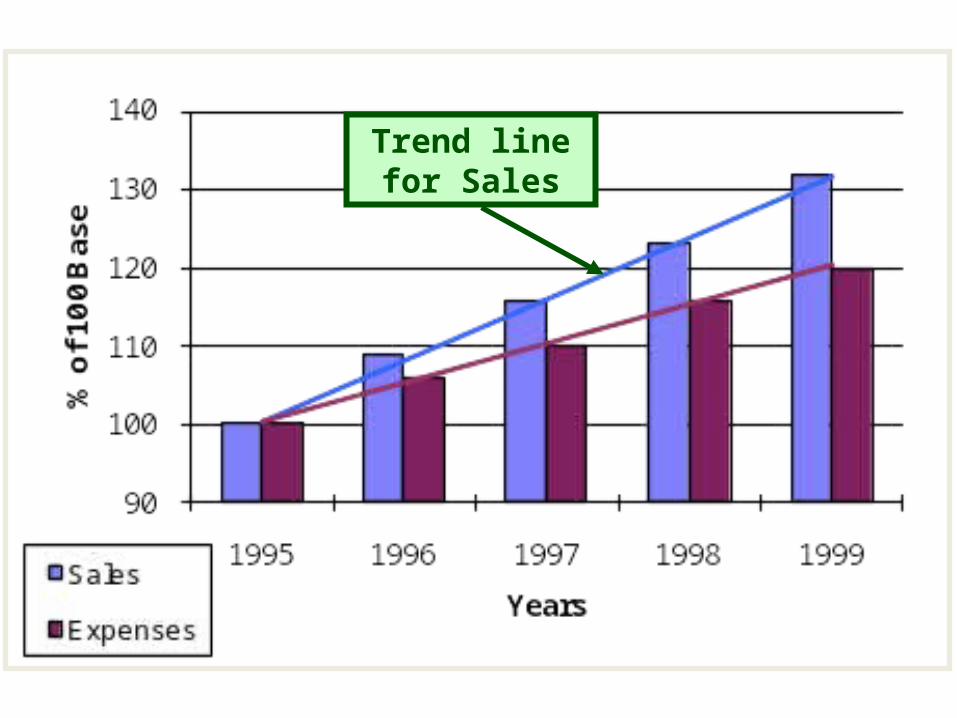
Trend linefor Sales

Ratios
Ratios can be expressed in three different ways: 1. Ratio (e.g., current ratio of 2:1) 2. % (e.g., profit margin of 2%) 3. $ (e.g., EPS of $2.25)
“Using ratios and percentages without considering the underlying leads to incorrect conclusions.”
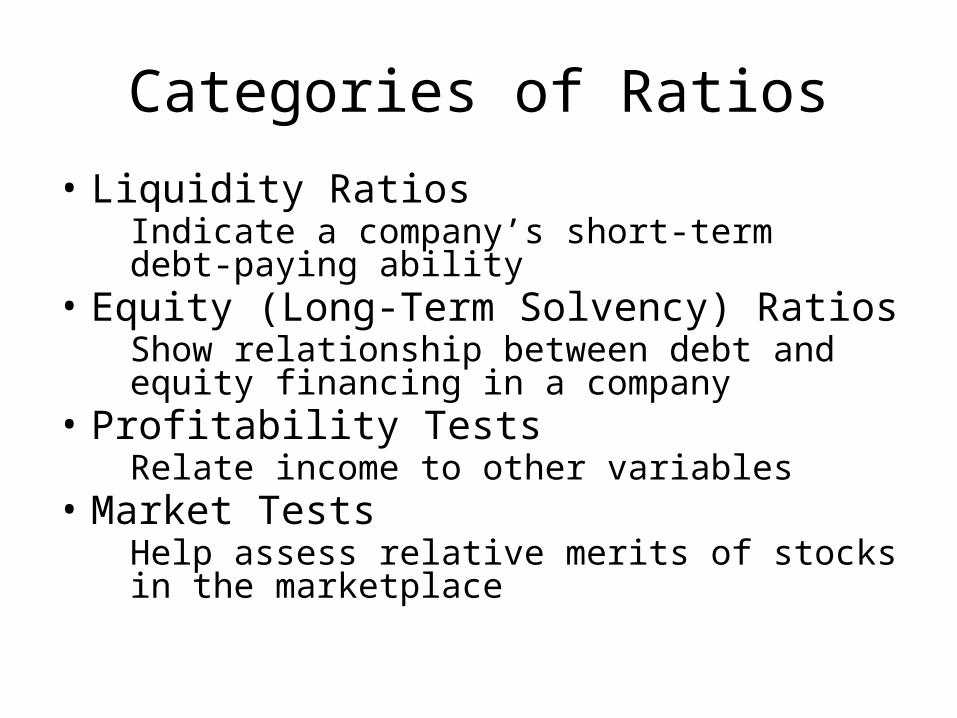
Categories of Ratios
• Liquidity RatiosIndicate a company’s short-term debt-paying ability
• Equity (Long-Term Solvency) RatiosShow relationship between debt and equity financing in a company
• Profitability TestsRelate income to other variables
• Market TestsHelp assess relative merits of stocks in the marketplace

Important Considerations
• Need for comparable data– Data is provided by different companies.– Must compare by industry
Influence of external factors General business conditions Seasonal nature of business operations
Impact of inflation


![[ENTITY NAME] · Web viewDistrict Name ABC County N otes to the F inancial S tatements For the Year Ended D ecember 31, 20CY District Name ABC County Notes to the Financial Statements](https://static.fdocuments.in/doc/165x107/60abbffaa4efe0130525c01a/entity-name-web-view-district-name-abc-county-n-otes-to-the-f-inancial-s-tatements.jpg)
