F Hotel Values & CAP Rates · F Hotel Values & CAP Rates Meet The Money® 2016 Presented by:...
29
- 1 - F F F F F F F F Hotel Values & CAP Rates Meet The Money® 2016 Presented by: Suzanne Mellen, MAI, CRE, FRICS, ISHC Senior Managing Director - Practice Leader Hotel and Casino Consulting & Valuation (415) 268-0351 [email protected] May 6, 2015 – Sheraton Gateway Hotel Los Angeles
Transcript of F Hotel Values & CAP Rates · F Hotel Values & CAP Rates Meet The Money® 2016 Presented by:...
- 1 -
F
F
F
F
F
F
F
F
Hotel Values & CAP Rates Meet The Money® 2016 Presented by: Suzanne Mellen, MAI, CRE, FRICS, ISHC
Senior Managing Director - Practice Leader Hotel and Casino Consulting & Valuation (415) 268-0351 [email protected]
May 6, 2015 – Sheraton Gateway Hotel Los Angeles
- 2 -
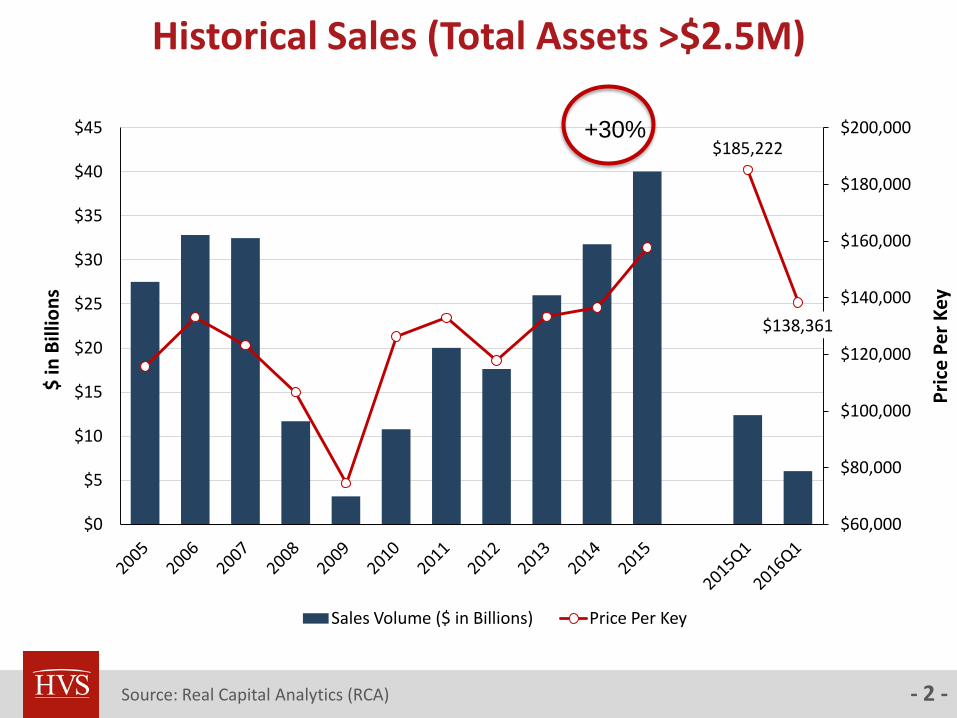
Historical Sales (Total Assets >$2.5M)
Source: Real Capital Analytics (RCA)
$185,222
$138,361
$60,000
$80,000
$100,000
$120,000
$140,000
$160,000
$180,000
$200,000
$0
$5
$10
$15
$20
$25
$30
$35
$40
$45
Pri
ce P
er
Key
$ in
Bill
ion
s
Sales Volume ($ in Billions) Price Per Key
+30%
- 3 -
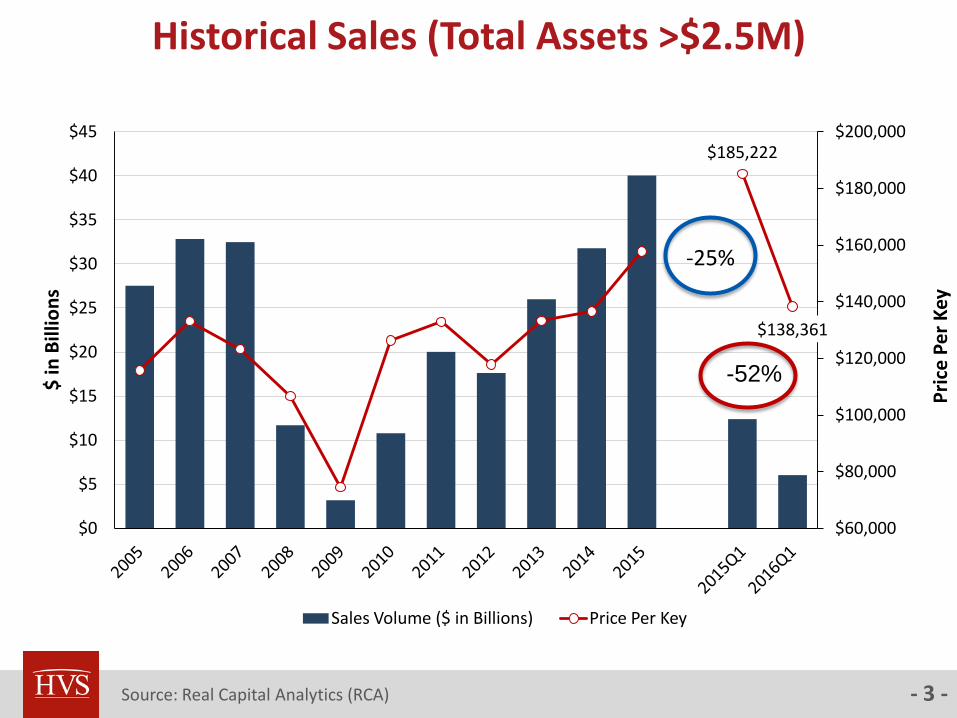
Historical Sales (Total Assets >$2.5M)
Source: Real Capital Analytics (RCA)
$185,222
$138,361
$60,000
$80,000
$100,000
$120,000
$140,000
$160,000
$180,000
$200,000
$0
$5
$10
$15
$20
$25
$30
$35
$40
$45
Pri
ce P
er
Key
$ in
Bill
ion
s
Sales Volume ($ in Billions) Price Per Key
-52%
-25%

- 4 -
Major Hotel Sales Transactions
$0
$50,000
$100,000
$150,000
$200,000
$250,000
0
50
100
150
200
250
30019
90
1991
1992
1993
1994
1995
1996
1997
1998
1999
2000
2001
2002
2003
2004
2005
2006
2007
2008
2009
2010
2011
Avg
. Pri
ce P
er R
oo
m
Nu
mb
er o
f M
ajo
r Sa
les
Number of Hotels Average Price per Room
Source: HVS
- 5 -
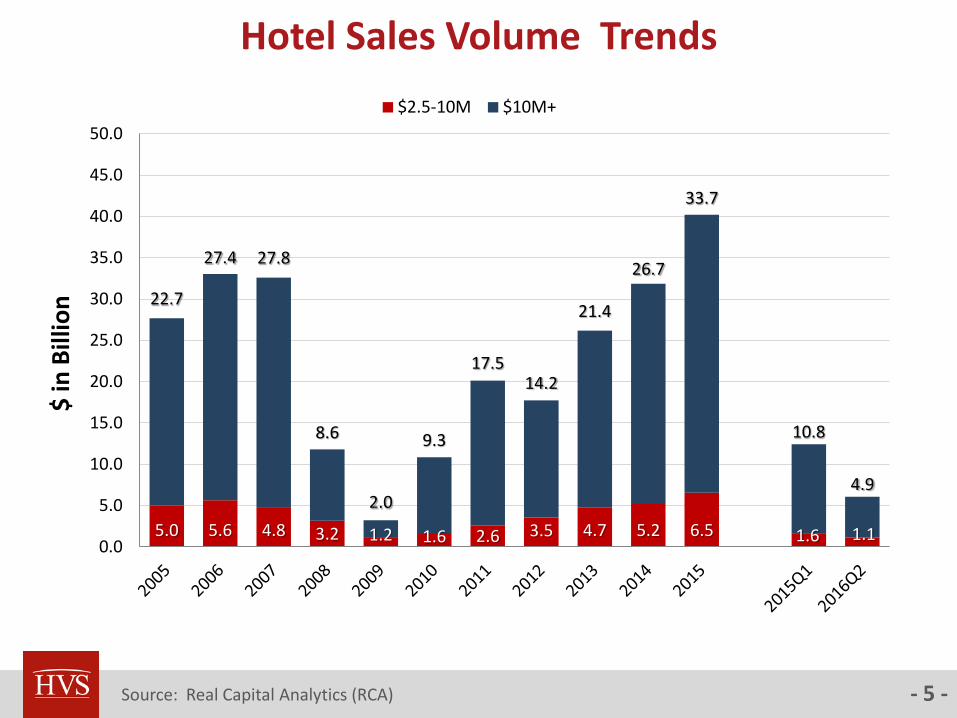
Hotel Sales Volume Trends
Source: Real Capital Analytics (RCA)
5.0 5.6 4.8 3.2 1.2 1.6 2.6 3.5 4.7 5.2 6.5 1.6 1.1
22.7
27.4 27.8
8.6
2.0
9.3
17.5 14.2
21.4
26.7
33.7
10.8
4.9
0.0
5.0
10.0
15.0
20.0
25.0
30.0
35.0
40.0
45.0
50.0
$ in
Bill
ion
$2.5-10M $10M+

- 6 -
Hotel Sales Volume Trends
Source: Real Capital Analytics (RCA)
5.0 5.6 4.8 3.2 1.2 1.6 2.6 3.5 4.7 5.2 6.5 1.6 1.1
22.7
27.4 27.8
8.6
2.0
9.3
17.5 14.2
21.4
26.7
33.7
10.8
4.9
0.0
5.0
10.0
15.0
20.0
25.0
30.0
35.0
40.0
45.0
50.0
$ in
Bill
ion
$2.5-10M $10M+
-55%
-32%
- 7 -
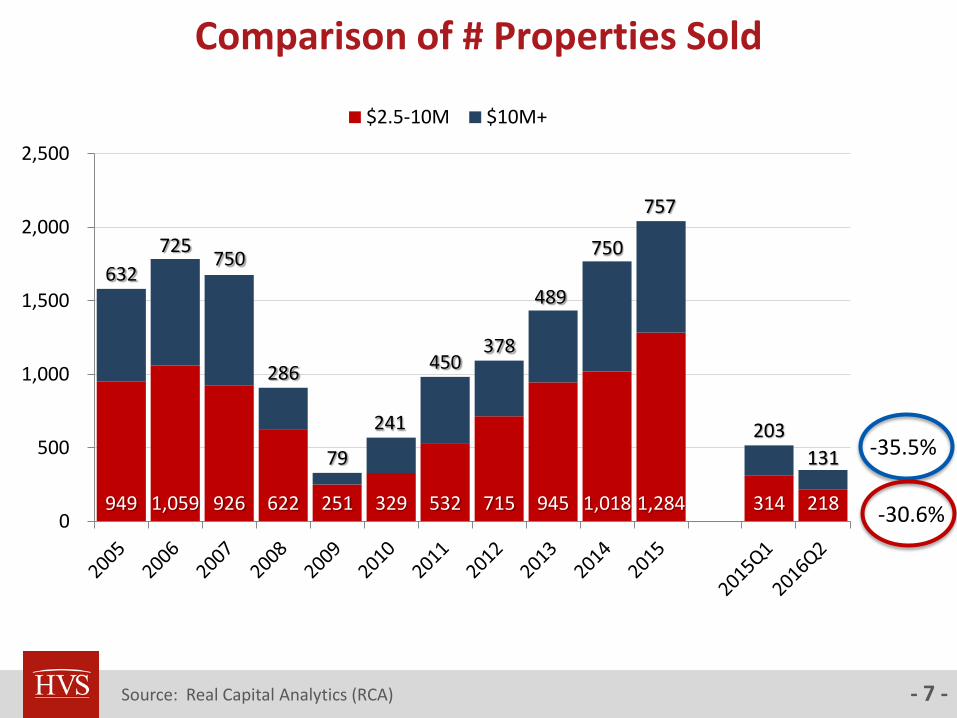
949 1,059 926 622 251 329 532 715 945 1,018 1,284 314 218
632
725 750
286
79
241
450 378
489
750
757
203
131
0
500
1,000
1,500
2,000
2,500
$2.5-10M $10M+
Comparison of # Properties Sold
Source: Real Capital Analytics (RCA)
-35.5%
-30.6%
- 8 -
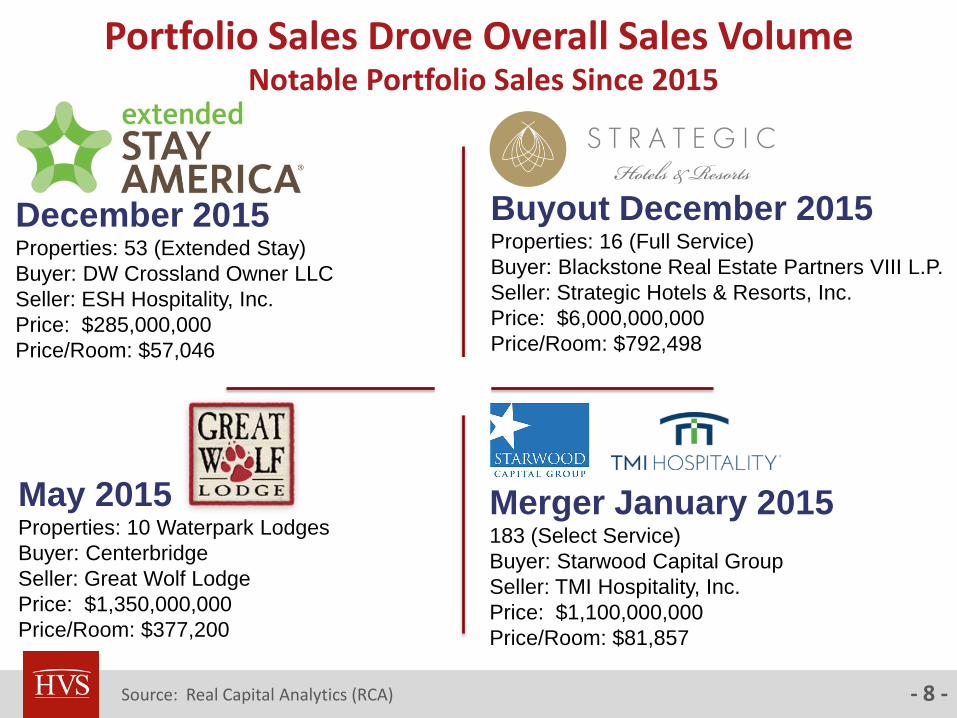
Portfolio Sales Drove Overall Sales Volume Notable Portfolio Sales Since 2015
December 2015 Properties: 53 (Extended Stay)
Buyer: DW Crossland Owner LLC
Seller: ESH Hospitality, Inc.
Price: $285,000,000
Price/Room: $57,046
Buyout December 2015 Properties: 16 (Full Service)
Buyer: Blackstone Real Estate Partners VIII L.P.
Seller: Strategic Hotels & Resorts, Inc.
Price: $6,000,000,000
Price/Room: $792,498
Merger January 2015 183 (Select Service)
Buyer: Starwood Capital Group
Seller: TMI Hospitality, Inc.
Price: $1,100,000,000
Price/Room: $81,857
Source: Real Capital Analytics (RCA)
May 2015 Properties: 10 Waterpark Lodges
Buyer: Centerbridge
Seller: Great Wolf Lodge
Price: $1,350,000,000
Price/Room: $377,200
- 9 -
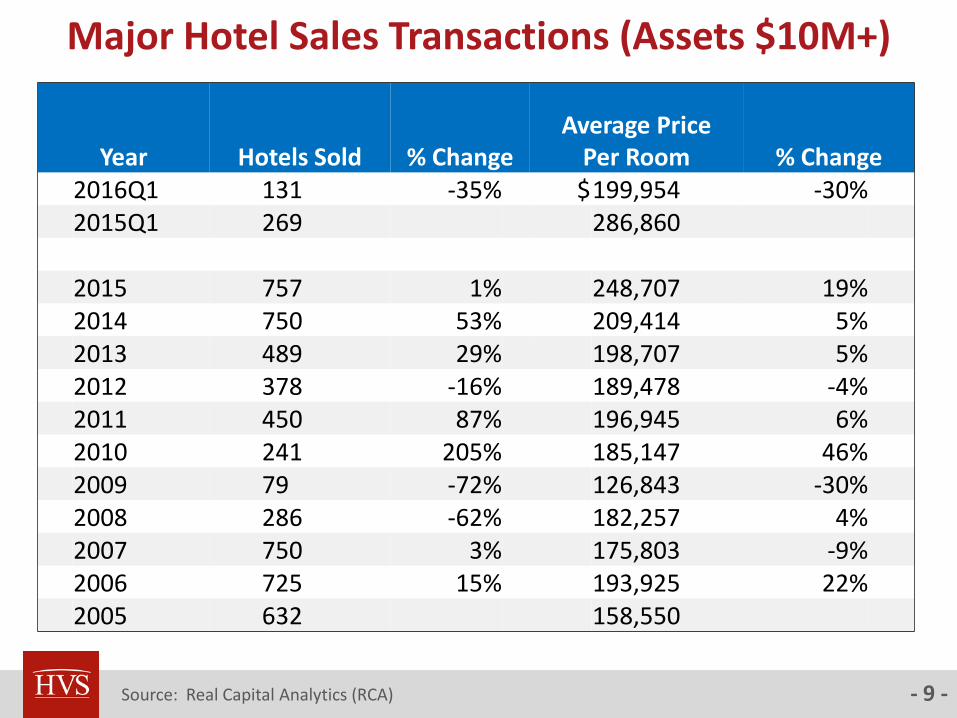
Major Hotel Sales Transactions (Assets $10M+)
Source: Real Capital Analytics (RCA)
Year Hotels Sold % Change Average Price
Per Room % Change 2016Q1 131 -35% $ 199,954 -30% 2015Q1 269 286,860 2015 757 1% 248,707 19% 2014 750 53% 209,414 5% 2013 489 29% 198,707 5% 2012 378 -16% 189,478 -4% 2011 450 87% 196,945 6% 2010 241 205% 185,147 46% 2009 79 -72% 126,843 -30% 2008 286 -62% 182,257 4% 2007 750 3% 175,803 -9% 2006 725 15% 193,925 22% 2005 632 158,550
- 10 -
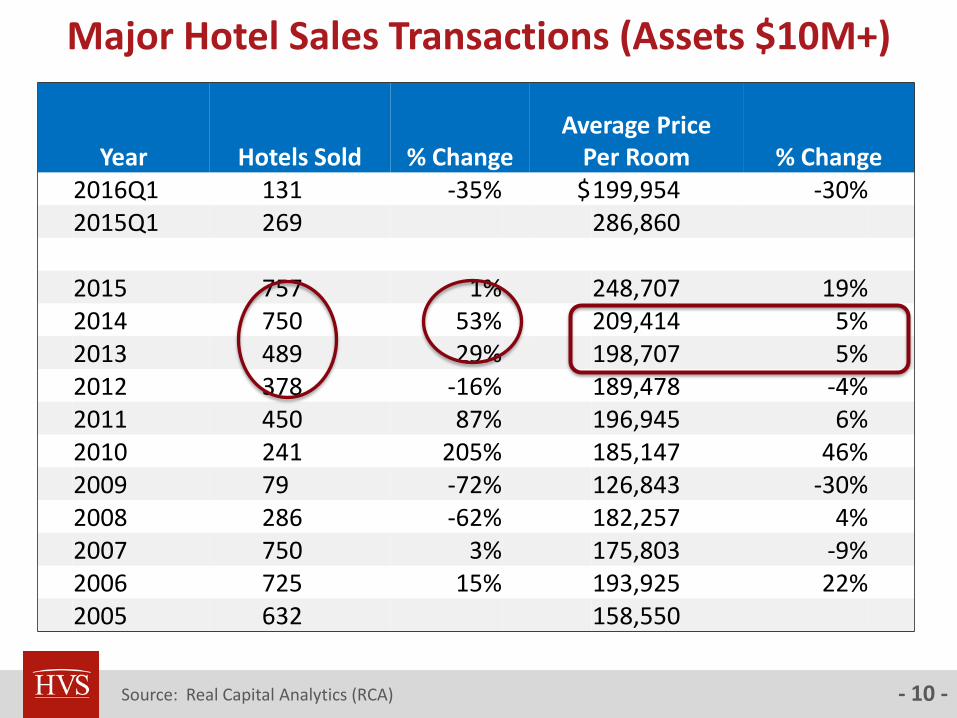
Year Hotels Sold % Change Average Price
Per Room % Change 2016Q1 131 -35% $ 199,954 -30% 2015Q1 269 286,860 2015 757 1% 248,707 19% 2014 750 53% 209,414 5% 2013 489 29% 198,707 5% 2012 378 -16% 189,478 -4% 2011 450 87% 196,945 6% 2010 241 205% 185,147 46% 2009 79 -72% 126,843 -30% 2008 286 -62% 182,257 4% 2007 750 3% 175,803 -9% 2006 725 15% 193,925 22% 2005 632 158,550
Major Hotel Sales Transactions (Assets $10M+)
Source: Real Capital Analytics (RCA)
- 11 -
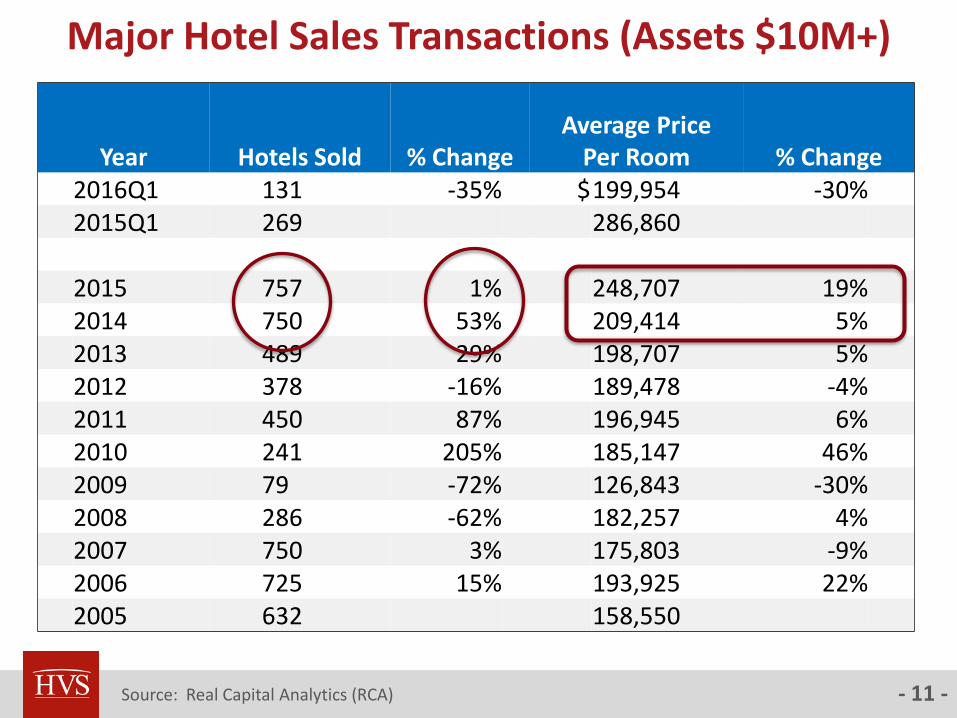
Year Hotels Sold % Change Average Price
Per Room % Change 2016Q1 131 -35% $ 199,954 -30% 2015Q1 269 286,860 2015 757 1% 248,707 19% 2014 750 53% 209,414 5% 2013 489 29% 198,707 5% 2012 378 -16% 189,478 -4% 2011 450 87% 196,945 6% 2010 241 205% 185,147 46% 2009 79 -72% 126,843 -30% 2008 286 -62% 182,257 4% 2007 750 3% 175,803 -9% 2006 725 15% 193,925 22% 2005 632 158,550
Major Hotel Sales Transactions (Assets $10M+)
Source: Real Capital Analytics (RCA)
- 12 -
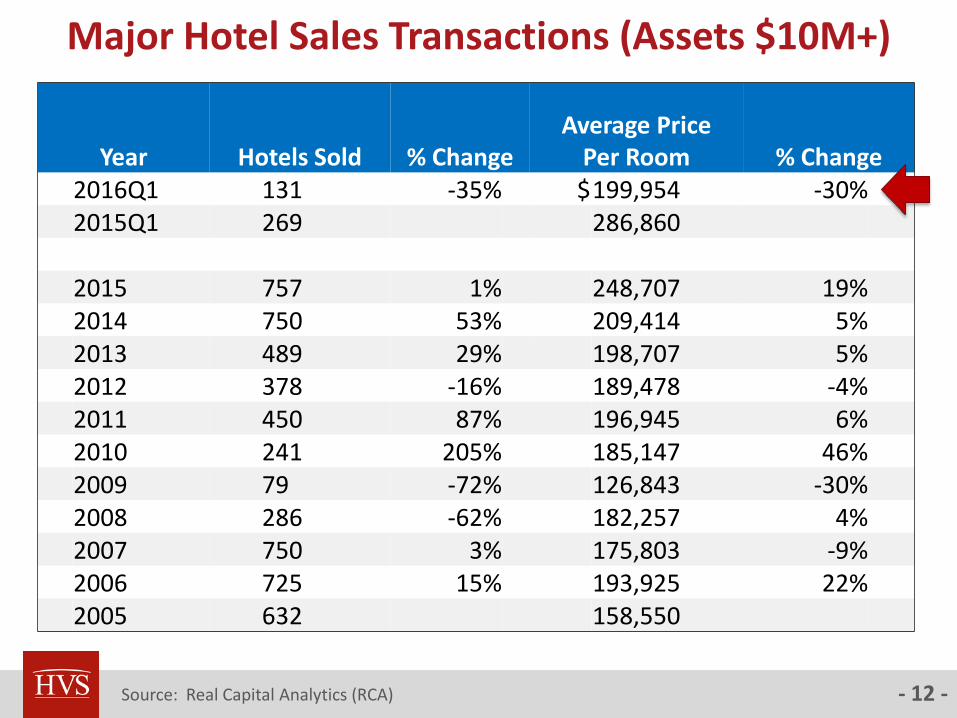
Year Hotels Sold % Change Average Price
Per Room % Change 2016Q1 131 -35% $ 199,954 -30% 2015Q1 269 286,860 2015 757 1% 248,707 19% 2014 750 53% 209,414 5% 2013 489 29% 198,707 5% 2012 378 -16% 189,478 -4% 2011 450 87% 196,945 6% 2010 241 205% 185,147 46% 2009 79 -72% 126,843 -30% 2008 286 -62% 182,257 4% 2007 750 3% 175,803 -9% 2006 725 15% 193,925 22% 2005 632 158,550
Major Hotel Sales Transactions (Assets $10M+)
Source: Real Capital Analytics (RCA)

- 13 - Source: HVS and RCA
Sales Exceeding $1 Million Per Key Since 2015
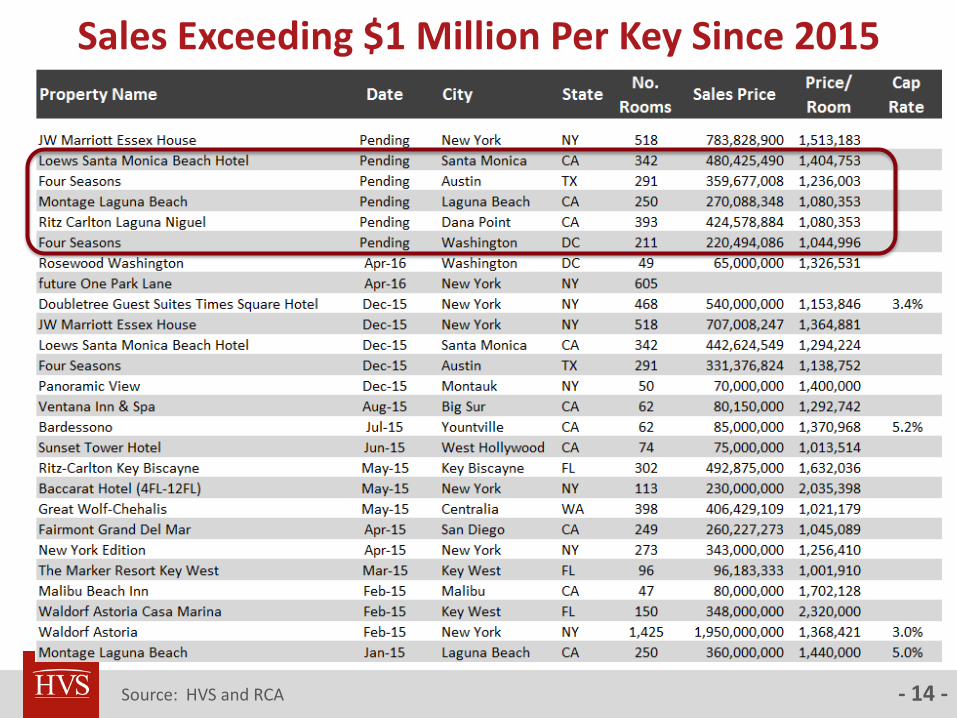
- 14 - Source: HVS and RCA
Sales Exceeding $1 Million Per Key Since 2015
- 15 -
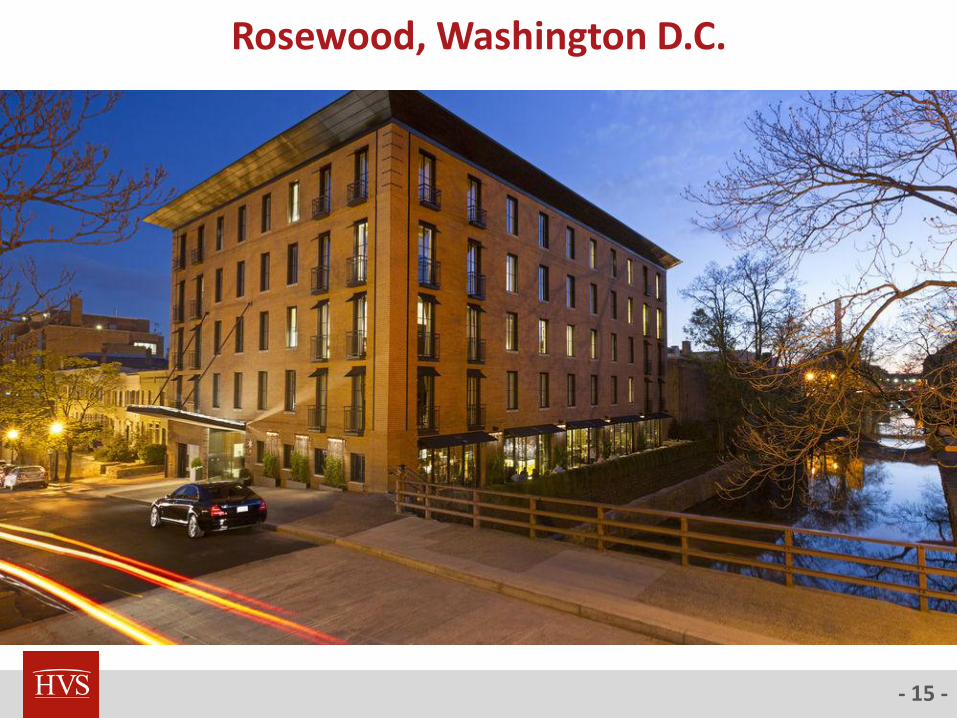
Rosewood, Washington D.C.
- 16 -
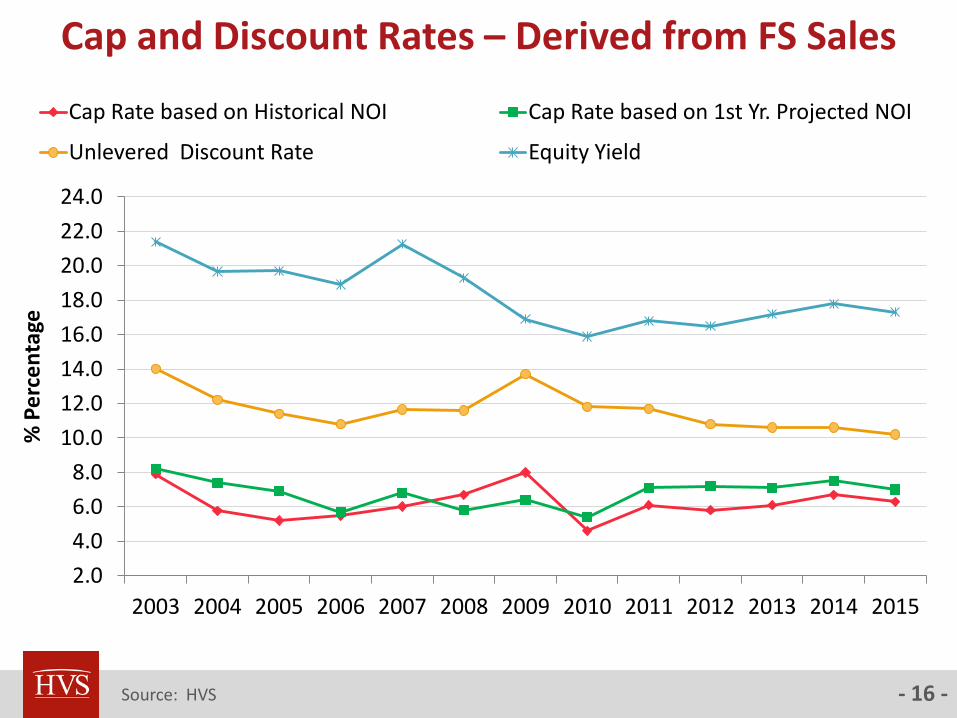
Cap and Discount Rates – Derived from FS Sales
Source: HVS
2.0
4.0
6.0
8.0
10.0
12.0
14.0
16.0
18.0
20.0
22.0
24.0
2003 2004 2005 2006 2007 2008 2009 2010 2011 2012 2013 2014 2015
% P
erc
en
tage
Cap Rate based on Historical NOI Cap Rate based on 1st Yr. Projected NOI
Unlevered Discount Rate Equity Yield
- 17 -
2.0
4.0
6.0
8.0
10.0
12.0
14.0
16.0
18.0
20.0
22.0
24.0
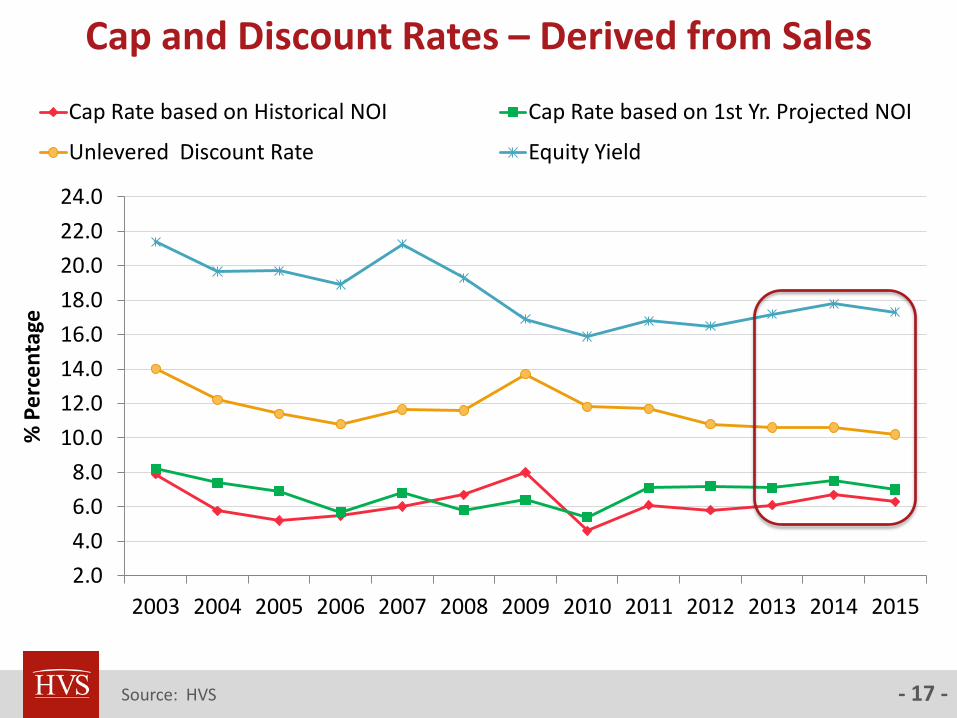
2003 2004 2005 2006 2007 2008 2009 2010 2011 2012 2013 2014 2015
% P
erc
en
tage
Cap Rate based on Historical NOI Cap Rate based on 1st Yr. Projected NOI
Unlevered Discount Rate Equity Yield
Cap and Discount Rates – Derived from Sales
Source: HVS

- 18 -
Impact of Great Recession – Full Service Hotels
Full Service Hotels 2007 2009
Occupancy 70.0% 62.5%
Avg. No. Rooms 306 292
Average Rate $166.7 $146.74
RevPAR $116.7 $91.7
% Change -21%
Revenue PAR $67,301 52,650
Expenses PAR $50,298 43,143
NOI PAR $17,003 9,507
% change -44%
NOI % 25.3% 18.1%
Multiple of NOI Change to RevPAR Change: 2.06 X
*Source: STR Annual HOST Reports – Composite US Performance

- 19 -
Full-Service Hotels Have Fully Recovered* Illustration of Operating Leverage – Revenue and NOI Relationship
Full Service Hotels 2007 2009 2014
Occupancy 70.0% 62.5% 73.9%
Avg. No. Rooms 306 292 299
Average Rate $166.7 $146.74 $180.94
RevPAR $116.7 $91.7 $133.7
% Change -21% 46%
Revenue PAR $67,301 52,650 74,975
Expenses PAR $50,298 43,143 55,911
NOI PAR $17,003 9,507 19,064
% change -44% 101%
NOI % 25.3% 18.1% 25.4%
Multiple of NOI Change to RevPAR Change: 2.06 X 2.19 X
*Source: STR Annual HOST Reports – Composite US Performance

- 20 -
Limited Service Hotels 2007 2009 2014
Occupancy 69.2% 63.3% 74.2%Avg. No. Rooms 117 113 116
Average Rate $94.94 $85.26 $102.45
RevPAR $65.70 $53.97 $76.01
% Change -18% 41%
Revenue PAR $24,349 $20,128 28,516
Expenses PAR $14,606 $13,583 17,710
NOI PAR $9,743 $6,545 10,806
% Change -33% 65%
NOI % 40.0% 32.5% 37.9%
Multiple of NOI Change to RevPAR Change: 1.84 X 1.59 X
Limited-Service Hotels Have Fully Recovered* Illustration of Operating Leverage – Revenue and NOI Relationship
*Source: STR Annual HOST Reports – Composite US Performance
- 21 -
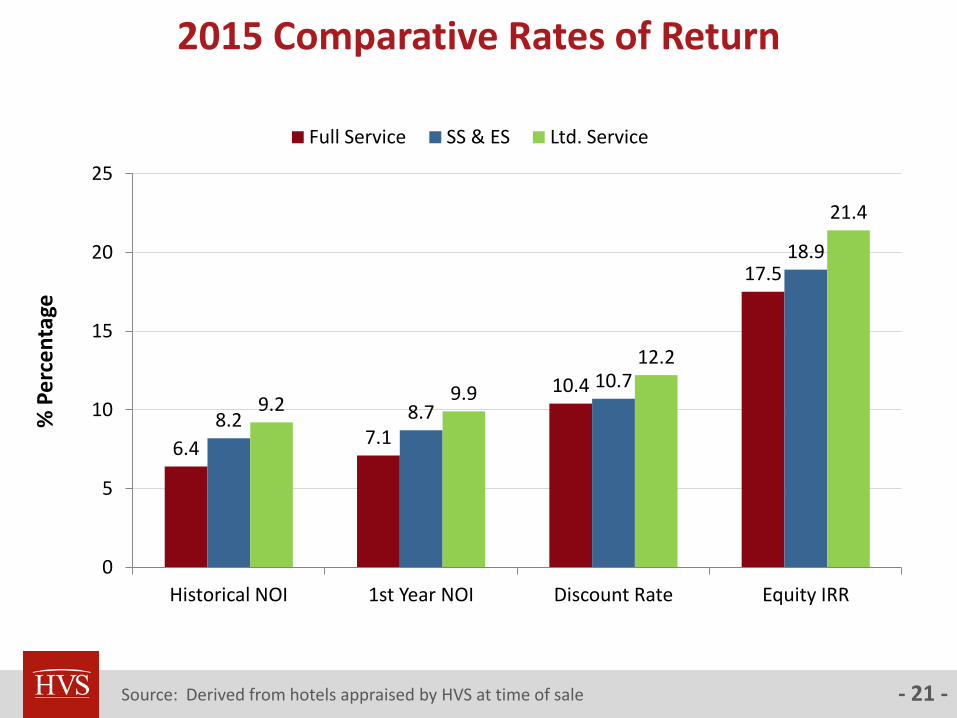
2015 Comparative Rates of Return
Source: Derived from hotels appraised by HVS at time of sale
6.4 7.1
10.4
17.5
8.2 8.7
10.7
18.9
9.2 9.9
12.2
21.4
0
5
10
15
20
25
Historical NOI 1st Year NOI Discount Rate Equity IRR
% P
erc
en
tage
Full Service SS & ES Ltd. Service
- 22 -
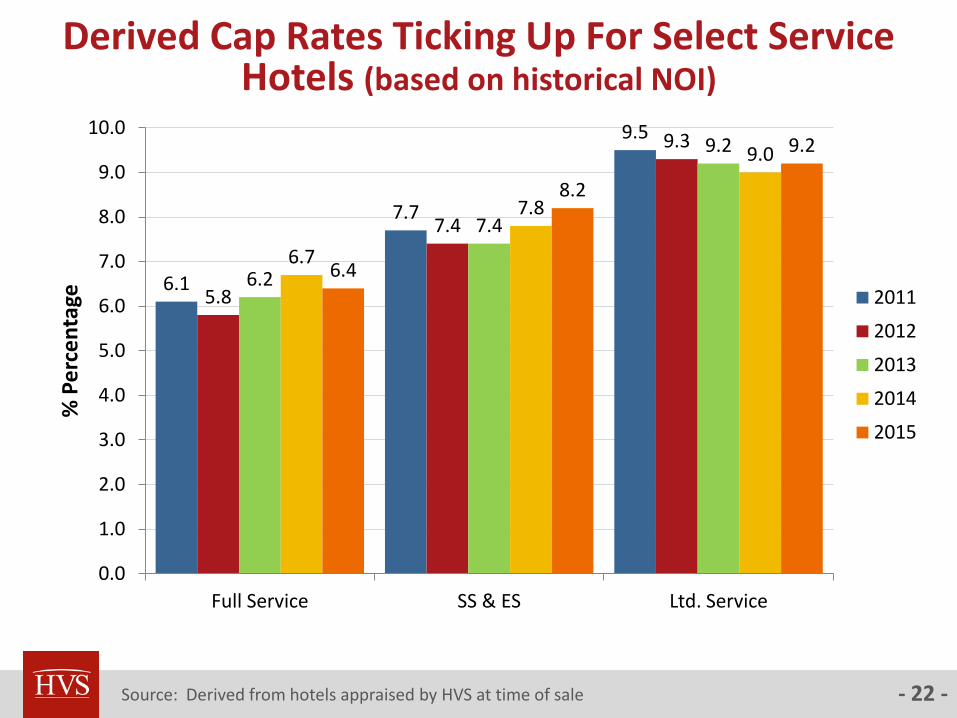
Derived Cap Rates Ticking Up For Select Service Hotels (based on historical NOI)
Source: Derived from hotels appraised by HVS at time of sale
6.1
7.7
9.5
5.8
7.4
9.3
6.2
7.4
9.2
6.7
7.8
9.0
6.4
8.2
9.2
0.0
1.0
2.0
3.0
4.0
5.0
6.0
7.0
8.0
9.0
10.0
Full Service SS & ES Ltd. Service
% P
erc
en
tage
2011
2012
2013
2014
2015
- 23 -
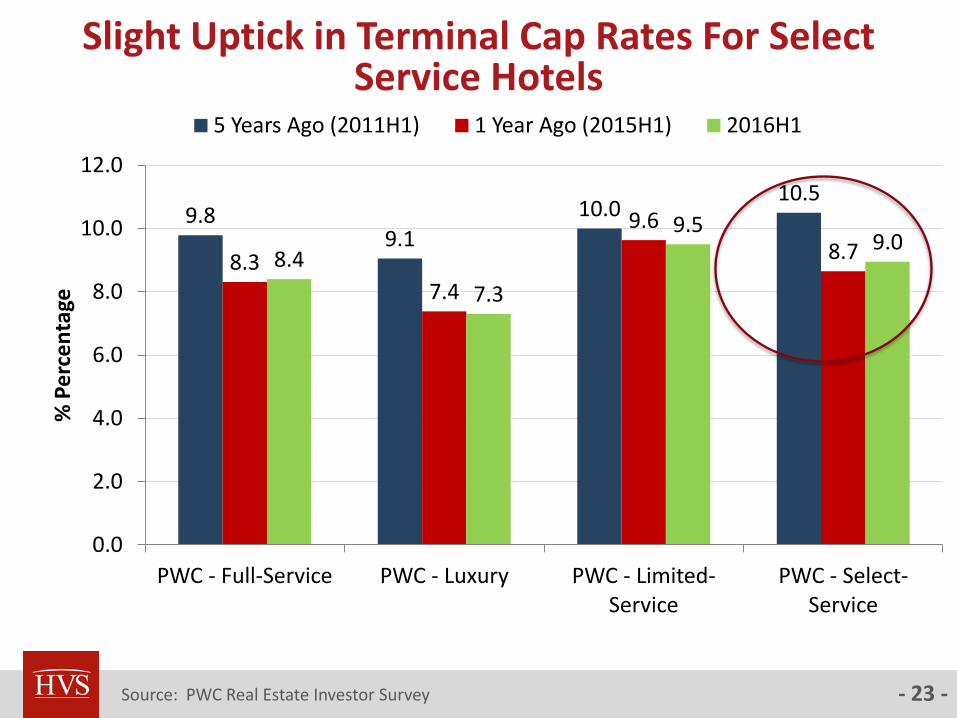
Slight Uptick in Terminal Cap Rates For Select Service Hotels
Source: PWC Real Estate Investor Survey
9.8 9.1
10.0 10.5
8.3 7.4
9.6
8.7 8.4
7.3
9.5 9.0
0.0
2.0
4.0
6.0
8.0
10.0
12.0
PWC - Full-Service PWC - Luxury PWC - Limited-Service
PWC - Select-Service
% P
erc
en
tage
5 Years Ago (2011H1) 1 Year Ago (2015H1) 2016H1
- 24 -
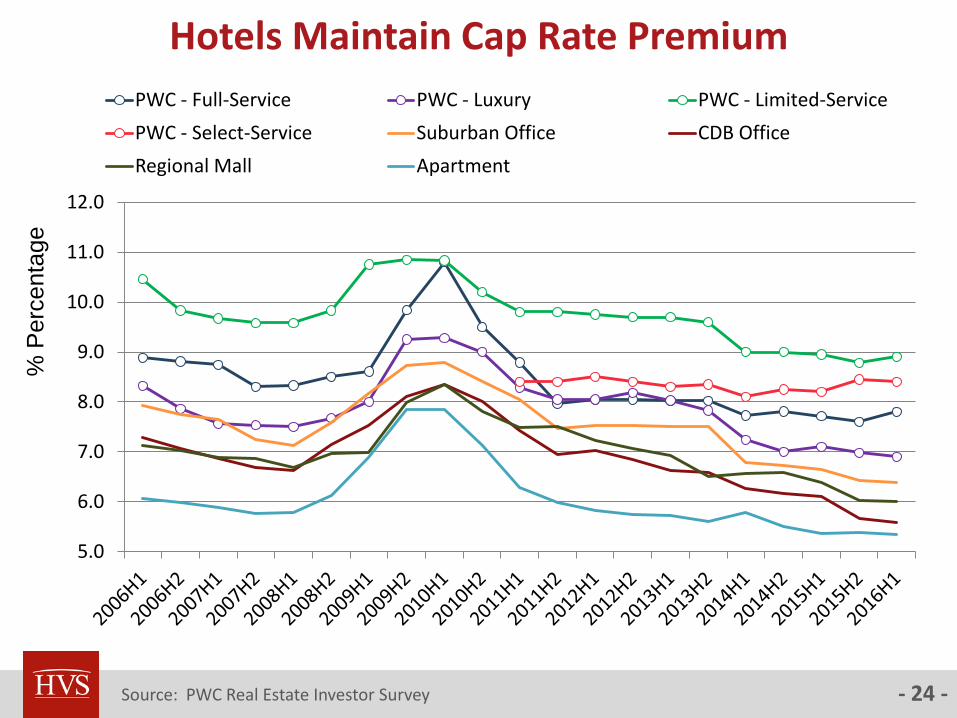
Hotels Maintain Cap Rate Premium
Source: PWC Real Estate Investor Survey
% P
erc
enta
ge
5.0
6.0
7.0
8.0
9.0
10.0
11.0
12.0
PWC - Full-Service PWC - Luxury PWC - Limited-Service
PWC - Select-Service Suburban Office CDB Office
Regional Mall Apartment

- 25 -
Publicly Traded REIT Cap Rates Trending Up
Source: Investment Banking Bulletins, SEC, HVS
2.0%
4.0%
6.0%
8.0%
10.0%
12.0%
14.0%
YE 2007
YE 2008
YE 2009
YE 2010
YE 2011
YE 2012
YE 2013
YE 2014
YE 2015
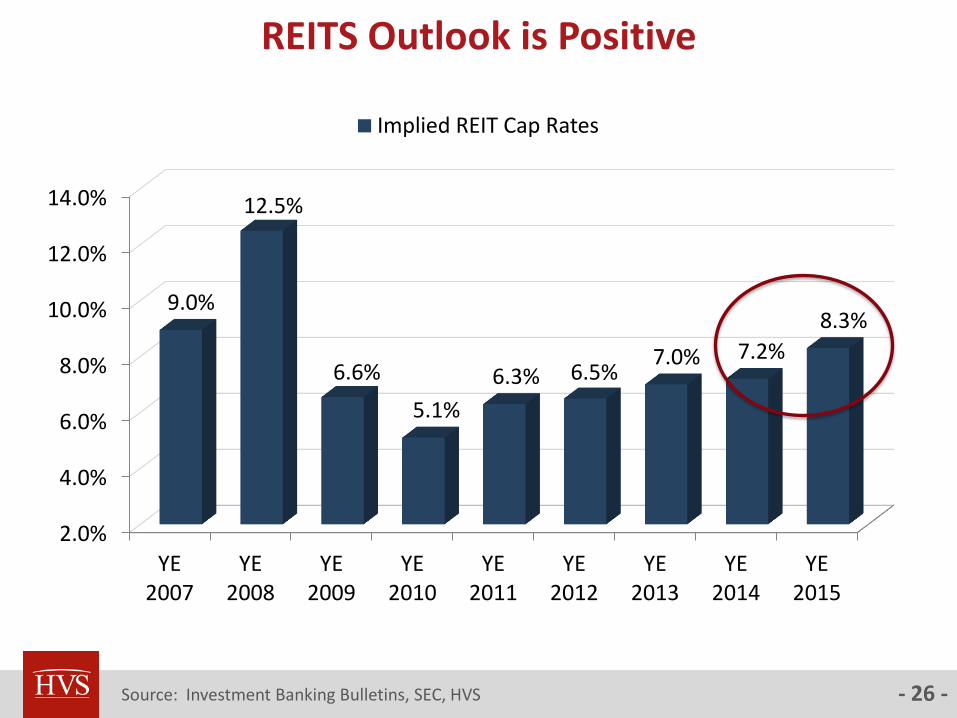
9.0%
12.5%
6.6%
5.1%
6.3% 6.5% 7.0% 7.2%
8.3%
Implied REIT Cap Rates
- 26 -
2.0%
4.0%
6.0%
8.0%
10.0%
12.0%
14.0%
YE 2007
YE 2008
YE 2009
YE 2010
YE 2011
YE 2012
YE 2013
YE 2014
YE 2015
9.0%
12.5%
6.6%
5.1%
6.3% 6.5% 7.0% 7.2%
8.3%
Implied REIT Cap Rates
REITS Outlook is Positive
Source: Investment Banking Bulletins, SEC, HVS
- 27 -
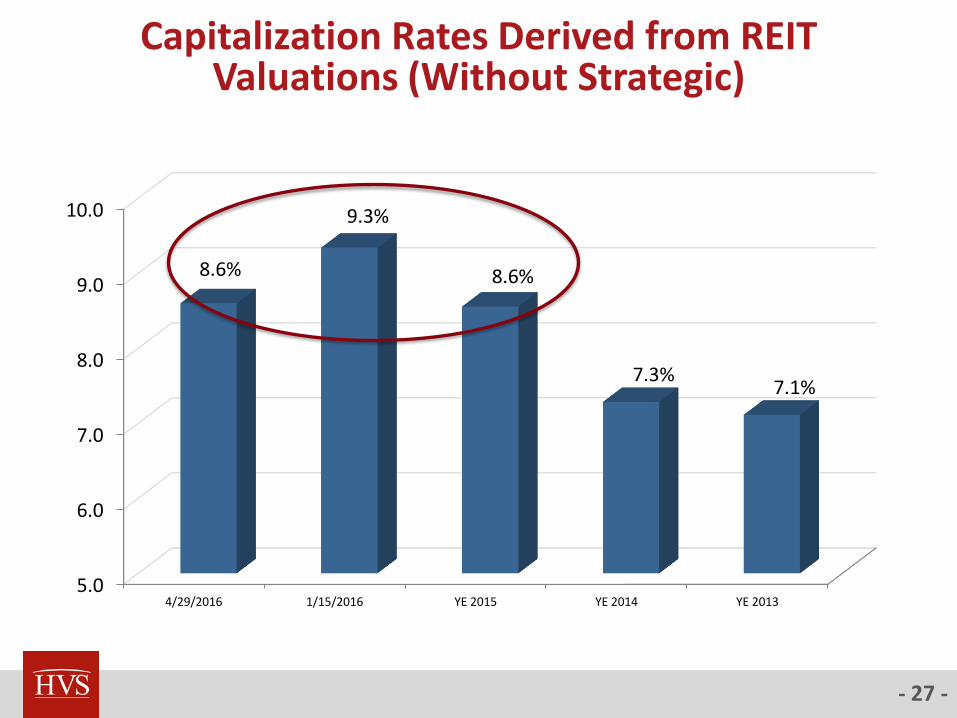
Capitalization Rates Derived from REIT Valuations (Without Strategic)
5.0
6.0
7.0
8.0
9.0
10.0
4/29/2016 1/15/2016 YE 2015 YE 2014 YE 2013
8.6%
9.3%
8.6%
7.3% 7.1%
- 28 -
Summary
2015 will be remembered as the peak year of the post Great Recession cycle
New supply concerns and global economic factors impacting outlook
for hotel performance and investment
Debt more challenging to procure, though interest rates remain low
Gap between buyer and seller expectations stalling transaction market
Cap rates have risen 50 bps for most assets but remain low for high quality full service and luxury hotels in prime markets
Aging hotels once again challenged due to lender pullback, cap ex and new supply
Higher cap rates will be offset by rising NOI in strong markets sustaining values
Higher cap rates will negatively impact values in markets facing supply and demand challenges and stagnant or declining NOI

- 29 -
Any Questions?
Suzanne Mellen, MAI, CRE, FRICS, ISHC
Practice Leader
[email protected] | (415) 268-0351
Superior results through unrivalled hospitality intelligence. Everywhere