F-6 Cover investment - University of Washington New Lone Dragon Pine International Emerging Markets...
10
VII. STANDING COMMITTEES B. Finance, Audit and Facilities Committee Investment Performance Report, Fourth Quarter Fiscal Year 2008 F–6/209-08 9/18/08 F–6
Transcript of F-6 Cover investment - University of Washington New Lone Dragon Pine International Emerging Markets...

VII. STANDING COMMITTEES B. Finance, Audit and Facilities Committee Investment Performance Report, Fourth Quarter Fiscal Year 2008
F–6/209-08 9/18/08
F–6

University of Washington
investment Performance rePort to the Board of regents
foUrth QUarter fiscal year 2008
As of June 30, 2008
treasUrer, Board of regents
treasUry office
Published August 2008
Table of Contents
Treasury Assets . . . . . . . . . . . . . . . . . . . . . . . . . . . . . . . . . . . . . . . . . . . . . . . . . . . . . . . . 1
Asset Allocation . . . . . . . . . . . . . . . . . . . . . . . . . . . . . . . . . . . . . . . . . . . . . . . . . . . . . . 2
Consolidated Endowment Fund . . . . . . . . . . . . . . . . . . . . . . . . . . . . . . . . . . . . . . . . . . 3
Performance Update . . . . . . . . . . . . . . . . . . . . . . . . . . . . . . . . . . . . . . . . . . . . . . . . . . . 4
Invested Funds . . . . . . . . . . . . . . . . . . . . . . . . . . . . . . . . . . . . . . . . . . . . . . . . . . . . . . . 5
Summary of Actions Taken Under Board Delegated Authorities January 1, 2008 through August 15, 2008 . . . . . . . . . . . . . . . . . . . . . . . . . . . . . . . . . 6–7

1
Treasury Assets 1As of 6/30/08–$3.3 Billion
1. Includes assets whose management falls under the auspices of the Finance & Audit Committee of the Board of Regents. Excludes Metro Tract and Forest Trust Lands. All dollar amounts are expressed in millions and represent market values.
2. The Invested Funds holds Consolidated Endowment Fund units valued at $446. To avoid double counting, the dollars are included only in the CEF totals. 3. In June 2002, the Board of Regents authorized the establishment of a captive insurance company, Portage Bay Insurance(PBI). The previous insurance vehicle, the Self Insurance Revolving
Fund(SIRF), will close after existing claims are resolved. Current balances: PBI $74.2 SIRF $3.0. 4. General obligation bond reserve fund on deposit with the state of Washington. 5. Required reserve funds for locally issued bonds (2002 Housing & Dining $1.6, 2004 Housing & Dining $0.6, 2004 Parking $1.6, Roosevelt 1 $2.3 and Roosevelt 2 $2.0). 6. Proceeds from sale of land grants and subsequent investment returns on deposit with the state of Washington. 7. Construction project funds which have not yet been disbursed (IMA $8.0, Genome/R&T $12.4, Parking $5.8, and 2007 General Revenue Bond $12.0).
Operating &Reserve Funds
$952
Endowment &Similar Funds
$2,347
Dollars in Millions
Endowment & Similar Funds Operating & Reserve FundsEndowment Funds $1,715 Operating Funds 446Consolidated Endowment Fund 2,161Life Income Trusts 85Outside Trusts 53Non-CEF Endowments 19Permanent Fund 6 29 $2,347
Invested Funds 2, 3 $869Bond Retirement Fund 4 11Building Fund 4 26Debt Service Reserve Funds 5 8Bond Proceeds 7 38 $952

2
Asset AllocationAs of June 30, 2008
Consolidated Endowment Fund 1 —$2,161 MM
Domestic Equity14%
Marketable Alternatives
19%
Non-Marketable Alternatives
14%
Real Assets15%
Fixed Income 2
9%
International Emerging Markets
12%
International Developed Markets
16%
Domestic Equity $310 14% 18% 10%–40%
International Developed Markets $355 16% 20% 10%–35%
International Emerging Markets $268 12% 10% 5%–15% 3
Marketable Alternatives $408 19% 16% 5%–25%
Non-Marketable Alternatives $301 14% 12% 5%–20%
Equity Fund $1,642 76% 76% 60%–90%
Real Assets Fund $334 15% 12% 5%–20%
Fixed Income Fund 2 $186 9% 12% 5%–35%
Total Consolidated Endowment Fund $2,161 100%
Current Allocation 4 Policy Target PolicyRangeDollars in Millions
1. International exposure: 43%, net foreign currency exposure: 41%.2. Includes allocation to cash.3. November 14, 2007 the Board of Regents approved expansion of the International Emerging Markets policy range to 5%–25%, through June 30, 2008.
3
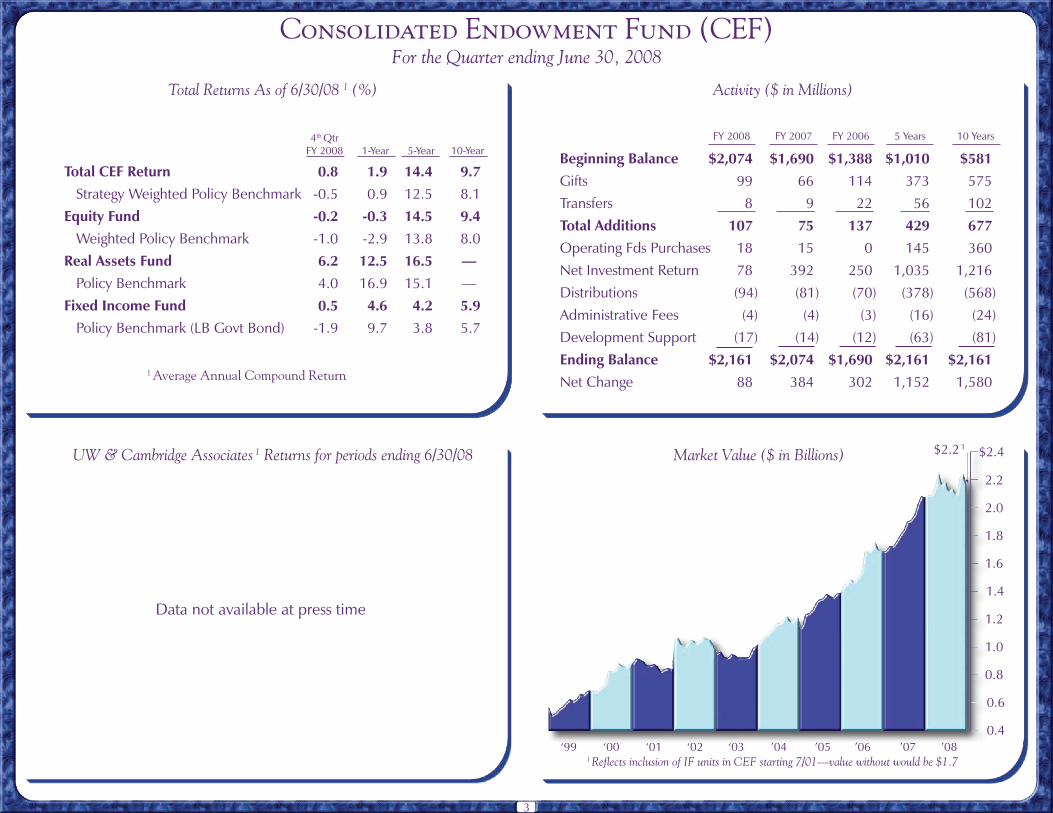
Consolidated Endowment Fund (CEF)For the Quarter ending June 30, 2008
Total Returns As of 6/30/08 1 (%) Activity ($ in Millions)
1-Year 5-Year
1 Average Annual Compound Return
4th QtrFY 2008
Total CEF Return 0.8 1.9 14.4 9.7 Strategy Weighted Policy Benchmark -0.5 0.9 12.5 8.1Equity Fund -0.2 -0.3 14.5 9.4 Weighted Policy Benchmark -1.0 -2.9 13.8 8.0Real Assets Fund 6.2 12.5 16.5 — Policy Benchmark 4.0 16.9 15.1 —Fixed Income Fund 0.5 4.6 4.2 5.9 Policy Benchmark (LB Govt Bond) -1.9 9.7 3.8 5.7
Beginning Balance $2,074 $1,690 $1,388 $1,010 $581Gifts 99 66 114 373 575Transfers 8 9 22 56 102Total Additions 107 75 137 429 677Operating Fds Purchases 18 15 0 145 360Net Investment Return 78 392 250 1,035 1,216 Distributions (94) (81) (70) (378) (568)Administrative Fees (4) (4) (3) (16) (24)Development Support (17) (14) (12) (63) (81)Ending Balance $2,161 $2,074 $1,690 $2,161 $2,161Net Change 88 384 302 1,152 1,580
FY 2007FY 2008 FY 2006 5 Years 10 Years
UW & Cambridge Associates 1 Returns for periods ending 6/30/08
10-Year
$2.2 1
Data not available at press time
Market Value ($ in Billions) $2.4
0.8
1.0
1.2
1.4
1.6
1.8
2.0
2.2
0.4
0.6
1 Reflects inclusion of IF units in CEF starting 7/01—value without would be $1.7 ‘99 ‘00 ‘01 ‘02 ‘03 ’04 ’05 ’06 ’07 ’08

4
Performance Update
Sources: Cambridge Associates and Northern Trust1 Total Return: average annual compound return (dividend or interest plus capital appreciation or depreciation)2 Provided by Cambridge Associates on a quarter lag.
4th Qtr FY ‘08 1 Year 3 Years 5 Years 10 Years
Total Return 1 As of 6/30/08
Consolidated Endowment Fund 0.8 1.9 14.0 14.4 9.7Equity Fund -0.2 -0.3 12.9 14.5 9.4Domestic Equity 1.1 -10.8 5.7 9.0 6.6 Core Equity -1.3 -13.6 4.5 8.5 5.8 Value Equity 2.9 -5.3 7.6 9.8 8.1 Growth Equity 7.1 -6.8 9.1 12.6 7.1International Developed Markets -2.4 -11.2 11.4 16.0 5.8International Emerging Markets -2.0 8.7 31.3 32.3 18.1Marketable Alternatives 2.6 3.7 11.8 12.2 11.2Non-Marketable Alternatives 2 -0.8 15.6 20.6 19.6 13.4Real Assets Fund 6.2 12.5 17.1 16.5 --Fixed Income Fund 0.5 4.6 5.1 4.2 5.9Market Indices Equity Indices S&P 500 -2.7 -13.1 4.4 7.6 2.9Russell 3000 -1.7 -12.7 4.7 8.4 3.5Russell 2000 0.6 -16.2 3.8 10.3 5.5Dow Jones -6.9 -13.3 5.8 7.2 4.5NASDAQ 0.6 -11.9 3.7 7.2 1.9MSCI ACWI ex US -0.9 -6.2 16.2 19.4 7.7Emerging Markets (IFCG) -4.2 1.7 25.3 29.5 15.9Fixed Income Indices LB Government Bond -1.9 9.7 4.6 3.8 5.7JP Morgan Global Hedged Bond Index -2.3 6.1 3.3 3.6 5.3

5
Invested Funds (IF)For the Quarter ending June 30, 2008
Total Return 1 (%) Fund Allocation by Pool ($ in Millions)
4th Qtr FY 2008 1-Year 5-Year 10-Year
Market Value ($ in Billions)Mix of Investments 1
$1.4
1.2
1.0
0.8
0.6
0.4
0.2
0.0
1 Average Annual Compound Return
Government & Agencies
36%
CEF Units34%
Asset Backed Securities: 3%
CashEquivalents
10%
Mortgage Related
17%
‘99 ‘00 ‘01 ‘02 ‘03 ’04 ’05 ’06 ’07 ’08
Invested Funds including CEF units($1.31 @ 6/30/08)
Invested Funds excluding CEF units ($0.87 @ 6/30/08)
Cash -0.6 7.5 3.3 5.0 Citi 2 Yr Treasury -1.1 7.7 3.2 4.6Liquidity -1.7 6.6 3.3 5.3 LB Intermediate Govt Bond -1.8 9.2 3.6 5.4IF excluding CEF units -1.3 7.0 3.4 5.3 Weighted Benchmark -1.6 8.6 3.5 5.2IF including CEF units -0.7 5.3 6.7 6.6 Weighted Benchmark -1.2 6.4 6.4 6.3
Cash Pool $280 21% 10%–40% 1.8 3.0 yrs
Liquidity Pool 589 45% 30%–60% 3.4 4.1
Total Cash & Liq. Pool $869 66%
CEF Units held by IF 34% 15%–40%
Total Invested Funds 100%
Range Duration Actual Maximum Fund Allocation
1 Not shown—Corporate Bonds (0.47%)

6
UWINCO Summary of Actions Taken Under Board Delegated Authorities Janaury 1, 2008 through August 15, 2008 ($ in Millions)
By the Chief Investment Officer
Private Markets
01/25/08 New Rimrock Capital Absolute Return $20.0
01/25/08 Reup Varde Partners Absolute Return $20.0
03/20/08 New Baupost Value Partners Absolute Return $50.0
04/10/08 Termination Och Ziff Absolute Return -$29.0
04/10/08 Termination Sirios Capital Partners Absolute Return -$15.0
07/23/08 New Centerbridge Credit Partners Absolute Return $20.0
04/10/08 Reup Riverside Capital Non-Marketable Alternatives $7.0
04/10/08 Reup TPG Non-Marketable Alternatives $6.0
05/02/08 New HIG Bayside Non-Marketable Alternatives $10.0
05/02/08 Reup Madrona Venture Partners Non-Marketable Alternatives $5.0
05/22/08 Reup JC Flowers Non-Marketable Alternatives $8.0
07/14/08 New Accel - KKR Captial Partners Non-Marketable Alternatives $7.0
03/03/08 Reup Cabot Industrial Value Fund Real Assets $12.0
03/03/08 Reup Square Mile Partners Real Assets $10.0
04/10/08 New CarVal Global Value Fund Real Assets $5.0
05/02/08 New Denham Capital Management Real Assets $9.0
05/23/08 Reup Avanti Land Investors Real Assets $12.0
Approved Action Manager / Fund Strategy Investment ($MM)

UWINCO Summary of Actions Taken Under Board Delegated Authorities Janaury 1, 2008 through August 15, 2008 ($ in Millions)
By the Chief Investment Officer
Public Markets Approved Action Manager / Fund Strategy Investment ($MM)
02/15/08 Liquidation Northern Trust Domestic Equity ($21.4 notional) -$5.0 collateral
03/20/08 Reup Brookside Capital Partners Domestic Equity $3.0
05/16/08 New Northern Trust Domestic Equity ($59.9 notional) $8.0 collateral
06/16/08 Termination AXA Rosenberg Domestic Equity -$116.0
07/14/08 New Northern Trust Domestic Equity ($25 notional) $5.0 collateral
02/15/08 Liquidation SSGA EAFE International Developed -$24.0
02/29/08 Reduction Arrowstreet Capital International Developed -$5.0
02/29/08 Reduction GMO International Developed -$5.0
02/29/08 Reduction Harris International Large Cap International Developed -$5.0
02/29/08 Reduction Harris International Small Cap International Developed -$5.0
01/25/08 New Lone Dragon Pine International Emerging Markets $7.5
02/29/08 Liquidation Goldman Sachs - Emerging Markets Swap International Emerging Markets -$17.8
02/29/08 Reduction Martin Currie China International Emerging Markets -$10.0
7