F 15 RESULTS PRESENTATION BRIEFING SLIDES2015/08/25 · 3 The reported net loss after tax for F15...
44
25 August 2015 Manager Company Announcements Australian Securities Exchange Level 4 20 Bridge Street SYDNEY NSW 2000 Market Information Services New Zealand Exchange Limited Level 2, NZX Centre 11 Cable Street Wellington New Zealand Dear Sir/Madam FY’15 RESULTS – PRESENTATION BRIEFING SLIDES Please find attached, for release to the market, a copy of a press release which the company intends to send to the media today together with the slides of a briefing to investors to be conducted following the release of the Company’s Preliminary Final Report for the 2015 financial year. These documents will also be available on the Company’s website at www.pacificbrands.com.au Yours faithfully Pacific Brands Limited John Grover Company Secretary Enc. For personal use only
Transcript of F 15 RESULTS PRESENTATION BRIEFING SLIDES2015/08/25 · 3 The reported net loss after tax for F15...

25 August 2015 Manager Company Announcements Australian Securities Exchange Level 4 20 Bridge Street SYDNEY NSW 2000 Market Information Services New Zealand Exchange Limited Level 2, NZX Centre 11 Cable Street Wellington New Zealand Dear Sir/Madam FY’15 RESULTS – PRESENTATION BRIEFING SLIDES Please find attached, for release to the market, a copy of a press release which the company intends to send to the media today together with the slides of a briefing to investors to be conducted following the release of the Company’s Preliminary Final Report for the 2015 financial year. These documents will also be available on the Company’s website at www.pacificbrands.com.au Yours faithfully Pacific Brands Limited
John Grover Company Secretary
Enc.
For
per
sona
l use
onl
y

1
25 August 2015
Full Year Results Announcement
The Company is now a higher quality, simplified business with greater growth potential and a strong balance sheet
Full year earnings stabilised in line with July guidance upgrade, with 2H EBIT up 26%
Bonds sales up 13% and Sheridan sales up 15% with strong comp store growth
All Operating Group earnings up in the second half
Debt free for the first time in the Company’s history
Group results for the year ended 30 June 2015
$ millions F15 F14 % Change 2H15 2H14 % Change
Sales 789.7 749.2 5.4 397.9 379.5 4.8
EBIT pre significant items 64.2 67.5 (4.8) 32.7 25.9 26.3
NPAT pre significant items 37.5 35.7 5.1 20.7 12.5 65.9
NPAT reported (97.7) (224.5) n.m. 11.0 (5.5) n.m.
Cash conversion 119% 58% 62pts 101% (10)% 111pts
Net cash/(debt) 0.9 (249.1) 100.4 0.9 (249.1) 100.4
Note: All amounts represent the continuing business except for NPAT reported which includes discontinued operations
Continuing business sales up 5.4%
‒ Bonds sales up 13% and Sheridan sales up 15%
‒ Strong comp store sales growth: Bonds up 20% and Sheridan up 13%
‒ Wholesale down due to challenges in the DDS channel
F15 full year earnings stabilised with a significant turnaround in the second half, up 26%
‒ 2H earnings up in every operating group as strategic initiatives start to deliver
‒ Substantial corporate cost reductions to offset c.$25 million of costs that would otherwise become stranded following divestments
Reported NPAT loss of $98 million largely due to announced first half non-cash impairments
Strong balance sheet and debt free, with high cash conversion and inventory down despite adverse FX impact of over $10 million
No final dividend declared with balance sheet strength prioritised in F15 year of transition
‒ Intention to reinstate at 1H16 with a payout ratio >50% subject to financial position and outlook at the time
Gaining real traction against the Company’s two key challenges: wholesale performance and FX depreciation
Clear strategic priorities in place to achieve profit growth in F16
David Bortolussi to assume permanent dual role of CEO and GGM, Underwear Group
For
per
sona
l use
onl
y
2
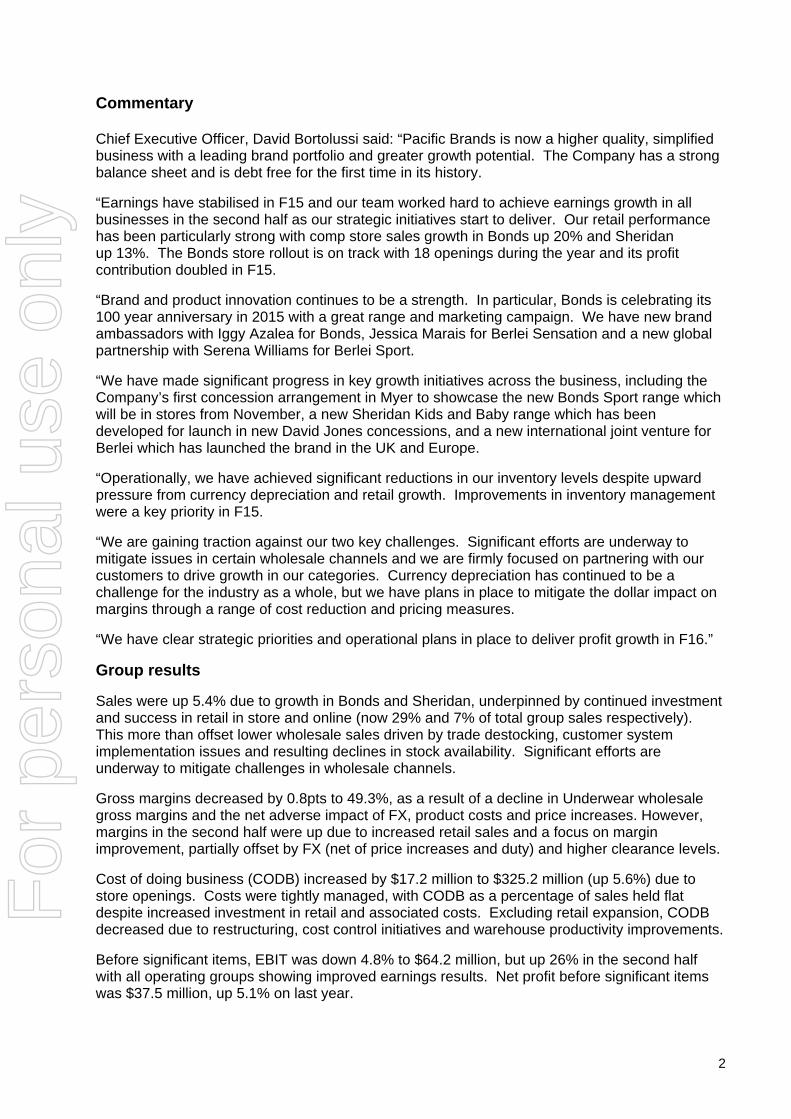
Commentary Chief Executive Officer, David Bortolussi said: “Pacific Brands is now a higher quality, simplified business with a leading brand portfolio and greater growth potential. The Company has a strong balance sheet and is debt free for the first time in its history.
“Earnings have stabilised in F15 and our team worked hard to achieve earnings growth in all businesses in the second half as our strategic initiatives start to deliver. Our retail performance has been particularly strong with comp store sales growth in Bonds up 20% and Sheridan up 13%. The Bonds store rollout is on track with 18 openings during the year and its profit contribution doubled in F15.
“Brand and product innovation continues to be a strength. In particular, Bonds is celebrating its 100 year anniversary in 2015 with a great range and marketing campaign. We have new brand ambassadors with Iggy Azalea for Bonds, Jessica Marais for Berlei Sensation and a new global partnership with Serena Williams for Berlei Sport.
“We have made significant progress in key growth initiatives across the business, including the Company’s first concession arrangement in Myer to showcase the new Bonds Sport range which will be in stores from November, a new Sheridan Kids and Baby range which has been developed for launch in new David Jones concessions, and a new international joint venture for Berlei which has launched the brand in the UK and Europe.
“Operationally, we have achieved significant reductions in our inventory levels despite upward pressure from currency depreciation and retail growth. Improvements in inventory management were a key priority in F15.
“We are gaining traction against our two key challenges. Significant efforts are underway to mitigate issues in certain wholesale channels and we are firmly focused on partnering with our customers to drive growth in our categories. Currency depreciation has continued to be a challenge for the industry as a whole, but we have plans in place to mitigate the dollar impact on margins through a range of cost reduction and pricing measures.
“We have clear strategic priorities and operational plans in place to deliver profit growth in F16.”
Group results
Sales were up 5.4% due to growth in Bonds and Sheridan, underpinned by continued investment and success in retail in store and online (now 29% and 7% of total group sales respectively). This more than offset lower wholesale sales driven by trade destocking, customer system implementation issues and resulting declines in stock availability. Significant efforts are underway to mitigate challenges in wholesale channels.
Gross margins decreased by 0.8pts to 49.3%, as a result of a decline in Underwear wholesale gross margins and the net adverse impact of FX, product costs and price increases. However, margins in the second half were up due to increased retail sales and a focus on margin improvement, partially offset by FX (net of price increases and duty) and higher clearance levels.
Cost of doing business (CODB) increased by $17.2 million to $325.2 million (up 5.6%) due to store openings. Costs were tightly managed, with CODB as a percentage of sales held flat despite increased investment in retail and associated costs. Excluding retail expansion, CODB decreased due to restructuring, cost control initiatives and warehouse productivity improvements.
Before significant items, EBIT was down 4.8% to $64.2 million, but up 26% in the second half with all operating groups showing improved earnings results. Net profit before significant items was $37.5 million, up 5.1% on last year.
For
per
sona
l use
onl
y

3
The reported net loss after tax for F15 was $97.7 million largely due to first half non-cash impairments of goodwill, brand names and plant and equipment ($138.5 million), driven by a change in the definition of cash generating units, adverse changes in FX rates and market dynamics. Balance sheet intangible assets now relate only to brand names for Bonds, Berlei and Sheridan.
Interest was down from $17.8 million to $12.9 million reflecting lower net debt and improved cash flow. Excluding the impact of significant items, the effective tax rate reduced from 28% to 27%.
A significant reduction was achieved in net working capital for the continuing business, which was $19.0 million or 14% lower despite an adverse FX inflationary impact of over $10 million. This was driven by a focus on clearance of aged and excess inventory, lower FOB product costs, reduced SKUs, a faster seasonal development calendar and reduced manufacturing lead times.
As a result, cash conversion improved significantly from 58% in F14 to 119% in F15. Along with divestment proceeds, this contributed to a decrease in net debt from $249.1 million at June 2014 to $0.9 million net cash at June 2015, the first time in the Company’s history it has been debt free.
Return on tangible capital employed improved 13.9 pts to 40.2% due to a higher quality business following the divestments and improved working capital management.
Transition of divestments and simplification of the business
Brand Collective has now transferred to its new owner Anchorage Capital Partners, with remaining Workwear transition services to Wesfarmers Industrial & Safety expected to be substantially completed by 31 December 2015 as planned.
Substantial actions have been taken to reduce corporate costs, and c.$25 million of unrecovered corporate (or stranded) costs post divestments will have been offset through various cost saving initiatives following full transition of the divested businesses. Further opportunities to reduce corporate and operating group costs continue to be explored.
Segment results
Underwear
Total sales grew by 4.0% to $508.6 million:
Bonds sales were up 13.0% driven by retail with wholesale flat. Non-Bonds brands were down 12.5% overall, due mainly to DDS channel underperformance
Total retail was up 44.5% with comp store growth up 20% overall, 18 store openings in the year and annualisation of 25 additional stores in F14. Bonds in store and online sales were 25% and 8% of total Bonds sales respectively, with total direct to consumer sales up from 13% to 33% over the past 2 years
Total Underwear wholesale sales were down 5.7% due to challenges in the DDS channel, partially mitigated by growth in supermarkets
EBIT pre significant items for the year was marginally down by 1.8% to $60.2 million, with a significant decline in first half EBIT due mainly to lower wholesale gross margins. However, earnings were 33% up in the second half due to improved wholesale and retail contribution.
For
per
sona
l use
onl
y

4
Sheridan
Total business sales grew by 12.8% to $191.3 million:
Retail channels were up 19.4%, driven by strong Australian comp growth but with the UK down significantly
Increasing contribution from new lifestyle categories, with core linen and towels remaining in growth
Wholesale channel was down 3.2% overall due to UK underperformance
Due to the strong Australian retail performance, EBIT pre significant items of $13.9 million was up 9.2% despite UK earnings being materially down due to challenging market conditions and unprofitable prior period growth initiatives, compounded by an IT implementation.
Whilst Sheridan will continue to pursue growth opportunities, management will increase the focus on improving return on sales through a range of initiatives to improve profitability in Australia and turnaround the UK operations. Some restructuring costs may be incurred but these are currently not expected to be significant.
Tontine and Dunlop Flooring
Sales were broadly flat at $89.7 million (down $0.7 million or 0.8%):
Tontine sales were down 5.8% due to DDS underperformance
Dunlop Flooring sales were up 5.3% due to improvements in the domestic housing market and launch of a new hard flooring product
EBIT pre significant items was up $0.9 million or 16.3%:
Tontine earnings were marginally up, with sales decline and margin pressure offset by cost savings – a growth and profit improvement plan is being executed
Dunlop Flooring result was up due to growth, improved margins and cost control
Dividends
No final dividend has been declared, with balance sheet strength being prioritised during F15. It is the Board’s current intention to resume dividends at 1H16, subject to financial position and outlook at the time, with a target payout ratio of at least 50% of NPAT.
Strategic priorities
The Company’s strategic priorities are as follows:
1. Be a house of leading brands – lead in creative design, product innovation and quality, invest in engaging marketing and expand into adjacent product categories
2. Reshape and expand distribution – reshape and grow wholesale channels, maximise retail potential (online, stores and concession) and progressively grow international business in Bonds, Berlei and Sheridan
3. Develop a sustainable, Lean global supply chain – reduce product and logistics costs, improve development and manufacturing lead times, increase forecast accuracy and service levels, and enhance sustainability and ethical trading outcomes
By focusing on these corporate and related operating group priorities, management is targeting sustainable profit growth and delivery of reliable shareholder returns going forward.
For
per
sona
l use
onl
y
5
Trading update and outlook
The Company expects a continuation of challenging and variable market conditions.
1H16 sales for the 8 weeks to date are up 8% versus PCP, but 1H16 results will largely be dependent on November and December trading which are significant months.
Inventory levels are expected to be higher at 31 December 2015 due to FX depreciation, a relatively early Chinese New Year which impacts shipment timing, and sales seasonality and growth.
For the continuing business before significant items, F16 EBIT is expected to be up on PCP ($64.2 million).
FX headwinds continue and may impact future earnings, however the Company has plans in place to mitigate the dollar impact of FX depreciation on margins through a combination of sourcing benefits, mix improvement, CODB reduction and price increases.
It is the Board’s current intention to resume dividends in relation to the 1H16 result, subject to financial position and outlook at the time with a target dividend payout ratio of at least 50% of NPAT.
For further information contact:
Investors Media
Joanne Higham Sue Cato General Manager, Investor Relations Cato Counsel Pacific Brands Limited +61 419 282 319 +61 3 9947 4919 +61 421 568 395 [email protected]
For
per
sona
l use
onl
y

6
Appendix A: Non-IFRS financial information
All full year statutory numbers referred to in this document have been audited.
In addition to statutory reported amounts, certain non-IFRS measures are used by Directors and management as measures of assessing the financial performance of the Company and individual operating groups, including:
Average AUD:USD hedged rates through the P&L
Cash conversion
Comp store sales growth
Debtor days, creditor days and inventory turns
Return on capital employed
Sales by brand, channel and business
Store numbers
Stranded costs, FX impact on stock, 1H16 trading to date
The Directors consider that these performance measures are appropriate for their purposes and present meaningful information on the underlying drivers of the business. Many of the measures used are common practice in the industry within which Pacific Brands operates.
Some non-IFRS financial information is stated before significant items as disclosed in Note 6 to the Financial Statements. Results excluding such items are considered by Directors to be a better basis for comparison from period to period as well as more comparable with future performance. They are also the primary measure of earnings considered by management in operating the business and by Directors in determining dividends taking into account other considerations.
For
per
sona
l use
onl
y

7
Appendix B: Continuing business Sales & EBIT before significant items
Sales
F15 change vs PCP
2H15 change vs PCP
$ millions F15 F14 $m % $m %
Segments
Underwear 508.6 489.2 19.5 4.0 9.5 3.8
Sheridan 191.3 169.7 21.6 12.8 10.1 11.8
Tontine & Dunlop Flooring 89.7 90.4 (0.7) (0.8) (1.2) (2.6)
Group 789.7 749.2 40.4 5.4 18.4 4.8
EBIT before significant items
F15 change vs PCP
2H15 change vs PCP
$ millions F15 F14 $m % $m %
Segments
Underwear 60.2 61.3 (1.1) (1.8) 8.2 32.6
Sheridan 13.9 12.8 1.2 9.2 0.7 16.4
Tontine & Dunlop Flooring 5.9 5.0 0.8 16.3 0.5 19.0
Group 64.2 67.5 (3.3) (4.8) 6.8 26.3
For
per
sona
l use
onl
y

Full Year Results 2015
David Bortolussi, Chief Executive OfficerDavid Muscat, Chief Financial Officer
25 August 2015
For
per
sona
l use
onl
y

11
Full year earnings stabilised with 2H earnings up 26%
Results in line with July guidance upgrade Continuing business sales up 5.4%
‒ Bonds up 13% and Sheridan up 15%‒ Strong retail comp growth: Bonds up 20% and Sheridan up 13%
Continuing EBIT pre significant items down 4.8% on PCP – but a significant turnaround in 2H up 26% Continuing NPAT pre significant items up 5.1% on PCP Reported NPAT loss of $98m largely due to 1H15 non-cash impairment charges ($138.5m) Debt free due to divestments, improved working capital management and strong cash conversion No final dividend declared with balance sheet strength prioritised in F15 year of transition
‒ Current intention to reinstate dividends at 1H16 with a payout ratio >50% subject to financial position and outlook at the time
1. Significant items contained in Note 6 of the Financial StatementsNote: All amounts represent the continuing business except for NPAT (reported) which includes discontinued operations
$ millions F15 Change vs PCP 2H15 Change vs PCP
Sales 789.7 5.4% 397.9 4.8%
EBIT (pre significant items) 64.2 (4.8)% 32.7 26.3%
NPAT (pre significant items) 37.5 5.1% 20.7 65.9%
NPAT (reported) (97.7) n.m. 11.0 n.m.
Cash conversion 119% 62pts 101% 111pts
Net cash / (debt) 0.9 $250.0m 0.9 $250.0m
For
per
sona
l use
onl
y
22
#1 brand in pillows
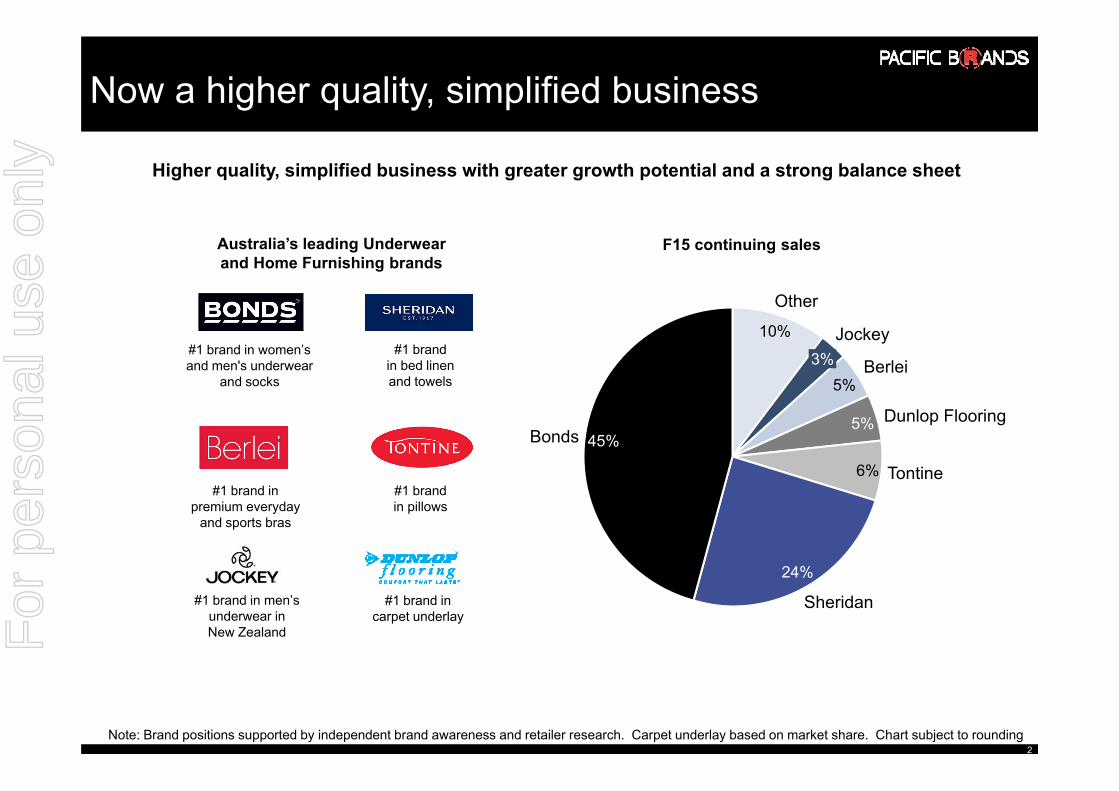
Now a higher quality, simplified business
F15 continuing sales
Note: Brand positions supported by independent brand awareness and retailer research. Carpet underlay based on market share. Chart subject to rounding
#1 brand in women’s and men's underwear
and socks
#1 brand in premium everyday
and sports bras
#1 brand in bed linen and towels
#1 brand in carpet underlay
#1 brand in men’s underwear in New Zealand
Higher quality, simplified business with greater growth potential and a strong balance sheet
Tontine
Bonds
24%
Sheridan
5%
10%
3%
Other
Jockey
Berlei
5% Dunlop Flooring
6%
45%
Australia’s leading Underwear and Home Furnishing brands
For
per
sona
l use
onl
y

33
Substantial corporate cost reductions achieved
c.$25m of unrecovered corporate (or stranded) costs post divestments will have been offset through various cost saving initiatives following full transition of divested businesses
‒ Improved outcome versus initial net stranded cost estimate of c.$5-6m ‒ Further 2H15 actions included China sourcing operation reduced from 3 sites to 2 with the closure
of the Hong Kong office, renegotiation of key IT and other service contracts, and additional corporate headcount and other expense reductions
Brand Collective now fully transferred to Anchorage Capital Partners
Workwear transition services to Wesfarmers Industrial & Safety will continue during 1H16 as planned
‒ Expected to be substantially completed by 31 December 2015‒ No further stranded costs expected post completion of Workwear transition services
Continuing to explore further opportunities to simplify and reduce corporate costs
For
per
sona
l use
onl
y
44
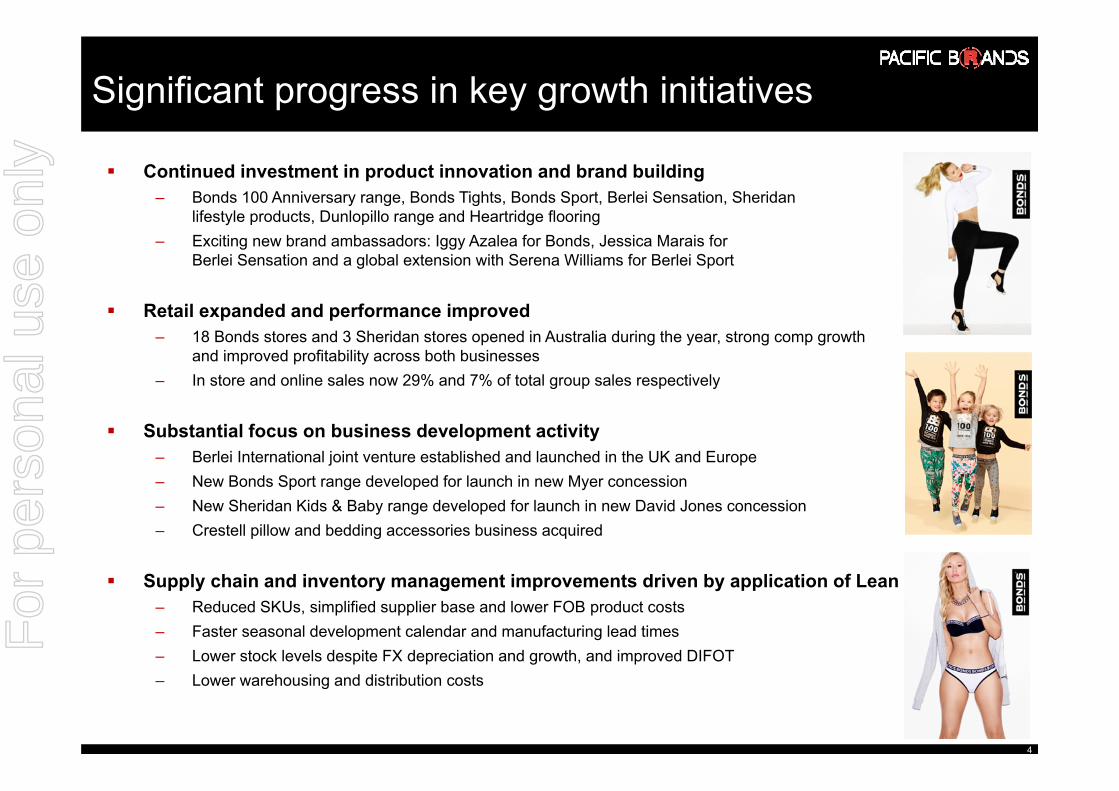
Significant progress in key growth initiatives
Continued investment in product innovation and brand building‒ Bonds 100 Anniversary range, Bonds Tights, Bonds Sport, Berlei Sensation, Sheridan
lifestyle products, Dunlopillo range and Heartridge flooring‒ Exciting new brand ambassadors: Iggy Azalea for Bonds, Jessica Marais for
Berlei Sensation and a global extension with Serena Williams for Berlei Sport
Retail expanded and performance improved‒ 18 Bonds stores and 3 Sheridan stores opened in Australia during the year, strong comp growth
and improved profitability across both businesses‒ In store and online sales now 29% and 7% of total group sales respectively
Substantial focus on business development activity‒ Berlei International joint venture established and launched in the UK and Europe‒ New Bonds Sport range developed for launch in new Myer concession‒ New Sheridan Kids & Baby range developed for launch in new David Jones concession‒ Crestell pillow and bedding accessories business acquired
Supply chain and inventory management improvements driven by application of Lean‒ Reduced SKUs, simplified supplier base and lower FOB product costs‒ Faster seasonal development calendar and manufacturing lead times‒ Lower stock levels despite FX depreciation and growth, and improved DIFOT‒ Lower warehousing and distribution costs
For
per
sona
l use
onl
y
55
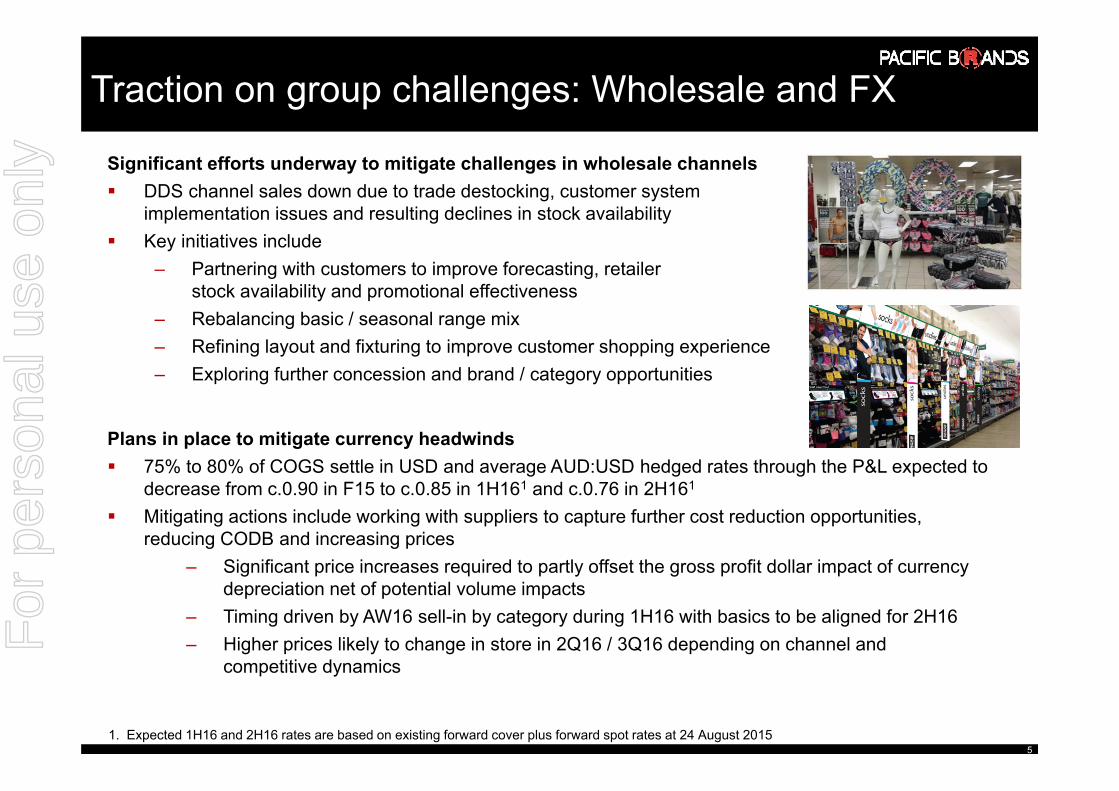
Traction on group challenges: Wholesale and FX
Significant efforts underway to mitigate challenges in wholesale channels DDS channel sales down due to trade destocking, customer system
implementation issues and resulting declines in stock availability Key initiatives include
‒ Partnering with customers to improve forecasting, retailer stock availability and promotional effectiveness
‒ Rebalancing basic / seasonal range mix ‒ Refining layout and fixturing to improve customer shopping experience ‒ Exploring further concession and brand / category opportunities
Plans in place to mitigate currency headwinds 75% to 80% of COGS settle in USD and average AUD:USD hedged rates through the P&L expected to
decrease from c.0.90 in F15 to c.0.85 in 1H161 and c.0.76 in 2H161
Mitigating actions include working with suppliers to capture further cost reduction opportunities, reducing CODB and increasing prices
‒ Significant price increases required to partly offset the gross profit dollar impact of currency depreciation net of potential volume impacts
‒ Timing driven by AW16 sell-in by category during 1H16 with basics to be aligned for 2H16‒ Higher prices likely to change in store in 2Q16 / 3Q16 depending on channel and
competitive dynamics
1. Expected 1H16 and 2H16 rates are based on existing forward cover plus forward spot rates at 24 August 2015
For
per
sona
l use
onl
y

66
1. Invest in Bonds and other key brands
2. Drive big innovation and faster fashion
3. Reshape and growwholesale contribution
4. Maximise retail potential5. Progressively take Bonds
and Berlei international
Underwear
1. Invest in Sheridan brand2. Expand in adjacent categories3. Maximise retail potential and
move wholesale to concession where possible
4. Restructure and turnaround UK business
5. Improve Australian business profitability
Sheridan
1. Invest in bedding accessories category
2. Improve Tontine profitability3. Optimise carpet underlay
business4. Expand into hard flooring
category5. Maintain lowest cost
manufacturing position
Tontine & FlooringRelated Operating Group Priorities
Sustainable, Lean global supply chain
Great and safe place to work
Group Strategic Priorities
1 Be a house of leading brands – lead in creative design, product innovation and quality; invest in engaging marketing; and expand into adjacent categories
2 Reshape and expand distribution – reshape and grow wholesale channels; maximise retail potential (online, stores and concession); and progressively grow international business in Bonds, Berlei and Sheridan
3 Develop a sustainable, Lean global supply chain – reduce product and logistics costs; improve development and manufacturing lead times; increase forecast accuracy and service levels; and enhance sustainability and ethical trading outcomes
Clear strategic priorities to achieve earnings growthF
or p
erso
nal u
se o
nly

77
Operating Group performance
For
per
sona
l use
onl
y

881. Reported EBIT includes 1H impairment of goodwill and brand names in F15 and profit on sale of Wentworthville property less other significant items in F14
$508.6m
30%
70%Bonds
Non-Bonds
13.0
(12.5)
Underwear earnings stabilised and 2H up
$ millions F15 F14 Change
Sales 508.6 489.2 4.0%
EBIT (pre significant items) 60.2 61.3 (1.8)%
EBIT (reported)1 (24.7) 69.6 n.m.
Bonds sales up 13%‒ Growth driven by retail – in store and online sales
now 25% and 8% of Bonds sales respectively with total direct to consumer sales up from 13% to 33% over the past 2 years
‒ Bonds wholesale sales flat Non-Bonds brands down overall, due mainly to challenges in
the DDS channel EBIT pre significant items marginally down 1.8% versus PCP
‒ Significant decline in 1H15 EBIT due mainly to a decline in wholesale gross margins
‒ Growth in 2H15 EBIT (up 33% on PCP) due to improved wholesale and retail contribution
% Change vs PCPSales by brand
Wholesale (5.7)
Retail 44.5
73%
$508.6m
27%
Sales by channel % Change vs PCP
For
per
sona
l use
onl
y

99
Bonds sales up significantly
1. Includes Rio, Hestia, Holeproof, Red Robin and TMI
Underwear sales by brand Change
$ millions F15 F14 $m % Comments
Bonds 357.9 316.7 41.2 13.0 Growth in owned retail (new stores and strong comp sales growth +20%)
Wholesale sales flat, with underperformance in DDS offset by growth in supermarket channel
Babywear and socks sales particularly strong Strong innovation program eg Christmas range, Bonds
Tights, outerwear and Bonds 100 anniversary range
Berlei 42.0 43.1 (1.2) (2.7) Core bra sales flat with underwear and hosiery down due to range rationalisation
New Sensation range launched in August 2015
Jockey 26.7 26.8 (0.1) (0.2) Sales stabilised with additional distribution opportunities
Explorer 17.7 17.2 0.5 2.8 Sales growth driven by performance in supermarkets and DS
Hosiery brands 22.2 31.4 (9.2) (29.2) Driven by category and competitive dynamics, as well as the launch of Bonds Tights
Other1 42.1 54.0 (11.9) (22.0) Declines in DDS due to increased competition, range rationalisation and customer specific issues
Total 508.6 489.2 19.5 4.0
For
per
sona
l use
onl
y

1010
Bonds retail performance strong – comp growth +20%
Retail sales up 44.5% driven by store openings and positive comp store growth across the network of 20%
Store rollout opportunities continue‒ 18 new sites opened in F15 including Bondi Junction
and Macquarie‒ Chadstone store relocated and expanded‒ Retail format updated to improve stock density, mix and in
store navigation Retail channel profit contribution doubled in F15 due to sales growth,
improved merchandising and gross margins, maturing store operations and increased leverage of network overhead
44 42 41 36 34
17 22 3553
38
6661
75
1H151H14
59
2H13
35
2H15
79
47
1H13
47
2H14
64
Bonds Bonds Outlet / ClearanceBonds Kids
Store rollout trajectory
For
per
sona
l use
onl
y

1111
Strong product innovation and marketing program
Bonds Classics – A reunion of Bonds’ iconic ambassadors coming together to celebrate the best of Bonds’ basics
Bonds Tights – new adjacent category launched across all channels featuring Iggy Azalea
Bonds 100 – celebrating Bonds’ 100th birthday with a cross category range supported by Bonds’ biggest campaign ever
Bonds New Era – new basics range in underwear linked to Bonds 100
Berlei Sport – Serena Williams as The Bounce Master launching our new ‘Shift’ bra – now Serena’s favourite
Berlei The Sensation – the first ‘everyday bra’ launch for Berlei in a number of years –featuring Jessica Marais
Jockey – Leverage of All Blacks partnership with the ‘All Colour’ campaign
For
per
sona
l use
onl
y

1212
Bonds 100 year anniversary range successful
Bonds is celebrating 100 years in 2015 with a new Bonds 100 range‒ covering mens, womens, kids and baby, from underwear to socks
to apparel‒ first whole of brand and complete product range launch in years
Global superstar and Aussie girl Iggy Azalea announced as the new Bonds ambassador and headlines the birthday campaign
Biggest Bonds campaign and investment ever spanning from TV and Cinema to Outdoor, Digital, POS and PR over a 3 month campaign period
In store, the campaign has come alive with high impact POS in all major wholesale partners and Bonds stores
Sell-thru to date has been above expectations
Celebration of Bonds 100th birthday complemented by a new product range and innovative campaign
For
per
sona
l use
onl
y

1313
Bonds Sport to expand into new Myer concession
Strong consumer and customer interest has encouraged Bonds to increase its focus on the athleisure category with a broader sport range in womens
New Bonds Sport concession to showcase range aligning to a focus on athleisure at Myer‒ Additional trading space across all Myer stores with larger footprints in flagship stores‒ Bonds range will include sport and apparel ranges‒ Investment in shop-in-shop fitout in 12 stores, plus softer visual merchandising in other stores‒ Bonds to staff majority of stores to varying levels‒ Uniquely available at Myer
Launch planned from November 2015
SPORTFor
per
sona
l use
onl
y
1414
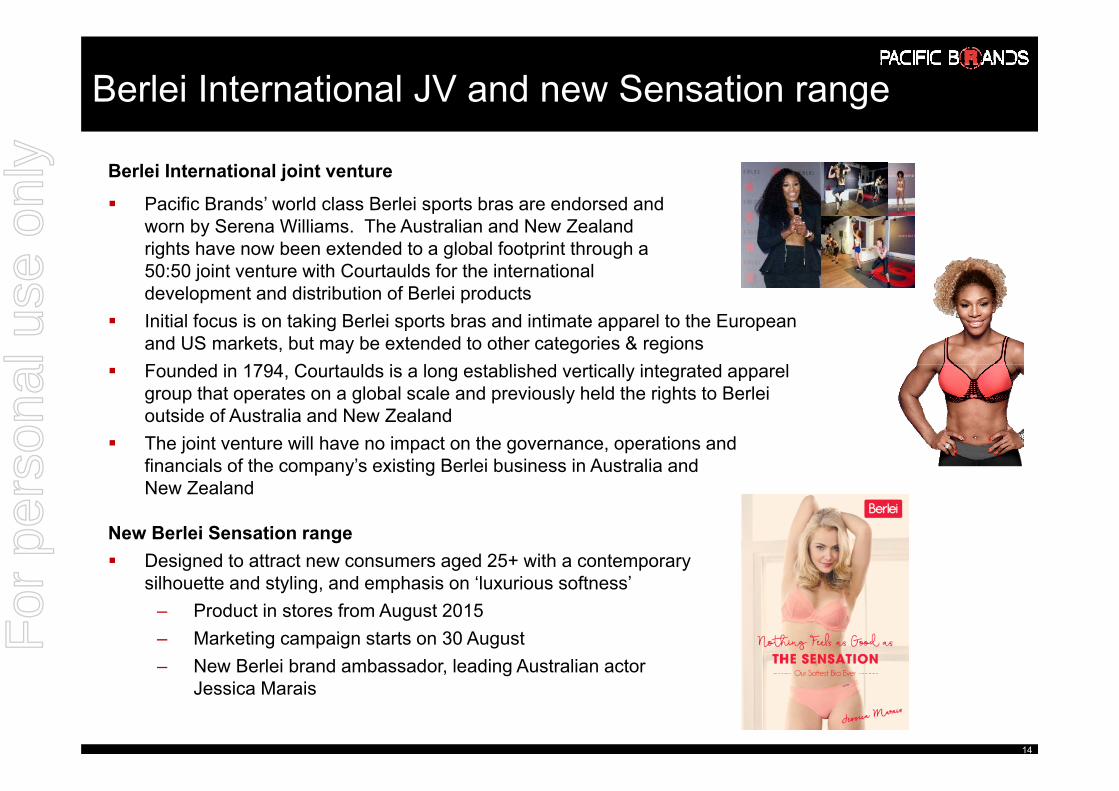
Berlei International JV and new Sensation range
Berlei International joint venture
Pacific Brands’ world class Berlei sports bras are endorsed and worn by Serena Williams. The Australian and New Zealand rights have now been extended to a global footprint through a 50:50 joint venture with Courtaulds for the international development and distribution of Berlei products
Initial focus is on taking Berlei sports bras and intimate apparel to the European and US markets, but may be extended to other categories & regions
Founded in 1794, Courtaulds is a long established vertically integrated apparel group that operates on a global scale and previously held the rights to Berlei outside of Australia and New Zealand
The joint venture will have no impact on the governance, operations and financials of the company’s existing Berlei business in Australia and New Zealand
New Berlei Sensation range Designed to attract new consumers aged 25+ with a contemporary
silhouette and styling, and emphasis on ‘luxurious softness’‒ Product in stores from August 2015‒ Marketing campaign starts on 30 August‒ New Berlei brand ambassador, leading Australian actor
Jessica Marais
For
per
sona
l use
onl
y

15151. Reported EBIT includes 1H impairment of goodwill in F15
Sheridan growth driven by Australian retail
Sales up 12.8% driven by strong retail performance‒ Strong Australian comp growth, but UK
down significantly‒ Increasing contribution from new lifestyle categories,
with core linen and towels remaining in growth‒ Wholesale channel down 3.2% overall due to
UK underperformance EBIT pre significant items in growth
‒ Australian sales and earnings significantly up in F15‒ UK earnings materially down due to challenging market
conditions and unprofitable prior period growth initiatives, compounded by IT transition
‒ UK turnaround plan already underway
$ millions F15 F14 Change
Sales 191.3 169.7 12.8%
EBIT (pre significant items) 13.9 12.8 9.2%
EBIT (reported)1 (21.1) 12.3 n.m.
Wholesale
Retail 75%
$191.3m
25%
19.4
(3.2)
% Change vs PCPSales by channel
For
per
sona
l use
onl
y

1616
1. Sheridan Factory Outlets. Includes 5 SFO concession outlets2. Concessions are stores within a store. In Australia, they are within David Jones. In the United Kingdom, they are predominantly within Debenhams
and House of Fraser. Sales in concessions are classified as retail sales
Sheridan retail performance strong – comp growth +13%
Retail sales up 19.4% driven by strong comp sales performance, up 13% overall‒ Boutique comp sales up significantly due to improved execution and growth in existing
and new categories
‒ SFO1 comp sales up significantly driven by clearance and improved execution
‒ Concession2 sales in growth overall with Australian sales up partially offset by UK underperformance and network rationalisation in that region
Store network expansion restricted over past couple of years due to previous financial constraints, but will be pursued going forward
8783 78
4534 48
16
F14
1713114
F15
143148
F13
ConcessionBoutique SFO
Store numbers
For
per
sona
l use
onl
y

1717
Sheridan Kids & Baby concession to launch in DJs
New Sheridan Kids and Baby concession in David Jones to showcase a premium range in 35 stores nationwide with additional trading space from October 2015‒ will accelerate consumer awareness of Sheridan’s new Kids and Baby range through
rapid expansion into this under-serviced growth category ‒ provides increased space efficiency in store and creates category and online
expansion opportunities The extended range will include soft toys, baby clothing, hooded character towels, room décor, a broad
gift offer and innovations on Sheridan’s premium bed and bath core offering Sheridan is the first Australian bed linen partner of SIDS and Kids
For
per
sona
l use
onl
y

1818
Sheridan profit improvement program
Whilst Sheridan will continue to pursue growth opportunities, management will also increase the focus on improving return on sales through a range of initiatives to improve the profitability of Australia and turnaround its loss making UK operations
1. Key initiatives to increase profitability of Australia operations Consolidate Sheridan’s warehousing and logistics operations from Trade Coast (Queensland) into
the Underwear distribution centre in Truganina (Victoria) Review product sourcing arrangements with Li & Fung to optimise agency versus direct sourcing
mix going forward Simplify wholesale business and move to concession where possible Increase leverage of shared services to reduce overhead and administration costs
2. UK turnaround plan already underway Reshape distribution footprint to focus on most profitable concessions and online Improve range management, merchandise planning and gross margins Reduce overhead and administration costs
Some restructuring costs may be incurred but these are currently not expected to be significantFor
per
sona
l use
onl
y
1919
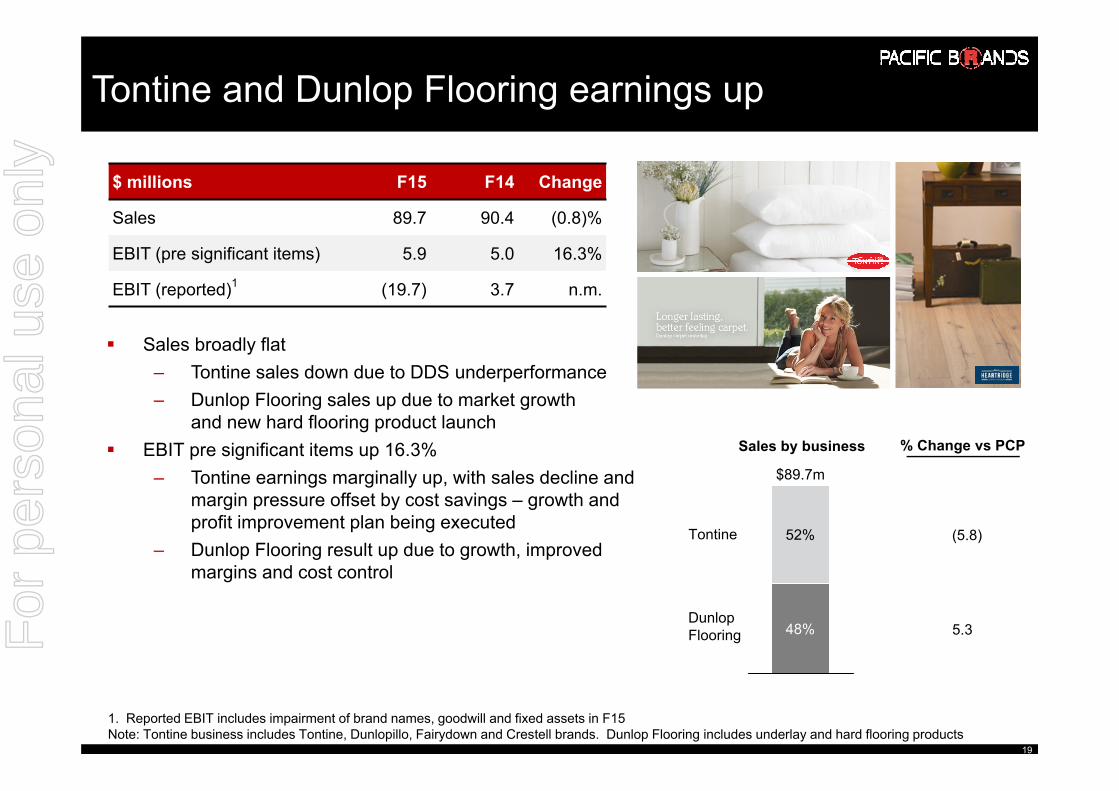
1. Reported EBIT includes impairment of brand names, goodwill and fixed assets in F15Note: Tontine business includes Tontine, Dunlopillo, Fairydown and Crestell brands. Dunlop Flooring includes underlay and hard flooring products
Tontine and Dunlop Flooring earnings up
Sales broadly flat‒ Tontine sales down due to DDS underperformance‒ Dunlop Flooring sales up due to market growth
and new hard flooring product launch EBIT pre significant items up 16.3%
‒ Tontine earnings marginally up, with sales decline and margin pressure offset by cost savings – growth and profit improvement plan being executed
‒ Dunlop Flooring result up due to growth, improved margins and cost control
52%
48%
$89.7m
Tontine
Dunlop Flooring
(5.8)
5.3
$ millions F15 F14 Change
Sales 89.7 90.4 (0.8)%
EBIT (pre significant items) 5.9 5.0 16.3%
EBIT (reported)1 (19.7) 3.7 n.m.
Sales by business % Change vs PCP
For
per
sona
l use
onl
y

2020
Focused business development in flooring and bedding
Successful entry into hard flooring market with Heartridge
Heartridge is a new collection of timber, laminate and vinyl plank flooring launched by Dunlop Flooring in 2H15
The collection includes 26 innovative products with multiple finishes and a range of colour combinations
Successful launch with preferred supplier status in six major retailers to date Progressive organic business development expected
Crestell Bolt-on acquisition to strengthen distribution and provide
manufacturing efficiencies Acquired Crestell pillows and bedding accessories business in June 2015
for $1.6m related to brand stock and equipment at a discount to book value Includes Crestell, Biozone, Dream-a-way and Natures Dream brands
which are distributed through supermarket, discount department store and specialty channels
For
per
sona
l use
onl
y

2121
Group Financial Results
For
per
sona
l use
onl
y
2222
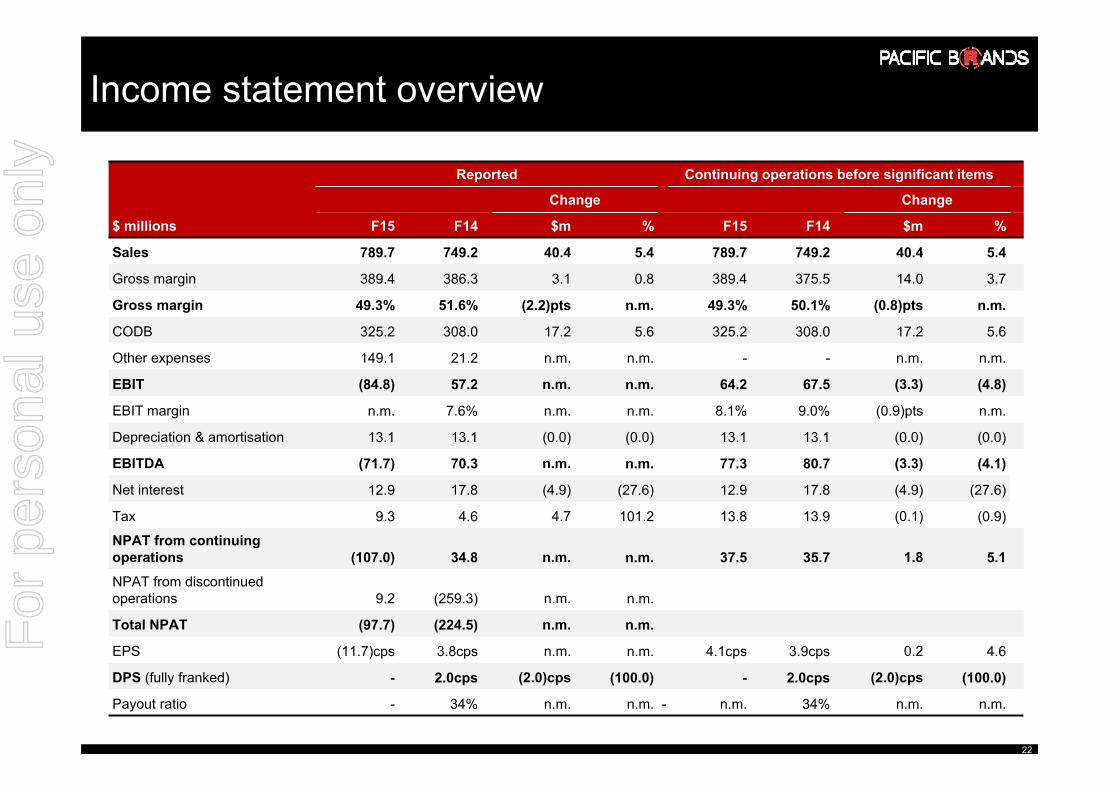
Income statement overview
$ millions
Reported Continuing operations before significant items
Change Change
F15 F14 $m % F15 F14 $m %
Sales 789.7 749.2 40.4 5.4 789.7 749.2 40.4 5.4
Gross margin 389.4 386.3 3.1 0.8 389.4 375.5 14.0 3.7
Gross margin 49.3% 51.6% (2.2)pts n.m. 49.3% 50.1% (0.8)pts n.m.
CODB 325.2 308.0 17.2 5.6 325.2 308.0 17.2 5.6
Other expenses 149.1 21.2 n.m. n.m. - - n.m. n.m.
EBIT (84.8) 57.2 n.m. n.m. 64.2 67.5 (3.3) (4.8)
EBIT margin n.m. 7.6% n.m. n.m. 8.1% 9.0% (0.9)pts n.m.
Depreciation & amortisation 13.1 13.1 (0.0) (0.0) 13.1 13.1 (0.0) (0.0)
EBITDA (71.7) 70.3 n.m. n.m. 77.3 80.7 (3.3) (4.1)
Net interest 12.9 17.8 (4.9) (27.6) 12.9 17.8 (4.9) (27.6)
Tax 9.3 4.6 4.7 101.2 13.8 13.9 (0.1) (0.9)
NPAT from continuing operations (107.0) 34.8 n.m. n.m. 37.5 35.7 1.8 5.1NPAT from discontinued operations 9.2 (259.3) n.m. n.m.
Total NPAT (97.7) (224.5) n.m. n.m.
EPS (11.7)cps 3.8cps n.m. n.m. 4.1cps 3.9cps 0.2 4.6
DPS (fully franked) - 2.0cps (2.0)cps (100.0) - 2.0cps (2.0)cps (100.0)
Payout ratio - 34% n.m. n.m. - n.m. 34% n.m. n.m.
For
per
sona
l use
onl
y

2323
Full year margins decreased 0.8pts versus F14 as a result of:‒ Decline in Underwear wholesale gross margins due to increased promotional activity, associated
trade spend and higher clearance sales with a focus on optimising stock levels‒ Net adverse impact on margin of FX, product costs, price increases and duty benefit
Trajectory improved with 2H15 gross margins up due to:‒ Positive sales mix impact of higher retail sales and focus on margin improvement‒ Partially offset by FX (net of price increases and duty) and higher clearance levels that resulted
in an improved stock position
Continuing business Change
$ millions F15 F14 $m %
Sales 789.7 749.2 40.4 5.4
Gross margin1 389.4 375.5 14.0 3.7
Gross margin (%) 49.3 50.1 (0.8)pts n.m.
Full year gross margins down 0.8pts but 2H15 up
0.890.910.981.01
2H141H14 2H151H15
Average AUD:USD hedged rates through the P&L
1. F14 excludes profit on sale of Wentworthville property
For
per
sona
l use
onl
y

2424
Continuing business Change
$ millions F15 F14 $m %
Freight and distribution 64.3 66.1 (1.7) (2.6)
Sales and marketing 194.7 174.1 20.6 11.8
Administrative 66.1 67.8 (1.6) (2.4)
CODB 325.2 308.0 17.2 5.6
CODB / Sales 41.1% 41.1% 0.0pts n.m.
CODB flat as stranded costs fully offset
Total CODB flat as a percentage of sales despite increased investment in retail and associated costs Excluding retail store expansion, CODB decreased due to cost reduction initiatives net of inflation Freight and distribution expenses decreased with warehouse productivity improvements offsetting
higher volumes, handling units and labour rates Sales and marketing up
‒ Investment in retail expansion (primarily Bonds) had a positive contribution to EBIT‒ Store expenses reduced as a percentage of sales due to greater leverage and improved execution
Administrative expenses down due to benefits of restructuring and disciplined cost control For
per
sona
l use
onl
y

2525
Significant items largely relate to 1H15 impairments
Non-cash impairments reported where carrying value of certain intangibles and other assets not supported by recoverable amount under accounting standard requirements
Impairment of goodwill and brand names mainly relating to the 2004 IPO, and driven by change in cash generating units (CGUs), recent adverse movement in FX rates and market dynamics‒ Underwear portfolio and hosiery brand names ($81.3m) valuation impacted by change in CGUs,
FX and market dynamics‒ Sheridan goodwill ($35.1m) valuation impacted by FX. Brand names of $23.1m still supported‒ Tontine brand names ($7.6m) valuation impacted by change in CGUs, FX and market dynamics‒ Dunlop Flooring goodwill ($8.7m) impacted by changes in competition and outlook
Bonds, Berlei, Jockey (licensed) and Explorer brands not impacted Balance sheet intangible assets now relate only to brand names for Bonds, Berlei and Sheridan
For
per
sona
l use
onl
y

26261. ROCE metrics relate to continuing business in F15 and total business as previously reported in F14
Reported
$ millions F15 F14 ChangeWorking capital 117.2 309.0 (191.8)
Property, plant and equipment 33.9 57.5 (23.7)
Intangible assets 215.4 350.4 (135.1)
Other 7.6 (19.0) 26.6
Total capital employed 374.0 697.9 (323.9)Net cash/(debt) 0.9 (249.1) 250.0
Equity 375.0 448.8 (73.8)Tangible ROCE1 (%) 40.2 26.3 13.9pts
Capital expenditure 17.7 22.2 (4.5)
Cash conversion – continuing (%) 119% 58% 62pts
Working capital and PPE lower, primarily due to the 1H14 divestments but with underlying working capital also improved
Intangible assets impacted by goodwill, brand names and asset impairments Net debt down from $249.1m to cash positive $0.9m, with improved cash conversion Returns on tangible capital employed substantially improved due to higher quality
business following divestments and improved working capital Capex largely related to new store openings
Strong balance sheet and improved returnsF
or p
erso
nal u
se o
nly

2727
Inventory down by $7.1m despite >$10m inflationary impact of FX‒ Focus on clearance of aged and excess inventory‒ Reduced SKUs, simplified supplier base and lower FOB product costs‒ Faster seasonal development calendar and manufacturing lead times‒ Improved forecast accuracy and bias
Debtor days were broadly stable Creditor days increased largely driven by the inflationary impact of FX and extended supplier terms
Inventory down despite FX impact of >$10m
$ millions F15 F14 ChangeTrade debtors 74.2 67.0 7.2
Inventories 131.1 138.2 (7.1)
Trade creditors (88.2) (69.0) (19.2)
Working capital (continuing business) 117.2 136.2 (19.0)Working capital (discontinued business) - 172.8 (172.8)
Working capital (reported) 117.2 309.0 (191.8)
Continuing business: Working capital / LTM sales (%) 14.8 18.2 (3.4)pts
Debtors days (days) 34.3 32.6 1.7
Inventory turns (x) 3.1 2.7 0.3
Creditor days (days) 80.2 67.2 13.0
For
per
sona
l use
onl
y

2828
Significant increase in cash conversion due to improved working capital management
Debt free for the first time in the Company’s history
Strong credit metrics and compliant with all covenants
Facilities downsized to reflect the size of the business and to reduce unused line fees, while still maintaining flexibility
Higher cash conversion and now debt free
119%
Jun 15
58%
Dec 14
71%
Jun 14
Cash conversion – Last 12 months
24.2
249.1
Jun 15
(0.9)
Jun 14 Dec 14
Net debt / (cash)
$ millions
For
per
sona
l use
onl
y

2929
Outlook and Conclusion
For
per
sona
l use
onl
y

3030
Trading update and outlook
The Company expects a continuation of challenging and variable market conditions
1H16 sales for the 8 weeks to date are up 8% versus PCP, but 1H16 results will largely be dependent on November and December trading which are significant months
Inventory levels are expected to be higher at 31 December 2015 due to FX depreciation, a relatively early Chinese New Year which impacts shipment timing, and sales seasonality and growth
For the continuing business before significant items, F16 EBIT is expected to be up on PCP ($64.2m)
FX headwinds continue and may impact future earnings, however the Company has plans in place to mitigate the dollar impact of FX depreciation on margins through a combination of sourcing benefits, mix improvement, CODB reduction and price increases
It is the Board’s current intention to resume dividends in relation to the 1H16 result, subject to financial position and outlook at the time with a target dividend payout ratio of at least 50% of NPAT
For
per
sona
l use
onl
y
3131
Conclusion
Pacific Brands is now a higher quality, simplified business with a leading brand portfolio and greater growth potential
F15 full year earnings stabilised with 2H earnings up in every Operating Group as strategic initiatives start to deliver marking a turning point in the Company’s earnings trajectory
Strong retail performance and comp store sales growth
Substantial cost reduction achieved to offset c.$25m of corporate costs that would otherwise have become stranded following the divestments
Strong balance sheet and debt free, with high cash conversion and inventory down despite the adverse impact of FX depreciation
Significant progress in key growth initiatives across the business
Gaining real traction against the Company’s two key challenges – Wholesale performance and FX
Strong half to date performance in 1H16
Clear strategic priorities in place to deliver profit growth and dividends in F16
For
per
sona
l use
onl
y

3232
Questions
For
per
sona
l use
onl
y

3333
Appendix A: Non-IFRS financial information
All full year statutory numbers referred to in this document have been audited In addition to statutory reported amounts, certain non-IFRS measures are used by Directors and
management as measures of assessing the financial performance of the Company and individual operating groups, including:‒ Average AUD:USD hedged rates through the P&L‒ Cash conversion‒ Comp store sales growth ‒ Debtor days, creditor days and inventory turns‒ Return on capital employed‒ Sales by brand, channel and business‒ Store numbers‒ Stranded costs, FX impact on stock, 1H16 trading to date
The Directors consider that these performance measures are appropriate for their purposes and present meaningful information on the underlying drivers of the business. Many of the measures used are common practice in the industry within which Pacific Brands operates
Some non-IFRS financial information is stated before significant items as disclosed in Note 6 to the Financial Statements. Results excluding such items are considered by Directors to be a better basis for comparison from period to period as well as more comparable with future performance. They are also the primary measure of earnings considered by management in operating the business and by Directors in determining dividends taking into account other considerationsFor
per
sona
l use
onl
y
3434
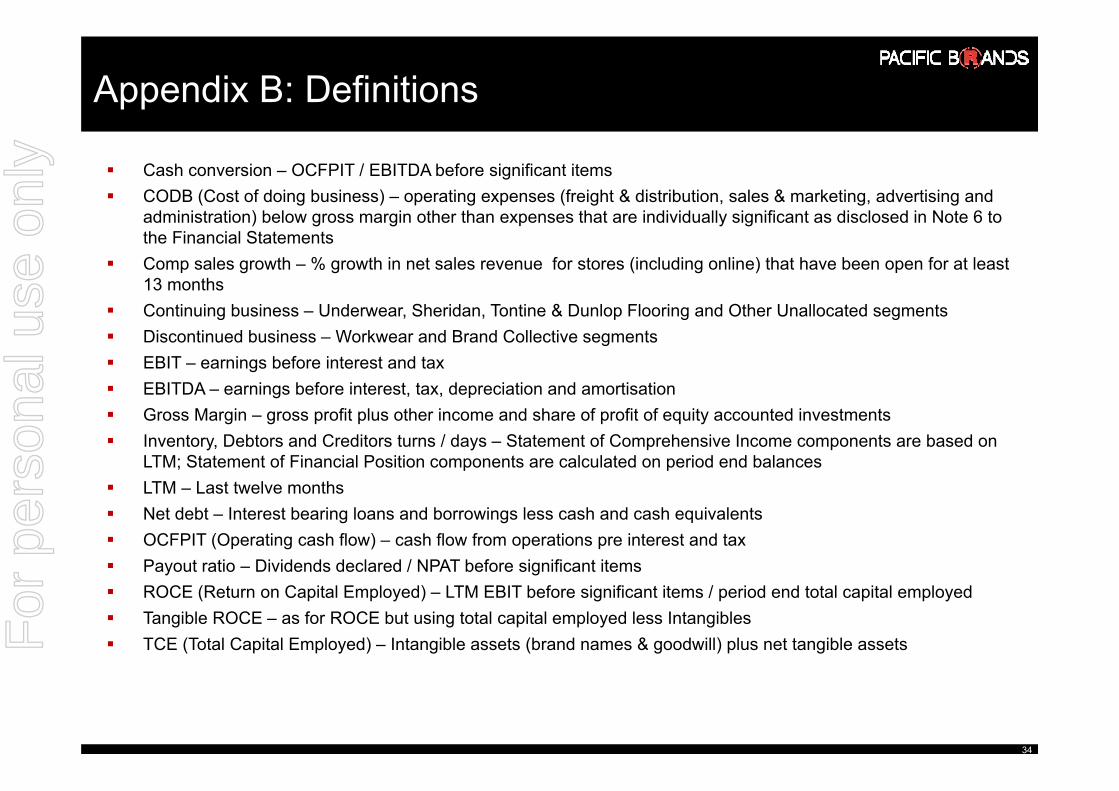
Appendix B: Definitions
Cash conversion – OCFPIT / EBITDA before significant items CODB (Cost of doing business) – operating expenses (freight & distribution, sales & marketing, advertising and
administration) below gross margin other than expenses that are individually significant as disclosed in Note 6 to the Financial Statements
Comp sales growth – % growth in net sales revenue for stores (including online) that have been open for at least 13 months
Continuing business – Underwear, Sheridan, Tontine & Dunlop Flooring and Other Unallocated segments Discontinued business – Workwear and Brand Collective segments EBIT – earnings before interest and tax EBITDA – earnings before interest, tax, depreciation and amortisation Gross Margin – gross profit plus other income and share of profit of equity accounted investments Inventory, Debtors and Creditors turns / days – Statement of Comprehensive Income components are based on
LTM; Statement of Financial Position components are calculated on period end balances LTM – Last twelve months Net debt – Interest bearing loans and borrowings less cash and cash equivalents OCFPIT (Operating cash flow) – cash flow from operations pre interest and tax Payout ratio – Dividends declared / NPAT before significant items ROCE (Return on Capital Employed) – LTM EBIT before significant items / period end total capital employed Tangible ROCE – as for ROCE but using total capital employed less Intangibles TCE (Total Capital Employed) – Intangible assets (brand names & goodwill) plus net tangible assetsF
or p
erso
nal u
se o
nly

For
per
sona
l use
onl
y