F - 1 - CROP PROTECTION
111
Transcript of F - 1 - CROP PROTECTION


F - 1 -
ICAR - All India Coordinated Research Project on Cotton – Annual Report (2019 – 20)
CROP PROTECTION PATHOLOGY
Path.1 Epidemiological studies on cotton diseases
NORTH ZONE
Path.1 (a): Observations on the occurrence of various diseases (in the farmer’s field and research farms)
Regular surveys were conducted by PAU Regional station Faridkot at regular intervals in farmers field and research farms in three cotton-growing districts of Punjab. Cotton leaf curl disease (CLCuD), bacterial blight (BB) and fungal foliar spots (FFS) were the diseases observed in different districts. The PDI of CLCuD ranged from 1.24 to 35.72%on varieties RS 921, RST-9, F 186, F 846, F 505, F 1861, F 1378, F 2164, F 2381, F 2228, F 2383, F 1054. While CLCuD PDI on different hybrids was ranged between 6.33 to 14.83%, 5.0 to 35.33%, 4.0 to 12.2% in different villages, research farms of Faridkot, Fazilka and Muktsar districts, respectively (Table 1). Among the genotypes, the variety RCH 776 BG II occupying the major area in the cotton-growing region was found susceptible to CLCuD. Bacterial blight was found in traces to 2 Grade in Faridkot and traces to 1.0 Grade in Fazilka on hybrids like Bioseed 6588 BG II, RCH 773 BG II, RCH 776 BG II, US 51 and various entries of coordinated trials in different cotton-growing areas. The fungal foliar leaf spots caused by Alternaria, Myrothecium and Cercospora, ranged between traces to 3.0 Grade at Faridkot and betweentraces to 2.0 Grade at Fazilka and Muktsar district (Table 1).
The sixmajor blocks were covered in the district Bathinda i.e. Nathana, Talwandi, Sangat, Bathinda, Rampura, and Maur.DuringKharif 2019, the severity of the CLCuD was found to be less (0-14.67%) in the cotton fields of the Bathinda district as compared to the previous year(0-49.17%).The initial incidence of the CLCuD was noticed on July 10 in Research trial(adjoining CLCuD sick plots) andon Aug 14, 2019, in RCH 776 BG II (Disease Severity Grade 1) at farmer’s field of district Bathinda. Incidence of root rot ranging from 0-10% was found in the isolated pockets at 5-6 locations of the cotton field of Bathinda district at the time of the first irrigation at the farmer’s field. An incidence of fungal foliar spots was noticed in September. An Incidence of Bacterial Blight particularly vein blight was noticed in traces at the farmer’s field at the later stages(120-130 DAS) of the cropping season.The most popular Btcotton hybrid sown in Bathinda District was found to be RCH 773 BG II followed by RCH 776 BG II and US 51 BG II(Table 2).
The data on disease intensity of leaf curl virus during Kharif 2019 in the cotton-growing areas of Sriganganagar and adjoining areas of Hanumangarh districts of Rajasthan state was recorded. Out of four tehsils surveyed in Sriganganagar district, average disease intensity of leaf curl virus was found to be the highest in Sriganganagar tehsil (21.98%) followed by Sadulshahar, Srikaranpur and Padampur tehsils in which the average disease intensity was 19.37, 13.65 and 6.22%, respectively. In adjoining cotton areas of Hanumangarh district, the average disease intensity was recorded to be 11.05%(Table 3)
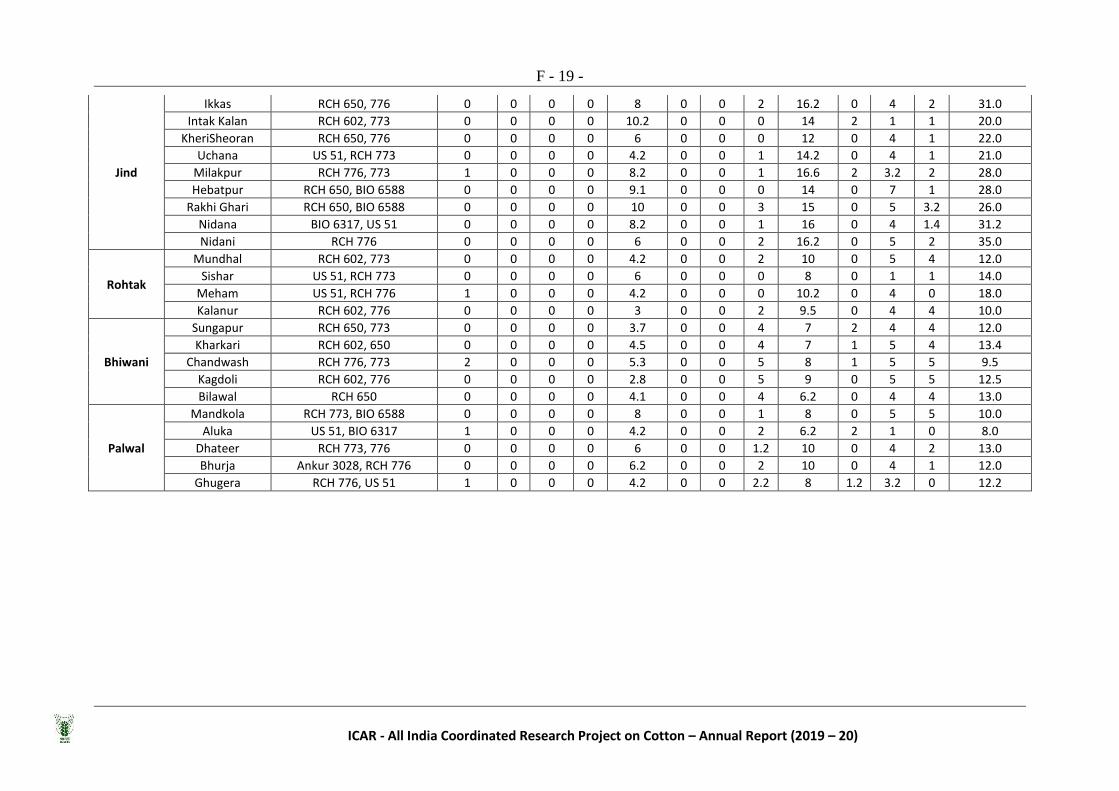
The survey was conducted to record the occurrence of different diseases in major cotton-growing districts (Hisar, Bhiwani, Fatehabad, Sirsa, and Jind) as well as in the non-traditional cotton-growing areas of Haryana (Palwal and Rohtak) from June to September 2019. At HAU research farm cotton leaf curl virus disease ranged from 33.3 to 66.67% in September. Whereas at farmer’s field the PDI was low as compared to the HAU research farm (8.0-18.0%). The highest percent disease index (PDI) was recorded 35.0% at Nidaniin district Jind followed by 31.0% at village Nidana and Ikkasof district Jind and 21% in Pilimandhori village of district Fatehabad. CLCuD PDI at Hansi in district Hisar 18.0%, Mehamin district Rohtak 18.0% and Kharkari in district Bhiwani 13.4% was recorded. Whereas, in Palwal district, PDI was less than 13.0%. Among the fungal diseases, PDI of Myrothecium leaf spot

F - 2 -
All India Coordinated Cotton Improvement Project – Annual Report (2019 – 20)
(MLS) ranged from 0 to 8.0%. Other diseases viz. Bacterial leaf blight ranged from 0 to 4.0%, Root rot ranged from 0 to 5.0%(Table 4).
CENTRAL ZONE
Path.1 (a): Observations on the occurrence of various diseases (in the farmer’s field and research farms)
The Alternariawas found widespread disease followed by grey mildew, bacterial blight and AnthracnoseonG. hirsutum and G. arboreum cotton at the research station and at farmers field in Nanded district. The incidence of Alternaria, Bacterial blight and grey mildew was recorded at 30, 60 and 90 DAS. The percent disease intensity of Alternariaat 120 DAS was ranged from 7.01 to 12.40%, while the intensity of bacterial blight and grey mildew was ranged from 4.00 to 7.23% and from 6.85 to 13.20%. The Anthracnose was found in varieties of central zone screening trials namely line9191 (0.50%) and 9192 (1.20%), however, no incidence of parawilt was observed during years 2019-2020 (Table 5).
The survey was conducted on the farmer’s field of Akola area as well as at the Research farm.During the seedling, stage crop was free from diseases at farmers’ fields. The bacterial blight was observed at boll development stage and ranged between 8.75 to 26.25% in varieties/hybrids Bt and Non-Bt.The grey mildew intensity was observed after boll development to picking stage in few locations and it rangedfrom 4.00 to 18.50% only under irrigated crop. The Myrothecium leaf spot was observed in traces (Table 6).
The survey was conducted on the farmer’s field of the Surat area as well as at Research farm, Surat. Bacterial leaf blight incidence (PDI)ranged from 0.0 to 36.5% (LRA5166) and Alternaria leaf spot disease from 0.0 to 5.5% in different cultivars/ hybrids at Research farm. Whereas at farmer’s fields, a roving survey was carried out on BG II hybrids, the PDI of Bacterial leaf blight disease was ranged from 0.0 to 12.0%, 0.0 to 8.0% and 2.0 to 7.0% in Surat, Bharuch and Narmada districts, respectively.PDI of Alternaria leaf spot disease was observed in the range of 0.0 to 5.0%, 0.0 to 20.0% and 0.0 to 2.0% in Surat, Bharuch and Narmada district, respectively (Table7).
The occurrence of various diseases of cotton was surveyed on farmer’s field of Saurashtra area and at Cotton Research Station, JAU, Junagadh. In Junagadh district the PDI of Alternaria leaf spot (ALS), bacterial leaf blight (BLB), and grey mildew was ranged from 15.0 to 23.5%, 0.0 to 1.6% and 8 to 21.10% respectively. In the Rajkot district, the intensity of ALS, BLB and grey mildew disease was ranged from 14.2 to 21.6, 0.2 to 1.5% and 0 to 22 %, respectively. In Amreli district, the intensity of ALS, BLB and grey mildew disease was ranged from 16.0 to 19.7%, 0.5 to 1.0% and 15.0 to 24.0%. Parawilt incidence was recorded from 0 to 5%% in Junagadh district only (Table 8). At the Cotton Research Station, Junagadh, ALS on G. Cot.hy-8BG-II and G. Cot hy-105.0, 45.0% and BLB from 3.0, 47.0%, respectively. During the season grey mildew was recorded only G. Cot-10 Bt Male parent ranging from 5 to 22%. Parawilt was not observed at the farmers field.

F - 3 -
ICAR - All India Coordinated Research Project on Cotton – Annual Report (2019 – 20)
SOUTH ZONE
Path.1 (a): Observations on the occurrence of various diseases (in the farmer’s field and research farms)
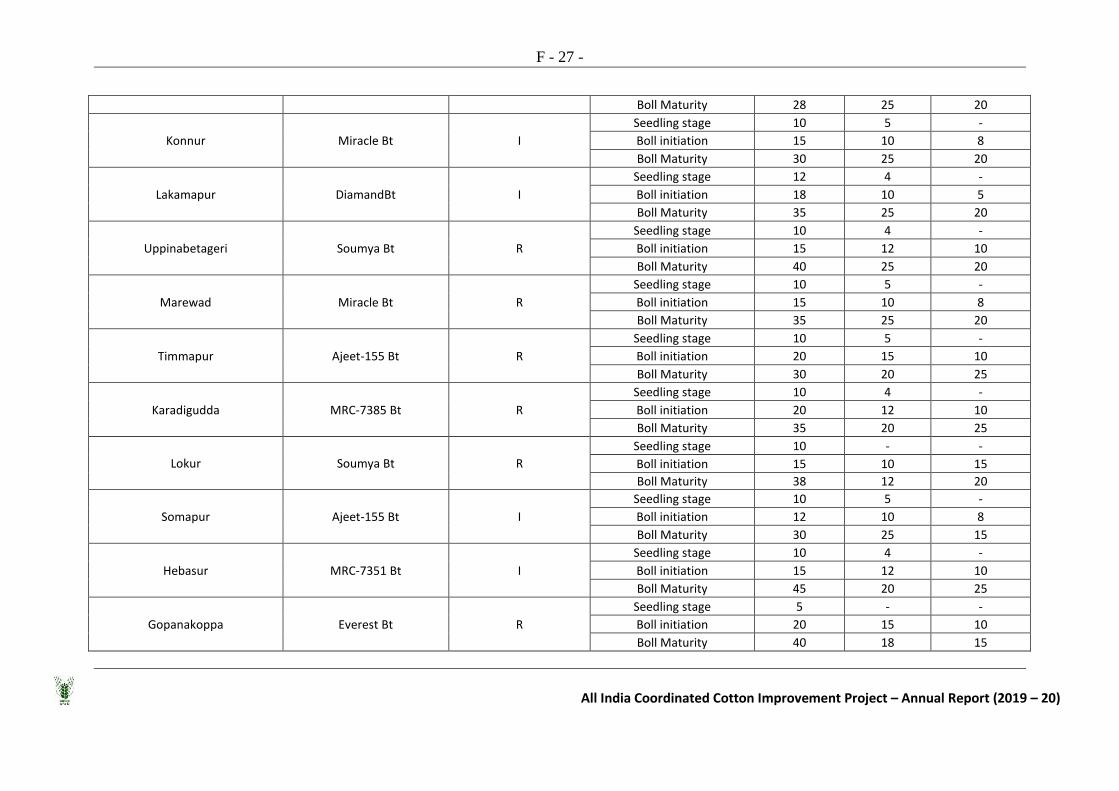
Survey conducted at farmers’ fields in five districts in Karnataka and the results indicated the predominance of Alternaria blight (05-45%) in the early stages of the crop growth followed by Grey mildew (04-25%) and Bacterial blight (03-25%) (Table 9).
Alternaria leaf spot, Cercospora leaf spot, Corynespora leaf spot, bacterial blight, grey mildew, and rust were recorded during the surveys conducted from August 2019 to January 2020, in cotton-growing mandals of Guntur (1.81 lakh ha), Krishna (0.48 lakh ha), Prakasam (0.45 lakh ha) and Kurnool (2.69 lakh ha) districts in Andhra Pradesh. The percent disease intensity (PDI) of bacterial blight, Alternaria leaf spot, Corynespora leaf spot, grey mildew and rust diseases in various hybrids and varieties of cotton trials conducted at RARS, Lam was also recorded. During August 2019 crop was healthy. Root rot (2%) and wilt (5%) were observed in a few isolated fields during September while leaf spots were in traces. During the October Alternaria leaf spot (0.0 to 28.0% PDI) and Corynespora leaf spot (0.0 to 9.0%) was observed in 55 to 90 days old crops. Corynespora leaf spot (3.0 to 28.75%), Alternaria leaf spot (2.0 to 20.0% PDI) and bacterial blight (0.0 to 10.0% PDI) were recorded during November while Alternaria (0.0 to 18.0%), Corynespora leaf spot (0.0 to 5.67), bacterial blight (0.0 to 1.0) grey mildew (1.0 to 28.0%) and rust (0.0 to 2.75%) were observed during December 2019. Rust progressed from 13.86 to 20.0%during January 2020 while grey mildew from 10.42 to 18.75% and Corynesporafrom11.67 to 13.67%were also recorded (Table 10).
Corynespora leaf spot was the major disease (0.0 to 48.25%) followed by Alternaria leaf spot (0.0 to 30.0%), Grey mildew (0.0 to 35.5%) and rust (0.0 to 44.0%), bacterial blight (0.0 to 25.0%), anthracnose (0.0 to 14.0%) and Cercospora leaf spot (0.0 to traces) were observed at Regional Agricultural Research Station, Lam, Guntur during Kharif 2019(Table 11).
Survey was conducted to assess the severity of cotton diseases from regions viz., Virudhunagar, Tirunelveli, Dindigul, Tiruppur, Madurai, Perambalur and Coimbatore of Tamil Nadu. The incidence of diseases viz., root rot, Alternarialeaf blight, Grey mildew, bacterial blight, and Tobacco streak virus (TSV) were ascertained in the above-mentioned cotton-growing regions. In the villages namely Solasari, Perumalpatti, Karivalam, Sankarankovil, Kuvalakkanni, and Kurukalpatti, of Tirunelveli District, the cotton fields were found to be sown with RCH659 cotton hybrid. The incidence ofAlternaria leaf blight was observed to be approximately five percent. Root rot with stem weevil incidence was also observed in the surveyed cotton fields in the range between 10 to 15%.The villagesof Virudhunagar district, namely, Ramalingapuram, Desigapuram, Rajapalayam, Muthukudi and Solapuram were surveyed and the data revealed that farmers have been growing cotton hybrid RCH 659. The plants are fairly devoid of diseases except for the incidence of root rot which was observed in some of the fields in the range between 5-10% (Table 12).
The disease surveillance survey conducted in the Coimbatore district including villages namely Mungiltholuvu, Pethppampatti, Thondamuthur, Kenathukadavu, PutturandSinkaiyanpudur. The symptom of Tobacco streak virus disease was observed in MCU5, Co14 cotton and RCH 659 fields which ranged from 5-10%. Bacterialleaf blight was observed in the range of 5-10 percent whereas 5 percent of Myrothecium and Alternaria leaf blight was also observed in the cotton fields. The survey in Perambalur district including cotton-growing areas of Perambulur, Veppanthattai and Paluvurindicated that the RCH 659 was the predominant hybrid cotton grown by farmers. The incidence of Alternaria Leaf Blight was found to be high with 3.0 PDI followed by the medium incidence of Grey mildew (2.0% PDI) and Bacterial Leaf Blight (2.0 % PDI)
Kundadam and Dharapuram blocks surveyed in Tiruppur District where a higher incidence of ALB and Grey mildew as the PDI was 3.0% in the hybrid cotton fields. Dindigul District is another

F - 4 -
All India Coordinated Cotton Improvement Project – Annual Report (2019 – 20)
predominant cotton-growing district in which the villages namely Palam Rajakkapatti, Chinnagoundanvalasu and Amplikkai were surveyed and it was found that the symptoms of ALB and Grey mildew was predominant and the incidence was rated to be high with PDI of 3.0. In Erode district farmers were found to grow RCH 659. Grey mildew appeared and the level of incidence was high (3.0% PDI) in surveyed areas of Chittode and Erode. In Madurai District, the Non-Bt cotton areas were surveyed for the incidence of cotton diseases. The survey in Alampatti and S.Ammapatti villages revealed that the incidence of ALB was minimal.
Path.1 (b): Disease progress in relation to weather factors.
NORTH ZONE
Observations on the appearance and progress of Cotton leaf curl viral disease (CLCuD) were taken at weekly intervals starting from 25th to 44th meteorological week at Faridkot, Punjab. CLCuD was first observed on RST-9 in the 25thSMW. It was found that CLCuD % increased up to 40th SMW in all the varieties. Max PDI was 36.8 followed by 36.0, 33.0 and 34.4 in RST 9, HS 6, RS 921 and F 846(Table-5). In F846 the correlation between weather parameters showed a strong negative correlation with temperatures, afternoon and mean relative humidity and also with rainfall. PDI was negatively correlated with maximum temperature (r = -0.66), minimum temperature (r = -0.82) and mean temperature (r = -0.81). Conversely, morning time relative humidity (r = 0.59) and extended duration of bright sunshine (r = 0.17) was beneficial for the PDI of CLCuD(Table 13).
Susceptible variety RST-9 of cotton was sown on 26.5.2019 in 545 square meter area following the recommended package of practices to record weekly progress of leaf curl disease at Sriganganagar, Rajasthan. Leaf curl disease first appeared on 02nd July after 36 days of sowing during 27thSMW and the incidence at the end of this week was 2.54%. However, in subsequent standard week’s leaf curl incidence in crop showed fast progressive increase reaching the maximum level of 100%on 13th August during 33rd Standard week. The disease incidence was increased gradually up to 29thSMW (16 July-22 July) with disease severity of 32.57%. In subsequent 30th to 33rd SMW disease progression was found very fast reaching the level of 100%.The overall precipitation from June to August (vegetative phase) during this year was 128.4 mm. The average weekly temperature during this period of June to August remained between 26.7 to 46.8 oC and relative humidity ranged between 16.1 to 83.7% (Table 14).
CLCuD susceptible cultivar HS-6 was sown on 4.5.2019 with a spacing of 67.5 x 30 cm at Hisar, Haryana. All the recommended agronomical practices were followed for raising the crop. The observations on disease progress were recorded at an interval of 7 days till the first week of November 2019 under field conditions. CLCuD appeared on 12th June 2019 in the 24thSMW after 37 days of sowing and disease incidence was 5.66% which increases upto 97.00% on 39th week. The percent disease index was increased from 0.93%to up to 55.48% on 43rd week, during this period the average maximum and minimum temperature recorded were 31.9 and 14.9oC, whereas, morning and evening relative humidity was from 79 to 31.00% with 6.50 sunshine hours having maximum whitefly population 42.30 per three leaves on 35th standard meteorological week (Table 15).
The leaf curl virus disease initiated in 26th SMW (25 June-1 July) and the incidence reached 100% by 32nd week (6-12 Aug) at Sirsa, Haryana. An increasing trend of whitefly incidence from 2.5 per 3 leaves up to 12.7 whiteflies per 3 leaves was observed during the season. The maximum temperature ranged from 33.3 to 42.20C whereas the minimum temperature was between 21.1 to 29.60C. Relative humidity morning and evening ranged between 53.9 – 83.6 and 30.7-71.6%, respectively. The total rainfall received during this period was 202.5 mm(Table 16).
CENTRAL ZONE

F - 5 -
ICAR - All India Coordinated Research Project on Cotton – Annual Report (2019 – 20)
The first incidence of Bacterial blight was noticed during 36 thSMW at Nanded and PDI was found in the range of 0.13 to 8.20%, while the incidence of Alternaria was observed during 33rdSMW and PDI was ranged from0.2 to 12.4%. The Grey mildew PDI was observed during 45rdDMW, and the PDI ranged from0.6 to 13.2%.Anthracnose was observed during 50thSMW and ranged from 0.50 to 1.20%. Apart from this, no othermajor diseases were found at the research station as well as on farmers' fieldin Nanded district (Table 17).
The study was undertaken on cultivated susceptible G hirsutum variety LRA-5166, hybrid Bhakti Bt and deshi variety AKA-8 at Akola. The weekly observations on major foliar diseases viz. Bacterial blight, MLS and grey mildew were recorded on randomly selected 10 plants by using 0-4 point prescribed grade scale.Observations were recorded on Major diseases (BLB, MLS & GM) from 38thSMW (17-23 Sept. 2019) and maximum Bacterial blight incidence was noticed on LRA 5166 from 22-28th October 2019 (43thSMW), when the maximum and minimum temperature was 26.8 and 17.60C along with relative humidity between the range of 95 and 79 percent. MLS incidence was noticed on LRA 5166 from 24-30th September 2019 (39 MW) and maximum (4.55) was recorded during 22-28th October 2019 (43dr SMW). However, Grey Mildew incidence was noticed on LRA 5166 from 5-11 November 2019 (45th SMW) and maximum (4.66) was recorded during 26 Nov -2nd December 2019 (48th SMW). A similar trend was also observed in the case of Bhakti Bt (Table 18a). The maximum temperature has shown positive and significant correlation with bacterial blight at 5% level of significance on LRA-5166 and Bhakti Bt cotton. The correlation between rainfall, minimum temperature, relative humidity, and BSH had positive and non-significant whereas rainfall exhibited positive and non-significant against both LRA-5166 and Bhakti Bt (Table 18b).
During the season, only Bacterial leaf blight disease was found on G. Cot. Hy. 12 Non-Bt at Surat (Gujarat). The incidence of Bacterial leaf blight disease was noticed from 32nd to 51stSMW with the maximum disease intensity in the third week of October (34.0 % PDI) i.e. in 42thSMW. Incidence of Bacterial leaf blighthada positive correlation with the maximum temperature, evening humidity and sunshine hours for disease development (Table 19)
The incidence of Bacterial leaf blight disease (BLB) was noticed from 31stSMW with the maximum disease intensity in the 37th SMW (22.0 % PDI) at Junagadh (Gujarat). Alternarialeaf spot disease incidence was observed in the 40th SMW with the maximum PDI in 42nd SMW (27.0%) while grey mildew was first noticed in 40th SMW and reached its maximum PDI in 48th SMW (15.0%) (Table 20a).
Alternaria leaf spot disease found significant positive correlation at 1% level for maximum temperature and remaining factors viz., minimum temperature, relative humidity and rainy days were no significant at 5% level and 1% level but correlated positively.Bacterial leaf blight disease correlation coefficient studies recorded positive correlation with minimum temperature (0.679), morning relatively humidity (0.624), evening relatively humidity (0.509) and rainy days (0.588) at 5% and 1% level of significance, respectively. Maximum temperature (-0.518), rainfall days (-0.728) were negatively correlated at 1% and 5% level of significance.Grey mildew disease correlation coefficient studies recorded a positive correlation with rainfall (0.123) and rainy day(0.398). Maximum temperature (-0.576) minimum temperature(-0.607) and evening relatively humidity (-0.540) were negatively correlated at 1% and 5% level of significance. Morning relatively humidity (-0.400) was negatively correlated non-significant at 1% and 5% level (Table 20b)
SOUTH ZONE
Dharwad: Alternaria leaf blight was recorded from 31st SMW whereas bacterial blight and grey mildew diseases appeared in 37th SMW on different varieties/hybrids at Dharwad. The maximum incidence for all diseases was noticed between 42nd to 46th SMW (Table21a).
Maximum and minimum temperature.

F - 6 -
All India Coordinated Cotton Improvement Project – Annual Report (2019 – 20)
1. Alternaria leaf blight: With respect to Alternaria blight, a significant positive correlation was observed between the maximum temperature and the genotypes. A significant negative correlation was observed between minimum temperature and genotypes like Abhadita, Jayadhar, Bunny Bt and Dr. Brent Bt.
2. Bacterial blight: With respect to Bacterial blight, a significantly positive correlation was observed between the maximum temperature and the genotypes and a significantly negative correlation was observed with respect to minimum temperature and the genotypes.
3. Grey Mildew: With respect to Grey mildew, a significantly positive correlation was observed between the maximum temperature and genotypes like Abhadita, Jayadhar, Bunny Bt and Dr. Brent Bt whereas a significantly negative correlation was observed between the minimum temperature and the genotypes Abhadita and Jayadhar. (Table 21a)
Relative Humidity No correlation was observed between RH Morning and RH Evening in four genotypes with respect to diseases
Rainfall and Rainy days: Significant positive correlation was noticed between total rainfall and GM with respect to Jayadhar other genotypes correlated negatively. And no correlation was noticed between rainy days and the genotypes with respect to all the diseases.(Table21b).
Guntur(AP): Jaadoo BG II cotton hybrid was sown on 23.07.19 in an area of 150 sq. m. Weekly observations were recorded on the percent disease intensity of Alternaria leaf spot, grey mildew and rust diseases after the appearance of the disease. During Kharif 2019, Corynespora leaf spot also developed as a major leaf spot disease. Alternaria leaf spot appeared in 35th SMW during August 2019 when the mean maximum temperature was 35.60C; mean minimum temperature was 26.60C; mean morning relative humidity of 86.57% (RH I); mean evening relative humidity of 66.0% (RH II); rainfall was 20.7 in two rainy days; sunshine hours were 6.4; wind speed 8.5km/h and evaporation was 6.5. Alternaria leaf spot attained a maximum PDI of 30.0 on Jaadoo BG II during 43rd standard week i.e., last week of October, during which the mean maximum temperature was 31.070C; mean minimum temperature was 24.40C; mean RH I of 91.4%; mean RH II of 83.7%; rainfall was 40.6 in 4 rainy days; sunshine hours were 2.6; wind speed 4.7km/h and evaporation was 3.2 (Table22).
A significant positive correlation with rainfall and no. of rainy days was recorded, while evaporation expressed a significant negative correlation with PDI. Multiple linear regression analysis revealed that rainfall, no. of rainy days and evaporation significantly influenced the progress and disease intensity (R2=0.877) whereas no. of sunshine hours showed partial influence (R2=0.245) during Kharif2019.
Y= 39.201 - 0.389 Rf + 10.659 Rd - 7.336 Evap. (R2=87.71)
Corynespora leaf spot in 41st SMW during 2nd week of October 2019 when the mean maximum temperature was 32.90C; mean minimum temperature was 25.20C; mean morning relative humidity of 92.0% (RH I); mean evening relative humidity of 72.3% (RH II); rainfall was 61.0mm in three rainy days; sunshine hours were 3.3; wind speed 2.1 km/h and evaporation was 3.7. Corynespora leaf spot attained a maximum PDI of 48.3 on Jaadoo BG II during 50th standard week i.e., 2nd week of December 2019, during which the mean maximum temperature was 31.10C; mean minimum temperature was 18.10C; mean RH I of 92.4%; mean RH II of 79.3%; rainfall was nil; sunshine hours were 4.9; wind speed 3.3 km/h and evaporation was 4.1. A significant negative correlation of PDI with maximum and minimum temperatures, rainfall and rainy days and significant positive correlation with RH II was recorded.Multiple linear regression analysis revealed that minimum temperature, RH I, RH II and rainfall significantly influenced the progress of Corynespora leaf spot
F - 7 -
ICAR - All India Coordinated Research Project on Cotton – Annual Report (2019 – 20)
(R2=0.985) whereas no. of maximum temperature (R2=0.622) and the number of rainy days ((R2=0.684) showed partial influence during Kharif2019.
Y = -114.89 - 2.405 min T + 1.452 RH I + 0.829 - 0.323 Rf (R2=0.985)
Grey mildew disease appeared in 44th SMW during 1st week of November 2019 on Jaadoo BG II when average maximum temperature was 31.50C; mean minimum temperature was 24.80C; mean RH I was 91.1%; mean RH II was 74.1%, rainfall was 41.0mm in two rainy days; sunshine hours were 4.5; wind speed was 3.5 km/h and evaporation was 3.5. The disease progressed and reached PDI of 35.5 during 3rd week of December 2019 during which the mean maximum temperature was 31.30C; mean minimum temperature was 18.00C; mean RH I was 92.1%; mean RH II was 80.1%; rainfall was nil, sunshine hours were 4.9, wind speed 4.2 km/h and evaporation was 4.1. The significant negative correlation of disease intensity with maximum and minimum temperatures, rainfall and rainy days was recorded while RH II showed a significant positive correlation. Multiple linear regression analysis revealed that minimum temperature, RH I, rainfall and sunshine hours significantly influenced the progress of grey mildew during Kharif 2019 (R2=0.956). Maximum temperature (R2=0.367) showed a partial influence on the development of grey mildew.
Y= -254.092 - 3.275 min T + 4.043 RHI-0.371 Rf - 5.314 SSH (0.956)
Rust disease appeared in 49th SMW during 1st week of December 2019 on Jaadoo BG II when average maximum temperature was 30.40C; mean minimum temperature was 19.90C; mean RH I was 88.7%; mean RH II was 88.6%, rainfall was 1.6mm; sunshine hours were 2.0; wind speed 3.6 km/h and evaporation was 3.5. The disease progressed and reached PDI of 44.0% on Jaadoo BG II during 4th week of January 2020 during which the mean maximum temperature was 32.40C; mean minimum temperature was 19.10C, mean RH I was 88.9% mean RH II of 71.6%, rainfall was nil, sunshine hours were 6.8, wind speed 3.9 km/h and evaporation was 4.7. Disease intensity was negatively correlated with minimum temperature; RH I and RH II which were significant while sunshine hours and evaporation showed a significant positive correlation.
Multiple linear regression analysis revealed that rainfall and no. of rainy days (R2 = 0.839); minimum temperature and RH I significantly influenced the disease intensity (R2 = 0.812). Evaporation expressed partial influence (R2=0.389) on the progress of rust during Kharif 2019.
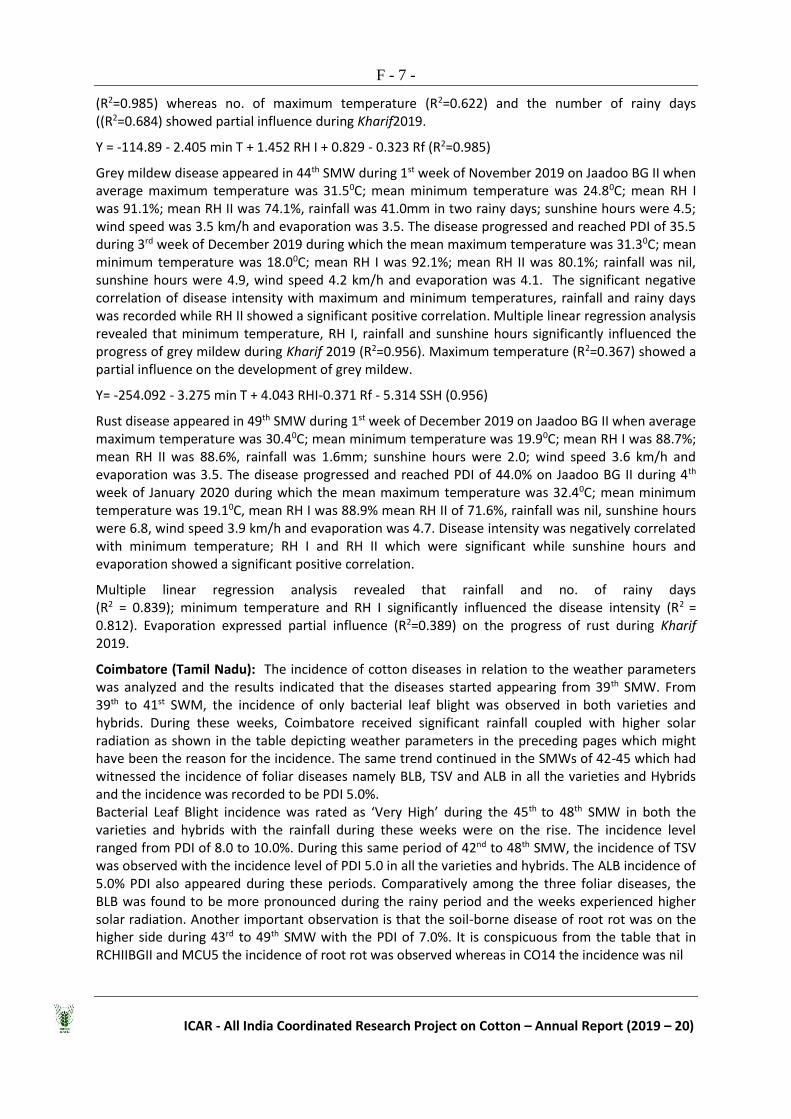
Coimbatore (Tamil Nadu): The incidence of cotton diseases in relation to the weather parameters was analyzed and the results indicated that the diseases started appearing from 39th SMW. From 39th to 41st SWM, the incidence of only bacterial leaf blight was observed in both varieties and hybrids. During these weeks, Coimbatore received significant rainfall coupled with higher solar radiation as shown in the table depicting weather parameters in the preceding pages which might have been the reason for the incidence. The same trend continued in the SMWs of 42-45 which had witnessed the incidence of foliar diseases namely BLB, TSV and ALB in all the varieties and Hybrids and the incidence was recorded to be PDI 5.0%. Bacterial Leaf Blight incidence was rated as ‘Very High’ during the 45th to 48th SMW in both the varieties and hybrids with the rainfall during these weeks were on the rise. The incidence level ranged from PDI of 8.0 to 10.0%. During this same period of 42nd to 48th SMW, the incidence of TSV was observed with the incidence level of PDI 5.0 in all the varieties and hybrids. The ALB incidence of 5.0% PDI also appeared during these periods. Comparatively among the three foliar diseases, the BLB was found to be more pronounced during the rainy period and the weeks experienced higher solar radiation. Another important observation is that the soil-borne disease of root rot was on the higher side during 43rd to 49th SMW with the PDI of 7.0%. It is conspicuous from the table that in RCHIIBGII and MCU5 the incidence of root rot was observed whereas in CO14 the incidence was nil

F - 8 -
All India Coordinated Cotton Improvement Project – Annual Report (2019 – 20)
Further, it was observed from the table that 48th SMW to 5th SMW coinciding the colder months of December, January and February, the incidence of Alternaria leaf blight and root rot were at their peak as the PDI crosses 10.0. It could be interpreted that the incidence of BLB and root rot were fuelled by the cool climatic conditions prevailing during these months (Table23)
Path.1 (c) Studies on the variability in Alternaria causing leaf spot in cotton.
Junagadh: The variability test of cotton pathogen Alternaria was carried out during Kharif-2019 for confirming of variability in Alternaria species of cotton. The disease sample was collected from eight different locations of this cotton-growing region. The samples were processed for isolation of Alternaria from blighted leaves of cotton using the standard method. The fungus culture was purified and morphological characters were recorded using a compound microscope. The mycelium was septet. The conidia were also septet and produced 2-8 septa. The shape of conidia was oblong, tapering at one end and round on another end. Based on morphological and characters the fungi identified as Alternaria macrospora.
Guntur: During the survey for cotton diseases Alternaria leaf spot samples were collected from farmers’ fields and experimental plots at RARS, Lam and observed for the presence of Alternaria. Based on the spore structure the species was identified as Alternaria macrospora (Table 24). The fungus was cultured and the isolate was sent to TNAU, Coimbatore for molecular analysis.
Coimbatore: As discussed in the previous AICRP meet, Alternaria cultures from Coimbatore, Guntur, Bathinda and Junagadh were obtained to carry out morphological study at this centre. The results of the morphological study are presented in theTable25. Morphological studies for the cultures of Alternaria collected from the Coimbatore region revealed that the colony was characterized by the black mycelia growth, with concentric rings on the dorsal side of the plate. The cultures from Guntur produced colonies with whitish mycelia growth with black centre on the dorsal side of the plate. The culture brought from Bathinda produced mycelium which was blackish in colour with concentric circles of growth. Junagarh culture has produced mycelia with full whitish growth and raised centre of colony. The mean mycelial diameter was analysed for the cultures brought from four centres. The results given in the above table revealed that on 3rd day the mycelial diameter was high in Junagarh culture (3.95 cm) followed by Bathinda (2.90 cm) and Guntur (2.35 cm). The lowest mycelial diameter on 3rd day was recorded in the Coimbatore culture (2.15 cm). The same trend continued in subsequent days also. The mycelia diameter was the highest in Junagarh culture followed by Bathinda, Guntur and Coimbatore during 5th, 7th and 9th day after culturing. On 9th day, the mycelial diameter for Junagardh culture was 8.50 cm followed by Bathinda (7.25 cm), Guntur (7.00 cm) and Coimbatore (6.7 cm).
Path 1 (d): Survey and Epidemiology of TSV
CENTRAL ZONE
During 2019-20, a survey was undertaken in different locations of Marathwada (Aurangabad, Parbhani, Nanded, Hingoli, Latur, Jalna, Osmanabad, CRS, Nanded) region/VNMKV Jurisdiction for TSV incidence. No incidence of TSVwas observed.
During 2019-20, survey was undertaken in different locations of Vidarbha region (Akola, Amravati, Buldhana, Washim, Yeotmal, Wardha, Nagpur, CRS, Dr. PDKV, Akola, CDF WaniRambhapur) / Dr. PDKV, Akola Jurisdiction for TSV incidence. No incidence of TSV was observed during the survey.
SOUTH ZONE

F - 9 -
ICAR - All India Coordinated Research Project on Cotton – Annual Report (2019 – 20)
Guntur:During the surveys conducted in Cotton growing districts, Tobacco Streak Virus disease was recorded from August 2019 to January 2020. The incidence ofTSV in different hybrids varied from 0% to 4.0% (Table-26a & 26b).
Progress of TSV disease incidence (%) was in the range of 7.69 % to 23.44% in RCH 2 BG II, however, grade 1 symptoms (restricted to few leaves and/or branches, mostly one or two spots) were observed in the majority of infected plants while few plants showed stunting. Percent disease index was between 1.92 and 7.88. Jaadoo BG II (5.56 to 23.40% and 1.34 to 7.41 PDI) and L 1060 (4.13 to 22.94% and 1.03 to 5.85 PDI) showed grade 1 symptoms on few leaves (Table-27). Thrips counts were in the range of 0.0 to 5.0 per three leaves.
Coimbatore:Survey for the occurrence of viral diseases revealed that Tobacco streak virus disease incidence was observed in all cotton-growing tracts surveyed in Tamil Nadu. The incidence of TSV varied from 5.0 to 10.0%. The incidence was maximum (10.0%) in the Coimbatore region. The minimum incidence of 5.0% of TSV was noticed in the Dindigul district. The symptom of Tobacco streak virus disease was observed in MCU5 and Co14 cotton fields which ranged from 5-10% (Table 28).
Path.2(a). Screening of AICRP breeding lines for disease reaction
The breeding lines in various national and zonal trials were screened against important diseases in the area. In each screening trial susceptible checks for the diseases were maintained and their reaction is presented at the end of each table where data from different locations of a trial is pooled. The reaction of a particular entry is considered valid provided there is either susceptible or moderately susceptible reaction in the susceptible check.
The results of National trials are given in Tables -29 to 14.
The results of zonal trials (NorthZone) are given in Tables -43 to46.
The results of zonal trials (Central Zone) are given in Tables - 47 to 57
The results of zonal trials (South Zone) are given in Tables- 58 to 71
Path.2 (b): Confirmation and maintenance of disease resistant lines.
CENTRAL ZONE
Junagarh: Different 17 breeding lines were evaluated against Alternaria leaf spot, bacterial leaf blight and grey mildew diseases under field condition during Kharif-2019. One entry resistance (RAH-0603), nine entries moderately resistant, six entries moderately susceptible and one entry susceptible reactions were recorded against Alternaria leaf spot disease. In the case of bacterial leaf blight disease, One entry was resistant, nine entries were moderately resistant, and seven entries were moderately susceptible. All entries showed resistant reaction against grey mildew during the Kharif-2019 (Table 72).
Akola:Out of twelve genotypes, all the entries showed resistant reaction to bacterial blight except GSV-173 was categorized under moderately resistant. 1 genotype was moderately susceptible (Khandwa 2) and 1 genotype was susceptible viz. DCH 32(Table73)
SOUTH ZONE
Dharwad The genotypes SVA-1118 and DB-14 exhibited a high degree of resistance to Alternaria blight (Resistant), Bacterial blight (disease-free) and Grey mildew (disease-free)(Table74).
Guntur:Thirteen entries from 2018-19 viz., BS 4-18, SHS 113, CPD 1802, Suraj, LHCC 3, LHCC 4, CSH 3158, SHC 374, CPD 1702, RHC 1217, GISH 298, Suvin, NDLH 1938 selected for grey mildew (Grade 1) and Alternaria leaf spot (Grade 2); Suvin (Grade 1) for rust were sown on 24.07.2019. Two checks, RCH 2 BG II (for bacterial blight and rust) and Jaadoo BG II (for Alternaria leaf spot and grey mildew)

F - 10 -
All India Coordinated Cotton Improvement Project – Annual Report (2019 – 20)
were sown after every four rows of randomized entries and evaluated for a second consecutive year. Jaadoo BG II also served as a border.
RHC 1217 selected for grey mildew showed moderately resistant reaction whereas all the entries continued their resistant reaction to grey mildew during 2019-20. Suvin selected for rust showed moderately resistant reaction during 2nd year of evaluation. All the entries remained moderately resistant against Alternaria leaf spot (Table75).
Path.2 (c) Monitoring of breakdown of resistance against CLCuD in cotton.
In this experiment, three each of tolerant and susceptible varieties against CLCuD and one each of tolerant and susceptible Bt cotton hybrid were selected and sown at three locations to see how their reaction against CLCuD changes over the years. The PDI in case of tolerant varieties/hybrid was much less compared to susceptible varieties/hybrid atSriganganagar whereas it was almost similar at Bhatinda and Hisar. The cumulative reaction results revealed that all the susceptible verities showed HS reaction whereas the tolerant varieties showed S to MS reaction. The susceptible and tolerant Bt hybrid showed susceptible and moderately resistant reaction (Table 76).
Path. 3 (f): Management of sooty mold (Capnodiumspp.) in cotton
Two experiments were planned during 2019, one experiment was conducted last year where 9 treatments including control were imposed once the sooty mold had developed under field conditions to see how much is controlled. whereas another set with the same treatments was planned and the interventions were applied at the initiation of sooty mold and were compared with check without intervention. The second experiment was conducted in polyhouse where 7 treatments including control were evaluated for their effect on the sooty mold and whitefly population at Sirsa.
In the polyhouse experiment at Sirsa, The prophylactic sprays of mancozeb followed by propiconazole and flonicamid were showed the lowest sooty mold 15 days after the first spray. However, Propiconazole followed by flonicamid and mancozeb showed the lowest sooty mold 15 days after the second spray. Flonicamid followed by neem oil and mancozeb showed the lowest sooty mold 15 days after the third spray (Table 77).
Prophylactic sprays of flonicamid followed by neem oil and propiconazole were showed the lowest whitefly population/ 3 leaves 15 days after the first spray. However, flonicamid followed by mancozeb and neem oil showed the lowest whitefly population/ 3 leaves 15 days after second spray (Table 78).
In the field trial,pooled means of Hisar and Faridkot showed three sprays of Copper oxychloride 50 WP @2.25g/L followed by Mancozeb 50WP @2.0 g/L and Propiconazole @1ml/L water showed a maximum reduction ofthe sooty mold 15 days after 3rd spray(Table 79).
Infield trial conducted at Coimbatore, the maximum reduction was observed by Copper oxychloride 50 WP @2.5g/L followed by Propiconazole 25EC @1ml/L, Copper oxychloride 50 WP @1.75g/L., while at Junagarh (Aphid) among six treatmentsFlonicamid 50 WG was significantly superior to suppressed disease intensity as well as aphid infestation over control at 7 and 15 day after the first and second spray with the reduction of sooty mold by 43.5% and 95.3%, respectively (Table 80).
Path 3 g: Management of parawilt of cotton (New experiment)
At Bhatinda, foliar spray of 10 ppm Cobalt chloride immediately after the occurrence of disease followed by drenching of plants with a mixture of Copper oxycloride (COC) 50 WP@ 25g and 200 Urea in 10 litre of water found best however at Hisar, foliar spray of 10 ppm Cobalt chloride immediately after the occurrence of disease followed by foliar spray 50ppm of Sodium Benzoate

F - 11 -
ICAR - All India Coordinated Research Project on Cotton – Annual Report (2019 – 20)
immediately after the occurrence of disease showed maximum recovery of plants from parawilt (Table 81).
Akola: During 2019-20, the experiment was conducted on the management of parawilt of cotton with seven treatments including control. The treatments were not imposed since parawilt incidence was not observed during this year at Akola Station.
Junagarh: During 2019-20, experiment was conducted but parawilt was not observed.
Path. 3 (h): Evaluation of efficacy of bioagents against cotton diseases
The different bioagent treatments evaluated against root rot, wilt, bacterial fungal foliar spot disease at Nanded, Akola, Nagpur and Surat.
Among all the treatment, the lowest overall mean PDI of Alternarial leaf spot and bacterial blight was recorded in treatment T3 (seed and soil application of Bacillus aryabhatti + Bacillustequeilencis) followed by treatment 5 (Seed and soil application ofPf CICR.) (Table 82). However, the lowest pooled mean PDI of grey mildew was recorded in treatment 7 (Foliar application of Pyraclostrobin (0.1%) followed by treatment 6 (Chemical seed treatment (vitavax powder @ 0.2%).
At Nagpur, the treatment -3 (Combined application of Bacillus tequeilencis and Bacillus aryabhattai: Seed application: 108cfu/g @10g per kg of seed at the time of sowing Soil application: 2.5 kg/ha (30 & 60 DAS) with FYM/compost) was found to be superior interms of lowest percent incidence of Myrothecium leaf spot, Corynespora leaf spot (PDI), wilt and root rot incidence in cv Suraj (Table 83).
Among these eight treatments the highest seed germination percent was recorded win treatment 1 (Seed and soil application of Bacillus aryabhattai,) followed bt treatment 3. The overall mean seed cotton yield was highest in the treatment T3(25.4 Q/ha), followed by treatment treatment 1, 5, 6 (22.7Q/ha) (Table 84).
F - 12 -
All India Coordinated Cotton Improvement Project – Annual Report (2019 – 20)
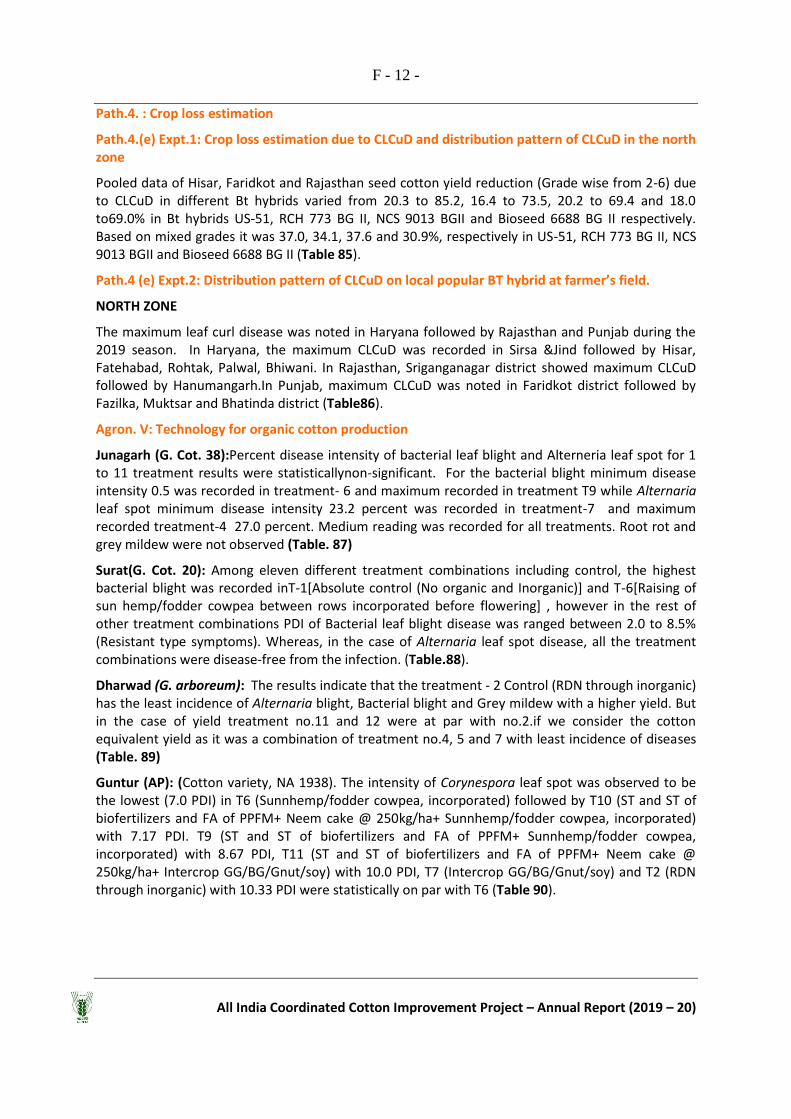
Path.4. : Crop loss estimation
Path.4.(e) Expt.1: Crop loss estimation due to CLCuD and distribution pattern of CLCuD in the north zone
Pooled data of Hisar, Faridkot and Rajasthan seed cotton yield reduction (Grade wise from 2-6) due to CLCuD in different Bt hybrids varied from 20.3 to 85.2, 16.4 to 73.5, 20.2 to 69.4 and 18.0 to69.0% in Bt hybrids US-51, RCH 773 BG II, NCS 9013 BGII and Bioseed 6688 BG II respectively. Based on mixed grades it was 37.0, 34.1, 37.6 and 30.9%, respectively in US-51, RCH 773 BG II, NCS 9013 BGII and Bioseed 6688 BG II (Table 85).
Path.4 (e) Expt.2: Distribution pattern of CLCuD on local popular BT hybrid at farmer’s field.
NORTH ZONE
The maximum leaf curl disease was noted in Haryana followed by Rajasthan and Punjab during the 2019 season. In Haryana, the maximum CLCuD was recorded in Sirsa &Jind followed by Hisar, Fatehabad, Rohtak, Palwal, Bhiwani. In Rajasthan, Sriganganagar district showed maximum CLCuD followed by Hanumangarh.In Punjab, maximum CLCuD was noted in Faridkot district followed by Fazilka, Muktsar and Bhatinda district (Table86).
Agron. V: Technology for organic cotton production
Junagarh (G. Cot. 38):Percent disease intensity of bacterial leaf blight and Alterneria leaf spot for 1 to 11 treatment results were statisticallynon-significant. For the bacterial blight minimum disease intensity 0.5 was recorded in treatment- 6 and maximum recorded in treatment T9 while Alternaria leaf spot minimum disease intensity 23.2 percent was recorded in treatment-7 and maximum recorded treatment-4 27.0 percent. Medium reading was recorded for all treatments. Root rot and grey mildew were not observed (Table. 87)
Surat(G. Cot. 20): Among eleven different treatment combinations including control, the highest bacterial blight was recorded inT-1[Absolute control (No organic and Inorganic)] and T-6[Raising of sun hemp/fodder cowpea between rows incorporated before flowering] , however in the rest of other treatment combinations PDI of Bacterial leaf blight disease was ranged between 2.0 to 8.5% (Resistant type symptoms). Whereas, in the case of Alternaria leaf spot disease, all the treatment combinations were disease-free from the infection. (Table.88).
Dharwad (G. arboreum): The results indicate that the treatment - 2 Control (RDN through inorganic) has the least incidence of Alternaria blight, Bacterial blight and Grey mildew with a higher yield. But in the case of yield treatment no.11 and 12 were at par with no.2.if we consider the cotton equivalent yield as it was a combination of treatment no.4, 5 and 7 with least incidence of diseases (Table. 89)
Guntur (AP): (Cotton variety, NA 1938). The intensity of Corynespora leaf spot was observed to be the lowest (7.0 PDI) in T6 (Sunnhemp/fodder cowpea, incorporated) followed by T10 (ST and ST of biofertilizers and FA of PPFM+ Neem cake @ 250kg/ha+ Sunnhemp/fodder cowpea, incorporated) with 7.17 PDI. T9 (ST and ST of biofertilizers and FA of PPFM+ Sunnhemp/fodder cowpea, incorporated) with 8.67 PDI, T11 (ST and ST of biofertilizers and FA of PPFM+ Neem cake @ 250kg/ha+ Intercrop GG/BG/Gnut/soy) with 10.0 PDI, T7 (Intercrop GG/BG/Gnut/soy) and T2 (RDN through inorganic) with 10.33 PDI were statistically on par with T6 (Table 90).

F - 13 -
ICAR - All India Coordinated Research Project on Cotton – Annual Report (2019 – 20)
Agron. Vb: Standardization of geometry for Bt varieties: Junagarh
Results of the trial revealed that Alternaria leaf spot disease incidence was started after 80DAS and maximum intensity was recorded at 100 DAS. A total of seventeen treatments was screened with different spacing and varieties, out of these treatments a significant difference was recorded between treatments. The minimum disease intensity was recorded in Rajat Bt with 90 x 15 cm spacing. It was statistically at par with T11 (Rajat Bt with 90x30cm), T9 (Rajat Bt with 60x15cm), T12 (Rajat Bt with 90x30cm) and T17 (G.Cot-8 BG II with recommended spacing). All our data analyzed and concluded that Alternaria leaf spot intensity was not dependent on spacing. Varieties reaction were significant, Rajat Bt was resistant, GJHV374 Bt and G.COT.HY. 8 BGII were moderately resistant, Suraj Bt and PKV 081 Bt were susceptible (Table 91)
Agron. V: Enhancing Nitrogen use efficiency in Bt Cotton. (GTHH 49 BG II): Junagarh
Percent disease intensity of bacterial leaf blight and Alternaria leaf spot for 1 to 7 treatment results were statistically non-significant. For the bacterial blight minimum disease intensity 0.5 was recorded in treatment-7 and maximum recorded in treatment T1 and T4 while Alternaria leaf spot minimum disease intensity 26.0 percent was recorded in treatment-2 and maximum recorded treatment-6, 27.1 percent (Table 92).
Concluded Experiment:
Path.3 (f) ; Management of sooty mold (Capnodiumspp.) in cotton
Based on pooled results (2017-18-2018-19, 2019-20), All the treatments showed a numerical reduction of sooty mold over control. Based on pooled data the highest reduction of sooty mold caused by whitefly/hid was recorded by Copper oxychloride (COC) 50 WP @ 2.25 g/litre of water followed by Propiconazole 25EC @ 1ml / litre of water. Among these treatments, the highest yield was recorded with Copper oxychloride (COC) 50 WP @ 2.25 g/litre of water followed by Propiconazole 25EC @ 1ml / litre of water and Mancozeb 50 WP @ 2.0g /L of water(Tables 93,94).

F - 14 -
All India Coordinated Cotton Improvement Project – Annual Report (2019 – 20)
Path.1 Epidemiological studies on cotton diseases NORTH ZONE Path1(a): Observations on the occurrence of various diseases (in farmer’s field and research farms) Table 1: Occurrence of Cotton Disease-Faridkot center (Punjab)
District Locations CLCuD BB FFS
Variety/Hybrid Acreage (PDI) (Grade ) (Grade)
Faridkot
R.R.S. Faridkot
10.71 0 Traces F 1861
11.81 0 1 F 846
14.29 0 1 F 1378
11.9 0 Traces F 2228
10.82 0 2 F 2383
13.15 0 1 F 2164
11.22 0 Traces F 1054
15.84 0 1 F 505
12.2 0 2 F 2381
1.24 -35.72
1-2 1-2 Different entries of Co-
ordinated and State trials
WaraDharaka 11.67 Trace 1-2 RCH 773 1.5 acre
Mehmuana 12.2 0 1-3 RCH 776 5 acre
9.17 0 1-2 RCH 776 3 acre
Dhab Sher singh 8.0 0 Traces RCH 773 2 acre
12.5 Traces Traces RCH 773 2 acre
Sukhan Wala 11.33 0 2 RCH 773 4 acre
NwanKilla 6.33 0 1 RCH 773 7 acre
Faridkot Local 9.83 Traces 1-2 RCH 773 2 acre
Machaki Mal Singh
14.83 0 1 RCH 773 2.5 acre
Sadik 12.0 0 1-2 RCH 773 3 acre
Sher Singh Wala 6.7 0 1-2 RCH 776 2.5 acre
Chahal 9.17 0 2-3 RCH 773 2 acre
8.7 0 1-2 RCH 776 4 acre
Fazilka
Sito 5.0 0 1-2 RCH 773 10 acre
4.17 0 1-2 RCH 776 6 acre
ChakRadhey Wala
5.0 0 1-2 RCH 773 12 acre
Kular 11.0 0 Traces RCH 773 3 acre
Rajpura 13.25 0 1-2 RCH 776 5 acre
Amarpura 9.67 0 Traces RCH 773 10 acre
7.14 0 1-2 RCH 776 8 acre
Khuian Sarwar 35.33 0 1-2 RCH 776 10 acre
33.67 0 1-2 RCH 773 8 acre
Telupura 31.17 0 1 RCH 773 4 acre
Daulatpura 22.15 Traces 1 RCH 773 3 acre
Nihal Khera 19.35 Traces 1-2 RCH 773 7 acre
KhippanWali 17.83 0 1 RCH 773 3 acre

F - 15 -
ICAR - All India Coordinated Research Project on Cotton – Annual Report (2019 – 20)
KhuiKhera 13.33 0 1-2 RCH 773 4 acre
HiranWali 12.17 0 1 RCH 773 6 acre
Ina Khera 9.76 0 1 RCH 773 10 acre
Malout 8.33 0 1-2 RCH 773 5 acre
Kabar Wala 11.67 0 1 RCH 773 3 acre
Muktsar
Kotli 7.4 0 1-2 RCH 773 8 acre
Khara 6.83 0 1 RCH 773 7 acre 5.67 0 1-2 RCH 776 2 acre
MarhMallu 9.33 0 1-2 RCH 773 4 acre LubaniaWali 4.0 0 Traces RCH 773 5 acre
Dohak 4.83 0 Traces RCH 773 2 acre
Seer Wali 7.33 0 Traces RCH 773 1.5 acre
Aulakh 10.67 0 1-2 RCH 773 5 acre
Muktsar local 11.81 0 1 RCH 773 5 acre 12.2 0 1-2 RCH 776 3 acre
Barkandi 9.85 Traces RCH 773 3 acre *CLCuD pressure was very low this year Table 2.Observations on Occurrence of Cotton Diseases – Bhatinda center(Punjab)
Block District Village Hybrid CLCuD
Bacterial Blight
FFS Root rot (%)
(PDI) (Grade) (Grade)
Bathinda Bathinda
Jodhpur Romana RCH 773 BG II 7.33 0 0 0
RCH 776 BG II 8.57 0 0 0
Bangikalan RCH 773 BG II 0 0 0 0
BangiRuldu
RCH 773 BG II 0 0 0 0
RCH 776 BG II 0 0-1 0-1 0
US 51 BG II 0 0 0 0
Burjkahn Singh wala RCH 776 BG II 0 0 0 0
RCH 773 BG II 0 0 0 0
GehriBaghi RCH 773 BG II 0 0-1 0-1 0
Jeewan Singh Wala RCH 776 BG II 10.67 0 0 0
Bhagi Bander RCH 773 BG II 0 0 0 0
Deon RCH 773 BG II 0 0 0 0
Naruana RCH 773 BG II 0 0 0 0
Kotsamir RCH 773 BG II 0 0 0 0
Kartar Singh Wala RCH 773 BG II 0 0 0 0
Bathinda RCH 773 BG II 13.33 0 0-1 0-5%
US 51 BG II 11.33 0 0-1 0-5%
Virk kalan SP 7172 BG II 0 0 0 0-5%
Nathana Bathinda
Nathana RCH 776 BG II 0 0 0 0-5%
Joganand US 51 BG II 0 0 0 0
0 0 0 0
Bibiwala RCH 773 BG II 0 0-1 0-1 0-5%
Govindpura RCH 773 BG II 0 0 0 0-5%
Bath US 71 BG II 0 0 0 0-5%
Poohla RCH 773 BG II 0 0 0 0
Poohli RCH 773 BG II 0 0 0 0
Sema RCH 773 BG II 0 0 0 0

F - 16 -
All India Coordinated Cotton Improvement Project – Annual Report (2019 – 20)
ChakBhaktu RCH 773 BG II 0 0 0 0
Gill Khurd RCH 773 BG II 0 0 0 0
Selbrah RCH 773 BG II 0 0 0 0
Kesar Singh Wala RCH 776 BG II 0 0 0 0-5%
Sangat Bathinda
ChaakKharak Singh Wala
RCH 776 BG II 0 0 0 0
ChakRuldu Singh Wala RCH 773 BG II 0 0 0 0
GursarSainewala SP 7172 BG II 0 0 0 0
Gehri Buttar RCH 773 BG II 0 0 0-1 0-5%
Sangat Mandi US 51 BG II 0 0 0 0
Kotguru RCH 773 BG II 0 0 0 0
Ghudda RCH 773 BG II 0 0 0 0
Jai Singh Wala US 51 BG II 0 0 0 0
Sangat Kalan RCH 773 BG II 0 0 0 0
Kotli Sabo RCH 773 BG II 0 0 0 0
Gursar RCH 776 BG II 0 0 0 5
Sainewala
Talwandi Sabo
Bathinda
Kotbhara RCH 773 BG II 0 0 0 0
Talwandi Sabo RCH 773 BG II 0 0-1 0-1 0
Jagga Ram Tirth US 51 BG II 0 0 0 0
BehmanJassa Singh SP 7172 BG II 0 0 0 0
Behman Kaur Singh US 51 BG II 0 0 0 0
Kotbaktu RCH 773 BG II 0 0 0 0
BangiRulda Singh RCH 773 BG II 0 0 0 0
Mal kana RCH 773 BG II 0 0 0 0
NasibpuraKailebander RCH 773 BG II 0 0 0-1 0-5%
GurusarJagga RCH 773 BG II 0 0 0 0
Kele Bander US 51 BG II 0 0 0 0
Sekhpura RCH 773 BG II 0 0 0 0-10%
Laleana RCH 773 BG II 0 0 0 0
FattaBalu RCH 773 BG II 0 0 0-1 0-10%
Maur Bathinda
Bhai Bakhtaur RCH 773 BG II 0 0 0 0
Ramgarh Bhunder RCH 776 BG II 0 0 0 0
Rai Khanna RCH 602 BG II 0 0 0 0
Ram Nagar RCH 773 BG II 14.67 0 0 0
Chanarthal RCH 773 BG II 0 0 0 0
Maur Khurd RCH 773 BG II 0 0 0 0
Natt RCH 773 BG II 0 0 0 0
Kuttiwalan Kalan RCH 773 BG II 0 0 0 0
Kuttiwala Khurd RCH 773 BG II 0 0 0 0
BhainiChuhaar RCH 773 BG II 0 0 0 0
Bagher Charat Singh RCH 773 BG II 0 0 0 0
Thambargarh RCH 773 BG II 0 0 0 0
Burj Sema RCH 773 BG II 0 0 0 0
Rampura
Balianwali RCH 776 BG II 0 0 0 0
Bhagibander RCH 773 BG II 0 0 0-1 0
Dhadhe RCH 773 BG II 0 0 0 0
BheniChuhar RCH 773 BG II 0 0 0 0
Nandgarh RCH 773 BG II 0 0 0 0
Gill Khurd RCH 773 BG II 0 0 0 0
Mandi Kalan RCH 773 BG II 0 0 0 0

F - 17 -
ICAR - All India Coordinated Research Project on Cotton – Annual Report (2019 – 20)
Mandi Khurd RCH 773 BG II 0 0 0 0
Gill Khurd RCH 773 BG II 0 0 0 0
Ramgarh Bhunder RCH 773 BG II 0 0 0-1 0
• For the disease reaction of Bacterial Blight and Fungal Foliar Leaf Spot, 0-4 grade was
considered.
• Incidence of Root rot was calculated in per cent (%).
Table 3: Observations on Occurrence of Cotton Diseases –ShriganganagarCenter (Rajasthan)
Tehsil Area surveyed Bt
hybrids/varieties PDI
Disease range
Sriganganagar district
Sriganganagar
3Y, Kaliyan, Khatlabana, Hindumalkot, Kotha, Khakha, Shivpur Head, 2C Badi, 3C Badi, Koni, Mohanpura, Mirzewala, 23ML, 22ML
RCH773
21.98 6.66-34.16
RCH 776
RCH 653
RCH 650
US 51 US71
Srikaranpur Kaminpura, Guabewala, 39GG, 37GG, 21H, 22H, 11O, 15FF, 24H, 24F, 6W, Jagtewala, Lakhian
SP7172 13.65 5.83-23.33
Sadulshahar 16LNP, 10LNP, Budhsinghwala, Lalgarh,
SP7272 19.37 13.33-26.66
Padampur Rattewala, 18 BB, 21BB, 4EEA, 1CC, Sawantsar
Super Seed Katha
6.22 6.66-14.16
District average 15.3 5.83-34.16
Hanumangarh district
Malkoka, DhankawaliDhani, Jandwali, Hirnawali, Dholipal, Nawan, Masani, Gurunagar, Munda, Mohanmagaria, Makkasar
RCH773
11.05 4.16-15.83
RCH 776
US 51
US71
SP7172
SP7272
RCH 650
NCS 9013
District average 11.05 4.16-15.83

F - 18 -
Table 4: Observations on Occurrence of Cotton Diseases -Hisar Center (Haryana)
Hisar
Village Cotton Hybrids June July August September
CLCuD BB MLS RR CLCuD BB MLS RR CLCuD BB MLS RR CLCuD
Khairampur RCH 773, BIO 6317 1 0 0 0 4.2 0 0 1 7 1 1 5 8.2
BodiaKhera RCH 773,776 2 0 0 0 4.2 0 0 1 8.2 1 4 1 8.0
Kabrel BIO 6488, RCH 776 1 0 0 0 2 0 0 1 9.2 2 4 1 9.0
Shahpur US 51, RCH 773 1 0 0 0 2.9 0 0 0 7.2 0 3.2 2 10.0
Fransi RCH 773,776, US 51 0 0 0 0 7.3 0 0 0 15 1 7 1 18.0
Sadalpur BIO 6588, RCH 773 1 0 0 0 4.2 0 0 1 9.2 0 5 2 10.2
Kalirawana RCH 773, 776, US 51 5.1 0 0 0 10.6 0 0 0 16 1 8 1 16.0
HAU Research Farm
CCS HAU
HS 6 3.6 0 0 0 22.2 0 0 2 33.3 4 3 2 55.5
H 1098(i) 1 0 0 0 20 0 0 0 33.3 2.2 4.2 2 50.0
F 2228 0 0 0 0 23.9 0 0 0 33.3 2 4 1.2 50.0
CSH 3075 0 0 0 0 16.7 0 0 0 33.3 4 5 0 57.2
RCH 773 0 0 0 0 0 0 0 0 9.4 2.2 5.2 0 33.3
F 846 0 0 0 0 22.2 0 0 0 33.3 3 4.2 1 66.7
RST 9 1.6 0 0 0 24.4 0 0 0 33.3 2 4.2 4 55.9
Bio 6317 0 0 0 0 16.7 0 0 0 21.7 3 5.2 0 50.0
Fatehabad
Banmandhori US 51, RCH 773, 776 0 0 0 0 6 0 0 2 7.2 0 2 4 10.0
Bhattu Kalan US 51, RCH 776, 773 1 0 0 0 6.2 0 0 0 14 0 3 2 16.0
KharaKheri RCH 773, 776 0 0 0 0 4.2 0 0 2 10.7 0 4 4 11.0
Dingsara RCH 773, US 51 0 0 0 0 6 0 0 2 11.1 0 4 5 12.3
Pili Mandori RCH 773, 776 1 0 0 0 12 0 0 1 20 0 4 2 21.1
Dhabi RCH 650, 773, 776 0 0 0 0 3.7 0 0 0 6.9 0 5 1 10.3
Jandli Kalan Khurd
US 51, BIO 6317 0 0 0 0 3.9 0 0 1 10 0 5 2 11.4
Jhalania RCH 650, 773, 776 0 0 0 0 3.5 0 0 1 11 0 5 3 12.5
Sirsa
NejiaKhera US 51, 0 0 0 0 4 0 0 1 8.5 2 2 4 10.0
Haripura RCH 650, 776 0 0 0 0 5 0 0 2 10.1 0 3 5 11.9
Dabra Kala RCH 776, US 51 0 0 0 0 8 0 0 2 12.1 1 3 2 14.2
Nahrena RCH 776, BIO 6317 0 0 0 0 7.3 0 0 2 8.2 0 3 3 10.8
Kherka BIO 6488, RCH 650 0 0 0 0 10.1 0 0 0 12 1 6 4 14.0
NathusariChopta RCH 650, 773 1 0 0 0 18.4 0 0 2 25.3 0 5 2 27.2
F - 19 -
ICAR - All India Coordinated Research Project on Cotton – Annual Report (2019 – 20)
Jind
Ikkas RCH 650, 776 0 0 0 0 8 0 0 2 16.2 0 4 2 31.0
Intak Kalan RCH 602, 773 0 0 0 0 10.2 0 0 0 14 2 1 1 20.0
KheriSheoran RCH 650, 776 0 0 0 0 6 0 0 0 12 0 4 1 22.0
Uchana US 51, RCH 773 0 0 0 0 4.2 0 0 1 14.2 0 4 1 21.0
Milakpur RCH 776, 773 1 0 0 0 8.2 0 0 1 16.6 2 3.2 2 28.0
Hebatpur RCH 650, BIO 6588 0 0 0 0 9.1 0 0 0 14 0 7 1 28.0
Rakhi Ghari RCH 650, BIO 6588 0 0 0 0 10 0 0 3 15 0 5 3.2 26.0
Nidana BIO 6317, US 51 0 0 0 0 8.2 0 0 1 16 0 4 1.4 31.2
Nidani RCH 776 0 0 0 0 6 0 0 2 16.2 0 5 2 35.0
Rohtak
Mundhal RCH 602, 773 0 0 0 0 4.2 0 0 2 10 0 5 4 12.0
Sishar US 51, RCH 773 0 0 0 0 6 0 0 0 8 0 1 1 14.0
Meham US 51, RCH 776 1 0 0 0 4.2 0 0 0 10.2 0 4 0 18.0
Kalanur RCH 602, 776 0 0 0 0 3 0 0 2 9.5 0 4 4 10.0
Bhiwani
Sungapur RCH 650, 773 0 0 0 0 3.7 0 0 4 7 2 4 4 12.0
Kharkari RCH 602, 650 0 0 0 0 4.5 0 0 4 7 1 5 4 13.4
Chandwash RCH 776, 773 2 0 0 0 5.3 0 0 5 8 1 5 5 9.5
Kagdoli RCH 602, 776 0 0 0 0 2.8 0 0 5 9 0 5 5 12.5
Bilawal RCH 650 0 0 0 0 4.1 0 0 4 6.2 0 4 4 13.0
Palwal
Mandkola RCH 773, BIO 6588 0 0 0 0 8 0 0 1 8 0 5 5 10.0
Aluka US 51, BIO 6317 1 0 0 0 4.2 0 0 2 6.2 2 1 0 8.0
Dhateer RCH 773, 776 0 0 0 0 6 0 0 1.2 10 0 4 2 13.0
Bhurja Ankur 3028, RCH 776 0 0 0 0 6.2 0 0 2 10 0 4 1 12.0
Ghugera RCH 776, US 51 1 0 0 0 4.2 0 0 2.2 8 1.2 3.2 0 12.2

F - 20 -
All India Coordinated Cotton Improvement Project – Annual Report (2019 – 20)
CENTRAL ZONE Path.1 (a): Observations on the occurrence of various diseases
Table 5: Observations on occurrence of cotton diseases on farmer’s field – Nanded center (Maharashtra)
Sr.No. Varieties / hybrids Alternaria
(PDI) Bacterial blight (PDI)
Grey-mildew (PDI)
1 Ankur (Bt) 7.23 4.85 8.66 2 Superb (Bt) 8.20 4.23 10.26 3 Bramha (Bt) 7.10 5.33 11.56 4 First Class (Bt) 8.96 4.23 8.63
5 Vitthal (Bt) 8.11 4.66 9.30 6 Gabbar (Bt) 7.12 5.00 8.63
7 Rasi (Bt) 12.40 5.23 13.20 8 Ajeet 155 (Bt) 7.45 5.23 9.56 9 Dr. Brent (Bt) 8.95 4.85 10.23
10 PA 255 (G.arboreum) 7.01 5.63 7.23 11 NHH 250 (Non Bt) 7.45 4.20 6.85 12 NH 615(Non Bt) 9.63 5.33 9.12 13 LRA 5166 (Non Bt) 10.23 7.23 7.10 14 NHH 44 ( Bt) 7.56 4.00 7.69
* PDI – Per cent disease intensity for Bacterial blight, Alternaria and Grey mildew.

F - 21 -
All India Coordinated Cotton Improvement Project – Annual Report (2019 – 20)
Table 6: Occurrence of cotton diseases in farmer’s field and research farm (Survey): Akola (Maharashtra)
Sr. No.
District/ Place
Variety/ Hybrid
Stage of sampling
Percent Disease Intensity (PDI)
Seedling (20-30 DAS)
Flowering (60-80 DAS)
Boll development (120-150 DAS)
BLB GM MLS BLB GM MLS BLB GM MLS
A Akola district
1 Nimkarda Ajeet 155 Bt - - - - - - 8.75 - -
BindastBt - - - - - - 11.25 - 20.00
2 Adosi Ankur 3028 - - - - - - 12.33 4.50 -
Ajeet 155 Bt - - - - - - 11.25 10.00 -
Jadoo BG II - - - - - - 14.33 - -
Ajeet 5 BG II - - - - - - 9.33 - -
3 Jogalkhed First class BG II 17.50 13.33 -
Neo Bt BG II - - - - - - 15.83 - 5.33
RCH 659 Bt - - - - - - 26.25 18.5 13.33
Ajeet 155 Bt - - - - - - 9.33 - -
4 Kasura First class BG II - - - - - - 15.67 - -
Neo Bt BG II 12.92
B Buldhana district
5 Nagzari Ajeet 155 Bt - - - - - - 13.33 - -
First class BG II 17.08
6 Takali Neo Bt BG II - - - - - - 13.5 14.58 -
Jadoo Bt - - - - - - 10.00 - -
7 Warkhed Ajeet 155 Bt - - - - - - 13.33 - -
First class BG II - - - - - - 15.83 19.00 -
8 Jawla Jadoo Bt - - - - - - 17.50 - 17.78
C Akola research station
Bhakti Bt - - - - - - 21.11 4.00 -
Ajeet 155 Bt - - - - - - 12.33 - -
Mallika Bt - - - - - - 14.58 4.50 -
Rasi 2 Bt - - - - - - 21.00 - -
JKAL 116 Bt - - - - - - 11.00 - -
PKV Hy 2 Bt - - - - - - 14.33 - -
AKH 081 Bt 12.33
Rajat Bt - - - - - - 15.83 - -
BLB- Bacterial leaf blight, GM- Grey Mildew, MLS-Myrothecium leaf spot

F - 22 -
All India Coordinated Cotton Improvement Project – Annual Report (2019 – 20)
Table 7: Observations on occurrence of cotton diseases- Surat Center (Gujrat)
Sr. No.
District Taluka Month Variety/
Hybrids/cultivars
Disease (PDI)
BLB ALS
1
Surat
Surat September to
November
G.Cot.Hy. 8 BGII 8.5 0.0
G.Cot.Hy. 10 BGII 18.5 0.0
G.Cot.Hy. 12 BGII 5.5 0.0
G.Cot.Hy. 12 NBt 34.0 2.5
G.Cot.Hy. 14 2.5 0.0
G.Cot.Hy. 18 18.5 0.0
G.N. Cot. 22 4.5 0.0
G.N. Cot. 29 0.0 0.0
G.Cot. 15 0.0 0.0
GTHH 49 2.5 0.0
G. Cot. Hy. 4 12.5 0.0
CSHH 15035 8.0 0.0
GSHH 15008 10.0 0.0
G. Cot. 100 4.5 5.5
G. Cot. 34 5.5 1.5
G. Cot. 16 5.0 0.0
G. Cot. 23 0.0 0.0
LRA 5166 36.5 2.0
Mandvi
October
BG II 10.0-12.0 0.0-2.0
BG II 8.5-10.0 0.0-0.0
BG II 0.0-1.0 0.0-2.0
Umarpada
BG II 2.0-3.0 0.0- 2.0
BG II 1.0-3.0 4.0-5.0
BG II 1.0-2.0 3.0-4.0
BG II 1.0-3.0 2.0-3.0
2 Bharuch Valia
October
BG II 2.0-6.0 0.0-3.0
BG II 4.0-8.0 15.0-20.0
BG II 1.0-2.0 3.0-4.0
BG II 1.0-2.0 1.0-2.0
Netrag October
BG II 0.0-1.5 2.0-3.0
BG II 3.0-5.0 2.0-4.0
BG II 1.0-2.0 0.0-2.0
BG II 2.0-3.0 2.0-4.0
BG II 1.0-2.0 2.0-4.0
3 Narmada Rajpipla October BG II 2.0-7.0 0.0-2.0

F - 23 -
All India Coordinated Cotton Improvement Project – Annual Report (2019 – 20)
Table 8: Observations on the occurrence of cotton diseases- Junagarh (Gujrat)
Village Taluka District Variety/hybrids/Bt Per cent disease intensity (%)
ALB BLB GM RR Parawilt
Majevadi Junagadh
Junagadh
Manimaker 23.5 1.0 12.0 0 0.0
ATM 21.2 1.5 10.4 0 0.0
RCH-659 19.2 1.0 18.0 0 0.0
Navab 20.5 1.5 11.5 0 0.0
RCH-Neo 18.20 1.0 8.0 0 0.0
Motimonpari Visavadar
Pas-Pas 15.0 0.0 12.5 0 2.0
Kohinur 16.0 1.6 18.0 0 0.0
Ankur 3028 18.0 0.5 19.5 0 0.0
Rasi-Neo 15.5 1.0 20.1 0 0.0
ATM 20.0 0.6 18.2 0 0.0
Chuda
Bhesan
Navab 19.6 0.5 15.5 0 5.0
Navab 17.0 1.0 16.0 0 2.0
Pas-Pas 19.0 1.0 15.0 0 0.0
RCH-659 20.1 1.0 21.0 0 0.0
Ajit-155 16.0 0.5 15.5 0 0.0
Torniya
Dhoraji
Rajkot
ATM 19.3 0.2 16.9 0 0.0
Gajab 14.2 1.0 13.5 0 0.0
Goldy 21.0 0.2 13.0 0 0.0
RCH-Neo 14.6 0.2 12.5 0 0.0
ATM 18.0 1.5 18.0 0 0.0
Boriya
Jamkandorana
Rajkot
Navab 19.3 1.5 13.6 0 0.0
Vikram-303 21.0 0.6 0.0 0 0.0
Mg cot-65 21.6 1.0 12.4 0 0.0

F - 24 -
All India Coordinated Cotton Improvement Project – Annual Report (2019 – 20)
Boriya
Jamkandorana
Rajkot
Navab 20.0 1.5 16.3 0 0.0
Navab 21.6 0.5 18.3 0 0.0
Vimalnagar Jamkandorana
Sampurna 15.5 1.5 19.6 0 0.0
Mg cot-65 19.5 0.5 21.2 0 0.0
Mg cot-65 20.6 1.0 22.0 0 0.0
Mg cot-65 19.4 1.0 20.0 0 0.0
ATM 17.0 1.5 18.0 0 0.0
Bagasara Bagasara Amerli
ATM 16.6 0.5 19.2 0 0.0
Gopal-155 19.7 0.4 23.5 0 0.0
Navab 16.7 0.6 24.0 0 0.0
ATM 16.0 0.5 15.5 0 0.0
Gopal-155 17.0 0.5 15.0 0 0.0
Turbo 19.2 1.0 18.6 0 0.0
ALS= Alternaria leaf spot, BLB=Bacterial leaf blight, GM=Grey mildew, RR=Root rot

F - 25 -
All India Coordinated Cotton Improvement Project – Annual Report (2019 – 20)
SOUTH ZONE Table 9: Observations on the occurrence of cotton diseases –Dharwad Center (Karnataka)
(In farmer’s field and in research farms) 2019-20
Locations Genotype Rainfed/ irrigated
Crop Stage PDI
AB BB GM
Dharwad District
Hebballi MRC-7383 Bt I
Seedling stage 10 5 -
Boll initiation 20 15 10
Boll Maturity 35 20 20
Shivalli Bhaskar Bt R
Seedling stage 5 5 -
Boll initiation 10 10 8
Boll Maturity 25 20 25
Dhummawad Mahadev Bt R
Seedling stage 10 - -
Boll initiation 10 10 8
Boll Maturity 30 25 20
Govankoppa RCH-659 Bt I
Seedling stage 5 5 -
Boll initiation 10 15 10
Boll Maturity 25 20 20
Maradagi MRC-7383 Bt R
Seedling stage 10 5 -
Boll initiation 20 10 10
Boll Maturity 25 20 25
Morab Soumya Bt R
Seedling stage 10 - -
Boll initiation 20 10 10
Boll Maturity 30 20 20
Yamanur ChaitannyaBt I
Seedling stage 10 5 -
Boll initiation 15 12 8
Boll Maturity 25 20 25
Byahatti CRC-659 Bt I
Seedling stage 10 5 -
Boll initiation 12 15 10
Boll Maturity 35 20 20

F - 26 -
All India Coordinated Cotton Improvement Project – Annual Report (2019 – 20)
Yarikoppa Kanaka Bt I
Seedling stage 10 5 -
Boll initiation 20 10 15
Boll Maturity 30 20 25
Jodahalli ACH-155 Bt I
Seedling stage 5 5 -
Boll initiation 15 10 10
Boll Maturity 30 20 25
Bavihal Money Bt I
Seedling stage 7 5 -
Boll initiation 15 15 10
Boll Maturity 30 20 25
Dastikoppa Kanaka Bt R
Seedling stage 10 2 -
Boll initiation 15 10 10
Boll Maturity 35 20 15
Kalaghatagi MRC-7385 Bt R
Seedling stage 10 5 -
Boll initiation 25 10 10
Boll Maturity 30 25 25
Noolvi MRC-7385 Bt I
Seedling stage 10 4 -
Boll initiation 20 10 10
Boll Maturity 38 25 25
Sharewad Ajeet-155 Bt I
Seedling stage 10 4 -
Boll initiation 25 10 10
Boll Maturity 35 20 15
Kundagol Mahadev Bt I
Seedling stage 8 5 -
Boll initiation 22 15 12
Boll Maturity 32 20 25
Shirur MRC-7351 Bt I
Seedling stage 8 5 -
Boll initiation 10 10 10
Boll Maturity 30 15 25
Navalgund Ajeet-155 Bt I
Seedling stage 10 5 -
Boll initiation 15 15 10
Boll Maturity 35 20 25
Mulamuttal Soumya Bt I Seedling stage 5 4 -
Boll initiation 20 12 10
F - 27 -
All India Coordinated Cotton Improvement Project – Annual Report (2019 – 20)
Boll Maturity 28 25 20
Konnur Miracle Bt I
Seedling stage 10 5 -
Boll initiation 15 10 8
Boll Maturity 30 25 20
Lakamapur DiamandBt I
Seedling stage 12 4 -
Boll initiation 18 10 5
Boll Maturity 35 25 20
Uppinabetageri Soumya Bt R
Seedling stage 10 4 -
Boll initiation 15 12 10
Boll Maturity 40 25 20
Marewad Miracle Bt R
Seedling stage 10 5 -
Boll initiation 15 10 8
Boll Maturity 35 25 20
Timmapur Ajeet-155 Bt R
Seedling stage 10 5 -
Boll initiation 20 15 10
Boll Maturity 30 20 25
Karadigudda MRC-7385 Bt R
Seedling stage 10 4 -
Boll initiation 20 12 10
Boll Maturity 35 20 25
Lokur Soumya Bt R
Seedling stage 10 - -
Boll initiation 15 10 15
Boll Maturity 38 12 20
Somapur Ajeet-155 Bt I
Seedling stage 10 5 -
Boll initiation 12 10 8
Boll Maturity 30 25 15
Hebasur MRC-7351 Bt I
Seedling stage 10 4 -
Boll initiation 15 12 10
Boll Maturity 45 20 25
Gopanakoppa Everest Bt R
Seedling stage 5 - -
Boll initiation 20 15 10
Boll Maturity 40 18 15

F - 28 -
All India Coordinated Cotton Improvement Project – Annual Report (2019 – 20)
Belgaum District
Anigol First Class I
Seedling stage 10 - -
Boll initiation 20 12 10
Boll Maturity 35 25 20
Bevinkoppa YuvaBt I
Seedling stage 8 - -
Boll initiation 20 10 10
Boll Maturity 30 25 20
Neginhal First Class I
Seedling stage 5 - -
Boll initiation 15 10 15
Boll Maturity 30 20 25
Sampagova YuvaBt I
Seedling stage 5 - -
Boll initiation 15 8 15
Boll Maturity 35 20 25
Vakkunda MRC-7383 Bt I
Seedling stage 10 - -
Boll initiation 15 10 10
Boll Maturity 30 15 25
Murgod Puli Bt I
Seedling stage 5 - -
Boll initiation 10 10 5
Boll Maturity 25 20 25
Hosur Money Maker Bt I
Seedling stage 10 - -
Boll initiation 15 8 5
Boll Maturity 28 16 20
Koravinkoppa MRC-7352 Bt I
Seedling stage 10 5 -
Boll initiation 25 10 8
Boll Maturity 35 20 20
Yaradala Everest Bt I
Seedling stage 10 - -
Boll initiation 20 8 10
Boll Maturity 35 20 25
M.K. Hubballi Mahadev Bt I
Seedling stage 5 5 -
Boll initiation 15 10 5
Boll Maturity 35 25 10
Udikeri Everest Bt Seedling stage 10 5 -

F - 29 -
All India Coordinated Cotton Improvement Project – Annual Report (2019 – 20)
Boll initiation 15 12 10
Boll Maturity 30 25 15
Hosur MRC-7351 Bt I
Seedling stage 5 - -
Boll initiation 12 15 10
Boll Maturity 25 20 15
Doopadal JaaduBt I
Seedling stage 5 3 -
Boll initiation 20 15 10
Boll Maturity 30 25 20
Belawadi Chiranjeevi Bt I
Seedling stage 10 - -
Boll initiation 12 10 8
Boll Maturity 30 15 20
Mallur Everest Bt I
Seedling stage 10 4 -
Boll initiation 15 12 10
Boll Maturity 28 18 15
Asundi Chiranjeevi Bt I
Seedling stage 5 3 -
Boll initiation 20 15 10
Boll Maturity 30 18 15
Ghataprabha Money maker I
Seedling stage 5 3 -
Boll initiation 10 12 10
Boll Maturity 25 20 20
Murukumbi Everest Bt I
Seedling stage 10 4 -
Boll initiation 15 12 10
Boll Maturity 30 20 25
Akkatangirahal Chiranjeevi Bt I
Seedling stage 5 - -
Boll initiation 20 15 10
Boll Maturity 30 18 25
Haveri District
Varadahalli Chiranjeevi Bt R
Seedling stage 5 - -
Boll initiation 18 12 8
Boll Maturity 20 15 25
Yalavigi JaaduBt I
Seedling stage 5 3 -
Boll initiation 10 15 10
Boll Maturity 30 18 20

F - 30 -
All India Coordinated Cotton Improvement Project – Annual Report (2019 – 20)
Savanur MRC-7351 Bt I
Seedling stage 10 5 -
Boll initiation 18 12 10
Boll Maturity 30 20 15
Kurubagonda
Chiranjeevi Bt I
Seedling stage 5 - -
Boll initiation 12 15 10
Boll Maturity 25 18 25
Mattur MRC-7351 Bt I
Seedling stage 5 - -
Boll initiation 20 15 10
Boll Maturity 30 25 15
Bisanahalli MRC-7351 Bt R
Seedling stage 10 - -
Boll initiation 20 10 15
Boll Maturity 35 15 20
Bankapur Everest Bt R
Seedling stage 10 5 -
Boll initiation 12 10 8
Boll Maturity 30 20 22
Motebennur MRC-7351 Bt R
Seedling stage 10 - -
Boll initiation 15 12 10
Boll Maturity 30 20 25
Hmsabhavi JaaduBt R
Seedling stage 10 - -
Boll initiation 12 10 8
Boll Maturity 30 20 18
Sriramankoppa MRC-7351 Bt R
Seedling stage 5 3 -
Boll initiation 20 15 10
Boll Maturity 30 20 15
Haradahalli Everest Bt I
Seedling stage 10 5 -
Boll initiation 12 10 8
Boll Maturity 30 18 25
Tavaragi MRC-7351 Bt I
Seedling stage 10 - -
Boll initiation 15 12 10
Boll Maturity 28 22 22
Akkialur Puli Bt I
Seedling stage 5 5 -
Boll initiation 12 15 10
Boll Maturity 35 25 15
Adur Everest Bt R Seedling stage 5 5 -

F - 31 -
All India Coordinated Cotton Improvement Project – Annual Report (2019 – 20)
Boll initiation 12 15 10
Boll Maturity 30 25 15
Hosalli MRC-7351 Bt I
Seedling stage 10 - -
Boll initiation 15 12 10
Boll Maturity 30 18 25
Gadag District
Laxmeshwar RashiBt I
Seedling stage 10 5 -
Boll initiation 20 15 10
Boll Maturity 35 18 20
Shirahatti TridevBt I
Seedling stage 5 4 -
Boll initiation 18 10 10
Boll Maturity 30 20 15
Gulgajikoppa First Class I
Seedling stage 5 - -
Boll initiation 20 15 8
Boll Maturity 35 20 15
Govinhala Super fiber I
Seedling stage 4 2 -
Boll initiation 18 12 8
Boll Maturity 25 18 20
Timmapur JaihoBt R
Seedling stage 5 4 -
Boll initiation 10 12 10
Boll Maturity 25 18 25
Allipur Bunny Bt I
Seedling stage 10 5 -
Boll initiation 15 15 10
Boll Maturity 38 25 20
Kadakol JaaduBt I
Seedling stage 5 5 -
Boll initiation 12 15 10
Boll Maturity 32 20 18
Veerapur Chiranjeevi Bt I
Seedling stage 10 5 -
Boll initiation 12 10 8
Boll Maturity 35 20 25
Hulakoti MRC-7351 Bt I Seedling stage 5 - -

F - 32 -
All India Coordinated Cotton Improvement Project – Annual Report (2019 – 20)
Boll initiation 10 10 10
Boll Maturity 30 20 25
Mevundi Puli Bt I
Seedling stage 10 8 -
Boll initiation 15 12 10
Boll Maturity 35 25 15
Uttar Kannada District
Koppa MRC-7351 Bt R
Seedling stage 5 3 -
Boll initiation 20 15 10
Boll Maturity 25 18 25
Mundagod Chiranjeevi Bt R
Seedling stage 8 - -
Boll initiation 12 8 10
Boll Maturity 25 15 20
Bachunaki Everest Bt R
Seedling stage 10 4 -
Boll initiation 15 10 10
Boll Maturity 30 20 25
Malagi MRC-7351 Bt R
Seedling stage 5 3 -
Boll initiation 10 5 12
Boll Maturity 20 10 20

F - 33 -
All India Coordinated Cotton Improvement Project – Annual Report (2019 – 20)
Table 10: Observations on the occurrence of cotton diseases- Guntur Center (Andhra Pradesh) (in farmers’ fields) Month Location (Village/ District) Hybrid
(BG II) Stage of the crop (days)
Per cent disease Intensity (PDI)
ALS CoLS BLB GM Rust
Aug’19 Gorantla MH 5370 21 0 0 0 0 0
Crystal 999 21 0 0 0 0 0
Jonnalagadaa Crystal 999 21 0 0 0 0 0
Magna 21 0 0 0 0 0
Atish 21 0 0 0 0 0
Tatireddypalem Crystal 999 10-20 0 0 0 0 0
Nidumukkala Sadananda 10-30 0 0 0 0 0
Gudipudi Shakthi 28 0 0 0 0 0
Magna 30 0 0 0 0 0
Nava Mallika 30 0 0 0 0 0
Magic 30 0 0 0 0 0
Bejathpuram RCH 659 30 0 0 0 0 0
Magna 30 0 0 0 0 0
Crystal 999 30 0 0 0 0 0
Damarapalli Nava Mallika 30 0 0 0 0 0
Super Shine 30 0 0 0 0 0
RCH 659 30 0 0 0 0 0
Money Maker 30 0 0 0 0 0
Raja 30 0 0 0 0 0
Lam RCH 659 7.0 0 0 0 0 0
Sept.’19 Ramapuram Vennela 90 Traces 0 0 0 0
Police 90 Traces 0 0 0 0
Super Shine 90 Traces 0 0 0 0
Damarapalli Sidda 50 Traces 0 0 0 0
Super Shine 50 Traces 0 0 0 0
Jaadoo 50 Traces 0 0 0 0
Raja 50 Traces 0 0 0 0
Kurnoothala Bhakthi 55 0 0 0 0 0
Money Maker 55 0 0 0 0 0
Moksha 55 0 0 0 0 0
Dheeraj 55 0 0 0 0 0
RCH 659 55 0 0 0 0 0
Abbineniguntapalem Big Boss 55 0 0 0 0 0
Palaparru Super Shine 55 0 0 0 0 0

F - 34 -
All India Coordinated Cotton Improvement Project – Annual Report (2019 – 20)
Pedanandipadu Jaadoo 55 0 0 0 0 0
Chilakaluripet Jaadoo 55 0 0 0 0 0
Oct’19 Kakani Bhakthi 55 0 0 0 0 0
Repudi Akira 55 10.0 0 0 0 0
Satuluru Mahyco 55 9.0 0 0 0 0
Narasingapadu RCH 659 60 2.0 0 0 0 0
Gundlapalli Raja 60 13.5 9.0 0 0 0
Zulakallu Jaadoo 60 8.0 0 0 0 0
Karempudi RCH 659 60 28.0 0 0 0 0
Oppicharla RCH 659 60 15.0 0 0 0 0
Narmalapadu Money Maker 90 5.0 5.0 5.0 0 0
Big Boss 90 5.0 0 10.0 0 0
Adigoppula Sadananda 90 5.0 0 0 0 0
Obulesunipalli, Jaadoo 90 12.6 5.0 0 0 0
Durgi Geetha 90 25.0 5.0 0 0 0
Raja 90 20.0 0 0 0 0
Jonnalagadda RCH 659 90 10.0 0 0 0 0
Ravipadu Raja 90 5.0 0 0 0 0
Nudurupadu RCH 659 90 7.0 0 0 0 0
Vemavaram Jaadoo 90 5.0 0 0 0 0
Nov’19 Kantheru Akira 100 10.0 7.75 0 0 0
Tadikonda RCH 659 100 5.0 10.0 0 0 0
LacchannaGudipudi Neo 120 8.5 6.0 3.0 0 0
Crystal 999 120 4.0 5.0 0 0 0
Koyavaripalem RCH 659 120 2.0 12.0 0 0 0
Abbineniguntapalem Jaadoo 120 2.5 4.0 0 5.0 0
Adusumilli Akira 120 14.0 5.0 0 3.0 0
Daggubadu RCH 659 120 9.0 3.0 0 5.0 0
Inkollu Jaadoo 120 7.5 28.75 0 10.0 0
Konikipalli Jaadoo 120 20.0 12.0 0 5.0 0
Tiruvuru Crystal 999 110 2.0 5.0 0 7.0 0
Bold 110 7.0 10.0 0 10.0 0
Kambhampadu RCH 659 110 3.0 7.0 10.0 18.0 0
A Konduru Jaadoo 110 5.0 2.5 0 10.0 0
Krishna Rao Palem Crystal 999 120 6.5 13.0 2.5 9.0 0
Cheemalapadu RCH 659 120 3.0 4.5 0 6.0 0
Badava Jaadoo 120 2.0 6.0 0 5.0 0
Mylavarm Jaadoo 120 3.0 5.0 0 12.0 0

F - 35 -
All India Coordinated Cotton Improvement Project – Annual Report (2019 – 20)
Gorlavaripalem Akira 130 2.0 5.0 0 0 0
Damarapalli Superb 130 5.0 15.0 0 0 0
Jonnalagadda Atish 120 2.0 5.0 0 0 0
Dec’19 Hussanapuram Tadakha 125 2.0 0 0 13 0
Nannur Tadakha 130 4.0 5.0 0 25 1.7
Kurnool Jaadoo 130 7.4 0 0 12.6 2.75
Penchikalapadu Bhakthi 130 0 0 0 20.0 2.0
Machavaram Raja 120 1.4 2.4 0 2.3 0
Devanakonda Jaadoo 120 2.0 2.0 0 14.0 0
Asperi ATM 125 2.8 2.5 0 2.0 0
Virupapuram Jaadoo 125 3.0 1.0 0 4.0 0
Pandavagallu Bhakthi 130 2.0 0 1.0 1.0 0
Urukunda Jaadoo 130 2.0 3.0 1.0 5.2 0
Rajanagar Jaadoo 125 10.0 0 0 28.0 0
Kosagi ATM 125 1.0 0 0 1.0 0
Chetnihalli Jaadoo 130 1.0 0 0 2.0 0
Sugur Bhakthi 130 18.0 3.0 0 16.25 0
Yemmiganur Jaadoo 125 0 0 0 11.0 0
Ralladoddi ATM 125 9 5.67 0 5.2 0
Gonegandla Jaadoo 125 0 0 0 5.75 0
Jan’20 Budampadu Jaadoo 150 0 13.67 0 10.42 13.86
Raja 150 0 11.67 0 18.75 20.0
ALS= Alternaria leaf spot; CoLS=Corynespora leaf spot, GM=Grey mildew

F - 36 -
All India Coordinated Cotton Improvement Project – Annual Report (2019 – 20)
Table 11. Observations on the occurrence of cotton diseases- Guntur Center (Andhra Pradesh) Summary Month Hybrids (BG II) Incidence (%) Mean Percent Disease Intensity (PDI)
Wilt Root rot
Boll Rot
ALS HLS CLS ATN CoLS MLS BB GM Rust
Aug-19
MH 5370, Crystal 999, Magna, Atish, Sadananda, Shakthi, Nava Mallika, Magic, RCH 659, Super Shine, Money Maker, Raja
0 0 0 0 0 0 0 0 0 0 0 0
Sept. 2019
Vennela , Police, Super Shine, Sidda, Jaadoo, Raja, Bhakthi, Money Maker, Moksha, Dheeraj, RCH 659, Big Boss
0.0 to 5.0
0.0 to 2.0
0 0.0 to traces
0 0 0 0 0 0 0 0
Oct. 2019
Bhakthi, Akira ,Mahyco, RCH 659, Raja, Jaadoo Money Maker, Big Boss, Sadananda, Geetha
0 0 0.0 to 5.0
0.0 to 28.0
0 0.0 to traces
0.0 to traces
0.0 to 9.0
0 to Traces
0 to 10.0
0 0
Nov. 2019
Akira, RCH 659, Neo, Crystal 999, RCH 659, Jaadoo, Bold, Superb, Atish
0 0 0.0 to 3.0
2.0 to 20.0
0 0.0 to traces
0.0 to 10.0
2.5 to
28.75
0 0 0.0 to 18.0
0
Dec. 2019
Tadakha, Jaadoo, ATM, Bhakthi, , Raja 0 0 0 0.0 to 18.0
0 .0 0 .0 0 0.0 to
5.67
0 0 1.0 to 28.0
0 to 2.75
Jan. 2020
Jaadoo, Raja 0 0 Traces 0 0 .0 0 .0 0.0 to traces
11.67 to
13.67
0 0 10.42 to
18.75
13.86 to 20.0
RARS, Lam, Guntur
Varieties and Hybrids of cotton trials 0 0 Traces to 1%
0 to 30.0
0 .0 0 to Traces
0.0 to 14.0
0.0 to
48.25
0 to Traces
0 to 25.0
0 to 35.5
0 to 44.0
ALS: Alternaria leaf spot; HLS: Helminthosporium leaf spot; CLS: Cercospora leaf spot; ATN: Anthracnose; CoLS: Corynospora Leaf spot; MLS: Myrothecium leaf spot; BB: Bacterial blight; GM: Grey mildew

F - 37 -
All India Coordinated Cotton Improvement Project – Annual Report (2019 – 20)
Table 12: Observations on the occurrence of cotton diseases- Coimbatore Center (Tamil Nadu) S.
No. Place District Area
(acre) Hybrid / Variety Disease Incidence
1. Thondamuthur, Coimbatore 3 Bt Cotton Grey mildew (2.0PDI) and Alternaria leaf blight (2.0PDI)
2. Munkiltholuvu Coimbatore 4 Bt Cotton
3. Pethappampatti Coimbatore 4 Bt Cotton
4. Kenathukadavu, Coimbatore 3 Bt Cotton Alternaria leaf blight (2.0PDI), and Tobacco streak virus (1.0 PDI)
5. Puttur Coimbatore 4 Bt Cotton
6. Sinkaiyanpudur Coimbatore 3 Bt Cotton
7. TNAU Coimbatore 30 Variety Grey mildew (1.0PDI), ALB (2.0PDI), TSV (1.0 PDI) and root rot (10%)
8. Alampatti Madurai 1 Non-Bt Alternaria leaf blight minimum disease incidence.
9 S. Ammapatti Madurai 6 Non-Bt
10. Rajapalayam Virudhunagar 4 Bt Cotton and variety Alternaria leaf blight, Bacterial leaf blight and root rot (5-10%) minimum disease incidence. 12. Ramalingapuram Virudhunagar 2 Bt Cotton and variety
13. Mudhukudi Virudhunagar 2 Bt Cotton and variety
14. Sholapuram Virudhunagar 3 Bt Cotton and variety
15. Desigapuram Virudhunagar 3 Bt Cotton and variety
16. Sholaisari Tirunelvelli 3 Bt Cotton and variety Alternaria leaf blight and Bacterial leaf blight minimum disease incidence.
17. Perumalpatti Tirunelvelli 3 Bt Cotton and variety
18. Karivalamvantha-nallur Tirunelvelli 2 Bt Cotton and variety
Sankarankovil Tirunelvelli 2 Bt Cotton and variety
22. Kurukalpatti Tirunelvelli 8 Bt Cotton and variety
23. Kuvalakanni Tirunelvelli 3 Bt Cotton and variety
24. Erode Erode 5 Bt Cotton Grey mildew (3.0PDI)
Chittode Erode 5 Bt Cotton
25. Perambalur Perambalur 25 Bt Cotton Alternaria leaf blight (3.0PDI), Grey mildew (2.0PDI) and Bacterial leaf blight (2.0PDI)
26. Veppanthattai Perambalur 15 Bt Cotton
27. Paluvur Perambalur 15 Bt Cotton
28. Kundadam Tiruppur 6 Bt Cotton Alternaria leaf blight (3.0PDI), Grey mildew (3.0PDI)
29 Dharapuram Tiruppur 5 Bt Cotton
30. Palam Rajakkapatti Dindigul 5 Bt Cotton Alternaria leaf blight (3.0PDI), Grey mildew (3.0PDI)
31. Chinnagoundanvalasu Dindigul 5 Bt Cotton
32. Amplikkai Dindigul 10 Bt Cotton

F - 38 -
All India Coordinated Cotton Improvement Project – Annual Report (2019 – 20)
Path 1 (b) Disease progress in relation to weather factor
NORTH ZONE Table 13:Disease progress on F846 in relation to weather factors at Faridkot (Punjab)
SMW
Date Temperature (o C )
Relative humidity (%)
Rainfall (mm)
Sunshine (Hour)
Wind direction
F846 HS6 RS921 RST9
CLCuD (DI)
CLCuD PDI
w.fly/ 3 leaf
CLCuD (DI)
CLCuD PDI
w.fly/ 3 leaf
CLCuD (DI)
CLCuD 3 leaf
w.fly/ 3 leaf
CLCuD (DI)
CLCuD PDI
w.fly/ ma
x min
mean
Max
Min Mean
25 18-24 June
35.9
25.7
30.8 68 44 56 18.8 5.2 S 0 0 0.6 0 0 0.3 0 0 0.3 1 0.1 0.9
26 25-01 July 39.4
28.3
33.9 62 37 50 0 6.4 SSW 0.8 0.5 1.7 0 0 1.1 0 0 0.6 2.8 0.6 2.1
27 02-08 July 37.1
28 32.5 72 54 63 26.7 5.5 E 0.8 0.7 2.7 0.8 0.5 3 1.5 1 1.9 5.2 0.8 3.3
28 09-15 July 33.6
28 30.8 78 64 71 3.7 1.3 S 1.8 1 9.3 5.4 1.3 7.2 4.2 1.8 4.8 12.8 2.6 6.5
29 16-22 July 32.4
26.3
29.4 87 69 78 102.4 4.5 ESE 2.8 1.2 12.6 6.8 2.4 14.1 5.6 2 11.8 19.6 4.8 12.2
30 23-29 July 33.9
27.2
30.6 81 64 73 0.9 4 E 6.6 1.3 13.7 11.1 3.2 15.3 8 2.4 12.3 22.1 5 16.4
31 30-05 Aug
34 27 30.5 84 68 76 25.1 4 SSE 15.8 3.5 9.6 15.8 4.1 12.2 13.2 4.8 13.5 36.4 6.2 15.1
32 06-12 Aug
34.8
27.8
31.3 83 64 74 12.4 6.7 S 24.6 5.8 5.4 24.6 5.9 7.9 22.8 5.6 8.2 40.9 8.5 8.8
33 13-19 Aug
33.3
26.1
29.7 87 66 77 20.2 4.2 SE 38.5 7.4 5.1 38.5 6.4 6.1 36.1 8.2 7.1 44.8 10.2 6.7
34 20-26 Aug
35.2
26.6
30.9 83 58 70 0 7.6 SSE 48.9 10.5 3.2 48.9 12.2 4.2 47.9 11 5.3 56.9 13.3 5.6
35 27-2 Sept 35.9
27 31.5 82 63 72 6.6 2.8 SSW 62.6 17.3 3 62.6 16.8 3.8 58.3 15.5 5.1 68.1 18 5.1
36 03-09 Sept
35.2
27.2
31.2 86 61 73 45.8 6.1 ESE 75.2 19.5 2.9 75.2 20 3.9 66.2 20 4.3 74.3 20.4 4.7
37 10-16 Sept
35.6
27.2
31.4 86 24 55 0 7 SE 83.1 23.8 4.1 83.1 22.8 4.2 78.1 22.9 4.8 78.2 26.6 4.2
38 17-23 Sept
33.5
25 29.3 84 61 72 0 8.3 ESE 85.4 24.7 4.8 85.4 26.4 6.8 82.5 26.4 5.6 86.1 29.1 6.8
39 24-30 Sept
31.9
23.7
27.8 84 60 72 1 5.2 SSE 96.6 28.9 5.8 96.6 32.2 5.1 92.6 32.8 6.1 97.2 32.4 7.4
40 01-07 Oct 30 20.4
25.2 90 59 75 3.7 4.3 S 100 34.4 5.2 100 36 6.4 100 33 4.2 100 36.8 5.9
41 08-14 Oct 32.7
18.3
25.5 86 40 63 0 7.3 S 100 34.4 4.7 100 36 3.8 100 33 3.1 100 36.8 3.4
42 15-21Oct 31 18.1
24.6 82 43 62 4 5 S 100 34.4 4.1 100 36 2.4 100 33 2.9 100 36.8 1.6
43 22-28 Oct 31.5
15.8
23.7 86 37 62 0 5.7 SW 100 34.4 1.1 100 36 0.2 100 33 0.9 100 36.8 0.4
44 29-04 Nov
30.1
15.4
22.7 89 40 65 0 2.8 W 100 34.4 0.1 100 36 0.2 100 33 0.1 100 36.8 0.1

F - 39 -
All India Coordinated Cotton Improvement Project – Annual Report (2019 – 20)
Table14: Disease progress in relation to weather factors at Sriganganagar (Rajasthan)
Std. week No.
Date of Observation Disease incidence
(%)
Meteorological data
Rain fall (mm) Temperature (oC) RH (%)
Max Min 8.30 am 17.30 pm
27 02.07.19 2.54 0 43.31 32.69 59.71 40
28 09.07.19 21.54 0 40.46 32.29 56.29 43.71
29 16.07.19 32.57 17.4 37.59 27.86 77.57 66.29
30 23.07.19 74.44 24.5 36.19 29.03 81 62.43
31 30.07.19 86.17 34.5 35.69 27.96 83.71 71.57
32 06.08.19 95.07 0.2 37.73 28.53 78.57 60.86
33 13.08.19 100.00 2.0 37.64 27.76 75.29 56.29

F - 40 -
All India Coordinated Cotton Improvement Project – Annual Report (2019 – 20)
Table 15: Disease progress in relation to weather factors at Hisar (Haryana)
Std. Met. Week
Period Temp. 0C RH % WS
KM/H Sunshine
(Hour) Rain fall
(mm) Rainy Days
WF/3 leaves
CLCuD (% incidence)
CLCuD Difference (%)
CLCuD Index
(%) Max. Min. M E
23 04 - 10.6.19 43.5 25.8 55 17 5.6 8.8 0 0 3.53 0.00 0.00 0.00 24 11 - 17.6.19 41.8 26 67 36 7.4 8.3 55.1 3 9.26 5.66 0.00 0.93 25 18-24.6.19 35.7 24.6 78 43 6.7 8.2 20.3 1 10.2 9.00 3.34 1.50 26 25.6- 01.7.19 39.1 25.5 77 44 5.5 7.6 29.7 1 18.4 9.66 0.66 1.59 27 02- 08.7.19 38.6 26.2 74 56 6.5 6.5 1.8 0 9.8 22.0 12.34 3.99 28 09- 15.7.19 37.2 27.3 72 57 9.9 0.7 13.4 1 19.1 32.66 10.66 5.83 29 16 - 22.7.19 32.5 23.7 93 70 6.3 4.5 81.5 2 20.1 49.00 16.34 9.66 30 23- 29.7.19 33.2 25.3 88 73 6.4 3.8 23.7 2 25.0 61.00 12.00 12.99 31 30.7 -
05.8.19 33.8 25.1 86 67 5.6 5.3 17.7 2 26.1 75.33 14.33 17.32
32 06 - 12.8.19 34.6 27 87 68 7.2 6.3 63 1 40.6 82.66 7.33 21.82 33 13 - 19.8.19 33.3 25.5 89 70 5.8 4.5 15.4 1 41.9 94.33 11.67 27.65 34 20- 26.8.19 35.6 25.8 86 56 4.7 8.2 0 0 42.1 94.33 0.00 31.32 35 27.8- 02.9.19 36.2 27.4 83 55 5.2 6.9 0 0 42.3 94.66 0.33 33.15 36 03- 09.9.19 35.7 27 89 59 4.1 6.2 27.7 1 27.7 95.66 1.00 33.65 37 10 -16.9.19 37 27.1 87 51 5.1 6.6 0 0 31.5 96.66 1.00 39.32 38 17 - 23.9.19 35.1 25.2 84 49 6.8 6.7 0 0 22.3 96.66 0.00 43.65 39 24 - 30.9.19 33.4 24.3 84 57 6.9 7.2 2.2 0 25.6 97.00 1.00 48.81 40 01 - 07.10.19 31.8 21 92 50 4.1 5.5 2.6 1 21.8 97.00 0.00 49.31 41 08 - 14.10.19 32.7 17.6 90 39 2.9 7.5 0 0 10.7 97.00 0.00 50.81 42 15 - 21.10.19 34.1 18.4 79 34 4.5 7.3 0 0 8.4 97.00 0.00 54.81 43 22 - 28.10.19 31.9 14.9 79 31 2.2 6.5 0 0 8.3 97.00 0.00 55.48 44 29- 04.11.19 30.7 16.2 90 35 1.3 1.8 0 0 3.9 97.00 0.00 55.48

F - 41 -
All India Coordinated Cotton Improvement Project – Annual Report (2019 – 20)
Table 16: Disease progress in relation to weather factors at Sirsa (Haryana)
SMW Date/Period % CLCuD incidence
PDI Whitefly/3
leaves Temperature °C
Relative humidity (%)
Rainfall (mm)
Max. Mini M E (Mm)
24 11 - 17.6.19 42.2 29.6 53.9 30.7 52.6
25 18-24.6.19 37.6 26.0 70.1 46.1 14.0
26 25.6- 01.7.19 0.9 0.1 2.5 39.9 26.9 62.3 41.7 0.0
27 02- 08.7.19 7.9 1.3 2.5 38.3 27.1 63.6 47.3 12.5
28 09- 15.7.19 17.7 2.9 12.7 36.1 26.2 71.7 56.3 8.4
29 16 - 22.7.19 54 10 7 33.3 22.0 83.1 66.0 72.6
30 23- 29.7.19 81.2 19.9 10.1 33.3 22.1 83.6 71.6 86.9
31 30.7 - 05.8.19 96.5 37.7 10.1 34.8 22.9 80.9 65.9 0.0
32 06 - 12.8.19 100 41.5 6.8 36.9 24.7 72.0 56.7 5.2
33 13 - 19.8.19 34.0 21.9 79.3 67.4 39.5
34 20- 26.8.19 35.9 27.2 73.1 59.1 0.0
35 27.8- 02.9.19 36.3 27.4 76.6 59.9 0.0
36 03- 09.9.19 36.1 27.0 80.0 59.1 0.0
37 10 -16.9.19 36.8 27.4 77.7 56.0 0.0
38 17 - 23.9.19 34.5 25.1 78.3 58.3 1.2

F - 42 -
All India Coordinated Cotton Improvement Project – Annual Report (2019 – 20)
CENTRAL ZONE
Table 17: Disease progress in relation to weather factors at Nanded (Maharashtra)
SWM Dates Rain fall
(mm)
Rainy days
Temp (Co) R. H Percentage disease intensity (PDI)
Max. Min. BN AN BLB Alt. G.M. Parawilt Anthracn
ose
1 2 3 4 5 6 7 8 9 10 11
27 2 –8 July 2.4 0 33.0 20.0 68.0 51.7
28 9 – 15 July 20.8 2 35.2 21.6 67.9 58.9
29 16 –22 July 43.6 3 35.4 20.6 72.6 53.7
30 23 – 29 July 51.6 4 31.7 19.7 73.3 73.2
31 30 –5 August 126.4 5 28.8 17.4 77.5 76.5
32 6 –12 August 65.8 3 31.1 18.6 71.3 72.4
33 13 –19 August 53.8 2 30.4 19.0 76.9 75.7 0.2
34 20 – 26 August 45.8 2 31.4 18.6 78.9 63.7 0.9
35 27 –2 Sept. 85.9 3 30.9 19.1 81.6 70.1 1.1
36 3 – 9 Sept. 11.4 3 30.1 17.7 84.0 75.0 0.1 2.9
37 10 –16 Sept. 83.2 4 30.7 19.7 88.3 75.1 0.2 3.5
38 17- 23 Sept. 100.8 4 29.4 17.9 80.9 72.4 0.9 5.7
39 24 – 30 Sept. 40.0 3 31.0 19.0 85.4 79.4 2.0 6.1
40 1 – 7 October 44.0 2 30.9 19.1 81.4 70.0 2.0 7.1
41 8 – 14 October 13.8 1 32.0 19.3 77.6 80.3 2.2 8.3
42 15 –21 October 155.8 3.0 31.3 18.0 79.9 79.4 3.2 9.8
43 22 – 28 October 102.6 5.0 29.4 18.7 85.4 82.3 3.9 10.9 0.00
44 29 Oct 4 Nov. 8.8 1.0 30.6 18.6 86.6 77.1 4.5 12.0 0.00
45 5 – 11 Nov. 2.6 1.0 31.6 18.6 83.1 69.9 5.0 12.4 0.6 0.00
46 12 – 18 Nov. 0.0 0.0 31.3 17.0 83.0 65.7 5.1 11.2 3.6 0.00
47 19 –25 Nov. 0.0 0.0 28.9 16.7 79.3 72.9 6.2 8.2 7.2 0.00
48 26 Nov - 2 Dec. 0.0 0.0 29.3 16.4 75.1 74.4 8.2 6.4 8.6 0.00
49 3 - 9 December 0.0 0.0 28.40 17.5 64.0 66.7 7.5 5.2 10.2 0.00
50 10-16 December 0.0 0.0 30.1 15.3 72.7 65.4 5.5 3.2 10.6 0.00 0.50
51 17-23 December 0.0 0.0 29.60 12.9 79.4 64.3 2.9 1.2 11.6 0.00 0.59
52 24-31 December 0.0 0.0 28.3 13.1 83.5 67.5 1.0 1.0 13.2 0.00 1.20
Annual Rainfall 1165.7 59
Seasonal Rainfall 1150.3 57
Average Rainfall 44.87
(BLB- Bacterial blight, ALT- Alternaria leaf spot, GM- Grey mildew)

F - 43 -
All India Coordinated Cotton Improvement Project – Annual Report (2019 – 20)
Table 18a. Disease progress in relation to weather factorsat Akola(Gujrat).
Met. Week Period Rainy days Rainfall in mm Temperature 0C R. Humidity % Sunshine hours LRA-5166 Bhakti Bt
Max. Min. Morn. Even BSH BLB MLS GM BLB MLS GM
34 20.26 Aug. 3.0 28.5 29.6 20.0 90 76 3.1 - - - - - -
35 27-02 Sept. 3.0 54.5 29.1 19.9 91 72 3.3 - - - - - -
36 03.09 Sept. 1.0 9.0 29.6 20.6 92 77 1.9 - - - - - -
37 10-16 Sept. 3.0 18.0 29.0 19.9 90 75 1.7 - - - - - -
38 17-23 Sept. 4.0 118.1 30.3 19.4 94 70 2.8 6.25 - - 6.25 - -
39 24-30 Sept. 4.0 82.0 30.6 19.5 94 67 4.5 7.92 0.49 - 6.25 0.33 -
40 01-07 Oct. 1.0 6.4 32.3 20.0 90 57 7.6 13.33 1.66 - 14.17 1.23 -
41 08-14 Oct. 0.0 0.0 32.3 17.9 88 48 8.1 17.50 2.18 - 16.67 2.16 -
42 15.21 Oct. 1.0 11.2 30.5 16.5 91 58 5.0 20.42 3.33 - 21.25 3.54 -
43 22.28 Oct. 5.0 67.5 26.8 17.6 95 79 0.7 21.25 4.55 - 22.08 3.33 -
44 29.04 Nov. 1.0 11.8 30.3 18.0 93 61 4.9 17.92 2.10 - 17.50 2.10 -
45 05-11 Nov. 0.0 0.0 31.3 16.4 90 50 7.5 16.25 1.01 0.33 14.17 0.83 0.49
46 12-18 Nov. 0.0 0.0 30.2 11.9 90 40 8.0 16.25 Traces 1.66 17.50 0.66 1.61
47 19-25 Nov. 0.0 0.0 30.3 13.4 89 40 7.9 17.08 - 3.82 15.42 Traces 2.49
48 26.02 Dec. 0.0 0.0 30.3 15.6 90 44 7.2 20.42 - 4.66 19.58 - 3.66
49 03-09 Dec. 0.0 0.0 29.0 14.8 83 37 7.0 14.17 - 3.66 12.50 - 5.45
50 10-16 Dec. 0.0 1.2 29.5 16.6 89 49 5.9 9.58 - 1.66 8.33 - 4.66
51 17-23 Dec. 0.0 0.0 27.2 15.8 90 49 4.1 5.83 - 0.83 4.16 - 3.82
52 24-31 Dec. 2.0 13.0 25.9 13.5 81 47 3.9 2.92 - 0.66 2.50 - 3.33
01 1-7 Jan.20 0.0 0.0 23.1 13.1 89 57 3.6 1.67 - 0.33 0.42 - 2.18
02 8-14 Jan.20 0.0 0.0 26.9 12.2 82 41 6.5 0.0 - 0.33 0.0 - 1.33
Table 18b : Correlation values between weather parameters and bacterial blight of cotton at Akola (MS.) [Correlation coefficient (r)]
Sr. No.
Particulars Rainfall Temperature 0C R.Humidity Sunshine
hours/BSH Max. Mini Morn. Even.
1 LRA-5166 % disease intensity
-0.10705 0.595857* 0.263931 0.433089 0.077425 0.261286
2 Bhakti Bt % disease intensity
-0.07722 0.581562* 0.259372 0.439017 0.116058 0.226757
(‘r’) values : * Significant at 5% 0.482, ** Significant at 1% 0.606
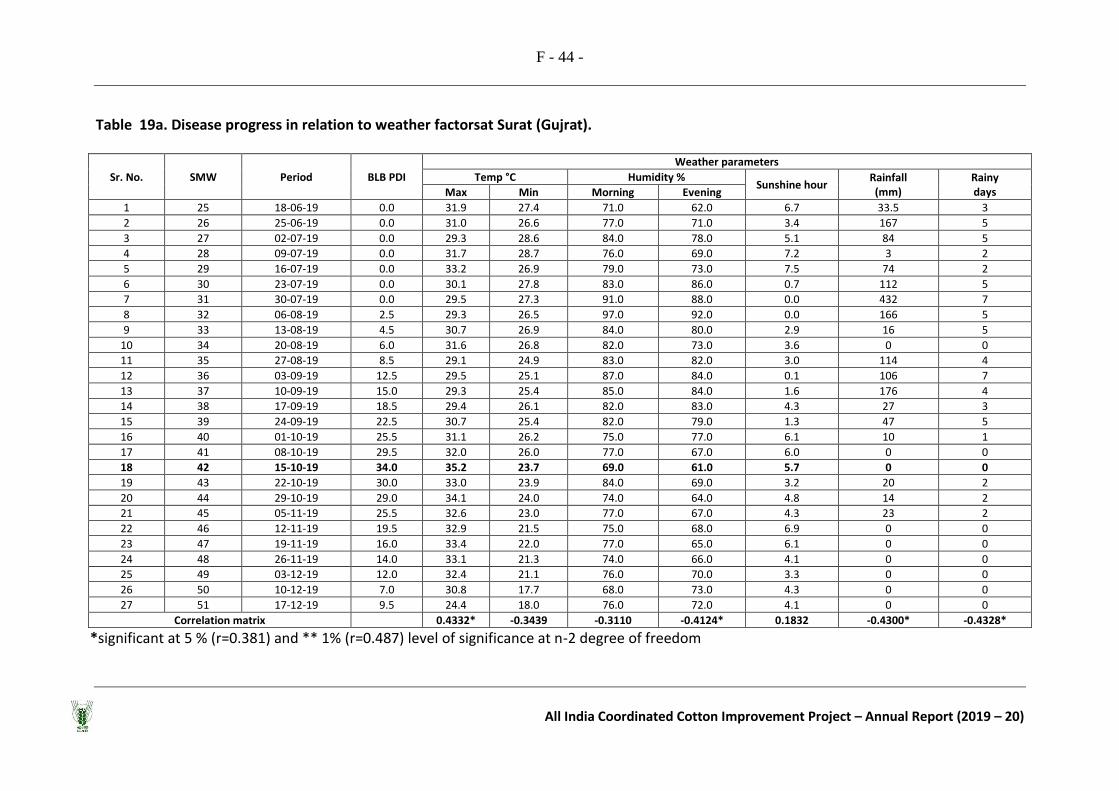
F - 44 -
All India Coordinated Cotton Improvement Project – Annual Report (2019 – 20)
Table 19a. Disease progress in relation to weather factorsat Surat (Gujrat).
Sr. No. SMW Period BLB PDI
Weather parameters
Temp °C Humidity % Sunshine hour
Rainfall (mm)
Rainy days Max Min Morning Evening
1 25 18-06-19 0.0 31.9 27.4 71.0 62.0 6.7 33.5 3
2 26 25-06-19 0.0 31.0 26.6 77.0 71.0 3.4 167 5
3 27 02-07-19 0.0 29.3 28.6 84.0 78.0 5.1 84 5
4 28 09-07-19 0.0 31.7 28.7 76.0 69.0 7.2 3 2
5 29 16-07-19 0.0 33.2 26.9 79.0 73.0 7.5 74 2
6 30 23-07-19 0.0 30.1 27.8 83.0 86.0 0.7 112 5
7 31 30-07-19 0.0 29.5 27.3 91.0 88.0 0.0 432 7
8 32 06-08-19 2.5 29.3 26.5 97.0 92.0 0.0 166 5
9 33 13-08-19 4.5 30.7 26.9 84.0 80.0 2.9 16 5
10 34 20-08-19 6.0 31.6 26.8 82.0 73.0 3.6 0 0
11 35 27-08-19 8.5 29.1 24.9 83.0 82.0 3.0 114 4
12 36 03-09-19 12.5 29.5 25.1 87.0 84.0 0.1 106 7
13 37 10-09-19 15.0 29.3 25.4 85.0 84.0 1.6 176 4
14 38 17-09-19 18.5 29.4 26.1 82.0 83.0 4.3 27 3
15 39 24-09-19 22.5 30.7 25.4 82.0 79.0 1.3 47 5
16 40 01-10-19 25.5 31.1 26.2 75.0 77.0 6.1 10 1
17 41 08-10-19 29.5 32.0 26.0 77.0 67.0 6.0 0 0
18 42 15-10-19 34.0 35.2 23.7 69.0 61.0 5.7 0 0
19 43 22-10-19 30.0 33.0 23.9 84.0 69.0 3.2 20 2
20 44 29-10-19 29.0 34.1 24.0 74.0 64.0 4.8 14 2
21 45 05-11-19 25.5 32.6 23.0 77.0 67.0 4.3 23 2
22 46 12-11-19 19.5 32.9 21.5 75.0 68.0 6.9 0 0
23 47 19-11-19 16.0 33.4 22.0 77.0 65.0 6.1 0 0
24 48 26-11-19 14.0 33.1 21.3 74.0 66.0 4.1 0 0
25 49 03-12-19 12.0 32.4 21.1 76.0 70.0 3.3 0 0
26 50 10-12-19 7.0 30.8 17.7 68.0 73.0 4.3 0 0
27 51 17-12-19 9.5 24.4 18.0 76.0 72.0 4.1 0 0
Correlation matrix 0.4332* -0.3439 -0.3110 -0.4124* 0.1832 -0.4300* -0.4328*
*significant at 5 % (r=0.381) and ** 1% (r=0.487) level of significance at n-2 degree of freedom

F - 45 -
All India Coordinated Cotton Improvement Project – Annual Report (2019 – 20)
Table 20b: Disease progress in relation to weather factorsat Junagarh (Gujrat).
Sr. No Month
Period (2019)
Percent disease incidence (PDI) Temperature ºC Relative Humidity (%) Rain Fall
(mm) No. of Rainy
Days Date Std. Week ALS BLB GM Mean Max.
Mean Min.
M E
1 2 3 4 5 6 7 8 9 10 11 12 13
1 July 30-05 31 0.0 1.0 0.0 28.3 24.9 96.0 95.0 213.3 6
2 Aug 06-12 32 0.0 19.5 0.0 28.9 25.5 96.0 92.0 180.6 4
3 Aug 13-19 33 0.0 17.0 0.0 30.6 25.3 96.0 84.0 22.9 3
4 Aug 20-26 34 0.0 12.0 0.0 32.4 24.8 90.0 73.0 3.9 0
5 Aug 27-02 35 0.0 12.0 0.0 30.9 25.5 96.0 88.0 49.6 4
6 Sept 03-09 36 0.0 9.0 0.0 31.1 25.4 94.0 86.0 248.0 7
7 Sept 10-16 37 0.0 22.0 0.0 29.8 25.3 96.0 85.0 180.5 4
8 Sept 17-23 38 0.0 5.0 0.0 32.6 25.1 89.0 77.0 24.6 2
9 Sept 29-30 39 0.0 5.5 0.0 31.0 24.3 93.0 84.0 196.2 6
10 Oct 01-07 40 5.0 3.0 0.1 32.5 23.9 87.0 65.0 36.8 2
11 Oct 08-14 41 5.5 2.0 0.2 34.9 23.4 80.0 49.0 0.0 0
12 Oct 15-21 42 27.0 2.0 0.8 35.2 22.7 77.0 43.0 1.0 0
13 Oct 22-28 43 8.5 2.0 1.0 32.6 24.8 64.0 52.0 0.0 0
14 Oct 29-04 44 25.0 1.5 4.0 34.0 23.7 80.0 54.0 4.4 1
15 Nov 05-11 45 17.0 1.0 4.0 33.3 22.0 70.0 46.0 0.0 0
16 Nov 12-18 46 2.5 0.5 5.0 32.6 20.3 82.0 51.0 11.2 1
17 Nov 19-25 47 22.5 0.0 6.0 32.5 17.9 80.0 39.0 0.0 0
18 Nov 26-02 48 4.5 0.0 15.0 31.3 19.2 70.0 43.0 0.0 0
19 Dec 03-09 49 0.0 0.0 10.0 31.6 19.4 66.0 44.0 0.0 0
20 Dec 10-16 50 8.5 0.0 8.0 29.5 15.7 74.0 36.0 0.0 0
21 Dec 17-23 51 4.0 0.0 6.9 28.7 14.7 74.0 39.0 0.0 0
22 Dec 24-31 52 3.2 0.0 7.0 28.2 12.6 56.0 32.0 0.0 0
M= Morning, E= Evening,ALS-Alternaria leaf spot, BLB-Bacterial leaf blight &GM-Gray mildew

F - 46 -
All India Coordinated Cotton Improvement Project – Annual Report (2019 – 20)
Table 20(a ) Correlation values between weather parameters and alternaria leaf spot and bacterial leaf blight of cotton at Junagadh [Correlation coefficient(r)]
Sr No Particulars Temperature 0C Relative Humidity (%)
Rainfall mm Rainy Days Maxi Mini Morning Evening
1 Alternaria leaf spot 0.569 0.337 0.237 0.004 0.123 0.398
2 Bacterial leaf blight -0.518 0.679 0.624 0.509 -0.728 0.588
3 Grey mildew -0.576 -0.607 -0.400 -0.540 0.123 0.398
('r') values * Significant at 5 % (P<0.05) : 0.433; ** Significant at 1 % (P<0.01): 0.549

F - 47 -
All India Coordinated Research Project on Cotton - Annual Report (2019 – 20)
SOUTH ZONE Path – 1(b): Observations on the appearance and progress of foliar diseases of cotton in disease trap nursery 2019-20 Table – 21a: Disease progress in relation to weather factorsat Dharwad (Karnataka)
Sl. No
SMW
V1 Abhadita V2 Jayadhar V3 Bunny Bt V4 Dr. Brent Bt Temperature
oC Relative
humidity % Weekly Rainfall (mm)
Av. Rainfall (mm)
Rainy Days
AB BB GM AB GM AB BB GM AB BB GM Max Min Mor (%)
Even (%)
1 31 3.12
(10.14) 0.00
(0.00) 0.00
(0.00) 3.37
(8.91) 0.00
(0.00) 2.77
(9.63) 0.00
(0.00) 0.00
(0.00) 3.97
(11.54) 0.00
(0.00) 0.00
(0.00) 21.4 19.9 93.0 90.4 136.2 19.5 7
2 32 3.12
(10.14) 0.00
(0.00) 0.00
(0.00) 3.98
(11.54) 0.00
(0.00) 3.72
(11.09) 0.00
(0.00) 0.00
(0.00) 4.24
(11.83) 0.00
(0.00) 0.00
(0.00) 24.4 20.1 91.6 92.0 382.0 54.6 6
3 33 4.31
(11.97) 0.00
(0.00) 0.00
(0.00) 4.82
(12.66) 0.00
(0.00) 4.46
(12.25) 0.00
(0.00) 0.00
(0.00) 4.46
(12.25) 0.00
(0.00) 0.00
(0.00) 26.9 20.8 89.1 85.9 17.0 2.4 2
4 34 10.22
(18.63) 0.00
(0.00) 0.00
(0.00) 10.62
(19.00) 0.00
(0.00) 11.11
(19.46) 0.00
(0.00) 0.00
(0.00) 12.50
(20.70) 0.00
(0.00) 0.00
(0.00) 28.2 20.5 85.9 81.6 23.0 3.3 2
5 35 13.98
(21.97) 0.00
(0.00) 0.00
(0.00) 16.09
(23.66) 0.00
(0.00) 15.20
(22.95) 0.00
(0.00) 0.00
(0.00) 16.55
(24.04) 0.00
(0.00) 0.00
(0.00) 27.0 20.7 92.1 82.7 6.4 0.9 1
6 36 17.81
(24.95) 0.00
(0.00) 0.00
(0.00) 27.53
(31.63) 0.00
(0.00) 25.91
(30.59) 0.00
(0.00) 0.00
(0.00) 23.52
(29.00) 0.00
(0.00) 0.00
(0.00) 25.1 20.9 92.0 91.6 44.0 6.3 6
7 37 20.47
(26.92) 7.54
(15.89) 6.89
(15.23) 16.61
(24.04) 5.70
(13.81) 22.38
(28.25) 8.80
(17.26) 7.85
(16.32) 24.54
(29.67) 9.63
(18.05) 9.17
(17.66) 27.7 20.9 90.4 80.1 6.0 0.9 1
8 38 22.07
(28.04) 11.71
(20.00) 9.96
(18.43) 17.25
(24.58) 9.50
(17.95) 22.50
(28.32) 9.37
(17.85) 12.91
(21.05) 21.45
(27.62) 12.50
(20.70) 11.45
(19.82) 27.9 20.8 89.0 86.0 21.2 3.0 2
9 39 24.81
(29.87) 14.31
(22.22) 12.86
(21.05) 17.66
(24.88) 11.64
(19.91) 28.65
(32.39) 17.88
(25.03) 15.57
(23.26) 25.38
(30.26) 17.88
(25.03) 16.34
(23.81) 28.9 20.9 87.3 73.0 34.4 4.9 4
10 40 30.28
(33.40) 21.74
(27.76) 26.01
(30.66) 20.32
(26.78) 18.12
(25.18) 31.09
(33.90) 22.26
(28.18) 21.84
(27.83) 30.48
(33.52) 25.21
(30.13) 24.12
(29.40) 29.5 20.3 91.7 84.7 29.8 4.3 3
11 41 36.23
(36.99) 30.04
(33.21) 30.73
(33.65) 24.67
(29.80) 25.98
(30.66) 37.85
(38.00) 33.33
(35.24) 28.09
(32.01) 38.50
(38.35) 33.00
(35.06) 28.75
(32.46) 29.5 20.3 21.3 78.4 169.8 24.3 4
12 42 38.26
(38.23) 32.14
(34.51) 32.65
(34.88) 28.14
(32.01) 26.11
(30.72) 44.23
(41.67) 37.91
(38.00) 32.96
(35.06) 42.81
(40.86) 40.22
(39.35) 34.77
(36.15) 29.4 21.0 92.4 80.7 157.6 22.5 5
13 43 44.34
(41.73) 36.60
(37.23) 37.20
(37.58) 31.62
(34.20) 29.27
(32.77) 42.40
(40.63) 39.20
(38.76) 39.24
(38.76) 45.51
(42.42) 41.34
(39.99) 39.10
(38.70) 26.6 20.0 90.0 88.1 42.2 6.3 3
14 44 53.81
(47.18) 45.18
(42.25) 49.30
(44.60) 36.25
(37.05) 35.75
(36.75) 53.87
(47.29) 40.49
(39.52) 43.66
(41.38) 48.89
(44.37) 50.73
(45.40) 48.16
(43.97) 29.1 19.5 86.4 73.1 4.0 0.6 1
15 45 58.87
(50.13) 49.19
(44.54) 56.04
(48.45) 35.96
(36.87) 36.47
(37.17) 58.19
(49.72) 50.00
(45.00) 54.09
(47.35) 54.23
(47.41) 53.81
(47.18) 62.28
(52.12) 30.2 19.1 84.9 68.9 21.0 3.0 1
16 46 60.64
(51.12) 53.70
(47.12) 63.42
(52.77) 44.00
(41.55) 44.00
(41.55) 61.32
(51.53) 62.73
(52.36) 54.71 (47.70)
63.88 (53.67)
57.83 (49.49)
65.27 (53.91)
29.5 18.1 77.7 57.4 0.0 0.0 0

F - 48 -
All India Coordinated Cotton Improvement Project – Annual Report (2019 – 20)
Path– 21 (a): Correlation values for foliar diseases of cotton with weather parameters Dharwad (Karnataka) Sl.
no
r’values
weather
parameters
V1 Abhadita V2 Jayadhar V3 Bunny Bt V4 Dr.BrentBt
AB BB GM AB GM AB BB GM AB BB GM
1 Max. Temp 0.687 0.644 0.635 0.610 0.647 0.697 0.643 0.639 0.680 0.654 0.637
2 Min. Temp -0.646 -0.703 -0.749 -0.568 -0.696 -0.587 -0.695 -0.702 -0.612 -0.667 -0.740
3 RH Morning (%) -0.253 -0.286 -0.268 -0.202 -0.318 -0.250 -0.305 -0.250 -0.270 -0.270 -0.233
4 RH Evening (%) -0.749 -0.737 -0.757 -0.678 -0.735 -0.741 -0.760 -0.733 -0.743 -0.725 -0.770
5 Total Rainfall -0.329 -0.214 -0.224 -0.382 -0.202 -0.323 -0.189 -0.224 -0.320 -0.204 -0.236
6 Rainy Days -0.484 -0.427 -0.446 -0.430 -0.416 -0.434 -0.400 -0.431 -0.454 -0.407 -0.453
Critical Values of the Pearson Product-Moment Correlation Coefficient (df:n-2) = 0.497

F - 49 -
All India Coordinated Research Project on Cotton - Annual Report (2019 – 20)
Table 22: Disease progress in relation to weather factors at Guntur (Andhra Pradesh) SMW Month & Date Temperature (0C) Relative Humidity
(%) Rain Fall (mm)
Rainy days
Sun shine hours
Wind speed km/h
Evaporation Per cent Disease Index (PDI)
JadooBG II L 1060
Max Min I II ALS Grey mildew
Rust CoLS
34 20-26 Aug 35.4 25.2 85.6 70.1 57.1 2.0 3.5 8.5 4.8
35 27Aug-2Sept 35.6 26.6 86.6 66.0 20.7 2.0 6.4 8.5 6.5 5.0
36 3-9 Sept 33.8 25.6 88.3 65.4 6.0 0.0 6.2 10.2 3.0 8.0
37 16-Oct 37.0 26.3 86.6 65.3 73.6 2.0 7.9 8.1 3.9 9.3
38 17-23 32.3 24.9 90.6 84.3 81.8 4.0 3.8 7.8 2.7 11.8
39 24-30Sept 35.6 24.9 82.3 52.6 3.0 1.0 6.4 5.4 5.9 12.8
40 Oct.1-7 33.7 25.1 90.3 70.4 5.6 1.0 2.2 2.4 3.5 15.0
41 14-Aug 32.9 25.2 92.0 72.3 61.0 3.0 3.3 2.1 3.7 17.0 4.0
42 15-21 31.5 24.7 94.1 82.9 74.4 3.0 0.0 2.9 3.3 24.5 6.0
43 22-28 31.1 24.4 91.4 83.7 40.6 4.0 2.6 4.7 3.2 30.0 11.3
44 29Oct-4 Nov 31.5 24.8 91.1 74.1 41.0 2.0 4.5 3.5 3.5 24.8 3.0 15.3
45 11-May 33.1 22.4 92.9 72.0 0.0 0.0 6.2 3.5 3.9 22.8 6.5 20.8
46 18-Dec 32.2 23.3 93.4 74.6 0.0 0.0 5.7 3.6 4.5 15.8 10.8 28.8
47 19-25 31.7 22.0 93.3 80.9 0.0 0.0 5.0 4.0 4.2 8.8 15.8 31.3
48 26- 2Dec 31.0 20.7 90.3 84.7 0.0 0.0 4.5 4.5 4.1 5.5 16.8 37.0
49 9-Mar 30.4 19.9 88.7 88.6 1.6 0.0 2.0 3.6 3.5 4.0 23.8 5.6 41.0
50 16-Oct 31.1 18.1 92.4 79.3 0.0 0.0 4.9 3.3 4.1 0.8 25.5 19.3 48.3
51 17-23 31.3 18.0 92.1 80.1 0.0 0.0 4.9 4.2 4.1 0.8 35.5 26.3 40.3
52 24-31Dec 30.7 18.1 90.9 79.6 0.0 0.0 4.5 3.5 4.1 0.8 34.8 30.0 36.3
1 1-7 Jan 29.7 21.0 89.0 84.7 7.6 1.0 2.6 3.6 3.9 29.0 32.3 35.8
2 14-Aug 30.4 18.4 90.3 83.9 0.0 0.0 4.4 5.7 4.2 27.3 33.0 34.8
3 15-21 30.1 18.0 87.9 78.0 0.0 0.0 6.2 5.1 4.4 24.3 35.5 33.8
4 22-28 32.4 19.1 88.9 71.6 0.0 0.0 6.8 3.9 4.7 7.8 44.0 26.0
5 29Jan-4Feb 32.5 20.5 89.0 63.0 0.0 0.0 7.0 4.0 5.3 3.5 25.0 16.3
Note: SMW - Standard Meteorological Week

F - 50 -
All India Coordinated Cotton Improvement Project – Annual Report (2019 – 20)
Table 23: Disease progress in relation to weather factors at Coimbatore (Tamil Nadu)
Std. metrological week
Std Week
No.
Foliar disease Soil borne disease
Bacterial leaf blight Tobacco streak virus Alternaria leaf blight Root rot
CO 14
RCHIIBGII MCU5 CO 14
RCHII BGII MCU5 CO14 RCHII BGII
MCU5 CO14 RCHIIBGII MCU5
Aug10-16 33 0.0 0.0 0.0 0.0 0.0 0.0 0.0 0.0 0.0 0.0 0.0 0.0
17-23 34 0.0 0.0 0.0 0.0 0.0 0.0 0.0 0.0 0.0 0.0 0.0 0.0
24-30 35 0.0 0.0 0.0 0.0 0.0 0.0 0.0 0.0 0.0 0.0 0.0 0.0
Sep 1-7 36 0.0 0.0 0.0 0.0 0.0 0.0 0.0 0.0 0.0 0.0 0.0 0.0
8-14 37 0.0 0.0 0.0 0.0 0.0 0.0 0.0 0.0 0.0 0.0 0.0 0.0
15-21 38 0.0 0.0 0.0 0.0 0.0 0.0 0.0 0.0 0.0 0.0 0.0 0.0
22-28 39 3.0 3.0 3.0 0.0 0.0 0.0 0.0 0.0 0.0 0.0 0.0 0.0
29-Oct5 40 5.0 5.0 5.0 0.0 0.0 0.0 0.0 0.0 0.0 0.0 0.0 0.0
6-12 41 5.0 5.0 5.0 0.0 0.0 0.0 0.0 0.0 0.0 0.0 0.0 0.0
13-19 42 5.0 5.0 5.0 5.0 5.0 5.0 5.0 5.0 5.0 0.0 0.0 0.0
20-26 43 5.0 5.0 5.0 5.0 5.0 5.0 5.0 5.0 5.0 0.0 7.0 7.0
27-Nov2 44 5.0 5.0 5.0 5.0 5.0 5.0 5.0 5.0 5.0 0.0 7.0 7.0
Nov3-9 45 8.0 8.0 8.0 5.0 5.0 5.0 5.0 5.0 5.0 0.0 7.0 7.0
10-16 46 10.0 10.0 10.0 5.0 5.0 5.0 5.0 5.0 5.0 0.0 7.0 7.0
17-23 47 10.0 10.0 10.0 5.0 5.0 5.0 5.0 5.0 5.0 0.0 7.0 7.0
24-30 48 10.0 10.0 10.0 5.0 5.0 5.0 5.0 5.0 5.0 0.0 7.0 7.0
Dec1-7 49 0.0 0.0 0.0 0.0 0.0 0.0 10.0 10.0 10.0 0.0 7.0 7.0
8-14 50 0.0 0.0 0.0 0.0 0.0 0.0 10.0 10.0 10.0 10.0 10.0 10.0
15-21 51 0.0 0.0 0.0 0.0 0.0 0.0 10.0 10.0 10.0 10.0 10.0 10.0
22-28 52 0.0 0.0 0.0 0.0 0.0 0.0 10.0 10.0 10.0 10.0 10.0 10.0
29-Jan4,20 1 0.0 0.0 0.0 0.0 0.0 0.0 10.0 10.0 10.0 10.0 10.0 10.0
5-11 2 0.0 0.0 0.0 0.0 0.0 0.0 10.0 10.0 10.0 10.0 10.0 10.0
12-18 3 0.0 0.0 0.0 0.0 0.0 0.0 10.0 10.0 10.0 10.0 10.0 10.0
19-25 4 0.0 0.0 0.0 0.0 0.0 0.0 10.0 10.0 10.0 10.0 10.0 10.0
26-Feb1 5 0.0 0.0 0.0 0.0 0.0 0.0 10.0 10.0 10.0 10.0 10.0 10.0

F - 51 -
All India Coordinated Research Project on Cotton - Annual Report (2019 – 20)
Path 1c: Studies on the variability in Alternaria causing leaf spot in cotton Table 24: Presence of Alternaria species in cotton leaf spot samples during kharif 2019: RARS Lam S. No.
Date Place (district) Hybrid / variety Presence of Alternaria spores
1 26.09.19 RARS, Lam Jaadoo (Field No 17) Positive 2 26.09.19 RARS, Lam Jaadoo (Field No 12) Positive 3 29.10.19 RARS, Lam NDLH 1938 (Field No 2) Positive 4 29.10.19 RARS, Lam L 1060 (PG trial) Positive 5 29.10.19 RARS, Lam Jadoo (Field No 16) Positive 6 30.10.19 Karempudi (Guntur) RCH 659 Positive 7 30.10.19 Durgi (Guntur) Geetha Positive 8 30.10.19 Gundlapalli (Guntur) Raja Positive 9 15.11.19 Adusumilli (Prakasam) Akira Positive 10 15.11.19 Konikapalli (Prakasam) Jaadoo Positive 11 20.11.19 Tiruvuru (Krishna) Bold Positive 12 05.12.19 Kurnool (Kurnool) Jaadoo Positive 13 05.12.19 Sugur (Kurnool) Bhakthi Positive 14 05.12.19 Rajanagar (Kurnool) Jaadoo Positive 15 05.12.19 Ralladoddi(Kurnool) ATM Positive
Table 25: Morphological studies of Alternaria cultures
Days Mycelial diameter of isolates in cm Coimbatore Guntur Bathinda Junagadh
3 2.1 2.2
2.5 2.2
2.8 3.0
3.8 4.1
2.15 2.35 2.9 3.95 5 4.2
4.0 4.0 4.2
4.5 5.5
6.5 6.0
4.1 4.1 5.0 6.25 7 6.0
5.7 6.5 6.2
6.0 7.0
8.0 8.0
5.85 6.35 6.5 8.0 9 6.7
6.7 7.0 7.0
7.0 7.5
8.5 8.5
6.7 7.0 7.25 8.5

F - 52 -
All India Coordinated Cotton Improvement Project – Annual Report (2019 – 20)
Path 1 (d ) Survey and Epidemiology of TSV
SOUTH ZONE Table-26a: Incidence of TSV on Cotton in farmers’ fields in Guntur during kharif 2019
Month Location (Village/ District)
Hybrid Age/ Stage of the crop (days)
TSV Incidence (%) (BG II)
Aug’19 Gorantla MH 5370 21 0
Crystal 999 21 0
Jonnalagadaa Crystal 999 21 0
Magna 21 0
Atish 21 0
Tatireddypalem Crystal 999 20-Oct 0
Nidumukkala Sadananda 30-Oct 0
Gudipudi Shakthi 28 3
Magna 30 0
Nava Mallika 30 0
Magic 30 0
Bejathpuram RCH 659 30 0
Magna 30 0
Crystal 999 30 0
Damarapalli Nava Mallika 30 Traces
Super Shine 30 0
RCH 659 30 0
Money Maker 30 0
Raja 30 0
Lam RCH 659 7 Traces
Sept.’19 Ramapuram Vennela 90 0
Police 90 0
Super Shine 90 0
Damarapalli Sidda 50 4
Super Shine 50 0
Jaadoo 50 Traces
Raja 50 Traces
Kurnoothala Bhakthi 55 Traces
Money Maker 55 0
Moksha 55 0
Dheeraj 55 0
RCH 659 55 Traces
Abbineniguntapalem Big Boss 55 Traces
Palaparru Super Shine 55 0
Pedanandipadu Jaadoo 55 0
Chilakaluripet Jaadoo 55 Traces
Oct’19 Kakani Bhakthi 55 2
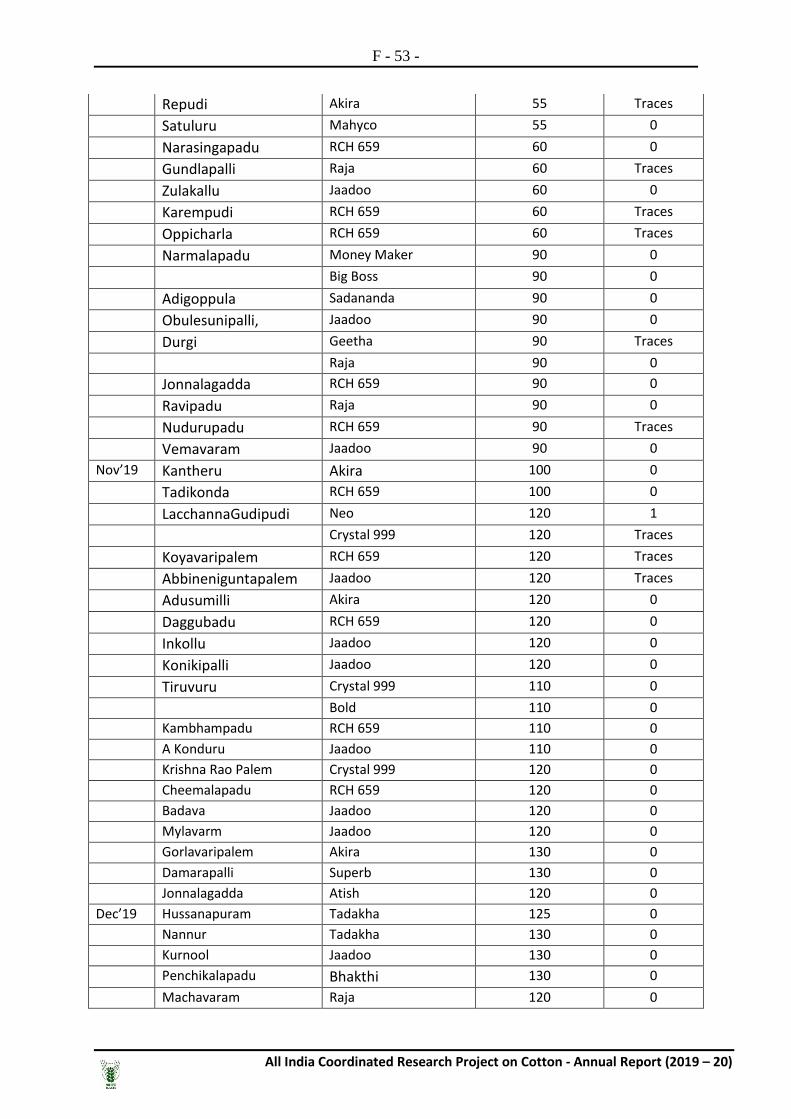
F - 53 -
All India Coordinated Research Project on Cotton - Annual Report (2019 – 20)
Repudi Akira 55 Traces
Satuluru Mahyco 55 0
Narasingapadu RCH 659 60 0
Gundlapalli Raja 60 Traces
Zulakallu Jaadoo 60 0
Karempudi RCH 659 60 Traces
Oppicharla RCH 659 60 Traces
Narmalapadu Money Maker 90 0
Big Boss 90 0
Adigoppula Sadananda 90 0
Obulesunipalli, Jaadoo 90 0
Durgi Geetha 90 Traces
Raja 90 0
Jonnalagadda RCH 659 90 0
Ravipadu Raja 90 0
Nudurupadu RCH 659 90 Traces
Vemavaram Jaadoo 90 0
Nov’19 Kantheru Akira 100 0
Tadikonda RCH 659 100 0
LacchannaGudipudi Neo 120 1
Crystal 999 120 Traces
Koyavaripalem RCH 659 120 Traces
Abbineniguntapalem Jaadoo 120 Traces
Adusumilli Akira 120 0
Daggubadu RCH 659 120 0
Inkollu Jaadoo 120 0
Konikipalli Jaadoo 120 0
Tiruvuru Crystal 999 110 0
Bold 110 0
Kambhampadu RCH 659 110 0
A Konduru Jaadoo 110 0
Krishna Rao Palem Crystal 999 120 0
Cheemalapadu RCH 659 120 0
Badava Jaadoo 120 0
Mylavarm Jaadoo 120 0
Gorlavaripalem Akira 130 0
Damarapalli Superb 130 0
Jonnalagadda Atish 120 0
Dec’19 Hussanapuram Tadakha 125 0
Nannur Tadakha 130 0
Kurnool Jaadoo 130 0
Penchikalapadu Bhakthi 130 0
Machavaram Raja 120 0

F - 54 -
All India Coordinated Cotton Improvement Project – Annual Report (2019 – 20)
Devanakonda Jaadoo 120 0
Asperi ATM 125 0
Virupapuram Jaadoo 125 1
Pandavagallu Bhakthi 130 1
Urukunda Jaadoo 130 0
Rajanagar Jaadoo 125 1
Kosagi ATM 125 1
Chetnihalli Jaadoo 130 2
Sugur Bhakthi 130 0
Yemmiganur Jaadoo 125 0
Ralladoddi ATM 125 0
Gonegandla Jaadoo 125 0
Jan’20 Budampadu Jaadoo 150 0
Raja 150 0
Table 26b: Abstract Month Hybrids (BG II) Incidence of
TSV (%)
Aug-19 MH 5370, Crystal 999, Magna, Atish, Sadananda, Shakthi, Nava Mallika, Magic, RCH 659, Super Shine, Money Maker, Raja
0 to 3.0
Sep-19 Vennela , Police, Super Shine, Sidda, Jaadoo, Raja, Bhakthi, Money Maker, Moksha, Dheeraj, RCH 659, Big Boss,
0 to 4.0
Oct-19 Bhakthi, Akira ,Mahyco, RCH 659, Raja, Jaadoo, Money Maker, Big Boss, Sadananda, Geetha
0 to 2.0
Nov-19 Akira, RCH 659, Neo, Crystal 999, RCH 659, Jaadoo, Bold, Superb, Atish 0 to 1.0
Dec-19 Tadakha, Jaadoo, ATM, Bhakthi, , Raja 0 to 2.0
Jan-20 Jaadoo, Raja 0

F - 55 -
All India Coordinated Research Project on Cotton - Annual Report (2019 – 20)
Table-27 : Progress of TSV incidence (%) and intensity in RCH 2 BG II at RARS, Lam, Guntur during kharif 2019 SMW Month & Date Tobacco Streak Virus Disease
RCH 2 BG II Jaadoo L 1060 (%) PDI (%) PDI (%) PDI
36 3-9 Sept’19 19.7 4.95 23.4 5.86 7.33 1.83 37 16-Oct 17.9 4.49 18.5 4.63 18.3 4.59 38 17-23 23 7.51 18.5 7.41 22.94 5.85 39 24-30 16.1 5.68 18.1 6.58 17.8 4.47 40 Oct.1-7 19.7 6.68 16.4 4.53 15.5 4.01 41 14-Aug 16.8 5.31 13.1 3.29 11.9 3.21 42 15-21 19.7 6.68 17.6 4.42 14.67 3.67 43 22-28 19.04 7.69 18.1 5.76 11.9 2.98 44 29Oct- 4 Nov 23.44 7.88 20.16 6.79 17.88 4.24 45 11-May 17.58 6.14 18.51 6.58 15.59 3.9 46 18-Dec 16.48 5.4 17.28 5.79 14.67 3.67 47 19-25 13.91 3.66 14.81 3.7 11.92 2.98 48 26Nov- 2Dec 14.28 5.22 12.34 3.29 9.6 2.52 49 9-Mar 15.1 5.13 11.1 3.09 9.6 2.41 50 16-Oct 13.91 4.83 10.28 2.88 9.1 2.29 51 17-23 12.82 4.11 9.47 2.78 7.34 1.83 52 24-31 10.32 3.48 8.2 2.47 5.5 1.38 1 1-7Jan’20 9.16 2.29 6.58 1.65 4.59 1.15 2 8-14Jan’20 7.69 1.92 5.56 1.34 4.13 1.03
Table 28: Occurrence of TSV from major cotton growing areas of Coimbatore Tamil Nadu
S. No. Location Area (acres) TSV (%)
1. Madurai (hybrid and variety) 22 -
2. Tirunelvelli (hybrid and variety) 40 -
3. Virudhunagar (hybrid and variety) 35 -
4. Dindigul (Hybrid) 50 5.0
5. Kanathukadavu (Hybrid) 5 5.0-10.0
6. Puttur (Hybrid) 5 5.0-8.0
7. Coimbatore (TNAU) – CO14 (Field no.12) and MCU5 (New area) 5 5.0-10.0

F - 56 -
All India Coordinated Cotton Improvement Project – Annual Report (2019 – 20)
Path. 2(a): Screening of breeding lines for disease reaction NATIONAL TRIALS
Table 29: Br. 02a – Initial Evaluation Trial of G. hirsutum (irrigated)
Entry code
Entry name
Cotton leaf curl disease Bacterial Leaf Blight Fungal foliar leaf spot
Faridkot Bathinda Hisar Sriganganagar Sirsa Faridkot Bathinda Faridkot Bathinda
PDI RE PDI RE PDI RE PDI RE PDI RE GR RE GR RE GR RE GR RE
101 RS 2915 13.6 R 30.0 MR 16.7 R 22.83 MR 28.3 MR 1 R 0 DF 1 R 0 DF
102 F 2685 12.2 R 48.3 S 5.6 HR 33.33 MS 31 MS 1 R 0 DF 1 R 0 DF
103 HS 304 23.9 MR 66.7 HS 16.7 R 46.58 S 43.5 S 1 R 0 DF 2 MR 0 DF
104 LC 13.6 R 48.3 S 14.9 R 22.17 MR 31.5 MS 1 R 0 DF 1 R 0 DF
105 CSH 1715 16.3 R 58.3 HS 23.5 MR 28.83 MR 40.2 S 1 R 0 DF 1 R 0 DF
106 H 1528 15.0 R 43.3 S 8.6 HR 23.83 MR 27.8 MR 1 R 0 DF 1 R 1 R
107 PBH 56 18.0 R 53.3 HS 13.1 R 24.17 MR 29.2 MR 1 R 0-1 R 1 R 1.0-2.0 MR
108 Quality Check (CSH 3129) 16.0 R 50.0 S 15.3 R 24.67 MR 27.1 MR 1 R 0 DF 1 R 0 DF
109 RS 2920 6.7 HR 43.3 S 13.9 R 25.33 MR 27.9 MR 1 R 0 DF 1 R 0 DF
110 F 2720 12.2 R 71.7 HS 12.2 R 26.33 MR 30.2 MS 1 R 0 DF 1 R 0 DF
111 H 1520 16.1 R 70.0 HS 20.1 MR 33.08 MS 41 S 1 R 0 DF 1 R 0 DF
112 CSH 1725 16.8 R 70.0 HS 19.4 R 43.33 S 28.3 MR 1 R 0 DF 1 R 0 DF
113 PBH 86 19.9 R 71.7 HS 21.2 MR 26.33 MR 34.6 MS 2 MR 0-1 R 1 R 1 R
114 ZC (F 2228) 16.1 R 63.3 HS 14.3 R 25.25 MR 33.5 MS 1 R 0 DF 1 R 0 DF
LC LC 41.7 S 1 R
LC RST-9 58.33 HS 1 R
LC GA 35.8 MS 1 R
LC RS2013 35.1 MS
LC F 846(SC) 86.7 HS 1 R 0 DF
LC HS 6(SC) 73.3 HS 1 R 1 R
LC RS 2013(SC) 80 HS 1 R 1 R
LC HS6 45.6 S

F - 57 -
All India Coordinated Research Project on Cotton - Annual Report (2019 – 20)
Table 30: Br. 06 a – Initial Evaluation Trial of Compact genotypes under irrigated condition
Entry code Entry name Cotton leaf curl disease Fungal Foliar Leaf Spots Bacterial Leaf Blight
Faridkot Bathinda Hisar Sriganganagar Bathinda Bathinda
PDI RE PDI RE PDI RE PDI RE GR RE GR RE
121 F 2560 22.92 MR 48.33 S 3.8 HR 28.75 MR 1 R 1 R
122 Local Check 15.00 R 53.33 HS 16.66 R 39.75 MS 1 R 0 DF
123 PBH 78 25.42 MR 86.67 HS 22.21 MR 40.17 S DF R 0 DF
124 RS 2928 12.50 R 43.33 S 11.42 R 20.92 MR 1 R 0 DF
125 ZC (CSH 3075) 19.58 R 51.67 HS 22.21 MR 31.25 MS 1 R 0 DF
126 CSH 100 20.00 R 80.00 HS 16.66 R 27.42 MR DF R 0 DF
127 F 2757 27.50 MR 90.00 HS 29.49 MR 26.08 MR 1 R 0 DF
128 RS 2921 12.92 R 61.67 HS 3.19 HR 20.92 MR 1 R 0 DF
129 H 1563 24.58 MR 86.67 HS 16.66 R 27.25 MR 2 MR 0 DF
LC F 846(SC) 91.67 HS 2 MR 1 R
LC HS 6(SC) 76.62 HS 2 MR 1 R
LC LC HS6 41.65 MS
LC RST-9 57.89 HS

F - 58 -
All India Coordinated Cotton Improvement Project – Annual Report (2019 – 20)
Table 31: Br. 22 a/b Initial Evaluation Trial -G. arboreum
Entry code
Entry name
Root Rot Bacterial blight Fungal foliar leaf spot
Sirsa Faridkot Bathinda Faridkot Bathinda
PDI RE GR RE GR RE GR RE GR RE
131 PBD 88 95.0 S 1 R 0 DF 1 R 0 DF
132 CISA 17 76.8 S 1 R 0 DF 1 R 0 DF
133 LC 92.6 S 1 R 0 DF 1 R 0 DF
134 FDK 298 91.1 S 1 R 1 R 1 R 1 R
135 RG 870 97.8 S 1 R 0 DF 1 R 1 R
136 HD 535 92.4 S 1 R 0 DF 1 R 0 DF
137 CISA 41-1 57.3 S 1 R 1 R 1 R 1.0-2.0 MR
138 ZC (FDK 124) 75.5 S 1 R 0 DF 1 R 1 R
139 FDK 304 78.9 S 1 R 0 DF 1 R 1 R
140 PBD 92 81.6 S 1 R 0 DF 1 R 0 DF
141 RG 868 25.9 MS 1 R 0 DF 1 R 1 R
142 HD 544 44.4 S 1 R 0 DF 1 R 0 DF LC LD 949(LC) 1 R 1.0-2.0 MR
LC CISA 614 73.8 S LC CISA 614 14 MR LC CISA 310 88.5 S LC CISA 614 58.5 S

F - 59 -
All India Coordinated Research Project on Cotton - Annual Report (2019 – 20)
Table 32: Br. 25 a/b Preliminary Hybrid Trial - Desi Hybrid
Entry code Entry Name Fungal Foliar Leaf Spots Bacterial Blight Root rot
Bathinda Bathinda Sirsa
Grade Reaction Grade Reaction PDI Reaction
151 KR 147 0 R 0 R 18.4 MR
152 AJAH 103 0 R 0 R 15.8 MR
153 KR 144 0 R 0 R 4.5 R
154 CISAA 18-3 0-1 R 0-1 R 20.7 MS
155 LC 0 R 0 R 26.2 MS
156 AAH 42 0 R 0-1 R 27.2 MS
157 ZC (KR 64-NZ) 0-1 R 0 R 32.7 MS
158 CISAA 18-4 0 R 0 R 40.4 MS
159 KR 155 0 R 0 R 18.6 MR LC LD 949 (LC) 1-2 R 0-1 R
LC CISA310 24.6 MS
LC CICR 2 6.8 MR

F - 60 -
All India Coordinated Cotton Improvement Project – Annual Report (2019 – 20)
Table 33a. Br. 02a - IET- G. hirsutum (IRRIGATED)
Entry code Entries name Alternaria leaf spot Bacterial leaf blight CLS
Junagarh Surat Coimbatore Guntur Junagarh Surat Coimbatore Guntur Guntur G R G R G R G R G R G R G R G R G R
201 CPD 1902 2 MR 0 DF 1 R 3 MS 1 R 0 DF 1 R 2 MR 3 MS 202 GISV319 3 MS 0 DF 0 DF 2 MR 1 R 0 DF 0 DF 2 MR 2 MR 203 RAH 1047 2 MR 0 DF 0 DF 2 MR 1 R 0 DF 0 DF 1 R 2 MR 204 CCH 19-2 3 MS 0 DF 0 DF 2 MR 2 MR 0 DF 0 DF 2 MR 2 MR 205 BS 8-19 3 MS 0 DF 1 R 2 MR 1 R 0 DF 1 R 2 MR 3 MS 206 CPD 1901 3 MS 0 DF 0 DF 2 MR 1 R 0 DF 1 R 2 MR 3 MS 207 GJHV 557 3 MS 1 R 1 R 2 MR 1 R 0 DF 1 R 2 MR 2 MR 208 ZC (Phule Yamuna/BGDS 1063) 3 MS 1 R 1 R 2 MR 2 MR 0 DF 1 R 3 MS 2 MR 209 TSH 363 3 MS 0 DF 1 R 2 MR 1 R 0 DF 1 R 2 MR 3 MS 210 RB 614 2 MR 0 DF 1 R 2 MR 1 R 0 DF 1 R 2 MR 3 MS 211 GTHV 15/34 2 MR 0 DF 0 DF 3 MS 1 R 0 DF 1 R 1 R 3 MS 212 RHC 1419 2 MR 0 DF 0 DF 2 MR 1 R 0 DF 1 R 2 MR 2 MR 213 GISV 323 2 MR 0 DF 1 R 2 MR 1 R 0 DF 1 R 1 R 2 MR 214 ARBH 1901 3 MS 0 DF 1 R 3 MS 1 R 0 DF 0 DF 2 MR 4 S 215 Quality Check (Suraj) 3 MS 0 DF 1 R 3 MS 1 R 0 DF 0 DF 2 MR 3 MS 216 RAH 1046 3 MS 0 DF 1 R 3 MS 2 MR 0 DF 0 DF 1 R 3 MS 217 BGDS 1047 3 MS 0 DF 1 R 1 R 1 R 0 DF 0 DF 1 R 2 MR 218 RB 615 3 MS 0 DF 1 R 3 MS 1 R 0 DF 1 R 2 MR 2 MR 219 L 1527 3 MS 0 DF 1 R 2 MR 1 R 0 DF 0 DF 2 MR 3 MS 220 BS 7-19 3 MS 0 DF 1 R 2 MR 1 R 0 DF 0 DF 1 R 3 MS 221 SHS 234 2 MR 0 DF 1 R 2 MR 1 R 0 DF 1 R 1 R 3 MS 222 CCH 19-1 3 MS 0 DF 1 R 2 MR 1 R 0 DF 1 R 2 MR 2 MR 223 LC 2 MR 0 DF 1 R 2 MR 1 R 0 DF 1 R 1 R 2 MR 224 TSH 383 3 MS 0 DF 1 R 2 MR 1 R 0 DF 1 R 1 R 2 MR 225 RHC 1409 2 MR 0 DF 1 R 1 R 2 MR 0 DF 1 R 1 R 3 MS 226 GJHV 566 2 MR 0 DF 1 R 1 R 1 R 0 DF 1 R 2 MR 3 MS LC RCH 2 BG II 3 MS 3 MS 2 MR LC Jaadoo BG II 3 MS 2 MR 2 MR LC Check (RCHIIBGII) 1 R 1 R

F - 61 -
All India Coordinated Research Project on Cotton - Annual Report (2019 – 20)
Table 33b. Br. 02a - IET- G. hirsutum (IRRIGATED)
Entry code Entries name
Grey Mildew Rust MLS TSV Root Rot
Junagarh Guntur Guntur Coimbatore Coimbatore Coimbatore
G R G R G R PDI R PDI R PDI R
201 CPD 1902 1 R 3 MS 2 MR 0 DF 0 DF 1 R
202 GISV319 1 R 2 MR 3 MS 0 DF 1 R 0 DF
203 RAH 1047 1 R 3 MS 3 MS 0 DF 0 DF 0 DF
204 CCH 19-2 1 R 1 R 2 MR 0 DF 0 DF 1 R
205 BS 8-19 1 R 2 MR 3 MS 0 DF 1 R 1 R
206 CPD 1901 1 R 2 MR 3 MS 0 DF 1 R 0 DF
207 GJHV 557 1 R 3 MS 3 MS 0 DF 0 DF 0 DF
208 ZC (Phule Yamuna/BGDS 1063) 1 R 3 MS 3 MS 0 DF 0 DF 0 DF
209 TSH 363 1 R 2 MR 3 MS 0 DF 0 DF 0 DF
210 RB 614 1 R 2 MR 3 MS 0 DF 0 DF 0 DF
211 GTHV 15/34 1 R 2 MR 2 MR 0 DF 0 DF 0 DF
212 RHC 1419 1 R 3 MS 3 MS 0 DF 0 DF 0 DF
213 GISV 323 1 R 1 R 3 MS 0 DF 0 DF 1 R
214 ARBH 1901 1 R 3 MS 3 MS 0 DF 0 DF 1 R
215 Quality Check (Suraj) 1 R 2 MR 3 MS 0 DF 0 DF 0 DF
216 RAH 1046 1 R 3 MS 3 MS 0 DF 0 DF 0 DF
217 BGDS 1047 1 R 2 MR 2 MR 0 DF 0 DF 0 DF
218 RB 615 1 R 2 MR 3 MS 0 DF 0 DF 0 DF
219 L 1527 1 R 3 MS 3 MS 0 DF 0 DF 0 DF
220 BS 7-19 1 R 3 MS 3 MS 0 DF 0 DF 0 DF
221 SHS 234 1 R 2 MR 2 MR 0 DF 0 DF 0 DF
222 CCH 19-1 1 R 2 MR 2 MR 1 R 0 DF 0 DF
223 LC 1 R 3 MS 2 MR 1 R 0 DF 0 DF
224 TSH 383 1 R 3 MS 3 MS 1 R 0 DF 0 DF
225 RHC 1409 1 R 2 MR 3 MS 0 DF 0 DF 0 DF
226 GJHV 566 1 R 3 MS 2 MR 0 DF 0 DF 0 DF
LC RCH 2 BG II 1 R 3 MS
LC Jaadoo BG II 3 MS 3 MS
LC Check (RCHIIBGII) 1 R 1 R 1 R

F - 62 -
All India Coordinated Cotton Improvement Project – Annual Report (2019 – 20)
Table 34-Br. 02 b – IET- G. hirsutum (rainfed): Dharwad
Entry Code Entry Name Alternaria leaf spot Bacterial leaf blight Grey Mildew Grade Reaction Grade Reaction Grade Reaction
231 TSH 375 4 S 1 R 4 S 232 GBHV 206 3 MS 1 R 3 MS 233 NH 702 4 S 1 R 4 S 234 ARBH 1951 4 S 2 MR 4 S 235 ZC (NH 615/ NDLH 1938) 4 S 1 R 4 S 236 NDLH 2051-3 4 S 2 MR 4 S 237 BS 8-19 4 S 2 MR 4 S 238 RHC 1419 4 S 3 MS 4 S 239 TVH 007 4 S 4 S 3 MS 240 CNDTS 283 4 S 4 S 3 MS 241 RB 610 3 MS 1 R 3 MS 242 CCH 19-3 4 S 1 R 4 S 243 RAH 1046 2 MR 1 R 2 MR 244 NH 703 4 S 1 R 4 S 245 AKH 2013-2 4 S 1 R 4 S 246 CPD 1951 4 S 1 R 4 S 247 CNH 09-119 4 S 2 MR 3 MS 248 BGDS 1047 4 S 2 MR 4 S 249 CNH 2077 4 S 2 MR 4 S 250 RB 603 4 S 1 R 4 S 251 TSH 356 3 MS 3 MS 4 S 252 GTHV 15/36 4 S 1 R 3 MS 253 RHC 1409 4 S 4 S 3 MS 254 CPD 1952 4 S 4 S 4 S 255 CCH 19-2 4 S 4 S 3 MS 256 CNH 17393 4 S 4 S 3 MS 257 LC 4 S 3 MS 4 S 258 GBHV 209 4 S 1 R 4 S 259 RAH 1045 4 S 2 MR 4 S 260 NDLH 2056-4 4 S 1 R 4 S 261 NH 701 4 S 1 R 4 S 262 BS 7-19 4 S 2 MR 4 S 263 CNH 1134 4 S 2 MR 3 MS 264 Quality Check (Suraj) 4 S 4 S 3 MS LC Jayadhar 4 S 0 DF 4 S LC Abhadita 4 S 4 S 4 S

F - 63 -
All India Coordinated Research Project on Cotton - Annual Report (2019 – 20)
Table35 : Br. 02 a/b CC – IET- G. hirsutum – Coloured Cotton Trial(IRRIGATED / RAINFED)
Entry code
Entry name
Alternaria leaf spot Bacterial leaf blight CLS Grey Mildew Rust
Surat Guntur Surat Guntur Guntur Guntur Guntur
Grade Reac Grade Reac Grade Reac Grade Reac Grade Reac Grade Reac Grade Reac
271 CCHC 19-2 0 DF 2 MR 0 DF 2 MR 2 MR 2 MR 3 MS
272 CNH 18529 0 DF 2 MR 0 DF 1 R 3 MS 2 MR 2 MR
273 ZC (Phule Yamuna/Suraj) 1 R
3 MS 0 DF
2 MR 3 MS 2 MR 2 MR
274 DHCC 1901 0 DF 3 MS 0 DF 1 R 3 MS 2 MR 2 MR
275 CCHC 19-1 0 DF 1 R 0 DF 1 R 2 MR 2 MR 3 MS
276 CNH 18528 0 DF 1 R 0 DF 1 R 3 MS 2 MR 3 MS
277 Local Check 1 R 2 MR 0 DF 1 R 3 MS 2 MR 2 MR
278 DHCC 1902 0 DF 2 MR 1 R 1 R 3 MS 3 MS 2 MR LC RCH 2 BG II - 3 MS - 3 MS 3 MS 1 R 3 MS LC Jaadoo BG II - 3 MS - 2 MR 3 MS 3 MS 3 MS

F - 64 -
All India Coordinated Cotton Improvement Project – Annual Report (2019 – 20)
Table 36: Br. 06 a – IET of Compact genotypes under irrigated condition
Entry code
Entry name
Alternaria leaf spot CLS Grey Mildew Rust Bacterial leaf blight Root Rot MLS
Junagarh Guntur Coimbatore Guntur Junagarh Guntur Guntur Junagarh Guntur Coimbatore Coimbatore Coimbatore
GR RE GR RE GR RE GR RE GR RE GR RE GR RE GR RE GR RE GR RE GR RE GR RE
281 CCH 19-4 3 MS 1 R 1 R 3 MS 1 R 2 MR 2 MR 1 R 1 R 0 DF 0 DF 1 R
282 BS 9-19 3 MS 2 MR 1 R 3 MS 1 R 3 MS 2 MR 1 R 1 R 1 R 0 DF 0 DF
283 RHC-HD 1405 3 MS 2 MR 1 R 3 MS 1 R 2 MR 3 MS 1 R 1 R 0 DF 0 DF 0 DF
284 DSC 1902 3 MS 2 MR 1 R 4 S 1 R 1 R 2 MR 1 R 1 R 0 DF 0 DF 0 DF
285 GTHV 18/17 3 MS 1 R 1 R 3 MS 1 R 3 MS 2 MR 1 R 1 R 0 DF 0 DF 0 DF
286 Local Check 3 MS 1 R 0 DF 3 MS 1 R 2 MR 3 MS 1 R 1 R 1 R 0 DF 0 DF
287 CCH 15-1 3 MS 2 MR 1 R 2 MR 1 R 2 MR 3 MS 1 R 1 R 0 DF 0 DF 0 DF
288 GJHV 584 3 MS 1 R 1 R 2 MR 1 R 2 MR 2 MR 1 R 1 R 0 DF 0 DF 0 DF
289 RAHC 1902 3 MS 2 MR 1 R 3 MS 1 R 2 MR 3 MS 1 R 1 R 0 DF 0 DF 0 DF
290 CCH 19-2 3 MS 2 MR 1 R 3 MS 1 R 1 R 2 MR 1 R 2 MR 0 DF 0 DF 0 DF
291 TCH 1875 3 MS 2 MR 1 R 4 S 1 R 2 MR 2 MR 1 R 1 R 0 DF 0 DF 0 DF
292 Common Check (Suraj)
3 MS 2 MR 1 R 3 MS 1 R 2 MR 2 MR 1 R 2 MR 0 DF 1 R 0 DF
293 DSC 1901 2 MR 2 MR 1 R 2 MR 1 R 2 MR 3 MS 1 R 1 R 1 R 0 DF 0 DF
294 RAHC 1901 2 MR 1 R 1 R 3 MS 1 R 2 MR 3 MS 2 MR 1 R 0 DF 0 DF 0 DF
295 RHC-HD 1312 3 MR 2 MR 1 R 3 MS 1 R 2 MR 3 MS 2 MR 2 MR 1 R 0 DF 0 DF
LC RCH 2 BG II 3 MS 1 R 3 MS 1 R 3 MS 3 MS 1 R 0 DF 0 DF
LC Jaadoo BG II 3 MS 3 MS 3 MS 3 MS 2 MR

F - 65 -
All India Coordinated Research Project on Cotton - Annual Report (2019 – 20)
Table 37. Br. 06 b – Initial Evaluation of Compact genotypes under rainfed condition
Entry code Entry Name Alternaria leaf spot Bacterial leaf blight Grey Mildew
Grade Reaction Grade Reaction Grade Reaction
301 RAHC 1901 4 S 4 S 4 S
302 TCH 002 4 S 2 MR 4 S
303 GBHV 187 2 MR 1 R 3 MS
304 CNH 09-77 4 S 1 R 4 S
305 RHC-HD 1312 2 MR 4 S 4 S
306 CCH 15-1 4 S 3 MS 4 S
307 DSC 1951 4 S 3 MS 4 S
308 Common Check (Suraj) 4 S 4 S 4 S
309 CNH 1133 4 S 1 R 4 S
310 CCH 19-4 4 S 4 S 4 S
311 CNH 2046 4 S 1 R 4 S
312 RHC-HD 1405 4 S 4 S 3 MS
313 GTHV 18/19 4 S 4 S 4 S
314 CNH 1132 4 S 4 S 4 S
315 Local Check 4 S 3 MS 4 S
316 CNDTS 44 4 S 3 MS 3 MS
317 DSC 1952 2 MR 3 MS 4 S
318 CNH 09-45 4 S 4 S 4 S
319 RAHC 1902 4 S 4 S 4 S
320 CCH 19-5 4 S 4 S 4 S
LC Jayadhar 4 S 0 DF 4 S
LC Abhadita 4 S 4 S 4 S

F - 66 -
All India Coordinated Cotton Improvement Project – Annual Report (2019 – 20)
Table 38: Br. 12a IET of G. barbadense under irrigated condition
Entry code
Entries
Alternaria leaf spot CLS Grey Mildew Rust Bacterial leaf blight
Surat Guntur Coimb Dharwad Guntur Dharwad Guntur Guntur Surat Guntur Coimb Dharwad
GR RE GR RE GR RE GR RE GR RE GR RE GR RE GR RE GR RE GR RE GR RE GR RE
321 SBSD 5-6 0 DF 1 R 1 R 4 S 1 R 0 DF 0 DF 1 R 1 R 1 R 0 DF 4 S
322 CCB 64B 0 DF 1 R 0 DF 4 S 2 MR 0 DF 0 DF 2 MR 1 R 1 R 0 DF 1 R
323 DB 1901 0 DF 1 R 1 R 2 MR 2 MR 0 DF 0 DF 2 MR 1 R 1 R 1 R 2 MR
324
ZC (Phule Rukhmai-CZ &Suvin-SZ)
0 DF 1 R 1 R 4 S 2 MR 0 DF 0 DF 2 MR 1 R 1 R 0 DF 4 S
325 CCB 142 0 DF 1 R 1 R 4 S 2 MR 0 DF 0 DF 2 MR 2 MR 1 R 1 R 4 S
326 CCB 141 0 DF 1 R 1 R 2 MR 2 MR 0 DF 0 DF 2 MR 3 MS 1 R 1 R 2 MR
LC RCH 2 BG II
2 MR - - 3 MS - 1 R 3 MS 3 MS - -
LC Jadoo BG II
2 MR - - 3 MS - 3 MS 3 MS 2 MR - -
LC Jayadhar - - 4 S - 4 S - - - - 0 DF
LC Abhadita - - 4 S - 4 S - - - - 4 S
LC RCHIIBGII 1 R - - - - - - 1 R -

F - 67 -
All India Coordinated Research Project on Cotton - Annual Report (2019 – 20)
Table 39:Br. 15 a - PHT- Interspecific -Hybrid (hir x barb)
Entry code
Entry name
Alternaria leaf spot CLS Grey Mildew Rust Bacterial leaf blight TSV
Guntur Dharwad Coimb Guntur Guntur Dharwad Guntur Guntur Dharwad Coimb Coimb
GR RE GR RE GR RE GR RE GR RE GR RE GR RE GR RE GR RE GR RE GR RE
331 DHB 1902 1 R 4 S 1 R 2 MR 0 DF 1 R 3 MS 1 R 4 S 0 DF 1 R
332 RHB 1401 1 R 2 MR 1 R 2 MR 1 R 2 MR 3 MS 1 R 2 MR 0 DF 1 R
333 LC 2 MR 4 S 1 R 2 MR 0 DF 2 MR 3 MS 2 MR 2 MR 0 DF 0 DF
334 DHB 1901 2 MR 2 MR 1 R 1 R 0 DF 1 R 3 MS 3 MS 4 S 0 DF 1 R
335 Phule Dhara (CC)
1 R 4 S 0 DF 1 R 0 DF 1 R 3 MS 3 MS 4 S 0 DF 0 DF
336 LAHB 2 1 R 2 MR 1 R 2 MR 1 R 1 R 3 MS 3 MS 1 R 0 DF 1 R LC RCH 2 BG II 3 MS - 3 MS 1 R - 3 MS 3 MS -
LC Jaadoo BG II
3 MS - 3 MS 3 MS - 3 MS 2 MR -
LC Jayadhar 4 S - - 4 S - - 0 DF
LC Abhadita 4 S - - 4 S - - 4 S
LC RCHIIBGII 1 R 1 R 0 DF

F - 68 -
All India Coordinated Cotton Improvement Project – Annual Report (2019 – 20)
Table 40.Br. 22 a/b IET-G. arboreum: Dharwad
Entry code
Entry name Alternaria leaf spot Bacterial leaf blight Grey Mildew
Grade Reaction Grade Reaction Grade Reaction 341 DWDA 1902 4 S 0 DF 4 S 342 CNA 2036 4 S 0 DF 4 S 343 CNA 2037 4 S 0 DF 4 S 344 NDLA 3116-3 2 MR 0 DF 2 MR 345 JLA 1102 4 S 0 DF 3 MS 346 ZC (AKA 7/DLSa 17) 4 S 0 DF 2 MR 347 PA 863 2 MR 0 DF 2 MR 348 MDL 2689 2 MR 0 DF 2 MR 349 GAM 267 4 S 0 DF 2 MR 350 CNA 1042 3 MS 0 DF 2 MR 351 NDLA 3104-4 4 S 0 DF 3 MS 352 LC 4 S 0 DF 2 MR 353 JLA 1313 4 S 0 DF 4 S 354 GAM 273 4 S 0 DF 4 S 355 PA 860 2 MR 0 DF 4 S 356 MDL 2679 4 S 0 DF 4 S 357 AKA 2013-8 4 S 0 DF 4 S 358 CNA 2035 4 S 0 DF 4 S 359 DWDA 1901 4 S 0 DF 2 MR
LC Jayadhar 4 S 0 DF 4 S
LC Abhadita 4 S 4 S 4 S
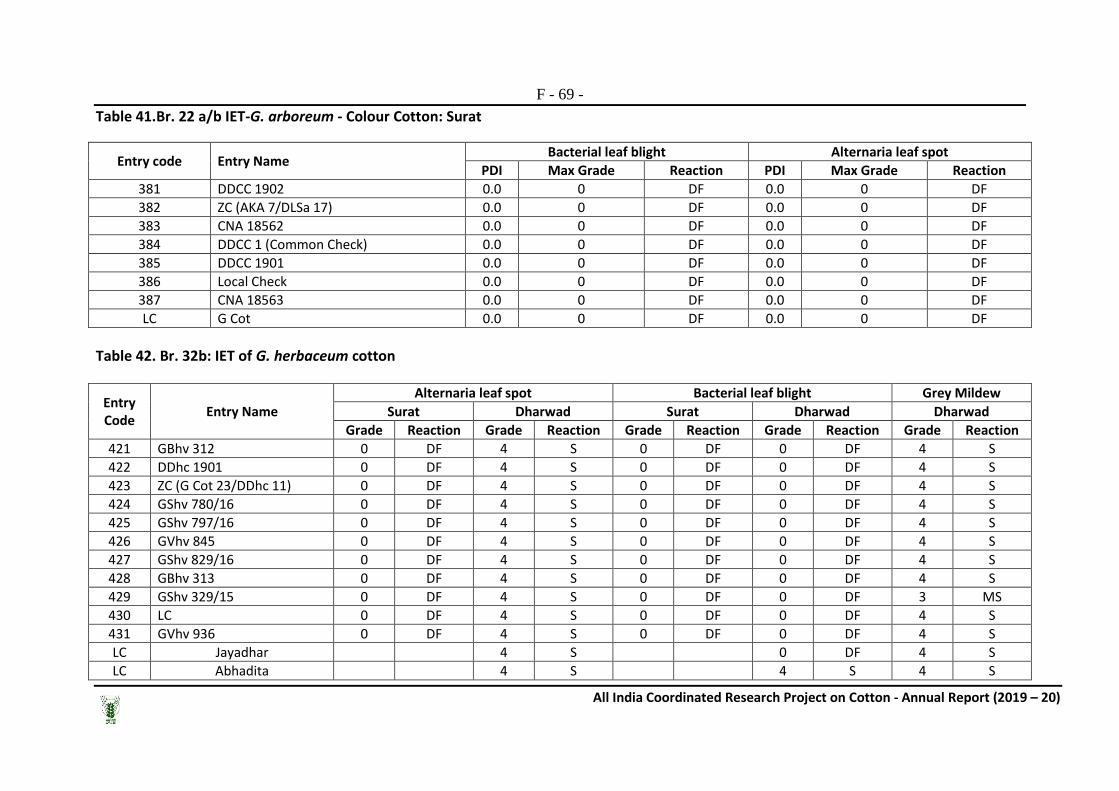
F - 69 -
All India Coordinated Research Project on Cotton - Annual Report (2019 – 20)
Table 41.Br. 22 a/b IET-G. arboreum - Colour Cotton: Surat
Entry code Entry Name Bacterial leaf blight Alternaria leaf spot
PDI Max Grade Reaction PDI Max Grade Reaction 381 DDCC 1902 0.0 0 DF 0.0 0 DF 382 ZC (AKA 7/DLSa 17) 0.0 0 DF 0.0 0 DF 383 CNA 18562 0.0 0 DF 0.0 0 DF 384 DDCC 1 (Common Check) 0.0 0 DF 0.0 0 DF 385 DDCC 1901 0.0 0 DF 0.0 0 DF 386 Local Check 0.0 0 DF 0.0 0 DF 387 CNA 18563 0.0 0 DF 0.0 0 DF LC G Cot 0.0 0 DF 0.0 0 DF
Table 42. Br. 32b: IET of G. herbaceum cotton
Entry Code
Entry Name Alternaria leaf spot Bacterial leaf blight Grey Mildew
Surat Dharwad Surat Dharwad Dharwad Grade Reaction Grade Reaction Grade Reaction Grade Reaction Grade Reaction
421 GBhv 312 0 DF 4 S 0 DF 0 DF 4 S 422 DDhc 1901 0 DF 4 S 0 DF 0 DF 4 S 423 ZC (G Cot 23/DDhc 11) 0 DF 4 S 0 DF 0 DF 4 S 424 GShv 780/16 0 DF 4 S 0 DF 0 DF 4 S 425 GShv 797/16 0 DF 4 S 0 DF 0 DF 4 S 426 GVhv 845 0 DF 4 S 0 DF 0 DF 4 S 427 GShv 829/16 0 DF 4 S 0 DF 0 DF 4 S 428 GBhv 313 0 DF 4 S 0 DF 0 DF 4 S 429 GShv 329/15 0 DF 4 S 0 DF 0 DF 3 MS 430 LC 0 DF 4 S 0 DF 0 DF 4 S 431 GVhv 936 0 DF 4 S 0 DF 0 DF 4 S LC Jayadhar 4 S 0 DF 4 S LC Abhadita 4 S 4 S 4 S

F - 70 -
All India Coordinated Cotton Improvement Project – Annual Report (2019 – 20)
ZONAL TRIAL: NORTH ZONE
Table 43: Br-04 a – Coordinated Variety trial of G. hirsutum
Entry code Entry Name
Cotton leaf curl disease Bacterial blight Fungal foliar leaf spot
Faridkot Bathinda Hisar Sriganganagar Faridkot Bathinda Faridkot Bathinda
PDI RE PDI RE PDI RE PDI RE GR RE GR RE GR RE GR RE
9001 F 2596 16.15 R 40.00 S 13.88 R 32.92 MS 2 MR 0 DF 1 R 0 DF
9002 ZC (F 2228) 14.22 R 70.00 HS 16.66 R 31.25 MS 2 MR 0 DF 1 R 0 DF
9003 PBH 116 17.19 R 69.17 HS 22.21 MR 38.00 MS 1 R 1 R 1 R 1 R
9004 LC 15.63 R 67.50 HS 12.66 R 37.83 MS 2 MR 0 DF 1 R 0 DF
9005 F 2662 15.69 R 75.83 HS 11.42 R 28.33 MR 2 MR 0 DF 1 R 0 DF
9006 Quality Check (CSH 3129) 17.78 R 72.50 HS 16.66 R 36.00 MS 1 R 0 DF 1 R 0 DF
LC F 846 (SC) 84.17 HS 41.65 S 1 R 1 R
LC HS 6 (SC) 87.50 HS 0 DF 1 R
LC RST-9(SC) 89.17 HS 1 R 1 R
LC RS 2013 (SC) 69.17 HS 1 R 1.0-2.0 MR
LC LC HS 6 41.65
LC RST-9 60.25 HS

F - 71 -
All India Coordinated Research Project on Cotton - Annual Report (2019 – 20)
Table 44: Br-06a - Coordinated Variety trial of compact G. hirsutum
Entry code Entry Name
Cotton leaf curl disease Fungal Foliar Leaf Spots Bacterial Leaf Blight
Faridkot Bathinda Hisar Sriganganagar Sirsa Bathinda Bathinda
PDI RE PDI RE PDI RE PDI RE PDI
RE GR RE GR RE
9011 RS 2914 3.75 HR 71.67 HS 11.42 R 26.92 MR 36.9 MS 0 DF 0 DF
9012 PBH 115 20 R 89.17 HS 2.68 HR 29.00 MR 33.2 MS 1 R 0 DF
9013 Zonal Check (CSH3075) 14.58 R 82.5 HS 15.44 R 32.75 MS 30.4 MS 0 DF 0 DF
9014 H 1530 22.92 MR 85.83 HS 14.33 R 26.50 MR 31.7 MS 0 DF 0 DF
9015 RS 2913 9.17 HR 72.5 HS 14.66 R 28.42 MR 41.2 S 1 R 1 R
9016 Local Check 17.5 R 80.83 HS 14.55 R 41.00 S 41.0 S 0 DF 0 DF
9017 PBH 174 14.58 R 82.5 HS 13.05 R 24.17 MR 31.7 MS 1 R 0 DF
LC F 846 (SC) 96.67 HS 1 R 1 R
LC RS 2013 (SC) 77.5 HS 38.0 MS 1 R 1 R
LC LC HS6 41.65 MS 49.2 S
LC RST-9 55.26 HS
LC MRC 7017 N BT 44.2 S
LC GA 35.3 MS

F - 72 -
All India Coordinated Cotton Improvement Project – Annual Report (2019 – 20)
Table 45: Br-24 a - Coordinated Variety trial of G. arboreum
Entries code
Entry Name Root rot Bacterial blight Fungal foliar leaf spot
Sirsa Faridkot Bathinda Faridkot Bathinda PDI RE GR RE GR RE GR RE GR RE
9021 PBD 22 31.0 MS 1 R 1 R 1 R 1 R 9022 CISA 10 36.5 MS 1 R 1 R 1 R 0 DF 9023 FDK 124 (ZC) 54.6 S 1 R 1 R 1 R 0 DF 9024 PBD 35 49.3 S 1 R DF R 1 R 0 DF 9025 FDK 281 18.7 MR 1 R DF R 1 R 0 DF 9026 Local Check 14.4 MR 1 R 1 R 1 R 0 DF 9027 PBD 36 32.5 MS 1 R 1 R 1 R 1 R
LC LD 949 1.0-2.0 MR 1 R
Table 46: Br-25 a Coordinated Desi Hybrid trial
Entries code
Entries Root Rot Bacterial blight Fungal foliar leaf spot
Sirsa Faridkot Bathinda Faridkot Bathinda PDI RE GR RE GR RE GR RE GR RE
9031 KR 139 43.2 S 1 R 0 DF 1 R 0 DF 9032 Zonal Check (KR 64) 31.0 MS 1 R 1 R 1 R 1 R 9033 KR 133 41.4 S 1 R 0 DF 1 R 0 DF 9034 CISAA 18-1 12.7 R 1 R 0 DF 1 R 1 R 9035 Local Check 37.1 MS 1 R 1 R 1 R 1 R 9036 KR 136 25.9 MR 1 R 0 DF 1 R 0 DF
LC HD123 33.3 MS LC CISA614 47.3 S LC FDK 124 73.3 HS LC CISA614 49.5 S LC LD 949 (LC) 0-1 R 1.0-2.00 MR

F - 73 -
All India Coordinated Research Project on Cotton - Annual Report (2019 – 20)
ZONAL TRAIL: CENTRAL ZONE
Table 47:Br. 03 (a) Preliminary Varietal Trial (PVT) of G. hirsutum – Irrigated
Entry code
Entry Name Alternaria leaf spot Bacterial leaf blight Grey Mildew
Junagarh Surat Junagarh Surat Junagarh Grade Reaction Grade Reaction Grade Reaction Grade Reaction Grade Reaction
9101 TSH 367 3 MS 0 DF 1 R 1 R 1 R 9102 SHS 113 3 MS 0 DF 1 R 1 R 1 R 9103 ZC (Phule Yamuna) 3 MS 0 DF 1 R 0 DF 1 R 9104 GJHV-522 3 MS 0 DF 2 MR 1 R 1 R 9105 LC 2 MR 0 DF 1 R 0 DF 1 R 9106 F 2662 3 MS 0 DF 3 MS 1 R 1 R 9107 RAH 1076 3 MS 0 DF 2 MR 1 R 1 R 9108 GJHV-554 3 MS 0 DF 2 MR 1 R 1 R 9109 Quality Check (Suraj) 3 MS 0 DF 1 R 1 R 1 R
Table 48: Br. 04 (a) Co-ordinated Varietal Trial (CVT) of G. hirsutum – Irrigated
Entry code Entry Name Alternaria leaf spot Bacterial leaf blight Grey Mildew Junagarh Surat Junagarh Surat Junagarh
Grade Reaction Grade Reaction Grade Reaction Grade Reaction Grade Reaction 9111 TCH 1828 3 MS 0 DF 2 MR 1 R 1 R 9112 Quality Check (Suraj) 3 MS 0 DF 1 R 1 R 1 R 9113 RAH 1071 3 MS 0 DF 2 MR 1 R 1 R 9114 ZC (Phule Yamuna) 3 MS 0 DF 1 R 0 DF 1 R 9115 CPD-1501 3 MS 1 R 1 R 1 R 1 R 9116 LC 3 MS 0 DF 2 MR 0 DF 1 R 9117 SIMA 5 3 MS 0 DF 2 MR 1 R 1 R

F - 74 -
All India Coordinated Cotton Improvement Project – Annual Report (2019 – 20)
Table 49: Br. 05 (a) Co-ordinated Hybrid Trial (CHT) of G. hirsutum – Irrigated)
Entry code
Entry name
Alternaria leaf spot Bacterial leaf blight Grey Mildew
Surat Junagarh Surat Junagarh Junagarh
Grade Reaction Grade Reaction Grade Reaction Grade Reaction Grade Reaction
9121 ZC (Phule Asmita) 1 R 4 S 0 DF 2 MR 1 R
9122 GSHH 15032 0 DF 3 MS 0 DF 1 R 1 R
9123 LC 0 DF 3 MS 1 R 4 S 1 R
9124 GJHH 13 0 DF 2 MR 0 DF 2 MR 1 R
Table 50: 6 (a)- Zonal trial (Junagarh)
Entry code
Entries Alternaria leaf spot Bacterial leaf blight Grey Mildew
Grade Reaction Grade Reaction Grade Reaction 9131 GJHV 534 3 MS 1 R 1 R
9132 RHC-HD 1438 3 MS 1 R 1 R
9133 Local Check 3 MS 1 R 1 R
9134 SHC 374 3 MS 1 R 1 R
9135 DS C 1801 3 MS 1 R 1 R
9136 RHC HD 1420 3 MS 1 R 1 R
9137 Zonal check (Suraj) Missing Missing
9138 RHC HD 1406 3 MS 1 R 1 R
9139 TCH 1897 3 MS 1 R 1 R

F - 75 -
All India Coordinated Research Project on Cotton - Annual Report (2019 – 20)
Table 51: Br.03b P.V.T of G. hirsutum cotton
Entry Code Entry name
ALS MLS BLB GM Anthracnose Wilt
Nanded Bharuch Akola Akola Nanded Bharuch Akola Nanded Nanded Bharuch
GR RE GR RE GR RE GR RE GR RE GR RE GR RE GR RE GR RE GR RE
9171 BS 3-17 2 MR 0 DF 2 MR 2 MR 2 MR 1 R 2 MR 2 MR 0 DF 0 DF
9172 RAH 1075 3 MS 1 R 3 MS 1 R 1 R 1 R 1 R 1 R 0 DF 0 DF
9173 CPD-1751 2 MR 0 DF 2 MR 2 MR 2 MR 0 DF 2 MR 2 MR 0 DF 0 DF
9174 LC 3 MS 0 DF 3 MS 2 MR 2 MR 0 DF 1 R 1 R 0 DF 0 DF
9175 NH 704 3 MS 1 R 3 MS 2 MR 2 MR 1 R 2 MR 2 MR 0 DF 0 DF
9176 NDLH – 2035-5 2 MR 1 R 2 MR 2 MR 2 MR 1 R 2 MR 2 MR 0 DF 0 DF
9177 CPD-1752 3 MS 0 DF 3 MS 1 R 1 R 0 DF 2 MR 2 MR 0 DF 0 DF
9178 Quality Check (Suraj)
2 MR 0 DF 2 MR 2 MR 2 MR 0 DF 3 MS 3 MS 0 DF 0 DF
9179 AKH 10-3 1 R 0 DF 1 R 2 MR 2 MR 0 DF 2 MR 2 MR 0 DF 0 DF
9180 NDLH – 2057-1 3 MS 0 DF 3 MS 2 MR 2 MR 1 R 3 MS 3 MS 0 DF 0 DF
9181 ZC (NH 615) 1 R 1 R 1 R 1 R 1 R 2 MR 2 MR 2 MR 0 DF 0 DF
9182 RHC 1307 2 MR 1 R 2 MR 2 MR 2 MR 2 MR 2 MR 2 MR 0 DF 0 DF
LC LRA5166 2 MR 4 S 2 MR

F - 76 -
All India Coordinated Cotton Improvement Project – Annual Report (2019 – 20)
Table 52:Br.04bPromoted entries CZ
Entry Code Entry name Alternaria leaf spot Bacterial leaf blight Grey Mildew Anthracnose MLS Wilt
Nanded Bharuch Akola Nanded Bharuch Akola Nanded Nanded Akola Bharuch GR RE GR RE GR RE GR RE GR RE GR RE GR RE GR RE GR RE GR RE
9191 ZC (NH 615) 2 MR 1 R 1 R 2 MR 1 R 1 R 2 MR 1 R 1 R 0 DF 9192 NDLH 20511 3 MS 0 DF 1 R 3 MS 0 DF 2 MR 2 MR 1 R 1 R 0 DF 9193 Local Check 2 MR 0 DF 2 MR 2 MR 0 DF 1 R 3 MS 0 DF 1 R 0 DF 9194 CNH 11-11 2 MR 1 R 1 R 2 MR 1 R 1 R 2 MR 0 DF 1 R 0 DF 9195 Quality Check (Suraj) 1 R 0 DF 1 R 2 MR 1 R 1 R 3 MS 0 DF 2 MR 0 DF
LC LRA5166 3 MS 2 MR 3 MS 3 MS 3 MS 2 MR 3 MS 1 R 1 R 0 DF LC 1027 ALF - 0 DF - 0 DF - - 0 DF LC Digvijay - 0 DF - 0 DF - - 0 DF
Table 53: Br. 06 (b) : Coordinated hybrid trial of compact G. hirsutum genotype
Entry Code
Entry name
Bacterial leaf blight Alternaria leaf spot MLS Grey Mildew
Surat Akola Surat Akola Akola
Grade Reaction Grade Reaction Grade Reaction Grade Reaction Grade Reaction
9201 AKH 1302 1 R 1 R 0 DF 1 R 1 R
9202 DSC 1851 1 R 1 R 0 DF 1 R 1 R
9203 RHC HD 1433 1 R 2 MR 0 DF 1 R 1 R
9204 Local Check 1 R 1 R 0 DF 1 R 2 MR
9205 RAHC 1029 0 DF 2 MR 1 R 1 R 1 R
9206 AKH 1301 0 DF 1 R 0 DF 1 R 1 R
9207 GISV 312 0 DF 1 R 0 DF 1 R 1 R
9208 ZC (Suraj) 1 R 1 R 0 DF 1 R 1 R
9209 RHC HD 1406 1 R 3 MS 0 DF 1 R 2 MR
LC LRA 5166 (Ch) 4 S 1 R 2 MR

F - 77 -
All India Coordinated Research Project on Cotton - Annual Report (2019 – 20)
Table 54: Br. 24 (b) CVT: Coordinated varietal trial G.arboreum cotton: Akola Entry Code Entry Name Bacterial leaf blight Mycrothecium leaf spot Grey mildew
Grade Reaction Grade Reaction Grade Reaction
9221 CNA 1054 1 R 1 R 1 R
9222 AKA 14-51 1 R 1 R 1 R
9223 MDL 2667 1 R 1 R 2 MR
9224 MDL 2663 1 R 1 R 1 R
9225 LC 1 R 1 R 1 R
9226 JLA-1207 1 R 1 R 2 MR
9227 GAM 259 1 R 1 R 1 R
9228 ZC (AKA 7) 1 R 1 R 1 R
9229 DWDa 1802 1 R 1 R 1 R
9230 CNA 1031 1 R 1 R 2 MR
LC AKA-8 (Ch) 1 R 2 MR 2 MR
Table 55: Br. 24 (b)LL : Coordinated varietal trial G. arboreum cotton (LL) : Akola Entry Code Entry Name Bacterial leaf blight Mycrothecium leaf spot Grey mildew
Grade Reaction Grade Reaction Grade Reaction
9231 PA 809 1 R 1 R 1 R
9232 PA 842 1 R 1 R 1 R
9233 PAIG 379 1 R 1 R 2 MR
9234 PAIG 380 1 R 1 R 1 R
9235 PAIG 384 1 R 1 R 1 R
9236 PA 806 1 R 1 R 1 R
9237 PAIG 377 1 R 1 R 1 R
9238 PA 839 1 R 1 R 2 MR
9239 PA 837 1 R 1 R 1 R
9240 PAIG 373 1 R 1 R 1 R
9241 QC (PA 255) 1 R 1 R 1 R
9242 CNA 1065 1 R 1 R 1 R
LC AKA-8 (Ch) 2 MR 2 MR 2 MR

F - 78 -
All India Coordinated Cotton Improvement Project – Annual Report (2019 – 20)
Table 56: Br.25 (b) : Coordinated hybrid trial G.arboreum: Akola
Entry Code Entry Name Bacterial leaf blight Mycrothecium leaf spot Grey mildew
Grade Reaction Grade Reaction Grade Reaction
9251 AJCH 102 1 R 1 R 1 R
9252 NACH 560 1 R 1 R 1 R
9253 LC 1 R 1 R 1 R
9254 NACH 556 1 R 1 R 1 R
9255 PKV DH 1 (ZC) 1 R 1 R 1 R
LC AKA-8 (Ch) 2 MR 2 MR 2 MR
Table 57:G. hirsutumcolourcotton trial: Surat
Entry Code Entry Name Alternaria leaf spot Bacterial leaf blight
PDI Reaction PDI Reaction
9261 Phule Yamuna(Zonal Check) 0.0 DF 2.0 R
9262 LHCC 4 0.0 DF 2.5 R
9263 Local Check 0.0 DF 6.5 R
9264 DHCC 1801 0.0 DF 0.0 DF
9265 CNH 17395 0.0 DF 0.0 DF
LC LRA 5166, SC 2.0 R 36.5 MR

F - 79 -
All India Coordinated Research Project on Cotton - Annual Report (2019 – 20)
ZONAL TRIAL: SOUTH ZONE
Table 58:Br.03a: Reaction of G. hirsutum L. entries (PVT) -(Lam Guntur)
Entry code
Entry Name Alternaria leaf spot Corynospora leaf spot Grey mildew Rust Bacterial Leaf blight
GR RE GR RE GR RE GR RE GR RE
9501 RAH 1075 1 R 3 MS 1 R 2 MR 1 R
9502 BS 4-18 1 R 3 MS 2 MR 3 MS 2 MR
9503 GSHV 208 2 MR 3 MS 2 MR 3 MS 1 R
9504 CPD 1701 2 MR 3 MS 3 MS 3 MS 2 MR
9505 ZC (BGDS 1063) 2 MR 3 MS 3 MS 3 MS 1 R
9506 GISV 322 2 MR 3 MS 2 MR 3 MS 1 R
9507 GJHV-554 2 MR 3 MS 3 MS 2 MR 2 MR 9508 LC 1 R 3 MS 2 MR 2 MR 1 R
9509 RAH 1076 2 MR 3 MS 2 MR 2 MR 1 R
9510 TSH 357 2 MR 3 MS 3 MS 2 MR 1 R
9511 TCH 1837 2 MR 3 MS 2 MR 2 MR 2 MR
9512 QC (Suraj) 2 MR 3 MS 2 MR 2 MR 2 MR
LC RCH 2 BG II 3 MS 3 MS 1 R 3 MS 3 MS
LC Jaadoo BG II 3 MS 3 MS 3 MS 3 MS 2 MR

F - 80 -
All India Coordinated Cotton Improvement Project – Annual Report (2019 – 20)
Table 59. Br.04a: Reaction of G. hirsutum L. entries (CVT) – (Lam Guntur)
Entry code
Entry Name Alternaria leaf spot Corynospora leaf spot Grey mildew Rust Bacterial Leaf blight
GR RE GR RE GR RE GR RE GR RE
9521 RHC 1217 2 MR 3 MS 2 MR 2 MR 1 R
9522 GSHV 185 1 R 3 MS 2 MR 3 MS 1 R
9523 LC 1 R 3 MS 1 R 3 MS 1 R
9524 SIMA-5 1 R 3 MS 2 MR 2 MR 2 MR
9525 QC (Suraj) 2 MR 3 MS 2 MR 2 MR 2 MR
9526 CPD 1702 1 R 2 MR 1 R 3 MS 2 MR
9527 TSH 325 1 R 3 MS 2 MR 3 MS 2 MR
9528 ZC (BGDS 1063) 2 MR 2 MR 3 MS 3 MS 1 R
9529 BS 1 1 R 3 MS 2 MR 3 MS 2 MR
9530 HS 298 2 MR 3 MS 2 MR 2 MR 2 MR
LC RCH 2 BG II 3 MS 3 MS 1 R 3 MS 3 MS
LC Jaadoo BG II 3 MS 3 MS 3 MS 3 MS 2 MR

F - 81 -
All India Coordinated Research Project on Cotton - Annual Report (2019 – 20)
Table 60:Br.05a: Reaction of CHT Intra specific cotton hybrid entries – (Lam Guntur)
Entry code
Entry Name Alternaria leaf spot Corynospora leaf spot Grey mildew Rust Bacterial Leaf blight
GR RE GR RE GR RE GR RE GR RE
9531 DHH 1902 2 MR 2 MR 2 MR 3 MS 1 R 9532 BGDHH 697 1 R 2 MR 3 MS 2 MR 1 R 9533 ARBHH 1901 2 MR 3 MS 2 MR 2 MR 1 R 9534 ZC (RAHH 455) 1 R 2 MR 2 MR 2 MR 1 R 9535 LAHH 36 1 R 3 MS 2 MR 2 MR 1 R 9536 ARBHH 1902 1 R 3 MS 1 R 1 R 1 R 9537 LC 1 R 3 MS 1 R 2 MR 2 MR 9538 DHH 1901 1 R 2 MR 2 MR 2 MR 3 MS 9539 RAHH 1952 1 R 3 MS 2 MR 2 MR 2 MR 9540 RAHH 1951 1 R 3 MS 2 MR 3 MS 1 R
LC RCH 2 BG II 3 MS 3 MS 1 R 3 MS 3 MS LC Jaadoo BG II 3 MS 3 MS 3 MS 3 MS 2 MR

F - 82 -
All India Coordinated Cotton Improvement Project – Annual Report (2019 – 20)
Table 61:Br.06a: Reaction of entries under compact planting –(Lam Guntur)
Entry code
Entry Name Alternaria leaf spot Corynospora leaf spot Grey mildew Rust Bacterial Leaf blight
GR RE GR RE GR RE GR RE GR RE
9551 RHC HD 1433 1 R 3 MS 3 MS 2 MR 3 MS
9552 LHDP 5 1 R 3 MS 2 MR 1 R 1 R
9553 RAHC 1028 1 R 3 MS 2 MR 2 MR 1 R
9554 DS C 1801 1 R 2 MR 2 MR 1 R 2 MR
9555 Local Check 2 MR 3 MS 1 R 2 MR 2 MR
9556 RHC HD 1420 1 R 3 MS 1 R 3 MS 1 R
9557 LHDP 2 2 MR 3 MS 2 MR 3 MS 3 MS
9558 Zonal Check (Suraj) 2 MR 3 MS 3 MS 2 MR 2 MR
9559 RHC-HD 1438 2 MR 3 MS 2 MR 3 MS 2 MR
LC RCH 2 BG II 3 MS 3 MS 1 R 3 MS 3 MS
LC Jaadoo BG II 3 MS 3 MS 3 MS 3 MS 2 MR

F - 83 -
All India Coordinated Research Project on Cotton - Annual Report (2019 – 20)
Table 62:Br 13a: Reaction of PVT G. barbadense
Entry code Entry Name Alternaria leaf spot Bacterial Leaf blight Grey mildew Rust Corynospora
leaf spot
Guntur Dharwad Coimb Guntur Dharwad Coimb Guntur Dharwad Guntur Guntur
GE RE GE RE GE RE GE RE GE RE GE RE GE RE GE RE GE RE GE RE
9571 CCB 26 1 R 4 S 1 R 1 R 4 S 0 DF 1 R 0 DF 2 MR 1 R
9572 CCB 51 1 R 4 S 1 R 1 R 2 MR 0 DF 0 DF 0 DF 2 MR 1 R
9573 ZC (Suvin) 1 R 4 S 1 R 1 R 3 MS 0 DF 1 R 0 DF 2 MR 1 R
9574 CCB 28 1 R 4 S 0 DF 1 R 4 S 0 DF 0 DF 0 DF 2 MR 1 R
9575 CCB 29 1 R 4 S 0 DF 1 R 4 S 0 DF 0 DF 0 DF 2 MR 1 R
9576 DB 1801 1 R 4 S 0 DF 1 R 3 MS 1 R 1 R 0 DF 1 R 1 R
9577 CCB 64 1 R 4 S 0 DF 2 MR 3 MS 1 R 1 R 0 DF 2 MR 2 MR
LC RCH 2 BG II 3 MS - - - - 3 MS - - - - 1 R - - 3 MS 3 MS
LC Jaadoo BG II 3 MS - - - - 2 MR - - - - 3 MS - - 3 MS 3 MS
LC Jayadhar - - 4 S - - - 0 DF - - - - 4 S - - - -
LC Abhadita - - 4 S - - - 4 S - - - 4 S - - - -
LC RCHIIBGII - - - - 1 R - - - - 1 R - - - - - - - -

F - 84 -
All India Coordinated Cotton Improvement Project – Annual Report (2019 – 20)
Table 63:Br.14a Reaction of G. barbadense L. entries (CVT)
Entry code Entry Name Alternaria leaf spot Bacterial Leaf blight Grey mildew Rust MLS Corynospora leaf spot
Guntur Dharwad Coimbatore Guntur Dharwad Coimbatore Guntur Dharwad Guntur Coimbatore Guntur
GE RE GE RE GE RE GE RE GE RE GE RE GE RE GE RE GE RE GE RE GE RE
9581 CCB 51-2 1 R 4 S 1 R 3 MS 4 S 0 DF 0 DF 0 DF 2 MR 0 DF 1 R
9582 DB-1701 1 R 4 S 1 R 2 MR 4 S 0 DF 1 R 0 DF 2 MR 1 R 1 R
9583 SB SG 1-5 1 R 4 S 0 DF 3 MS 3 MS 0 DF 1 R 0 DF 2 MR 0 DF 1 R
9584 ZC (Suvin) 1 R 4 S 0 DF 4 S 4 S 0 DF 1 R 0 DF 1 R 0 DF 1 R
9585 CCB 143B 1 R 4 S 1 R 2 MR 4 S 0 DF 0 DF 0 DF 1 R 0 DF 1 R
9586 CCB 129 1 R 4 S 0 DF 4 S 4 S 1 R 0 DF 0 DF 1 R 0 DF 2 MR
LC RCH 2 BG II 3 MS - - - - 3 MS - - - - 1 R - - 3 MS - - 3 MS
LC Jaadoo BG II 3 MS - - - - 2 MR - - - - 3 MS - - 3 MS - - 3 MS
LC Jayadhar - - 4 S - - - - 0 DF - - - - 4 S - - - - - -
LC Abhadita - - 4 S - - - - 4 S - - - - 4 S - - - - - -
LC RCHIIBGII - - - - 1 R - - - - 1 R - - - - - 1 R - -
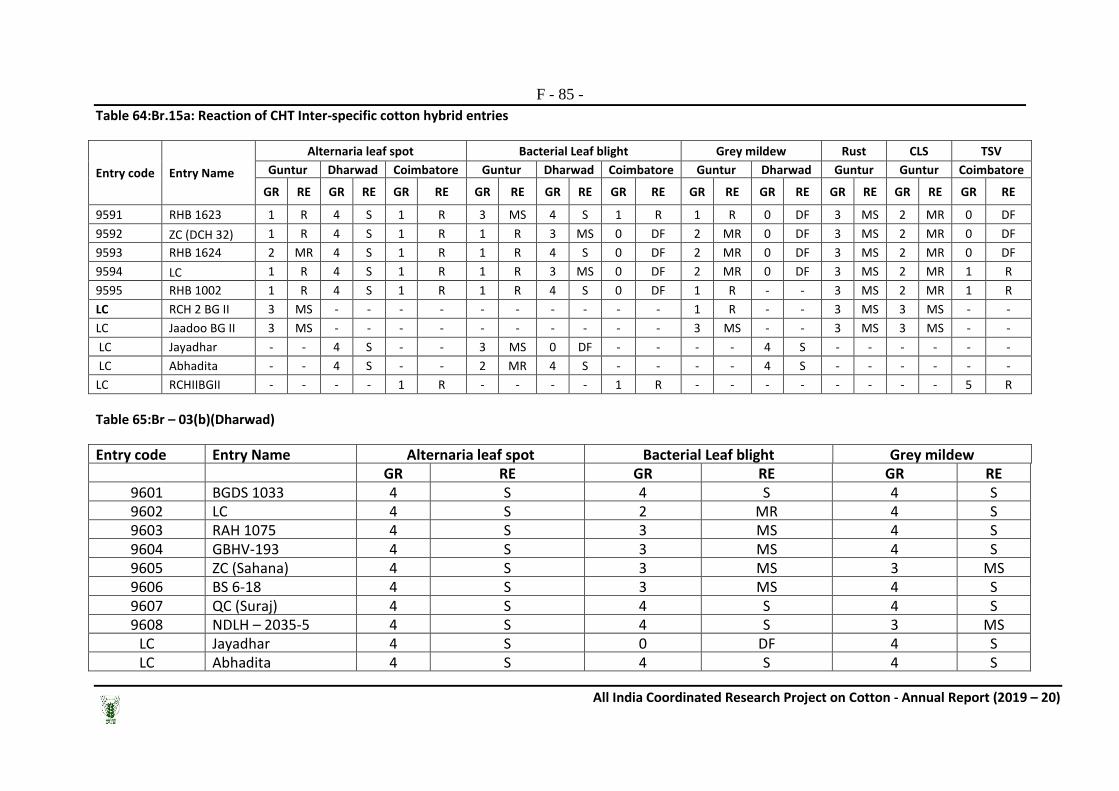
F - 85 -
All India Coordinated Research Project on Cotton - Annual Report (2019 – 20)
Table 64:Br.15a: Reaction of CHT Inter-specific cotton hybrid entries
Entry code Entry Name
Alternaria leaf spot Bacterial Leaf blight Grey mildew Rust CLS TSV
Guntur Dharwad Coimbatore Guntur Dharwad Coimbatore Guntur Dharwad Guntur Guntur Coimbatore
GR RE GR RE GR RE GR RE GR RE GR RE GR RE GR RE GR RE GR RE GR RE
9591 RHB 1623 1 R 4 S 1 R 3 MS 4 S 1 R 1 R 0 DF 3 MS 2 MR 0 DF
9592 ZC (DCH 32) 1 R 4 S 1 R 1 R 3 MS 0 DF 2 MR 0 DF 3 MS 2 MR 0 DF
9593 RHB 1624 2 MR 4 S 1 R 1 R 4 S 0 DF 2 MR 0 DF 3 MS 2 MR 0 DF
9594 LC 1 R 4 S 1 R 1 R 3 MS 0 DF 2 MR 0 DF 3 MS 2 MR 1 R
9595 RHB 1002 1 R 4 S 1 R 1 R 4 S 0 DF 1 R - - 3 MS 2 MR 1 R
LC RCH 2 BG II 3 MS - - - - - - - - - - 1 R - - 3 MS 3 MS - -
LC Jaadoo BG II 3 MS - - - - - - - - - - 3 MS - - 3 MS 3 MS - -
LC Jayadhar - - 4 S - - 3 MS 0 DF - - - - 4 S - - - - - -
LC Abhadita - - 4 S - - 2 MR 4 S - - - - 4 S - - - - - -
LC RCHIIBGII - - - - 1 R - - - - 1 R - - - - - - - - 5 R
Table 65:Br – 03(b)(Dharwad)
Entry code Entry Name Alternaria leaf spot Bacterial Leaf blight Grey mildew
GR RE GR RE GR RE
9601 BGDS 1033 4 S 4 S 4 S 9602 LC 4 S 2 MR 4 S 9603 RAH 1075 4 S 3 MS 4 S 9604 GBHV-193 4 S 3 MS 4 S 9605 ZC (Sahana) 4 S 3 MS 3 MS 9606 BS 6-18 4 S 3 MS 4 S 9607 QC (Suraj) 4 S 4 S 4 S 9608 NDLH – 2035-5 4 S 4 S 3 MS
LC Jayadhar 4 S 0 DF 4 S LC Abhadita 4 S 4 S 4 S

F - 86 -
All India Coordinated Cotton Improvement Project – Annual Report (2019 – 20)
Table 66:Br – 04(b) (Dharwad)
Entry code Entry Name Foliar Diseases Grades
Alternaria leaf spot Bacterial Leaf blight Grey mildew GR RE GR RE GR RE
9611 RAH 1071 4 S 4 S 4 S 9612 LC 4 S 4 S 4 S 9613 BS 1 4 S 4 S 4 S 9614 NDLH 20511 4 S 4 S 4 S 9615 ZC (Sahana) 4 S 3 MS 4 S 9616 BGDS 1072 4 S 3 MS 4 S 9617 GSHV 191 4 S 3 MS 4 S 9618 QC (Suraj) 4 S 4 S 3 MS
LC Jayadhar 4 S 0 DF 4 S LC Abhadita 4 S 4 S 4 S
Table 67:Br – 05(b) (Dharwad)
Entry code Entry Name Alternaria leaf spot Bacterial Leaf blight Grey mildew
GR RE GR RE GR RE 9621 ARBHH 1951 4 S 4 S 3 MS 9622 ZC (DHH 11) 4 S 4 S 4 S 9623 ARBHH 1952 4 S 3 MS 4 S 9624 RAHH 1952 4 S 4 S 4 S 9625 DHH 1951 4 S 4 S 4 S 9626 GAP -- -- -- 9627 BGDHH 697 2 MR 4 S 2 MR 9628 DHH 1952 4 S 4 S 4 S 9629 RAHH 1951 4 S 4 S 3 MS
LC Jayadhar 4 S 0 DF 4 S LC Abhadita 4 S 4 S 4 S

F - 87 -
All India Coordinated Research Project on Cotton - Annual Report (2019 – 20)
Table 68:Br-06(b) CVT (Dharwad)
Entry code Entry Name Alternaria leaf spot Bacterial Leaf blight Grey mildew
GR RE GR RE GR RE
9631 AKH 1302 4 S 4 S 4 S
9632 DSC 1851 4 S 4 S 3 MS
9633 Local Check 4 S 4 S 4 S
9634 RAHC 1029 4 S 4 S 3 MS
9635 GISV 312 4 S 3 MS 4 S
9636 RHC HD 1420 4 S 3 MS 4 S
9637 AKH 1301 4 S 3 MS 4 S
9638 CNH 1128 4 S 3 MS 4 S
9639 BRCC 1621 S 4 S 4 S 3 MS
9640 Zonal Check (Suraj) 4 S 4 S 3 MS
LC Jayadhar 4 S 0 DF 4 S
LC Abhadita 4 S 4 S 4 S
Table 69:Br-24(b) CVTG arboreum (Dharwad)
Entry code Entry Name Alternaria leaf spot Bacterial Leaf blight Grey mildew
GR RE GR RE GR RE 9651 GAM 260 4 S 0 DF 3 MS 9652 LC 2 MR 0 DF 4 S 9653 NDLA 3116-4 4 S 0 DF 4 S 9654 MDL 2667 4 S 0 DF 2 MR 9655 ZC (DLSa 17) 4 S 0 DF 4 S 9656 JLA-1227 4 S 0 DF 4 S 9657 CNA 1054 4 S 0 DF 4 S 9658 GAM 259 4 S 0 DF 4 S 9659 DWDa 1801 4 S 0 DF 4 S 9660 DWDa 1802 4 S 0 DF 4 S 9661 CNA 1031 4 S 0 DF 4 S
LC Jayadhar 4 S 0 DF 4 S LC Abhadita 4 S 4 S 4 S

F - 88 -
All India Coordinated Cotton Improvement Project – Annual Report (2019 – 20)
Table 70:Br-24(b) CVT – Long linted G. arboreum (Dharwad)
Entry code Entry Name Alternaria leaf spot Bacterial Leaf blight Grey mildew
GR RE GR RE GR RE
9671 PA 837 4 S 0 DF 4 S 9672 PA 833 4 S 0 DF 3 MS 9673 PAIG 377 4 S 0 DF 3 MS 9674 PA 839 4 S 0 DF 4 S 9675 PA 778 4 S 0 DF 4 S 9676 PAIG 380 4 S 0 DF 3 MS 9677 PAIG 384 4 S 0 DF 4 S 9678 PA 806 4 S 0 DF 3 MS 9679 ZC (DLSa 17) 4 S 0 DF 4 S 9680 PA 807 4 S 0 DF 4 S 9681 PA 809 4 S 0 DF 4 S 9682 CNA 1065 4 S 0 DF 4 S
LC Jayadhar 4 S 0 DF 4 S LC Abhadita 4 S 4 S 4 S
Table 71:Br.02a ColourdcottonG. hirsutum L. entries (IET) (Lam Guntur)
Entry code Entry Name Alternaria leaf spot Corynespora leaf spot Grey mildew Rust Bacterial blight GR RE GR RE GR RE GR RE GR RE
9701 LHCC 3 1 R 2 MR 2 MR 2 MR 1 R 9702 LHCC 4 1 R 2 MR 2 MR 2 MR 1 R 9703 LHCC 1 1 R 2 MR 2 MR 2 MR 1 R 9704 CNH 17395 1 R 2 MR 1 R 1 R 2 MR 9705 Suraj (Zonal
Check) 1 R 2 MR 2 MR 2 MR 2 MR
9706 16301 DB 1 R 2 MR 1 R 2 MR 1 R 9707 DHCC 1801 1 R 3 MS 2 MR 2 MR 1 R 9708 LHCC 2 1 R 2 MR 2 MR 2 MR 1 R 9709 Local Check 1 R 3 MS 2 MR 2 MR 1 R 9710 16337 LB 1 R 2 MR 2 MR 2 MR 1 R 9711 16315 LB 1 R 2 MR 2 MR 2 MR 1 R 9712 DHCC 1802 1 R 2 MR 2 MR 2 MR 2 MR
LC RCH 2 BG II 3 MS 3 MS 1 R 3 MS 3 MS LC Jaadoo BG II 3 MS 3 MS 3 MS 3 MS 2 MR

F - 89 -
All India Coordinated Research Project on Cotton - Annual Report (2019 – 20)
Path 2 (b)Confirmation and maintenance of disease resistant lines CENTRAL ZONE
Table 72: Confirmation and maintenance of disease resistant lines at Junagarh (Gujrat)
Sr. No.
Variety / year of testing
Alternaria leaf spot Bacterial leaf blight Grey mildew
Grade Reaction Grade Reaction Grade Reaction
1 RAH-1071 III MS III MS I R
2 RHC-1217 III MS II MR I R
3 CPD-1602 II MR II MR I R
4 GISV-310 III MS I R I R
5 PBH-42 III MS II MR I R
6 GJHV-523 II MR III MS I R
7 BS2-17 III MS III MS I R
8 RAH-0603 I R II MR I R
9 TSH-325 II MR II MR I R
10 H-1488 III MS III MS I R
11 RAH-0604 II MR III MS I R
12 RAH1075 II MR III MS I R
13 L1384 II MR III MR I R
14 GJHV554 II MR II MR I R
15 RS2909 II MR II MR I R
16 RAH1076 IV S II MR I R
17 TSH357 II MR III MS I R

F - 90 -
All India Coordinated Cotton Improvement Project – Annual Report (2019 – 20)
Table 73:Confirmation and maintenance of disease resistant lines at Akola against bacterial blight
Sr. No. Name of varieties Grade Reaction 1 NDLH 1938 1 R 2 GSV-173 1 R 3 GIHV 497 2 MR 4 THS 0499 1 R 5 AKH-09-5 1 R 6 AKH 2006-2 1 R 7 GISV 319 1 R 8 GISV 310 1 R 9 JK-4 1 R 10 JK-5 1 R 11 Khandwa 2 (Ch) 3 MS 12 DCH 32 (Susceptible ch) 4 S
SOUTH ZONE
Table 74: Confirmation and maintenance of disease resistant lines Dharwad (Kantatka)
Sl. No
Genotypes Foliar Diseases Grades (0 to 4 Scale )
AB BB GM
Grade Reaction Grade Reaction Grade Reaction
1 DB-14 2 MR 2 MR 0 DF
2 SVA-1118 1 R 0 DF 0 DF
3 GSB-41 4 S 4 S 0 DF
4 DB-40 4 S 4 S 0 DF
5 BD-16 4 S 4 S 3 MS
6 SUVIN 4 S 3 MS 3 MS
7 SCS-1206 4 S 4 S 0 DF
8 RHB-1005 4 S 4 S 3 MS
9 DB-1302 4 S 4 S 4 S
10 GSHB-989 4 S 4 S 0 DF
Jayadhar (LC) 4 S 0 DF 4 S
Abhadita (LC) 4 S 4 S 4 S

F - 91 -
All India Coordinated Research Project on Cotton - Annual Report (2019 – 20)
Table 75:Confirmation and maintenance of disease resistant lines Guntur(Lam)
Variety Disease Grade (0-4 Scale)
Grey mildew Rust Alternaria Leaf Spot
2018-19
Reaction 2019-20
Reaction 2018-19 Reaction 2019-20 Reaction 2018-19 Reaction 2019-20
Reaction
BS 4-18 1 R 1 R 2 MR 3 MS 2 MR 2 MR
SHS 113 1 R 1 R 2 MR 2 MR 2 MR 2 MR
CPD 1802 1 R 1 R 2 MR 2 MR 2 MR 2 MR
ZC (Suraj) 1 R 1 R 2 MR 2 MR 2 MR 2 MR
LHCC 3 1 R 1 R 2 MR 2 MR 2 MR 2 MR
LHCC 4 1 R 1 R 2 MR 2 MR 2 MR 2 MR
CSH 3158 1 R 1 R 2 MR 2 MR 2 MR 2 MR
SHC 374 1 R 1 R 3 MS 3 MS 2 MR 2 MR
CPD 1702 1 R 1 R 2 MR 2 MR 2 MR 2 MR
RHC 1217 1 R 2 MR 2 MR 2 MR 2 MR 2 MR
GISV 298 1 R 1 R 2 MR 3 MS 2 MR 2 MR
ZC (Suvin) 1 R 1 R 1 R 2 MR 2 MR 2 MR
NDLH 1938 1 R 1 R 2 MR 2 MR 2 MR 2 MR
Jadoo 3 MS 3 MS 3 MS 3 MS 3 MS 3 MS
RCH 2 BG II 1 R 1 R 3 MS 3 MS 3 MS 3 MS

F - 92 -
All India Coordinated Cotton Improvement Project – Annual Report (2019 – 20)
Path. 2 (c) Monitoring of breakdown of resistance against CLCuD in cotton. NORTH ZONE Table 76. Monitoring of breakdown of resistance against CLCuD in North Zone
Sriganganagar Bathinda Hisar Cumulative mean
Reaction
Entries CLCuD (PDI) Reaction CLCuD (PDI) Reaction CLCuD (PDI) Reaction
Susceptible varieties
HS-6 49.72 S 72.78 HS 46.28 S 56.3 HS
F-846 40.83 S 73.89 HS 48.80 S 54.5 HS
RST-9 53.33 HS 75.56 HS 45.52 S 58.1 HS
Tolerant varieties
F 2228 26.94 MR 55.56 HS 43.80 S 42.1 S
H 1098 (i) 30.56 MS 67.78 HS 43.61 S 47.3 S
CSH 3075 30.83 MS 43.33 S 44.49 S 39.6 MS
Hybrids
Bio 6317 (Susceptible)
31.39 MS 51.11 HS 37.84 MS 40.1 S
RCH 773 (Tolerant)
28.33 MR 34.44 MS 21.21 MR 28.0 MR

F - 93 -
All India Coordinated Research Project on Cotton - Annual Report (2019 – 20)
Path.3 (f) ; Management of sooty mold (Capnodiumspp.) in cotton
Path. 77: Management of sooty mold (Capnodiumspp.) in cotton (Poly House Experiment: Prophylactic spray twice)) at Sirsa
Treatments % Sooty mold per plant (Polyhouse study: Sirsa)
Before I spray 7DAS 15 DAS Before II
spray 15 DAS Before III
spray 7 DAS 15 DAS
T1-COC 50 WP @ 1.25 g/litre 50.7(45.4) 51.9(46.12) 39.0(38.1) 64.7(53.72) 61.1(51.4) 56.3(48.6) 30.5(33.3) 14.1(21.9) T2-COC 50 WP @ 2.50 g/litre 47.4(43.5) 48.3(44.0) 54.8(47.8) 69.8(56.8) 55.3(48.0) 54.7(47.6) 40.4(39.4) 19.6(26.1) T3-Propiconazole 25 EC @ 1 ml / litre 4.7(9.9) 19.7(24.6) 21.8(27.1) 46.6(42.9) 37.0(37.1) 49.0(44.4) 22.7(28.3) 8.5(16.3) T4-Mancozeb 50 WP @2.0 g /litre 0.0(0.0) 0.0(0.0) 1.0(3.2) 46.1(42.7) 44.1(41.6) 56.8(48.9) 27.4(31.4) 7.6(15.8) T5-Neem oil 1500ppm @5ml / litre 27.5(31.6) 30.8(33.6) 44.1(41.6) 62.3(52.3) 61.1(51.4) 56.5(48.7) 20.8(27.0) 3.6(10.0) T6-Flonicamid 0.4g/L 30.8(33.5) 31.8(33.8) 31.7(33.5) 52.3(46.3) 39.3(38.7) 40.2(39.3) 20.3(26.2) 0.0(0.0) T7-Control 47.5(43.5) 70.7(57.2) 76.4(61.6) 66.1(54.5) 53.9(47.2) 56.9(48.9) 32.0(34.3) 13.9(21.6) C.D. 11.561 11.728 18.644 N/A 10.148 6.494 N/A 7.2 C.V. 21.712 19.058 28.664 16.893 12.509 7.739 15.365 24.852
Path. 78: Management of sooty mold (Capnodiumspp.) in cotton : Whitefly population / 3 leaves (Poly House Experiment: Prophylactic spray twice) at Sirsa
Treatments Whitefly population / 3 leaves (Polyhouse study: Sirsa)
Before I spray 7DAS 15 DAS Before II spray 15 DAS Before III spray 7 DAS 15 DAS
T1-COC 50 WP @ 1.25 g/litre 63.4(7.9) 113.1(10.6) 101.1(10.0) 19.3(4.4) 13.7(3.8) 7.1(2.8) 2.9(1.9) 0.8(1.3) T2-COC 50 WP @ 2.50 g/litre 34.7(5.8) 94.6(9.75) 47.3(6.9) 8.4(3.0) 11.6(3.5) 4.1(2.2) 2.4(1.8) 0.6(1.2) T3-Propiconazole 25 EC @ 1 ml / litre 36.0(6.0) 72.8(8.4) 31.9(5.7) 10.0(3.3) 9.1(3.1) 3.2(2.0) 2.4(1.8) 1.2(1.4) T4-Mancozeb 50 WP @2.0 g /litre 44.1(6.7) 53.3(7.1) 78.8(8.7) 10.2(3.3) 5.4(2.5) 3.8(2.1) 1.0(1.3) 0.0(1.0) T5-Neem oil 1500ppm @5ml / litre 77.8(8.7) 45.3(6.7) 24.0(4.9) 6.8(2.7) 6.0(2.5) 2.9(1.9) 1.2(1.4) 0.0(1.0) T6-Flonicamid 0.4g/L 44.4(6.7) 18.6(4.4) 22.6(4.8) 4.6(2.3) 1.4(1.5) 0.4(1.2) 0.0(1.0) 0.0(1.0) T7-Control 88.7(9.4) 47.9(6.9) 39.7(6.3) 47.5(6.96) 16.4(4.1) 14.9(3.9) 9.4(3.2) 3.1(2.0) C.D. 2.1 2.232 2.051 0.729 0.821 0.554 0.621 0.343 C.V. 15.865 16.029 16.794 10.808 14.988 13.167 19.107 14.758
* Value in parentheses are arcsine transformation values

F - 94 -
All India Coordinated Cotton Improvement Project – Annual Report (2019 – 20)
Table 79: Management of sooty mold (Capnodiumspp.) in cotton (Field Experiment (Spray thrice))
Treatments Reduction at 15 days after 3rd spray (%)
Pooled mean
SCY (q/ha)
Faridkot Hisar Hisar
T1 - Copper oxy chloride (COC) 50 WP @ 0.75 g/litre of water 11.68 11.20 11.44 23.0
T2 - Copper oxy chloride (COC) 50 WP @ 1.25 g/litre of water 14.14 12.14 13.14 24.0
T3- Copper oxy chloride (COC) 50 WP @ 1.75 g/litre of water 27.96 16.43 22.20 25.0
T4- Copper oxy chloride (COC) 50 WP @ 2.25 g/litre of water 37.64 31.43 34.54 30.0
T5- Propiconazole 25 EC @ 1 ml / litre of water 40.88 19.28 30.08 28.0
T6 - Mancozeb 50 WP @2.0 g /litre of water 36.07 29.00 32.54 28.0
T7- Detergent powder @ 5.0 g / litre of water 15.38 12.85 14.12 23.0
T8- Water spray 9.27 4.3 6.79 20.0
T9- Control 0 - 0.00 20.0
CD 0.05%
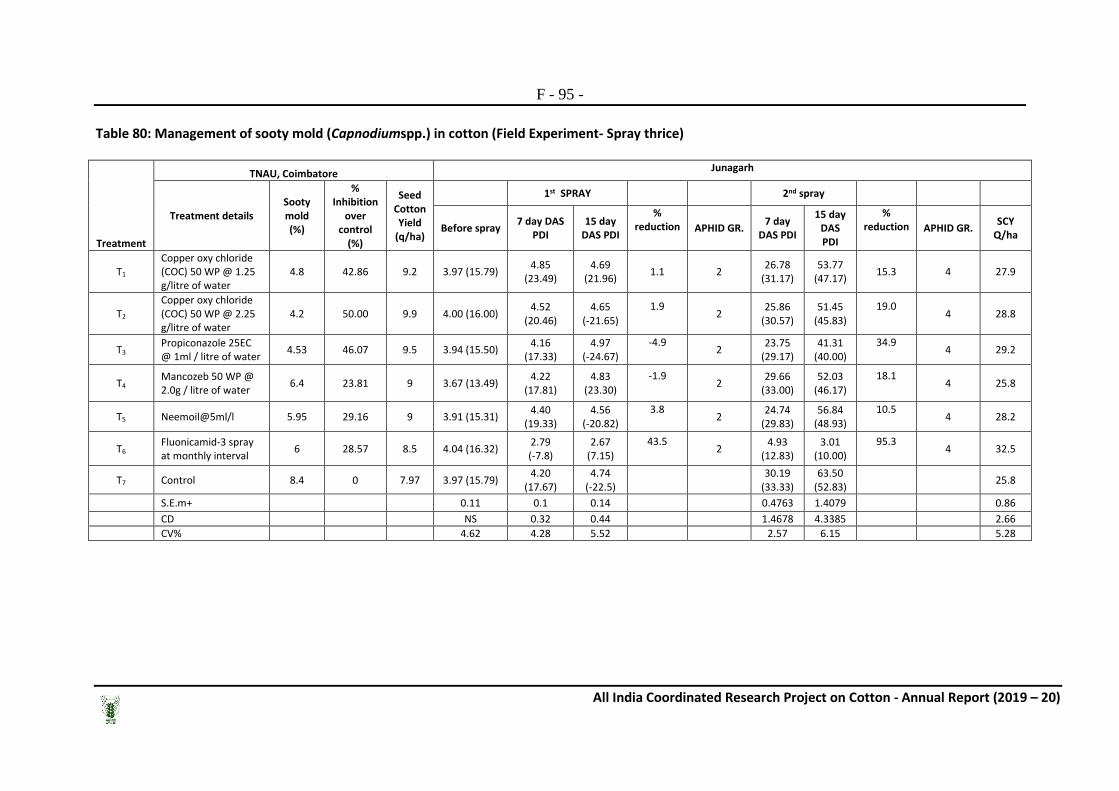
F - 95 -
All India Coordinated Research Project on Cotton - Annual Report (2019 – 20)
Table 80: Management of sooty mold (Capnodiumspp.) in cotton (Field Experiment- Spray thrice)
Treatment
TNAU, Coimbatore Junagarh
Treatment details Sooty mold (%)
% Inhibition
over control
(%)
Seed Cotton Yield
(q/ha)
1st SPRAY 2nd spray
Before spray 7 day DAS
PDI 15 day
DAS PDI
% reduction APHID GR.
7 day DAS PDI
15 day DAS PDI
% reduction APHID GR.
SCY Q/ha
T1 Copper oxy chloride (COC) 50 WP @ 1.25 g/litre of water
4.8 42.86 9.2 3.97 (15.79) 4.85
(23.49) 4.69
(21.96) 1.1 2
26.78 (31.17)
53.77 (47.17)
15.3 4 27.9
T2 Copper oxy chloride (COC) 50 WP @ 2.25 g/litre of water
4.2 50.00 9.9 4.00 (16.00) 4.52
(20.46) 4.65
(-21.65)
1.9 2
25.86 (30.57)
51.45 (45.83)
19.0 4 28.8
T3 Propiconazole 25EC @ 1ml / litre of water
4.53 46.07 9.5 3.94 (15.50) 4.16
(17.33) 4.97
(-24.67)
-4.9 2
23.75 (29.17)
41.31 (40.00)
34.9 4 29.2
T4 Mancozeb 50 WP @ 2.0g / litre of water
6.4 23.81 9 3.67 (13.49) 4.22
(17.81) 4.83
(23.30)
-1.9 2
29.66 (33.00)
52.03 (46.17)
18.1 4 25.8
T5 Neemoil@5ml/l 5.95 29.16 9 3.91 (15.31) 4.40
(19.33) 4.56
(-20.82)
3.8 2
24.74 (29.83)
56.84 (48.93)
10.5 4 28.2
T6 Fluonicamid-3 spray at monthly interval
6 28.57 8.5 4.04 (16.32) 2.79 (-7.8)
2.67 (7.15)
43.5 2
4.93 (12.83)
3.01 (10.00)
95.3 4 32.5
T7 Control 8.4 0 7.97 3.97 (15.79) 4.20
(17.67) 4.74
(-22.5) 30.19
(33.33) 63.50
(52.83) 25.8
S.E.m+ 0.11 0.1 0.14 0.4763 1.4079 0.86 CD NS 0.32 0.44 1.4678 4.3385 2.66 CV% 4.62 4.28 5.52 2.57 6.15 5.28

F - 96 -
All India Coordinated Cotton Improvement Project – Annual Report (2019 – 20)
Path. 3 (g): Management of parawilt of cotton Table 81: Management of parawilt of cotton at Bathinda& Hisar Bhatinda Hisar Overall
recovery
Treatment %
Recovery No. of
Monopods
No. of Sympods
Shoot length(cm)
No. of
open bolls per
plant
Total root mass (gm.)
Fresh Root
Length Density
(g)
Boll Wt. gm)
Yield (Q/ha)
Diseased plants
% Recovery
T.1 Cobalt chloride foliar spray 10 ppm foliar spray immediately after occurrence of disease
91.7 1.8 26.5 161.1 48.4 25.0 2.0 4.3 29.6 15
(22.49) 85.0 88.4
T.2 Sodium Benzoate foliar spray 50ppm foliar spray immediately after occurrence of disease
33.3 1.1 19.9 143.9 38.7 22.2 2.0 3.7 27.0 60
(34.59) 65.0
49.2
T3. Salicylic acid (Commercial grade) @ 250ppm foliar spray immediately after occurrence of disease
41.7 1.2 24.5 154.5 36.9 25.4 1.9 4.0 25.8 100
(90.0) 0.0
20.9
T4. Foliar spray of Pseudomonas fluorescens @ 10ml/litre of water (University strain)
25.0 0.7 23.4 154.4 41.9 20.9 1.9 3.8 22.8 100
(90.0) 0.0
12.5
T5. Drench Plants with mixture of Copper oxychloride (COC) 50 WP@ 25g and 200 Urea in 10 litre of water
83.3 1.7 23.4 160.6 46.8 23.5 2.0 4.1 27.7 75 (60.1) 25.0 54.2
T6. Drench plants with Carbendazim 1g/L 25.0 0.9 21.7 152.2 37.6 21.3 1.8 3.9 20.1 90 (71.5) 10.0 17.5
T.7 Control 16.7 0.8 21.2 136.7 35.6 17.8 1.8 3.6 18.8 100
(90.0) 0.0
8.4
CD @ 0.05% 20.54 0.57 NS 11.51 NS NS NS 0.35 0.6 6.4
CV % 3.38 22.06 16.11 9.15 25.06 10.63 17.92 3.63 2.71 10.90 -

F - 97 -
All India Coordinated Research Project on Cotton - Annual Report (2019 – 20)
Path. 3 (h): Evaluation of efficacy of bioagents against cotton diseases
Table 82. Evaluation of efficacy of bioagents against bacterial and fungal foliar diseases
Treatments Alternaria Leaf spot PDI (%) Bacterial Leaf Blight PDI (%) Grey mildew PDI(%)
Nanded Akola Surat
Overall mean
Nanded Akola Nagpur Surat Overall mean
Nanded Akola Nagpur Overall mean
T1 Seed and soil application of Bacillus aryabhattai
5.0 (12.9)
5.7 (13.8)
8.3 (16.5)
6.3 6.6
(14.8) 5.3
(13.3) 4.2
17.2 (24.3)
8.3 7.4
(15.7) 5.8
(13.8) 2.7 5.3
T2 Seed and soil application of Bacillus tequeilencis
7.5 (15.9)
6.2 (14.3)
7.5 (15.6)
7.1 6.4
(14.6) 4.8
(12.7) 4.1
15.7 (23.2)
7.8 6.0 (14.2)
6.0 (14.1)
0 4.0
T3 Seed and soil application of Bacillus aryabhattai + Bacillus tequeilencis.
5.0 (12.9)
4.3 (11.9)
4.2 (11.3)
4.5 5.3
(13.2) 4.3
(11.9) 2.0
9.7 (17.9)
5.3 6.0 (14.1)
4.9 (12.7)
0 3.6
T4 Seed and soil application of commercial product Bacillus subtilis
5.6 (13.7)
5.9 (14.1)
11.5 (19.6)
7.7 6.2
(14.3) 5.6
(13.7) 2.5
19.7 (26.2)
8.5 7.4 (15.8)
6.4 (14.6)
0 4.6
T5 Seed and soil application ofPf CICR.
5.3 (13.3)
6.3 (14.5)
6.0 (14.0)
5.9 4.9
(12.8) 4.9
(12.9) 3.3
13.5 (21.3)
6.7 5.3 (13.3)
7.0 (15.2)
0 4.1
T6 Chemical seed treatment (vitavax powder @ 0.2%)
4.6 (12.4)
5.3 (13.3)
12.2 (20.3)
7.4 4.7
(12.5) 5.1
(13.0) 3.3
20.8 (27.0)
8.5 3.6 (10.9)
6.1 (14.2)
0 3.2
T7 Foliar application of Pyraclostrobin in 0.1%
4.1 (11.6)
4.7 (12.5)
10.2 (18.5)
6.3 3.5
(10.8) 4.9
(12.8) 4.3
18.8 (25.4)
7.9 2.6 (9.2)
5.2 (13.1)
0 2.6
T8 Control 9.4
(17.9) 7.4
(15.7) 17.5
(24.6) 11.4
7.5 (15.9)
7.6 (15.9)
9.6 42.3
(40.5) 16.8 8.7
(7.7) 7.8
(16.2) 2.7 6.4
SE+ 0.28 0.63 1.90 0.47 0.48 1.50 0.53 0.84
CD at 5% 0.85 1.91 5.75 1.42 1.46 4.53 1.65 -
CV (%) 3.53 7.95 18.70 5.99 6.30 10.06 6.74 10.29
*Figure in the parenthesis are retransformed values

F - 98 -
All India Coordinated Cotton Improvement Project – Annual Report (2019 – 20)
Table 83: Evaluation of efficacy of bioagents against soil borne and foliar cotton diseasesat Nagpur Treatment Nagpur
Myrothecium
leaf spot (PDI) Corynespora leaf
spot (PDI) Wilt (% incidence)
Root rot (% incidence)
T1
Seed and soil application of Bacillus aryabhattai, Seed application: 108cfu/g @10g per kg of seed at the time of sowing, Soil application: 2.5 kg/ha (30 & 60 DAS) with FYM/compost
5.3 5.2 3.3 3.3
T2
Seed and soil application of Bacillus tequeilencis Seed application: 108cfu/g @10g per kg of seed at the time of sowing, Soil application: 2.5 kg/ha (30 & 60 DAS) with FYM/compost
4.4 4.8 0 1.7
T3 T1+T2 Seed application: 108cfu/g @10g per kg of seed at the time of sowing & Soil application: 2.5 kg/ha (30 & 60 DAS) with FYM/compost
1.7 2.7 0 0
T4
Seed and soil application of Commercial product Bacillus subtilis Seed application: 108cfu/g @10g per kg of seed at the time of sowing Soil application: 2.5 kg/ha (30 & 60 DAS) with FYM/compost
2.7 4.4 1.7 1.7
T5
Seed and soil application PfCICR Seed application: 108cfu/g @10g per kg of seed at the time of sowingSoil application: 2.5 kg/ha (30 & 60 DAS) with FYM/compost
2.7 4.9 1.7 1.7
T6 Chemical seed treatment (Vitavax power @ 0.2%) 2 gm/kg seed at the time of sowing
0 5.5 0 3.3
T7 Foliar application of Pyraclostrobin @ 0.1% 1.0 gm/lit of water 0 2.7 3.3 3.3
T8 Control 12.4 8.7 6.7 8.3

F - 99 -
All India Coordinated Research Project on Cotton - Annual Report (2019 – 20)
Table 84: Effect bioagents against cotton diseases and seed cotton yield at various locations
Treatment Germination Seed cotton yield Q/ha
Nanded Nanded
(RASI BG-II) Akola
Nagpur (Suraj cv.)
Surat (RCH 2 BG II).
Overall mean
T1
Seed and soil application of Bacillus aryabhattai, Seed application: 108cfu/g @10g per kg of seed at the time of sowing, Soil application: 2.5 kg/ha (30 & 60 DAS) with FYM/compost
97.4 (82.4)
13.2 11.9 44.7 21.1 22.7
T2
Seed and soil application of Bacillus tequeilencis Seed application: 108cfu/g @10g per kg of seed at the time of sowing, Soil application: 2.5 kg/ha (30 & 60 DAS) with FYM/compost
96.9 (81.7)
11.7 10.5 45.1 23.0 22.6
T3 T1+T2 Seed application: 108cfu/g @10g per kg of seed at the time of sowing & Soil application: 2.5 kg/ha (30 & 60 DAS) with FYM/compost
97.0 (81.8)
14.8 13.7 46.2 26.8 25.4
T4
Seed and soil application of Commercial product Bacillus subtilis Seed application: 108cfu/g @10g per kg of seed at the time of sowing Soil application: 2.5 kg/ha (30 & 60 DAS) with FYM/compost
95.4 (79.8)
11.8 10.5 39.1 19.5 20.2
T5
Seed and soil application PfCICR Seed application: 108cfu/g @10g per kg of seed at the time of sowing Soil application: 2.5 kg/ha (30 & 60 DAS) with FYM/compost
95.8 (78.3)
12.9 11.7 41.9 24.2 22.7
T6 Chemical seed treatment (Vitavax power @ 0.2%) 2 gm/kg seed at the time of sowing
95.4 (79.8)
13.5 13.0 46.0 18.1 22.7
T7 Foliar application of Pyraclostrobin @ 0.1% 2.0 gm/lit of water
95.4 (79.8)
13.1 12.4 43.6 20.4 22.4
T8 Control 94.2
(76.3) 10.6 9.7 37.5 17.2
18.8
SE+ 4.16 0.38 1.197 1.332
CD at 5% 12.60 1.17 3.631 4.039
CV (%) 9.01 5.29 18.38 0.108

F - 100 -
All India Coordinated Cotton Improvement Project – Annual Report (2019 – 20)
Path.4(e). Crop loss estimation due to CLCuD and distribution pattern of CLCuD in north zone. Expt.1.To work out relationship between disease index and yield reduction due to CLCuD. NORTH ZONE Table 85: Seed cotton yield (%) reduction disease grade wise in different Bt hybrids in North Zone.
Grades US51 RCH 773 BGII NCS 9013 BGII Bioseed 6688 BGII HSR FDK SGR Avg. HSR FDK SGR Avg. HSR FDK SGR Avg. HSR FDK SGR Avg.
1 - - - - - - - - - - - - - - -
2 20.3 23.8 16.8 20.3 12.8 23.2 13.3 16.4 10.0 34.0 16.6 20.2 5.7 36.0 12.3 18.0
3 41.9 30.8 55.2 42.6 31.7 30.9 45.1 35.9 25.8 43.8 58.8 42.8 10.6 37.5 47.8 32.0
4 56.7 37.3 76.3 56.8 45.1 39.3 74.2 52.8 38.4 50.4 79.3 56.0 30.1 45.0 67.4 47.5
5 72.5 - - 72.5 60.2 - - 60.2 56.0 - - 56.0 31.0 - - 31.0
6 85.2 - - 85.2 73.5 - - 73.5 69.4 - - 69.4 69.0 - - 69.0
Mixed 53.8 20.2 37.1 37.0 46.2 23.0 33.1 34.1 42.8 31.3 38.7 37.6 35.2 25.6 31.9 30.9

F - 101 -
All India Coordinated Research Project on Cotton - Annual Report (2019 – 20)
Expt.2. Study on distribution pattern of cotton leaf curl virus disease on local popular Bt hybrid at farmer’s in Punjab, Rajasthan and Haryana field. Table 86: CLCuD incidence in different districts of the North Zone Punjab, Rajasthan and Haryana
Punjab Rajasthan Haryana
Districts Mean (PDI) Districts Mean (PDI) Districts Mean (PDI)
Faridkot 11.84 Sriganganagar 14.27 Sirsa 16.44
Fazilka 10.13 Hanumangarh 9.10 Fatehabad 13.65
Muktsar 8.82 Hisar 15.20
Bathinda 5.70 Jind 16.01
Bhiwani 10.28
Rohtak 11.20
Palwal 11.00

F - 102 -
All India Coordinated Cotton Improvement Project – Annual Report (2019 – 20)
Agron. V: Technology for organic cotton production
Table87.Intensity of diseases under organic cotton productionkharif-2019: Junagarh
Sr.
Treatments PDI(%)
Bacterial leaf blight Alternaria leaf spot Grey mildew 1 Absolute control (No organic & Inorganic) 1.0 (1.0)# 29.4 (24.2)* 0 2 Control (RDN through inorganic) 0.6 (0.7) 30.2 (25.3) 0 3 RD of Nutrient through organic based on P -equivalent basis. 0.9 (1.2) 30.4 (25.7) 0
4 Seed treatment and soil application of rec. bio fertilisers and foliar application of PPFM @1 % at flowering and boll development. 0.7 (0.8)
31.3 (27.0)
0 5 Neem cake 250 kg/ha. 0.9 (1.2) 29.6 (24.3) 0
6 Raising of Sunhemp / between rows incorporated before flowering. 0.6 (0.5)
31.2 (26.8) 0
7 Intercropping with black gram & crop residue has to be incorporated after harvesting insitu condition. 0.7 (0.8)
28.8 (23.2) 0
8 T4+T5 1.0 (1.0) 30.0 (25.0) 0 9 T4+T6 1.2 (1.5) 29.7 (24.5) 0
10 T4+T5+T6 0.9 (0.8) 29.9 (24.8) 0 11 T4+ T5 + T7 0.9 (1.2) 29.7 (24.5) 0
S. Em. ± 0.7 0
C.D. at 5 % NS NS 0 CV% 25.74 3.99 0
# Square root transformation, * Arcsine transformation

F - 103 -
All India Coordinated Research Project on Cotton - Annual Report (2019 – 20)
Table88. Intensity of diseases under organic cotton production (G. Cot. 20) (2019-20) Surat
Sr. No.
Treatments
Bacterial leaf blight Alternaria leaf spot
PDI Max Grade Rating PDI Max Grade Rating
1 Absolute control (No organic & Inorganic) 12.5 3 MS 0.0 0 DF
2 Control (RDN through inorganic) 6.5 2 MR 0.0 0 DF
3 RD of Nutrient through organic based on P -equivalent basis.
8.5 2 MR 0.0 0 DF
4 Seed treatment and soil application of rec. bio fertilisers and foliar application of PPFM @1 % at flowering and boll development.
5.5 2 MR 0.0 0 DF
5 Neem cake 250 kg/ha. 2.0 2 MR 0.0 0 DF
6 Raising of Sunhemp / between rows incorporated before flowering.
11.5 3 MS 0.0 0 DF
7 Intercropping with black gram & crop residue has to be incorporated after harvesting insitu condition.
9.5 2 MR 0.0 0 DF
8 T4+T5 3.0 2 MR 0.0 0 DF
9 T4+T6 4.5 2 MR 0.0 0 DF
10 T4+T5+T6 5.5 2 MR 0.0 0 DF
11 T4+ T5 + T7 2.5 2 MR 0.0 0 DF

F - 104 -
All India Coordinated Cotton Improvement Project – Annual Report (2019 – 20)
Table 89. Intensity of diseases under organic cotton production (G. hirsutum)2019-20 Dharwad
Sl. No
Treatments 120 DAS Yield
(kg/ha) AB PDI BB PDI GM PDI
T1 Absolute control (No organics & No inorganic) 51.88(46.10) 36.75(37.34) 33.35(35.29) 470
T2 Control (RDN through inorganic) 40.46(39.52) 31.88(34.39) 28.00(31.96) 961
T3 RD of Nutrient through organic based on P equivalent basis 49.81(44.91) 28.24(32.12) 30.97(33.83) 735
T4 Seed treatment and soil application of rec. bio fertilizers and foliar application of PPFM @ 1% at flowering and boll development 50.01(45.03) 29.35(32.82) 29.75(33.07) 592
T5 Neem cake 250kg/ha 45.67(42.54) 28.32(32.17) 30.89(33.78) 775
T6 Raising of Sunhemp /fodder cowpea between rows incorporated before flowering 48.59(44.21) 29.40(32.85) 29.96(33.20) 443
T7 Intercropping with green gram/black gram/ground nut/soybean 45.28(42.31) 28.80(32.47) 30.10(33.29) 493
T8 T4 + T5 44.15(41.66) 28.27(32.14) 30.48(33.53) 653
T9 T4 +T6 45.99(42.72) 27.25(31.48) 29.93(33.18) 533
T10 T4 + T5 + T6 47.69(43.70) 25.73(30.50) 28.06(32.00) 728
T11 T4 + T5 + T7 (PPFM from TNAU) 40.47(39.53) 22.65(28.43) 24.82(29.90) 609
T12 T4 + T5 + T7 (PPFM from UASD) 39.25(38.81) 21.32(27.51) 23.95(29.32) 588
SEm± 0.871 0.971 0.763 54
CD at 5% 2.578 2.863 2.250 159

F - 105 -
All India Coordinated Research Project on Cotton - Annual Report (2019 – 20)
Table 90. Intensity of diseases in organic cotton production during kharif 2019-20 at RARS, Lam, Guntur
S. No.
Treatment Corynespora leaf spot
Per cent Disease Index
1 Absolute control (No organic or inorganic) 12.67 (20.84)
2 Control (RDN through inorganic) 10.33 (18.72)
3 RD through organic based on P equivalent basis 11.17 (19.51)
4 ST and ST of biofertilizers and FA of PPFM 11.5 (19.82)
5 Neem cake @250kg/ha 10.67 (19.05)
6 Sunhemp /fodder cowpea, incorporated 7.00 (15.34)
7 Intercrop GG/BG/Groundnut/soy 10.33 (18.72)
8 T4+T5 (ST and ST of biofertilizers and FA of PPFM+ Neem cake @250kg/ha) 13.67 (21.68)
9 T4+T6 (ST and ST of biofertilizers and FA of PPFM+ Sunhemp/fodder cowpea, incorporated) 8.67 (17.11)
10 T4+T5+T6 (ST and ST of biofertilizers and FA of PPFM+ Neem cake @250kg/ha+ Sunhemp/fodder cowpea, incorporated)
7.17 (15.51)
11 T4+T5+T7 (ST and ST of biofertilizers and FA of PPFM+ Neem cake @250kg/ha+ Intercrop GG/BG/Groundnut/soy) 10.00 (18.44)
CD (p=0.05) 3.46
CV (%) 19.8

F - 106 -
All India Coordinated Cotton Improvement Project – Annual Report (2019 – 20)
Agron. Vb: Standardization of geometry for Bt varieties: Junagarh Table 91: The incidence of Alternaria leaf spot diseases under different plant spacing: Junagarh
Sr Treatment Alternaria leaf spot(ALS) Percent Disease Index
Mean
1 Suraj Bt with 60 X 15 cm 40.0 (41.5)
2 Suraj Bt with 60 X 30 cm 42.6 (45.8)
3 Suraj Bt with 90 X 15 cm 37.1 (36.7)
4 Suraj Bt with 90 X 30 cm 36.5 (35.3)
5 PKV 081 Bt with 60 X 15 cm 43.7 (47.7)
6 PKV 081 Bt with 60 X 30 cm 45.2 (50.3)
7 PKV 081 Bt with 90 X 15 cm 42.4 (45.5)
8 PKV 081 Bt with 90 X 30 cm 45.4 (50.7)
9 Rajat Bt with 60 X 15 cm 23.3 (15.7)
10 Rajat Bt with 60 X 30 cm 23.7 (16.2)
11 Rajat Bt with 90 x 15 cm 18.4 (10.0)
12 Rajat Bt with 90 X 30 cm 20.5 (12.3)
13 GJHV374 Bt with 60X 15 cm 36.5 (35.3)
14 GJHV374 Bt with 60X 30 cm 24.0 (16.5)
15 GJHV374 Bt with 90 x 15 cm 27.4 (21.3)
16 GJHV374 Bt with 90X 30 cm 30.0 (25.0)
17 Bt hybrid with RD spacing G.COT.HY. 8 BGII 24.1 (16.7)
S. Em ± 2.1 6.0
10.96
C.D. at 5 %
C.V. %
* Transformed value Arcsine transformation

F - 107 -
All India Coordinated Research Project on Cotton - Annual Report (2019 – 20)
Agron. Vc: Enhancing Nitrogen use efficiency in Bt Cotton. Junagarh (GTHH 49 BG II)
Table:92.The intensity of alternaria leaf spot diseases with respect to fertilizer doses : Junagarh
Treatment Bacterial leaf blight
diseases PDI Alternaria leaf spot(ALS)
PDI
1 N0 Control *1.0 (1.0) *30.8 (26.2)
2 100 % of RDN (Band application in 2 splits at Basal & Flowering) 0.7 (0.8) 30.6 (26.0)
3 75 % of RDN (Band application in 2 splits at Basal & Flowering) 0.6 (0.7) 30.7 (26.0)
4 75 % of RDN +Placement (Spot application in 2 splits at Basal & Flowering)
1.0 (1.0) 30.9 (26.3)
5 75 % of RDN + Placement (Spot application in 4 Split: Basal, Squaring, Flowering, Boll development)
0.6 (0.7) 30.9 (26.3)
6 T5 + Foliar application of 1 % urea (3 times: Squaring, Flowering, Boll development)
0.6 (0.7) 31.7 (27.7)
7 T6+raising of Sunhemp / fodder cowpea between rows incorporated before flowering
0.7 (0.5) 31.0 (26.5)
S. Em ± 0.3 0.6
C.D. at 5 % NS NS
C.V. % 20.12 3.43
* Transformed value Arcsine transformation ALS and BLB Grade: 0=Immune, 1=Resistant, 2= Moderately resistant, 3=Moderately susceptible, 4=Susceptible ALS- Alterneria Leaf spot

F - 108 -
All India Coordinated Cotton Improvement Project – Annual Report (2019 – 20)
Concluded Experiment: Table 93. Management of sooty mold (Capnodiumspp.) in cotton (Field Experiment- Spray thrice) Treatment Reduction of sooty mold over control (%) Overall
Coimbatore Junagarh Faridkot Hisar Pooled
17-18 18-19 Pooled 18-19 17-18 18-19 19-20 Pooled 17-18 18-19 19-20
Copper oxychloride (COC) 50 WP @ 0.75 g/litre of water
27.27 17.6 22.4 9.5 25.18 33.3 11.68 23.4 0.39 15.2 11.2 8.9 16.1
Copper oxychloride (COC) 50 WP @ 1.25 g/litre of water
29.69 20.5 25.1 11.8 30.13 66.7 14.14 37.0 3.28 18.6 12.14 11.3 21.3
Copper oxychloride (COC) 50 WP @ 1.75 g/litre of water
51.51 31.8 41.7 11.8 32.4 66.7 27.96 42.4 7.37 20.7 16.43 14.8 27.7
Copper oxychloride (COC) 50 WP @ 2.25 g/litre of water
65.45 43.1 54.3 13.7 41 66.7 37.64 48.4 12.45 31.2 31.43 25.0 35.4
Propiconazole 25EC @ 1ml / litre of water
67.75 34.7 51.2 16.4 23.98 33.3 40.88 32.7 7.79 23.9 19.28 17.0 29.3
Mancozeb 50 WP @ 2.0g / litre of water
21.21 16 18.6 13.7 26.84 33.3 36.07 32.1 9.38 25.9 29 21.4 21.5
Detergent powder @ 5.0 g/litre of water
63.63 25 44.3 1.9 16.95 33.3 15.38 21.9 8.56 16.2 12.85 12.5 20.2
Water spray 7.63 6.3 7.0 7.6 9.05 33.3 9.27 17.2 4.28 14 4.3 7.5 9.8
Control 0 0 0.0 0 0 0 0.0 0 0 - 0.0 0.0

F - 109 -
All India Coordinated Research Project on Cotton - Annual Report (2019 – 20)
Table 94. Pooled effect of management of sooty mold (Capnodiumspp.) on seed cotton yield (Field Experiment- Spray thrice)
Treatments Seed cotton yield (Q/ha) Coimbatore Junagarh Faridkot Hisar
2017 2018 2018 2017 2017 2018 2019 Pooled
T1 Copper oxychloride (COC) 50 WP @ 0.75 g/L of water 10 9.5 27.97 19.43 15.1 21.1 23 18.0
T2 Copper oxychloride (COC) 50 WP @ 1.25 g/L of water 10.2 9.2 28.16 18.52 16.45 22 24 18.4
T3 Copper oxychloride (COC) 50 WP @ 1.75 g/L of water 10.5 9.5 27.52 20.8 17.23 22.4 25 19.0
T4 Copper oxychloride (COC) 50 WP @ 2.25 g/L of water 11 10.7 29.96 24.69 19.8 28 30 22.0
T5 Propiconazole 25EC @ 1ml / Lof water 11.9 9.8 29.7 19.43 17.4 26 28 20.3
T6 Mancozeb 50 WP @ 2.0g /L of water 9 9 29.9 19.66 18.65 26.4 28 20.1
T7 Detergent powder @ 5.0 g/L of water 10.9 9 27.01 18.06 17.8 21.6 23 18.2
T8 Water spray 8.1 8.8 27.14 16.92 16.9 19 20 16.7
T9 Control 7.95 8.5 28.16 16.61 14.5 18 20 16.2

F - 110 -
All India Coordinated Cotton Improvement Project – Annual Report (2019 – 20)