Eye-tracking as a tool in process-oriented reading test ... · Eye-tracking as a tool in...
16
International Electronic Journal of Elementary Education, 2011, 4(1), 153-168. ISSN:1307-9298 Copyright © IEJEE www.iejee.com Eye-tracking as a tool in process-oriented reading test validation Oddny Judith SOLHEIM ∗ National Centre of Reading Education and Reading Research, University of Stavanger, Norway Per Henning UPPSTAD National Centre of Reading Education and Reading Research, University of Stavanger, Norway Abstract The present paper addresses the continuous need for methodological reflection on how to validate inferences made on the basis of test scores. Validation is a process that requires many lines of evidence. In this article we discuss the potential of eye tracking methodology in process-oriented reading test validation. Methodological considerations are highlighted and special significance is placed on the importance of studying the first reading of a text as well as reading while answering questions about it. This point of view expands the traditional scope of eye-tracking methodology in reading research. We conducted a small-scale study in which 18 12-year olds read and answered questions about a multimodal text. In this study comprehension scores were related to allocation of visual attention in two conditions: (i) reading a text passage for the first time; and (ii) rereading of the text passage while answering questions about it. Keywords: reading comprehension, assessment, validity, eye-tracking Introduction In this article we discuss potential uses of eye-tracking methodology in process-oriented reading test validation. Initially we highlight the challenges researchers face in selecting empirical indicators of reading comprehension and in validating assumptions about what is measured. We then discuss the waypoints where eye-tracking methodology may fortify the empirical foundation for the construction of, research on and validation of reading assessments. Further, methodological considerations are discussed, and results from a small- scale study in which students read and answered questions about a multimodal text are used as example material. ∗ Oddny Judith Solheim, National centre of reading education and reading research, University of Stavanger, 4036 Stavanger, Norway. fax: +47 51 83 32 50. E-Mail: [email protected]
Transcript of Eye-tracking as a tool in process-oriented reading test ... · Eye-tracking as a tool in...

International Electronic Journal of Elementary Education, 2011, 4(1), 153-168.
ISSN:1307-9298
Copyright © IEJEE
www.iejee.com
Eye-tracking as a tool in process-oriented
reading test validation
Oddny Judith SOLHEIM ∗∗∗∗ National Centre of Reading Education and Reading Research,
University of Stavanger, Norway
Per Henning UPPSTAD National Centre of Reading Education and Reading Research,
University of Stavanger, Norway
Abstract
The present paper addresses the continuous need for methodological reflection on how to validate
inferences made on the basis of test scores. Validation is a process that requires many lines of
evidence. In this article we discuss the potential of eye tracking methodology in process-oriented
reading test validation. Methodological considerations are highlighted and special significance is
placed on the importance of studying the first reading of a text as well as reading while answering
questions about it. This point of view expands the traditional scope of eye-tracking methodology in
reading research. We conducted a small-scale study in which 18 12-year olds read and answered
questions about a multimodal text. In this study comprehension scores were related to allocation of
visual attention in two conditions: (i) reading a text passage for the first time; and (ii) rereading of the
text passage while answering questions about it.
Keywords: reading comprehension, assessment, validity, eye-tracking
Introduction
In this article we discuss potential uses of eye-tracking methodology in process-oriented
reading test validation. Initially we highlight the challenges researchers face in selecting
empirical indicators of reading comprehension and in validating assumptions about what is
measured. We then discuss the waypoints where eye-tracking methodology may fortify the
empirical foundation for the construction of, research on and validation of reading
assessments. Further, methodological considerations are discussed, and results from a small-
scale study in which students read and answered questions about a multimodal text are
used as example material.
∗ Oddny Judith Solheim, National centre of reading education and reading research, University of Stavanger,
4036 Stavanger, Norway. fax: +47 51 83 32 50. E-Mail: [email protected]

International Electronic Journal of Elementary Education
154
In the 1980s, the psychological tradition of reading comprehension assessment was
criticized for taking too little heed of what new, cross-disciplinary insights into reading told
us about how readers construct meaning in texts (see Valencia & Pearson, 1987 for a
summary of this criticism). Since the 1980s, however, reading assessment has undergone
substantial changes in order to integrate new ways of defining reading. Nevertheless, the
major challenge in reading comprehension assessment remains the choice of empirical
indicators of a theoretical concept which is, in principle, impossible to measure. Since we
cannot observe ‘comprehension’, we must make readers do something to indicate what and
how well they have understood (Johnston, 1984). Although many methods of assessment
have been explored over this period of time, the most common way of assessing reading
comprehension is still to make readers answer questions about a text passage they have
read. Answers to questions are indirect measures of reading comprehension that rely on
assumptions of what is measured by different types of questions and different item formats.
Test items can, for instance, be designed in order to test appointed skills, comprehension
processes or reading strategies. One example of this is the four comprehension processes
used for item development in the Progress in International Reading Literacy Study (PIRLS – a
study to assess reading comprehension in 10-year-olds): (1) focusing on and retrieving
explicitly stated information, (2) making straightforward inferences, (3) interpreting and
integrating ideas and information, and (4) examining and evaluating content, language and
textual elements (Mullis, Kennedy, Martin & Sainsbury, 2006). The recurring discussion of
whether multiple-choice and constructed response items test different kinds of literacy and
comprehension abilities is also a part of this discussion (Campbell, 2005; Solheim, 2011).
Assessment frameworks often include statements about the kind of comprehension
processes or reading strategies that are tested, but when it comes to interpreting score
meaning we still face challenges (Messick, 1995; Pearson & Ham, 2005; Solheim & Skaftun,
2009). Messick's (1988, 1995) view of construct validity is based on an integration of any
evidence that bears on the interpretation or meaning of test scores, It includes content- and
criterion-related evidence as subsumed parts of construct validity. Construct validation is
thus a process that requires many lines of evidence. Consistent with this, Campbell (2005)
has questioned whether a content focus (text type and topic), common in studying construct
representation in educational tests, is sufficient for reading. Campbell claims that reading
can be viewed as a unique construct among the many that are typically assessed using
educational tests: “it is, perhaps, a construct that has more to do with the process than the
accumulation of a knowledge base. As such, questions about the construct representation of
reading assessment instruments […] must always include some focus on the cognitive
process underlying test-taker performance.” (Campbell, 2005, p. 352) This point of view is in
line with Johnstons (1984) and Messick's (1995) emphasis on the importance of analysing the
processes underpinning item or task performance in educational assessment. Messick
defines validity as “an overall evaluative judgement of the degree to which empirical
evidence and theoretical rationales support the adequacy of inferences and actions on the
basis of test scores or other modes of assessment” (p.741). Although important, product-
oriented test validation offer little detail with respect to the problem-solving approaches
used by test takers (Tai, Loehr & Brigham, 2006). In 1930 McAllister (in Afflerbach, 2000)
described the problem of indentifying reading process through inferences based on
products such as reading test scores. This problem was later described in detail by Alderson
(2000) and Allan (1992), among others.
Given the criticism of product oriented test validation, however, the solution to the
problem is subject to dispute within the research community. As regards the difficulty of
observing reading comprehension, it has been claimed that externalisation of the process of

Eye-tracking as a tool / Solheim & Upstadd
155
reading may be the only way to make it capable of inspection (e.g. introspection). Several
researchers have used introspection methodologies like think-aloud protocols to investigate
skills, processes and/or strategies that might be used by students when answering items in
reading tests (Allan, 1992; Campbell, 2005; Cordon & Day, 1996; Farr, Pritchard & Smitten,
1990; Langer, 1987; Li, 1992). In think-aloud protocols readers are asked to say whatever they
are looking at, thinking of, doing and feeling as they go about solving the tasks. An
underlying assumption in this kind of methodology is that participants are in fact aware of
the vital features of the process, either during the activity or in retrospect. This assumption
has also been questioned. For instance, Afflerbach and Johnston (1984) note that while some
participants may not have sufficient metacognitive awareness of their reading processes to
report on them, others may have lost the ability to report on processes that have been
“automatized”. Another objection has been that reporting process might interfere with the
reading process, and as such risks distorting and changing the nature of the process
(Alderson, 2000; Ericsson & Simon, 1984).
Eye-tracking represents a methodology that gives us an alternative window into
comprehension process and problem solving behaviour and can supplement a validation
process. By using eye-tracking methodology to externalise parts of the reading process in
the form of records of eye-movement patterns, we can explore how comprehension scores
are related to actual behaviour. Eye-movement recordings of reading on a discourse level
yield an on-line record of the reading process in the form of information about what readers
visually focus on in the text passage and for how long they inspect different passages. In an
assessment situation eye-tracking data can provide on-line information about readers`
decisions to search the text in order to give answer to a question, and about how accurate
and effective that search is (e.g., the percentage of time reading relevant information or the
use of that information to answer the question).
It has been shown that there is a close relationship between where the eyes gaze and
where attention is directed during the processing of visually presented information (see
Rayner, 1992), an assumption often referred to as the eye-mind assumption (Just &
Carpenter, 1980). The eye mind assumption has been criticized for relying too much on
experiments in laboratories without strong support from studies of natural behaviour. Land
& Tatler (2009) for instance claim that visual focus in natural behaviour and action is
characterized by optimizing focus in order to delimit uncertainties in the total visual scene,
rather than a strong cognitive focus. This criticism taken into account, it seems obvious that
some reading challenges are more suitable to eye-tracking methodology than others.
Multimodal reading material is becoming increasingly important to master (Kress & van
Leeuwen, 2001), and it has been claimed that this type of reading should be reflected in
assessment instruments to a greater extent (Johnson & Kress, 2003). According to Kamil
(2004) new work on multimedia displays has generated renewed interest in eye movements.
An understanding of multimodal texts presupposes integration of visual stimuli that are
dispersed on a fixed, two dimensional, surface, and therefore require looking at the specific
elements. We found reading of this type of text a natural starting point for exploring the
potential of eye-tracking in reading test validation.
Eye-tracking methodology has been widely used for reading (for a review see Rayner,
1998) but largely ignored in educational assessment and reading assessment. Paulson and
Henry (2002) and Tai et al. (2006) represent important exceptions. Paulson and Henry used
eye-tracking methodology in order to investigate claims set forward by the test developers
of the Degrees of Reading Power (DRP). The DRP is a commercially available testing program
that originally claimed to measure the reading comprehension process, as opposed to the
product of reading. The modified cloze setup of the DRP was intended to reflect and

International Electronic Journal of Elementary Education
156
measure the process of reading, and Paulson and Henry wanted to explore: “[…] the ways in
which students` reading process during the DRP might, or might not, resemble the reading
process at work in their reading of materials so that we might evaluate the claims made by
the publishers of the DRP” (p. 235). The results of the study showed that the eye movements
of participants taking the DRP did not in any way correspond to their reading of unclozed
passages. Paulson and Henry concluded that the DRP appeared to cause readers to radically
alter their reading process in order to complete the assessment successfully. In 2006, Tai et al.
reported results from a pilot study that highlighted problem-solving behaviour during a
multiple-choice science assessment. In this study the authors demonstrate how eye-
movements differed in a consistent fashion for individuals with known differences in
expertise. The study by Paulson and Henry is an example of how we can use eye tracking
data to validate assumptions about what we really measure with different assessment tasks.
The Tai et al. study is also relevant as it gives an example of how eye tracking methodology
can be used to validate that assessment tasks really discriminate between participants at
different level of the assessed skill or subject.
An assessment of reading comprehension where students answer questions about a text
passage they have read include one or more text passages and a set of test items. This differs
from assessments in many other domains where assessments consist of little or no stimuli
(for instance text passages or pictures) beyond the test items. The former mentioned science
assessment studied by Tai et al. (2006) is an example of this. In such forms of assessments,
studying problem solving behaviour during answering is sufficient. However, a focus solely
on the problem solving process during answering might turn out to be insufficient when it
comes to the most usual form of reading comprehension assessment: reading a text passage
and answering questions about it. In this kind of setting, both the first reading of the text and
the rereading of it while working with specific questions will contribute to the readers’
comprehension of what is read. As such, both of these conditions may represent important
sources of information about the reading comprehension process.
Several eye-tracking studies have focused on the initial reading of a text (see Rayner,
1998). In some of these studies observed reading behaviour was related to subsequent
measures of recall or reading comprehension (Hannus & Hyönä, 1999; Hyönä, Lorch &
Kaakinen, 2002). In eye-tracking studies of this kind the participants are often given
unspecified or global purposes for reading (such as having been told to study the text
passage in order to be able to answer questions or summarize it). However, several studies
have shown that the perspective which is active during reading guides the readers’
attentional resources leading to more carefully processing of perspective-relevant
information in the text than perspective-irrelevant information (Goetz, Schallert, Reynolds &
Radin, 1983; Kaakinen & Hyönä, 2005; Rothkopf & Billington, 1979). In order to investigate the
kind of reading behaviour that is associated with successful reading comprehension, we
should therefore expand the scope to include the interaction with text while answering
specific questions.
In studies of task-oriented reading the interaction with a text passage on a given task is
the main focus. Vidal-Abarca, Mãná & Gil (2010) describe task-oriented reading as: “ (...)
situations in which a reader reads one or more texts while knowing in advance that he or she
has to perform a task for which the texts are a crucial and available source of information” (p.
817). They further mention two essential characteristics of readers involved in task-oriented
reading: only information that is pertinent to the task performance is relevant to the reader,
and the reader interacts with the text on a task, going back and forth from the text to the
task and vice versa.

Eye-tracking as a tool / Solheim & Upstadd
157
Text availability has often been discussed in connection with reading tests (see, for
instance Alderson, 2000). Andreassen & Bråten (2010) found that tests consisting of longer
passages answered without access to relevant text increased the predictive power of
working memory in reading comprehension scores. Ozuru, Best, Bell, Witherspoon &
McNamara (2007) have suggested that with-text comprehension questions may be more
suitable for assessing readers’ ability to engage in strategic processing related to specific
reading goals. Task-oriented reading, where students have access to the text while searching
for information and constructing meaning, is now a common activity in educational settings
as well as in assessment settings, and Reading Literacy as it is measured in Progress in
International Reading Literacy Study (PIRLS), Program for International Student Assessment
(PISA), Assessment of Adult Literacy (ALL) and International Adult Literacy Survey (IALS) is
based on text availability.
Some task-oriented reading activities require students to decide what to read first, the
task or the texts. If allowed to choose, students also differ in that some students read the
questions before they read the text passage, while other students choose to read the text
passage first (Salmerón, Vidal-Abarca, Martínez, Maña, Gil & Nauman, 2011). In our study we
designed a task in which readers first read the text and then were allowed to search the text
to answer the questions. This kind of design has been used in studies of task-oriented
reading activities (Vidal-Abarca et al., 2010) and also in studies of reading assessment (Ozuru
et al., 2007; Ozuru, Dempsey & McNamara, 2009). In an assessment situation like this we
suggest that arriving at a correct answer to a question about the text could be the result of 1)
the first general read-through, 2) task oriented reading while answering the particular
question or 3) a combination of reading in both these conditions. We therefore split the
analysis into two main units: the first reading of the text and task-oriented reading while
answering questions.
The stimulus text consisted of both verbal text and illustration. By tracking children’s
allocation of visual attention we explored what parts of the text passage they read to answer
questions that required integration of text and illustration. The underpinning theoretical
assumption was that, in order to give a correct answer to the question, the student had to
use and integrate information both from the verbal text and from the illustration – in other
words, that a correct answer to the question presupposed a given reading behaviour. With a
product-oriented approach, a comprehension score would be evidence of the integration of
different modalities. By using eye-tracking methodology we related these scores with actual
behaviour, and explored to what extent our assumptions about how such tasks have to be
solved were reflected in students’ eye-movement patterns. We expected that both
conditions of reading would have an impact on comprehension of the text, and that
students’ performance would show diversity in how they exploited the two conditions.
Methods
Participants
Thirty-four students in seventh grade (mean age 12.75 years) from a medium-sized
Norwegian school took part in the study. The sample included 47% female students. We
wanted to reduce the likelihood of differences in behaviour and scores being attributable to
individual differences in word-reading ability or overall intellectual ability, so 18 students in
the centre of the normal distribution on a non-verbal intelligence test, Raven Progressive
Matrices (Raven, 1958; Raven, Court & Raven, 1988), and a word-chain test, Ordkjedeprøven
(Høien & Tønnessen, 1998) were selected.
Eye-tracking apparatus

International Electronic Journal of Elementary Education
158
The equipment used was iView X HED with a Polhemus headtracker from SMI. This tracker
had 50Hz sampling, measuring on the reader’s dominant eye. One advantage of this tracker
is that readers can move their head and body relatively freely. Gaze position accuracy is <
0.5° (typ.).
Text and questions
The text passage was taken from Globusserien: Naturfag 7 (Johansen & Steineger, 1999), a
7th-year science book. The subject of the passage was ‘The Human Ear’, and the passage
contained both verbal text and illustrations, including captions (see Figure 1). The verbal text
described the structure of the ear in a sequential manner, from its outermost to its innermost
parts. One of the illustrations was a drawing of the ear where some parts were named in
captions. Comprehension of the verbal text was dependent to a large extent on this
illustration, and vice versa, but the connection between the text and the illustration was
unmarked (the connection was not marked explicitly by means of textual reference, labels or
arrows). The reader had to gather both verbally and pictorially presented information from
different sections of the page and integrate them into a coherent whole. To accomplish this,
the reader had to decide in what order to study the materials – or, in other words, what
segments were linked together in terms of content.
Figure 1. The text passage
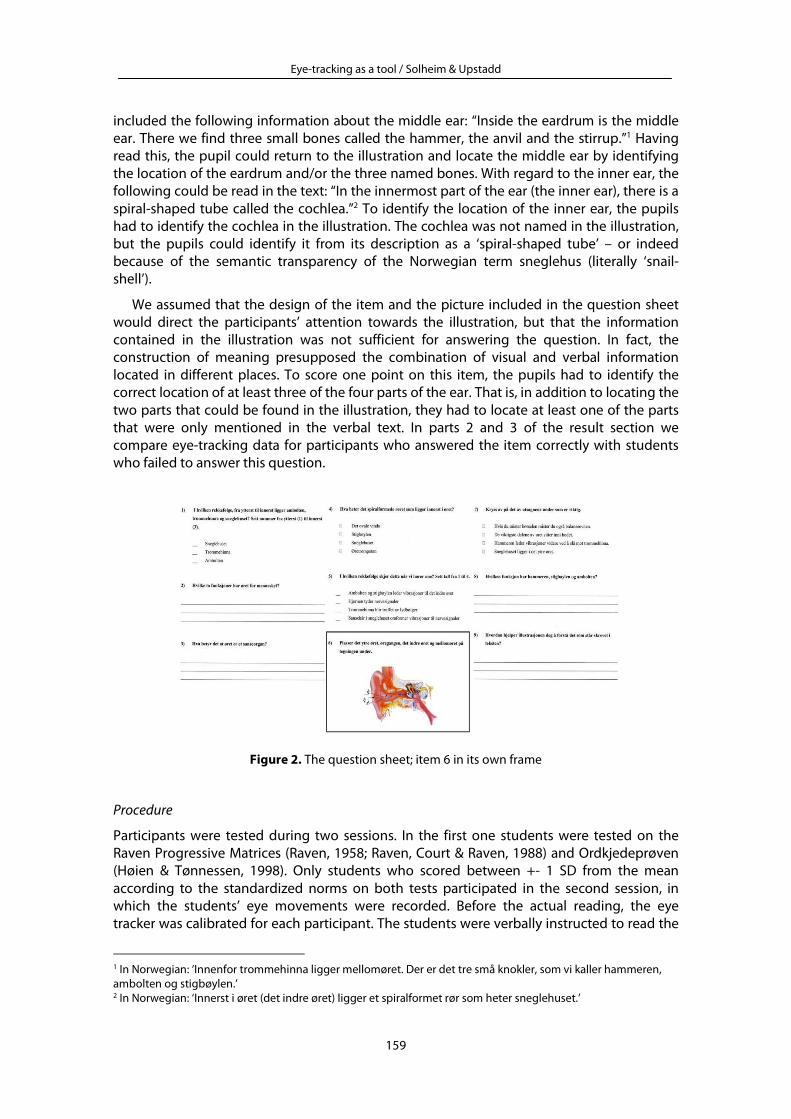
The assessment was based on a mixture of constructed-response and multiple-choice items
(see Figure 2). The analyses of task-oriented reading in condition 2 focused specifically on the
pupils’ reading in relation to item 6 (see frame in Figure 2). In this item pupils were asked to
identify the locations of the outer ear, the ear canal, the middle ear and the inner ear on a
drawing.
The item was designed to capture whether the pupils were able to understand and
employ a rather complex interaction between text and illustration. The location of the outer
ear and the ear canal could be found (marked with captions) in the illustration in the text
passage. The middle ear and the outer ear were not named in the illustration, but their
locations were mentioned in the verbal text. To identify their locations, the pupils had to
combine information from the verbal text with information from the illustration. The text
Eye-tracking as a tool / Solheim & Upstadd
159
included the following information about the middle ear: “Inside the eardrum is the middle
ear. There we find three small bones called the hammer, the anvil and the stirrup.”1 Having
read this, the pupil could return to the illustration and locate the middle ear by identifying
the location of the eardrum and/or the three named bones. With regard to the inner ear, the
following could be read in the text: “In the innermost part of the ear (the inner ear), there is a
spiral-shaped tube called the cochlea.”2 To identify the location of the inner ear, the pupils
had to identify the cochlea in the illustration. The cochlea was not named in the illustration,
but the pupils could identify it from its description as a ‘spiral-shaped tube’ – or indeed
because of the semantic transparency of the Norwegian term sneglehus (literally ‘snail-
shell’).
We assumed that the design of the item and the picture included in the question sheet
would direct the participants’ attention towards the illustration, but that the information
contained in the illustration was not sufficient for answering the question. In fact, the
construction of meaning presupposed the combination of visual and verbal information
located in different places. To score one point on this item, the pupils had to identify the
correct location of at least three of the four parts of the ear. That is, in addition to locating the
two parts that could be found in the illustration, they had to locate at least one of the parts
that were only mentioned in the verbal text. In parts 2 and 3 of the result section we
compare eye-tracking data for participants who answered the item correctly with students
who failed to answer this question.
Figure 2. The question sheet; item 6 in its own frame
Procedure
Participants were tested during two sessions. In the first one students were tested on the
Raven Progressive Matrices (Raven, 1958; Raven, Court & Raven, 1988) and Ordkjedeprøven
(Høien & Tønnessen, 1998). Only students who scored between +- 1 SD from the mean
according to the standardized norms on both tests participated in the second session, in
which the students’ eye movements were recorded. Before the actual reading, the eye
tracker was calibrated for each participant. The students were verbally instructed to read the
1 In Norwegian: ‘Innenfor trommehinna ligger mellomøret. Der er det tre små knokler, som vi kaller hammeren,
ambolten og stigbøylen.’ 2 In Norwegian: ‘Innerst i øret (det indre øret) ligger et spiralformet rør som heter sneglehuset.’

International Electronic Journal of Elementary Education
160
textbook passage in order to be able to answer some questions about it afterwards. It was
explicitly mentioned that they could look at both the verbal text and the illustrations. The
students were given unlimited time to study the passage. When a pupil reported that he or
she had finished reading the text passage, he or she was given a question sheet containing a
mixture of multiple-choice and constructed-response items. The pupils were given unlimited
time to answer the questions. They had access to the text passage and were allowed to look
back at it while answering the questions.
Results and Discussion
The presentation of the results is divided into three parts. In Part 1, latent response times and
outcome scores for the whole group are presented. The relationship between time spent and
total score is also analysed. Parts 2 and 3 use reading behaviour such as it manifests itself
through eye movements to investigate relationships between reading behaviour and test
performance. In Part 2, gaze duration and integrative saccades are analysed. We investigate
the extent to which pupils who answered the item successfully exhibited a reading
behaviour different from that of the pupils who did not. In Part 3, we qualitatively explore
characteristics of reading behaviour by comparing the first reading with reading while
answering the question.
Part 1
The sample was relatively homogeneous with regard to word-reading ability and intellectual
ability. However, the data on time spent and total scores show that the pupils differed with
regard to how much time they spent and how well they used their time (Table 1). Total score
refers to a sumscore based on answers to all the questions on the assessment sheet.
Maximum score was 9 points. The participants' total scores varied between 2.5 and 8 points,
and the mean score was 5.5. The time spent in Condition 1 (reading the text passage for the
first time) varied between 1.3 minutes and 2.9 minutes, with a mean time of 1.9 minutes. The
time spent in Condition 2 (answering the questions) varied between 5.4 minutes and 14.9
minutes, with a mean time of 8.3 minutes. There was thus greater variation in how much
time the pupils spent on answering the questions (the SD is 29% of the mean) than in how
much time they spent on the first reading (the SD is 18.9% of the mean). This indicated that
differences in how the pupils constructed meaning would be possible to identify both when
they were reading the text for the first time and when they were reading it to answer the
questions, which supported the choice of focusing on both conditions.
Table 1. Outcome score (points) and latent response times (minutes)
Mean SD Minimum Maximum
Outcome score 5.5 1.8 2.5 8.0
Response time, condition 1 1.9 0.4 1.3 2.9
Response time, condition 2 8.3 2.2 5.4 14.9
Total response time 10.3 2.2 6.6 16.9
There were no statistically significant correlations (Spearman´s rho) between total score and
time spent either in Condition 1 (r = .25, n = 18, p =.31), in Condition 2 (r = .19, n = 18, p = .46)
or in Conditions 1 and 2 taken together (r = .20, n = 18, p = .43).In other words, there was no
significant relationship between how much time pupils spent on reading the text or on
answering the questions and how well they scored on the items. In the analyses in Parts 2
and 3, we will take a closer look at the relationship between reading behaviour as manifested
in eye movements and test performance.

Eye-tracking as a tool / Solheim & Upstadd
161
Part 2
We divided the pupils into two groups. Item 6 was chosen as the basis for stratification as it
demanded a complex reading behaviour (see method section). The ‘1p Group’ consisted of
those who scored one point on Item 6 (n = 8); and the ‘0p Group’ consisted of those who did
not score any points on Item 6 (n = 10). The mean total score of the 1p Group was 6.4 (SD =
1.5) while the mean total score of the 0p Group was 4.7 (SD = 1.6), and this difference was
statistically significant (p < .023). The aim of this grouping was to explore how scores related
to actual behaviour: did pupils in the 1p Group divide their attention between text and
illustration differently from the pupils in the 0p Group?
The eye-tracking measurements are based on gaze durations, that is, total time spent
on different segments of the textbook passage. Gaze durations were categorised according
to areas of interest that were defined around the informational elements (see Figure 3).
These areas of interest were the following: the verbal text as a whole (I), verbal text relevant
to item 6 (shaded area in I), the illustration as a whole (II) and illustration relevant to Item 6
(shaded area in II). Gaze durations for each of the 18 participants were categorised using the
areas of interest in two conditions – Condition 1: First reading of the text passage; and
Condition 2: Task oriented reading while answering the question.
Figure 3. Areas of interest in the analysis. Areas marked I = verbal text, areas marked II = illustration.
Shaded areas indicate relevant parts of text and illustration respectively
To score one point on the item, the pupils had to locate correctly at least one of the two
parts of the ear that were named only in the verbal text, in addition to the two parts that
could be identified using the illustration. We hypothesised that the pupils in the 1p Group
divided their attention between the verbal text and the illustration, while those in the 0p
Group used mainly the illustration to answer the question. We therefore examined whether
there were any differences in how much time the two groups spent on the verbal text while
answering the question.

International Electronic Journal of Elementary Education
162
In addition to having paid attention to information both in the verbal text and in the
illustration, the 1p Group integrated information from the two modalities. In itself, the fact
that a pupil has divided his or her attention between the text and the illustration does not
necessarily mean that he or she has integrated the information from the different modalities.
Hannus and Hyönä (1999), Holmqvist, Holmberg, Holsanova, Tärning and Engwall (2006) and
Holsanova, Holmberg and Holmqvist (2005) have suggested ‘integrative saccades’ as an
indication of bimodal integration. Integrative saccades are transactions between
semantically related segments of verbal text and illustration. If there are no integrative
saccades, we can assume that the verbal text and the illustration are being read separately. In
our study, we defined integrative saccades as saccades following more than one fixation in
the text segment of departure and followed by more than one saccade in the text segment
of arrival. We examined whether there were any differences between the two groups in the
number of integrative saccades made while answering the question. Such reading behaviour
may reflect the fact that pupils who answered the question correctly had discovered links
between the various parts of the text passage already at their first reading of it. That is why
we also investigated if there were any differences between the groups in the number of
integrative saccades during the first reading.
Table 2. Hypotheses and Results: Differences between The 1p Group and the 0p Group. Condition
1= Reading the Text for the First Time, Condition 2= Problem Solving During Answering
Questions.
Condition 1 Mann-Withney U-test
Do pupils in the 1p Group have a significantly
larger number of integrative saccades between
illustration and verbal text than pupils in the 0p
Group?
No significant difference between 1p (M =
4.13, SD = 2.75) and 0p (M = 6.4, SD = 5.15); t
(18) =, p =.280
Do pupils in the 1p Group have a statistically
significantly larger number of integrative saccades
between relevant illustration and relevant verbal
text than pupils in the 0p Group?
No significant difference between 1p (M = 0,
SD = 0) and 0p (M = 1.8 SD = 3.23) t (18) = , p =
3.15
Table 2. Hypotheses and Results: Differences between The 1p Group and the 0p Group. Condition
1= Reading the Text for the First Time, Condition 2= Problem Solving During Answering
Questions.
Condition 2 Mann-Withney U-test
Do pupils in the 1p Group have significantly
longer gaze durations on verbal text than pupils
in the 0p Group?
No significant difference between 1p (M = 10.62,
SD = 17.35) and 0p (M = 6.74, SD = 9.93); t (18), p
=.505
Do pupils in the 1p Group have significantly
longer gaze durations on relevant verbal text
than pupils in the 0p Group?
No significant difference between 1p (M = 7.23,
SD = 12.47) and 0p (M = 5.47, SD =9.3); t (18) =, p
=.302
Do pupils in the 1p Group have a statistically
significantly larger number of integrative
saccades between illustration and verbal text
than pupils in the 0p Group?
No significant difference between 1p (M = 1.88,
SD = 2.59) and 0p (M = 0.80, SD = 1.23); t (18) = , p
=.433
Do pupils in the 1p Group have a statistically
significantly larger number of integrative
saccades between relevant illustration and
relevant verbal text than pupils in the 0p Group?
No significant difference between 1p (M = 1.63,
SD = 2.26) and 0p (M = 0.60, SD = 1.08); t (18) =, p
=.312

Eye-tracking as a tool / Solheim & Upstadd
163
As table 2 shows, there were no statistically significant differences for any of these variables
between the pupils who scored one point on item 6 and those who did not. Separate
analysis of the two conditions showed that some pupils divided their attention equally
between the text and the illustration yet obtained different comprehension scores
Part 3
In part 3 we exploit the product measure on item 6 and the process information obtained
from part 2 in order to explore the relationship between reading with a global purpose and
task oriented reading. Participants were categorised based on their score on item 6 (product)
and the extent to which they had used the verbal text while answering the same item
(process). The groups were given designations based on qualitative interpretation of
characteristic behaviour. The new categorisation yielded four groups:
Task-oriented readers: Pupils who scored 1 point on Item 6 and who read the relevant parts of
the verbal text while answering the question (n = 4);
Effortful readers: Pupils who scored 0 points on Item 6 but who read the relevant parts of the
verbal text while answering the question (n = 4),
First-time readers: Pupils who scored 1 point on Item 6 but who did not read the relevant
parts of the verbal text while answering the question (n = 4),
Non-strategic readers: Pupils who scored 0 points on Item 6 and who did not read the
relevant parts of the verbal text while answering the question (n = 6).
Table 3 shows certain similarities between First-time and Non-strategic readers, on one hand,
and Task-oriented and Effortful readers on the other hand. The members of the first two
groups did not look at the verbal text while answering item 6, but focused instead on the
illustration. Common to the pupils in the latter two groups is that they focused on both the
verbal text and the illustration while answering item 6.
Table 3. Problem-solving behaviour while answering Item 6. Arrow indicates process,
vertical line identifies end of process and asterisk shows obtained product measure.
1:
read
question
2:
search
illustration
3:
write part
of answer
4:
return to
illustration
5:
read
verbal
text
6:
fulfil correct
answer
First-time
readers → → →│ *
Non-strategic
readers → → →│
→
→│
Task-oriented
readers → → → → → *
Effortful
readers → → → → →
First-time readers and Non-strategic readers
The First-time readers and the Non-strategic readers went through the same steps while
answering the question (see Table 3), but yet they ended up with different comprehension
scores. None of the pupils in these two groups used information from the verbal text while
answering the question, and yet the First-time readers managed to answer the question

International Electronic Journal of Elementary Education
164
correctly whereas the Non-strategic readers did not. A closer look at their first reading of the
text helped us understand this difference.
First-time readers spent more time on the first reading of the text than the Non-Strategic
readers, with an average reading time of 138 seconds versus 108 seconds. First-time readers
also distributed their attention to a greater extent across the various parts of the text
passage. As a share of total reading time, the pupils in this group devoted, on average, 71.4
per cent to the verbal text and 23.3 per cent to the illustration. By contrast, Non-strategic
readers spent, on average, 81.5 per cent of their time on the verbal text and 10.2 per cent on
the illustration.
Another interesting measure relates to the share of time devoted to the relevant text.
First-time readers spent 50.4 per cent of their total time in the verbal text on relevant text
while Non-strategic readers spent 40 per cent. Here, however, it should be noted that the
‘area of interest’ which we defined in relation to item 6, as ‘relevant text’ also happens to be
the most complex section of the entire text passage. The difference between the two groups
may indicate that First-time readers were more likely to adjust their reading speed to the
difficulty of the text. At the same time, though, it also indicates that the First-time readers
had worked more persistently than Non-strategic ones during their first reading of the text
passage, and this thoroughness paid off when they went on to answer the questions.
The eye-movement recordings made during the first reading showed that the two groups
had different starting-points when they went on to answer the questions. First-time readers
seemed to have laid a foundation during their first reading, which made their problem
solving during the answering phase sufficient. We cannot rule out the possibility that First
time readers had prior knowledge about the ear that helped them answer the question.
Answering the question successfully demands rather detailed and specific knowledge, and if
these readers exhibited this kind of prior knowledge it should have been reflected in their
total score. However, First time readers did not outperform the other pupils in total score,
which led us to assume that it was their reading during condition 1, and not prior
knowledge, that led them to the correct answer on this specific item. Non-strategic readers
did not have an equally good starting-point when it came to solving the task. It was also
characteristic of Non-strategic readers that once they had searched for the answer in the
illustration they ran out of solution methods. Some of them gave up quickly when they failed
to find the information they were looking for in the illustration, while others continued to
search the illustration even though this did not yield any results. The latter pupils were
caught in a loop between the question and the illustration, doing something that did not
work.
Task-oriented readers
As the First-time readers, the Task-oriented readers managed to answer item 6 successfully,
but they solved the task in a different way. While First-time readers scarcely used the verbal
text at all, Task-oriented readers devoted on average 16.7 per cent of their “work-with-item 6
time” to the verbal text. The Task-oriented readers used slightly more time to answer the
question, and spent a larger share of their time on the text passage (37.6% versus 18.3%).
Task-oriented readers used both the verbal text and the illustration, and they had a larger
number of integrative saccades and moves between the stimulus sheet and the question
sheet than the First-time readers. To sum up, Task-oriented readers seemed to be more
active while answering the questions than First-time readers. When we looked at their first
reading of the text passage, however, the opposite picture emerged: Task-oriented readers
spent less time on their first reading, they spent a smaller share of their time on the
illustration (16.3% versus 23.3%), they devoted a smaller share of the total time spent on the
Eye-tracking as a tool / Solheim & Upstadd
165
verbal text to relevant text (43.5% versus 50.4%), and they had fewer integrative saccades
(1.5 versus 5.0). This may indicate that pupils in the two groups ‘did the work’ at different
times. First-time readers were more thorough in their first reading and thus had less need to
go back to the text while answering the questions. Task-oriented readers did a somewhat
quicker first reading and then let the individual questions govern their further reading.
Effortful readers
The Effortful readers had a response process which was substantially similar to that
characteristic of Task-oriented readers. The Effortful readers spent most time of all on
answering the question, and they used all the relevant parts of both the verbal text and the
illustration while answering. In fact, the Effortful readers ‘ought to have had’ the information
they needed to answer the question correctly, but still they didn’t. These pupils exhibited a
preparedness in their encounter with the text that indicated that they were capable of
finding their way in it, identifying the relevant parts of it and integrating information from its
various elements – ‘they were almost there’.
The two groups who consisted of pupils who succeeded on item 6 were the groups with
the best total scores. The Task-oriented readers had an average total score of 7.5 points, and
the First-time readers scored 6.3 points on average. First-time readers made a thorough first
reading and seemed to trust in this first reading when they answered the questions. The
Task-oriented readers appeared to use their first reading to gain an overview of the text and
its various parts, and then let the individual questions govern their further reading. The Non-
strategic readers, with 4.3 points, have the lowest total score of all groups. These pupils also
used the least (total) time and displayed a limited range of reading strategies. The Effortful
readers, whose reading behaviour showed that they worked assiduously and had strategies
available to them, but who nevertheless did not manage to exploit these strategies fully,
scored 4.8 points on average.
The goal of this example was to explore how eye tracking methodology could add to our
understanding of what we measure in reading comprehension tests, and how we should go
about to accomplish this. By exploring how students responded to an item that demanded
the integration of text and illustration, we could confirm that this particular reading
comprehension question, item 6, tap the kind of reading behaviour that we assumed it
would. In addition, it also gives us a more nuanced picture of those who did not succeed.
Beyond the binary value of right or wrong on the product measure, we get a more nuanced
picture of what different pupils need concerning pedagogical approach. This shows a
potential usefulness of this type of study in reading test validation.
However, the discovery of the need to analyse both the pupils’ first reading and their
reading while answering, and comparing behaviour in these two contexts, has important
methodological consequences for further research. If we examine only what takes place
while participants are working on tasks or while they are reading the text for the first time,
we risk drawing the wrong conclusions about the kind of reading behaviour that is
associated with solving the task. This should be kept in mind in future eye-tracking studies,
but also in studies that use other methodologies, for instance think-alouds. In the current
situation no single approach to studying reading process is widely acknowledged. In this
situation results should be triangulated with information from complementary
methodologies. For instance if we record eye movements during reading and answering,
and then replay the recording as basis for a verbal retrospection interview with the reader,
we would have an undisturbed recording of reading, and in addition the readers’ verbal
protocol of what is going on.

International Electronic Journal of Elementary Education
166
Concluding remarks
The pupils who solved the task correctly used both the verbal text and the illustration, but at
different times. While some of the pupils ‘did the work’ during their first reading, others did it
while answering the questions. The results presented in Part 3 helped us understand why the
approach in Part 2 yielded contradictory information. First, the grouping in Part 2 was based
on product measures, and the same comprehension score turned out to conceal very
different behavioural patterns. Moreover, each condition was analysed separately. In Part 3,
the pupils were divided into groups based on both product and process measures, and their
behaviour during the first reading and while answering the questions, respectively, were
seen in context. This way of studying the pupils’ reading contributed to creating a far more
nuanced picture of how different pupils go about constructing meaning in the text than
what the approach used in Part 2 was capable of yielding.
In his comprehensive book on reading assessment Alderson (2000) refers to a study by Li
(1992). Li used introspection data to show that there were a discrepancy between test
constructers’ intentions in constructing questions and students reported behaviour in
answering them. Li grouped his results as predicted and unpredicted. Predicted results were
(i) the expected skill leading to a correct answer; and (ii) unexpected skills leading to a wrong
answer. Unpredicted results were (i) the expected skill leading to a wrong answer; and (ii) the
unexpected skill leading to a correct answer. If we employ Li´s concepts about predicted and
unpredicted results on the results in our study; the predicted results would be: (i) task-
oriented readers who looked at both text and illustration during answering leading to a
correct answer and (ii) non-strategic readers who only looked at the illustration during
reading leading to a wrong answer. The unpredicted results would be: (i) effortful readers
who looked at both text and illustration during answering leading to a wrong answer and (ii)
first time readers who only looked at the illustration during answering leading to a correct
answer. Eye-tracking data from the first reading of the text, however, nuanced these results.
A reasonable conclusion then would be that what students do during answering cannot be
seen in isolation. The way in which a student has read a text for the first time will probably
influence on his or her problem solving behaviour.
Taken together, the combination of product scores and the recording of both reading
and answering gives us a stronger empirical foundation for validation of score meaning in
reading comprehension assessments. Over the history of science there are numerous
examples of how the technology available constitutes new core conceptualizations in a
research field. We think that the added information from eye tracking data can get us on the
track of understanding more about how students answer questions in reading tests, and
enable us to ask new and better questions in future research.
• • •
Oddny Judith Solheim is an Associate Professor in Special Education at the National Centre for
Reading Education and Reading Research, University of Stavanger, Norway. Her research focus is on
reading comprehension, assessment of reading comprehension, early intervention for children with
reading difficulties and reading self-efficacy.
Per Henning Uppstad is an Associate Professor in Literacy Studies at the National Centre for Reading
Education and Reading Research at the University of Stavanger, Norway. His research focus is on on-
line studies of reading and writing and theoretical work on phonology in dyslexia research.

Eye-tracking as a tool / Solheim & Upstadd
167
References
Afflerbach, P. (2000). Verbal Reports and Protocol Analysis. In M. L. Kamil, P. B. Mosenthal, P. D. Pearson
& R. Barr (Eds.), Handbook of Reading Research (vol. 3, pp. 163-179). Mahwah, New Jersey,
London: Lawrence Earlbaum Associates.
Afflerbach, P. & Johnston, P. (1984). Research methodology: On the use of verbal reports in reading
research. Journal of Reading Behaviour 16 (307-322).
Alderson, J. C. (2000). Assessing Reading. Cambridge: Cambridge University Press.
Allan, A. I. C. G. (1992). EFL reading comprehension test validation: investigating aspects of process
approaches. Unpublished PhD thesis, Lancaster University, Lancaster.
Andreassen, R. & Bråten, I. (2010). Examining the prediction of reading comprehension on different
multiple-choice tests. Journal of Research in Reading 33 (263-283).
Campbell, J.R. (2005). Single Instruments, Multiple Measures: Considering the Use of Multiple Item
Formats to Assess Reading Comprehension. In S. G. Paris & S. A. Stahl (Eds.), Children’s Reading
Comprehension and Assessment (pp. 347–369). Mahwah, New Jersey: Lawrence Earlbaum
Associates.
Cordon, L. A. & Day, J. D. (1996). Strategy use on standardized reading comprehension tests. Journal of
Educational Psychology 88 (288–295).
Ericsson, K. & Simon, K. (1984). Protocol Analysis: Verbal reports as data. Cambridge, MA; MIT Press.
Farr, R., Pritchard, R. & Smitten, B. (1990). A Description of What Happens When an Examinee Takes a
Multiple-Choice Reading Comprehension Test. Journal of Educational Measurement 27 (209–
226).
Goetz, E.T., Schallert, D. L., Reynolds, R. E. & Radin, D. J. (1983). Reading in perspective: What real cops
and pretend burglars look for in a story. Journal of Educational Psychology 75 (500–510).
Hannus, M. & Hyönä, J. (1999). Utilizations of Illustrations during Learning of Science Textbook
Passages Among Low- and High-Ability Children. Contemporary Educational Psychology 2 (95–
123).
Holmqvist, K., Holmberg, N., Holsanova, J., Tärning, J. & Engwall, B. (2006). Reading Information
Graphics – Eyetracking Studies with Experimental Conditions. In J. Errea (Ed.), Malofiej
Yearbook of Infographics (pp. 54–61). Society for News Design (SND-E), Navarra University,
Pamplona, Spain.
Holsanova, J., Holmberg, N. & Holmqvist, K. (2005). Tracing Integration of Text and Pictures in
Newspaper Reading. Lund University Cognitive Studies 125. Lund: Lund University.
Hyönä, J., Lorch, R. F. J., & Kaakinen, J. K. (2002). Individual Differences in Reading to Summarize
Expository Text: Evidence from Eye Fixation Patterns. Journal of Educational Psychology 94
(44–55).
Høien, T. & Tønnesen, G. (1998). Håndbok til Ordkjedetesten [Handbook for the word-chain test].
Stavanger: Stiftelsen Dysleksiforskning.
Johansen, E. B. & Steineger, E. (1999). Globus: Natur og miljøfag 7 [Globus: 7th year science and
environment studies’]. Oslo: J.W. Cappelen Forlag.
Johnson, D. & Kress, G. (2003). Globalisation, Literacy and Society: redesigning pedagogy and
assessment. Assessment in Education 10 (5-14).
Johnston, P. J. (1984). Assessment in Reading. In P.D. Pearson, R. Barr, M. Kamil and P. Mosenthal (Eds.),
Handbook of Reading Research (2nd ed., pp. 147–182). New York: Longman.
Just, M. A. & Carpenter, P. A. (1980). A theory of reading. From eye fixations to comprehension.
Psychological Review 87 (329-354).
Kaakinen, J.K. & Hyönä, J. (2005). Perspective Effects on Expository Text Comprehension: Evidence
from Think-Aloud Protocols, Eyetracking and Recall. Discourse Process 40 (239–257).
Kamil, M. L. (2004). The current state of quantitative research. Reading Research Quarterly 39 (100-107).
Kress, G. & van Leuven, T. (2001). Multimodal discourse. The modes and media of contemporary
communication. London: Arnold.
Land, M. & Tatler, B. (2009). Looking and Acting. Vision and Eye Movements in Natural Behaviour. Oxford,
New York: Oxford University Press.

International Electronic Journal of Elementary Education
168
Langer, J. (1987). The construction of meaning and the assessment of comprehension: An analysis of
reader performance on standardized test items. In R. O. Freedle & R. P. Duran (Eds.), Cognitive
and linguistic analyses of text performance (pp. 225-244). Norwood, NJ: Ablex.
Li, W. (1992). What is a test testing? An investigation of the agreement between students´ test taking
processes and test constructers´ presumptions. Unpublished MA thesis, Lancaster University,
Lancaster.
Messick, S. (1988). The Once and Future Issues of Validity: Assessing the Meaning and Consequences
of Measurement. In H. Wainer & H. I. Braun (Eds.), Test Validity (pp. 33–46). Hillsdale, New
Jersey, Hove, London: Lawrence Earlbaum Associates.
Messick, S. (1995). Validity of Psychological Assessment: Validation of Inferences From Persons’
Responses and Performance as Scientific Inquiry Into Score Meaning. American Psychologist
50 (741–7499.
Mullis, I. V. S., Kennedy, A. M., Martin, M. O. & Sainsbury, M. (2006). PIRLS 2006 Assessment Framework
and Specifications. (2nd ed.). Chestnut Hill, MA: Boston College.
Ozuru, Y., Best, R., Bell, C., Witherspoon, A. & McNamara, D. S. (2007). Influence of Question Format and
Text Availability on the Assessment of Expository Text Comprehension. Cognition and
Instruction 25 (399-438).
Ozuru, Y., Dempsey, K., McNamara, D. S. (2009). Prior knowledge, reading skill, and text cohesion in the
comprehension of science texts. Learning and Instruction 19 (228-242).
Paulson, E.J. & Henry, J. (2002). Does the Degrees of Reading Power Assessment Reflect the Reading
Process? An Eye-Movement Examination. Journal of Adolescent & Adult Literacy 46 (234–244).
Pearson, P. D. & Hamm, D. N. (2005). The Assessment of Reading Comprehension: A Review of
Practices – Past, Present and Future. In S. G. Paris & S. A. Stahl (Eds.), Children’s Reading
Comprehension and Assessment (pp. 13–69). Mahwah, New Jersey: Lawrence Erlbaum
Associates.
Raven, J.C. (1958). Standard Progressive Matrices: Sets A, B, C, D & E. Oxford, UK: Oxford Psychologists
Press Ltd.
Raven, J. C., Court, J. H. & Raven, J. (1988). Standard Progressive Matrices: 1988 Edition. London, UK:
Oxford Psychologists Press Ltd.
Rayner, K. (1992). Eye Movements and visual cognition: Scene perception during reading. New York:
Springer-Verlag.
Rayner, K. (1998) Eye movements in reading and information processing: 20 years of research.
Psychological Bulletin 124 (372–422).
Rothkopf, E. Z. & Billington, M. J. (1979). Goal-guided learning from text: Inferring a descriptive
processing model from inspection times and eye movements. Journal of Educational
Psychology 71 (310–327).
Salmerón, L., Vidal-Abarca, E., Mana, A., Martínez, T., Gil, L. & Naumann, J. (submitted). Reading
Strategies in task oriented reading: The case of PISA-like tasks. Manuscript submitted for
publication.
Solheim, O. J. (2011). The Impact of Reading Self-Efficacy and Task Value on Reading Comprehension
Scores in Different Item Formats. Reading Psychology 32 (1-27).
Solheim, O. J. & Skaftun, A. (2009). The problem of semantic openness and constructed response.
Assessment in Education 16 (149-164).
Tai, R. H., Loehr, J. F. & Brigham, F. J. (2006). An exploration of the use of eye-gaze tracking to study
problem-solving on standardized science assessments. International Journal of Research &
Method in Education 29 (185–208).
Valencia, S. W. & Pearson, P. D. (1987). Reading Assessment: Time for a change. The Reading Teacher 40
(726–732).
Vidal-Abarca, E., Mãná, A. & Gil, L. (2010). Individual Differences for Self-Regulating Task-Oriented
Reading Activities. Journal of Educational Psychology 102 (817-826).