Eye Faster - POPAIpopai.com.au/wp-content/uploads/2014 Mass Merchant Study...• Use mobile eye...
33
Eye Faster Making Mobile Eye Tracking Easy For Market Researchers 2014 Mass Merchant Study Presented to POPAI January 15, 2014 Copyright © 2014 Eye Faster, LLC
Transcript of Eye Faster - POPAIpopai.com.au/wp-content/uploads/2014 Mass Merchant Study...• Use mobile eye...

Eye FasterMaking Mobile Eye Tracking Easy For Market Researchers
2014 Mass Merchant Study
Presented to POPAI
January 15, 2014
Copyright © 2014 Eye Faster, LLC
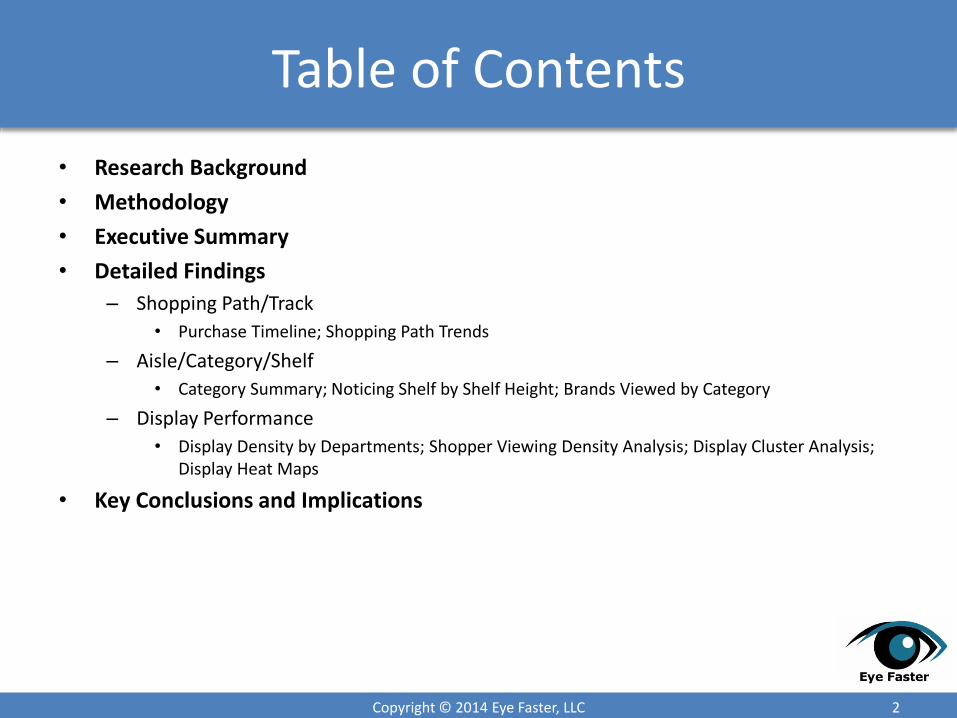
Table of Contents
• Research Background
• Methodology
• Executive Summary
• Detailed Findings
– Shopping Path/Track
• Purchase Timeline; Shopping Path Trends
– Aisle/Category/Shelf
• Category Summary; Noticing Shelf by Shelf Height; Brands Viewed by Category
– Display Performance
• Display Density by Departments; Shopper Viewing Density Analysis; Display Cluster Analysis; Display Heat Maps
• Key Conclusions and Implications
Copyright © 2014 Eye Faster, LLC 2
Research Background & Objectives
3Copyright © 2014 Eye Faster, LLC
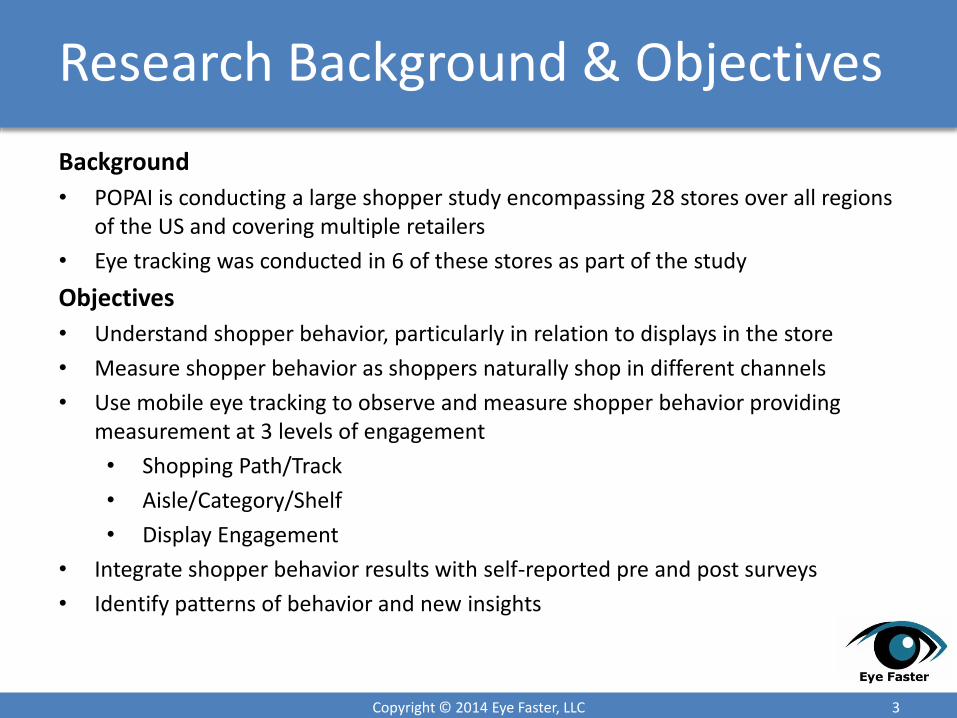
Background
• POPAI is conducting a large shopper study encompassing 28 stores over all regions of the US and covering multiple retailers
• Eye tracking was conducted in 6 of these stores as part of the study
Objectives
• Understand shopper behavior, particularly in relation to displays in the store
• Measure shopper behavior as shoppers naturally shop in different channels
• Use mobile eye tracking to observe and measure shopper behavior providing measurement at 3 levels of engagement
• Shopping Path/Track
• Aisle/Category/Shelf
• Display Engagement
• Integrate shopper behavior results with self-reported pre and post surveys
• Identify patterns of behavior and new insights
Methodology
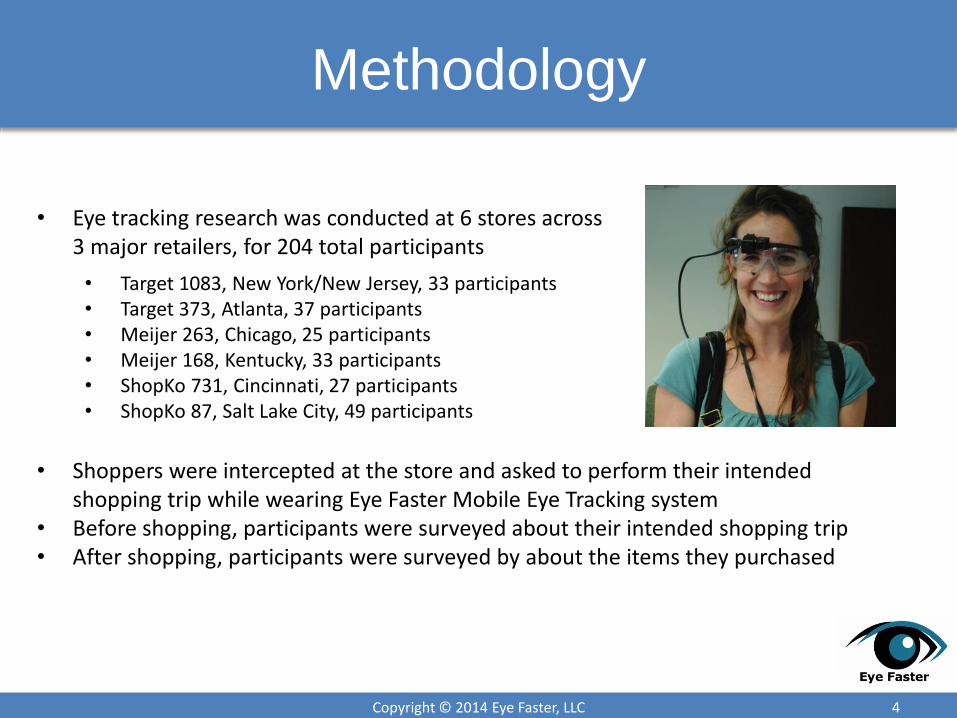
• Eye tracking research was conducted at 6 stores across 3 major retailers, for 204 total participants
• Target 1083, New York/New Jersey, 33 participants• Target 373, Atlanta, 37 participants• Meijer 263, Chicago, 25 participants• Meijer 168, Kentucky, 33 participants• ShopKo 731, Cincinnati, 27 participants• ShopKo 87, Salt Lake City, 49 participants
4Copyright © 2014 Eye Faster, LLC
• Shoppers were intercepted at the store and asked to perform their intended shopping trip while wearing Eye Faster Mobile Eye Tracking system
• Before shopping, participants were surveyed about their intended shopping trip• After shopping, participants were surveyed by about the items they purchased

Executive Summary
Planned vs. Unplanned Purchasing
• Unplanned purchasing declines in the last 20% of the shopping trip• Unplanned purchasing makes up the majority of purchase
• Unplanned purchasing, and therefore purchasing in general, sharply declines during the last 20% of a shopping trip
Shopping Path Tracking
• The shopping path is largely driven by the primary destination category of the shoppers, a consistent primary destination category creates concentrated paths through the store
Shopper Behavior Leading To Purchase
• Getting a customer to pick-up a product has the highest correlation with the customer purchasing• For most categories, the longer a customer spends in the category, the more likely the customer is to purchase
• Noticing a product in the category is not guarantee that a shopper will buy it, as it is only mildly positively correlated (R2 =0.15) with purchasing products
• In contrast, 30% of all products held are purchased
• 56% of shoppers that hold a product in a category will buy a product in the category
• Purchasing increases to 62% if more than 1 item is held
How Shoppers Shop Shelves
• Shoppers prefer to focus on products at slightly below eye level• For bays with single categories and similar products, shoppers focus on products at slightly below eye level
• This pattern is altered by either mixing categories in bays or incorporating value sized packages in the same bay
• Display viewing frequency is largely a matter of the path shoppers take through the store• If it is not on their path, they won’t see it
• If it is on their path, they will notice it based on the time in that area and not the density of the displays in the area
• High traffic = high viewing, low traffic = low viewing
5Copyright © 2014 Eye Faster, LLC

Executive Summary, Cont.
Display Interaction and Shopping
• Display viewing frequency is largely a matter of the path shoppers take through the store• If it is not on their path, they won’t see it
• If it is on their path, they will notice it based on the time in that area and not the density of the displays in the area
• High traffic = high viewing, low traffic = low viewing
• Shoppers see a small portion of the displays in a store and for a brief time during any individual trip• Typical shopper notices 32 displays
• This represents approximately 12% of the displays in a store
• Most notices are fairly brief, <1 second
• Highly noticed displays are not necessarily the best performing displays• Highly viewed displays toward front of store on racetrack are noticed by 40% of shoppers who pass by
• However, these same displays have a product interaction rate of 0.4%, 1/10th the rate of lesser viewed displays placed in the center of the store
• Display engagement is highest when the display is integrated with the adjacent aisle and products and is in the center of the store along the racetrack
• Displays with these conditions are only modestly seen (21% of shoppers)
• They are highly engaged (4.1% of shoppers)
6Copyright © 2014 Eye Faster, LLC
SHOPPING PATH/TRACKRetailer: All
Copyright © 2014 Eye Faster, LLC 7

Purchasing Markedly Declines During Last 20% of Shop
Copyright © 2014 Eye Faster, LLC 8
0.0%
2.0%
4.0%
6.0%
8.0%
10.0%
12.0%
14.0%
16.0%
0-10% 11-20% 21-30% 31-40% 41-50% 51-60% 61-70% 71-80% 81-90% 91-100%
% P
urc
has
es D
uri
ng
Tim
e In
terv
al
Percent of Time Into Shopping Trip
Purchase Timeline - All Retailers
Generally Planned
Specifically Planned
Substitute
Unplanned
Grand Total
• Most purchases occur at the beginning and middle of the shopping trip
• Purchasing drops off during the last 20-30% of the trip
• Unplanned purchases largely drive the overall purchasing timeline
• Specifically planned purchases occur early and decline throughout the
remainder of the trip

Destination Categories Alter Traffic Flow
Copyright © 2014 Eye Faster, LLC 9
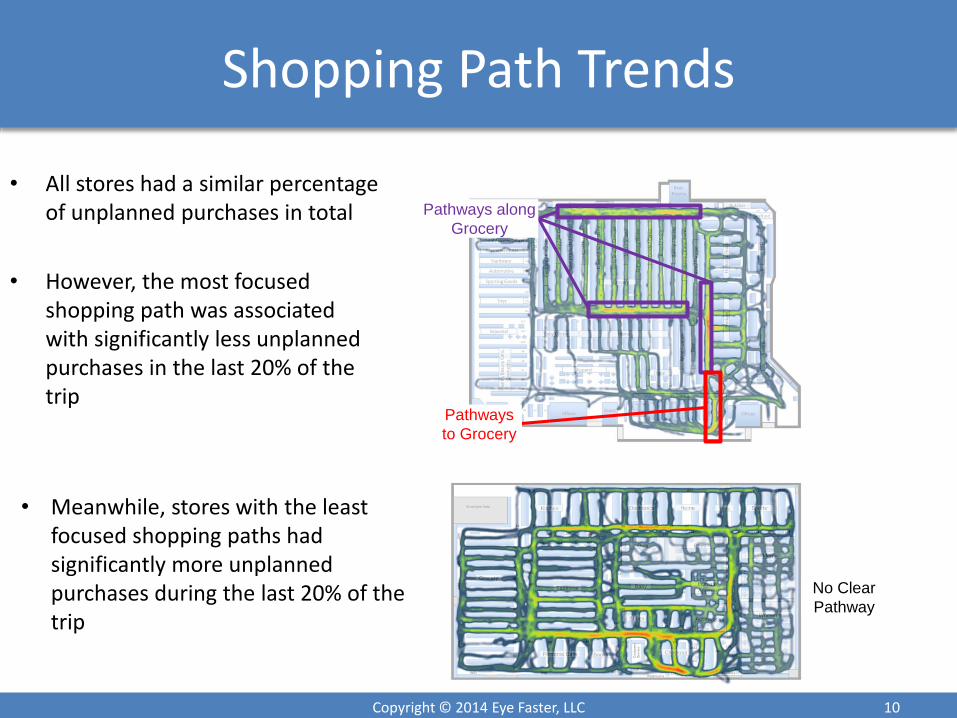
• Shoppers’ paths are more focused when there is a clear destination category, in these 2 examples: Grocery
• In both cases, the path to and from Grocery is consistent among shoppers
Pathways along
Grocery
Pathways
to Grocery
No Clear
Pathway
• However, when there is no clear destination category, paths are less consistent with the only focused hotspot directly in front of checkout
Shopping Path Trends
Copyright © 2014 Eye Faster, LLC 10
• All stores had a similar percentage of unplanned purchases in total
• However, the most focused shopping path was associated with significantly less unplanned purchases in the last 20% of the trip
Pathways along
Grocery
Pathways
to Grocery
No Clear
Pathway
• Meanwhile, stores with the least focused shopping paths had significantly more unplanned purchases during the last 20% of the trip

AISLE/CATEGORY/SHELFRetailer: Target
Copyright © 2014 Eye Faster, LLC 11

Category Summary• Shoppers spent the most time in Seasonal, though purchased relatively few items
– Study fielding conducted near Halloween, considerable space dedicated at some retailers to Halloween and Christmas
• Outside of Seasonal, Dairy, Bread – Packaged, and Salty Snacks were the next longest shopped categories
• As the time in aisle increases, the likelihood of purchase increases*
Copyright © 2014 Eye Faster, LLC 12
0
0.05
0.1
0.15
0.2
0.25
0.3
0.35
0.4
0.45
0.5
0
50
100
150
200
250
300
Pro
du
cts
Seco
nd
s
Products Purchased per Visitor
Time in Category
* R2 =0.210, 95% confidence interval: 0.095 ≤ R2 ≤ 0.325, without seasonal

Shopping by Holding vs. Shopping by Seeing
• In the categories where relatively few items were purchased (from previous slide—candy, baking, and bars/fruit snacks), most of shoppers’ time was spent fixating instead of holding little holding, little purchasing
• In contrast, shoppers also spent little time holding dairy, salty snacks, and carbonated beverages, but purchased a higher number little holding, lots of purchasing
• Categories with lots of holding and more purchasing: crackers, coffee/tea
Copyright © 2014 Eye Faster, LLC 13
0%10%20%30%40%50%60%70%80%90%
100%
Pe
rce
nt
of
Tim
e
Hold
Fixate

Purchase Funnel• Fixating is the first step to purchase (not seen – not bought)
• 56% of shoppers that hold a product in a category will purchase a product in that category– 30% of all products held are purchased
• High Fixate/Notice does not necessarily translate into high purchase*
• Highly visited categories where Fixating leads to purchase: Cheese – Packaged, Carbonated
Soft Drink, Bread – Packaged– >40% of shoppers fixating purchase from the category
• Categories where Fixating and Reading does not lead to purchase: Prepackaged Fruit
Snacks, Candy, Household Cleaners, Pasta– <5% of shoppers fixating purchase from the category
Copyright © 2014 Eye Faster, LLC 14
0%10%20%30%40%50%60%70%80%90%
100%
Pe
rce
nt
of
Sho
pp
ers
Fixate %
Read %
Hold %
Purchase %
* 95% confidence interval: 0.0479 ≤ R2 ≤ 0.2581

Products and Brands Viewed
• Seasonal is a clear outlier; shoppers viewed many seasonal products, but only a few brands
• Categories in which shoppers viewed many brands: Carbonated Beverages, Salty Snacks, Dairy, and Candy
• Categories in which shoppers viewed many products from each brand: Seasonal, Bread-Packaged, Household Cleaners, suggesting few strong brands with broad product lines in these categories
Copyright © 2014 Eye Faster, LLC 15
0
2
4
6
8
10
12
14
16
Median Brands viewed
Product/Brand Ratio

Shoppers Notice Shelves At Slightly Below Eye Level
Copyright © 2014 Eye Faster, LLC 16
• Shoppers naturally look slightly to 25 degrees below eye level
• When the same type of products are distributed across multiple heights of a shelving unit, the products located in the middle shelves tend to receive most attention
• Here is an example from Bread-Packaged of how shoppers viewed the shelf • The majority of the focus is on the 4th shelf from the bottom, which is comfortably slightly below eye level
• The 3rd shelf up, within the lower end of the comfortably below eye level zone, is the next most focused on shelf
Bread-Packaged
Altered Shelf Configurations Can Change Shopper Viewing Patterns
Copyright © 2014 Eye Faster, LLC 17
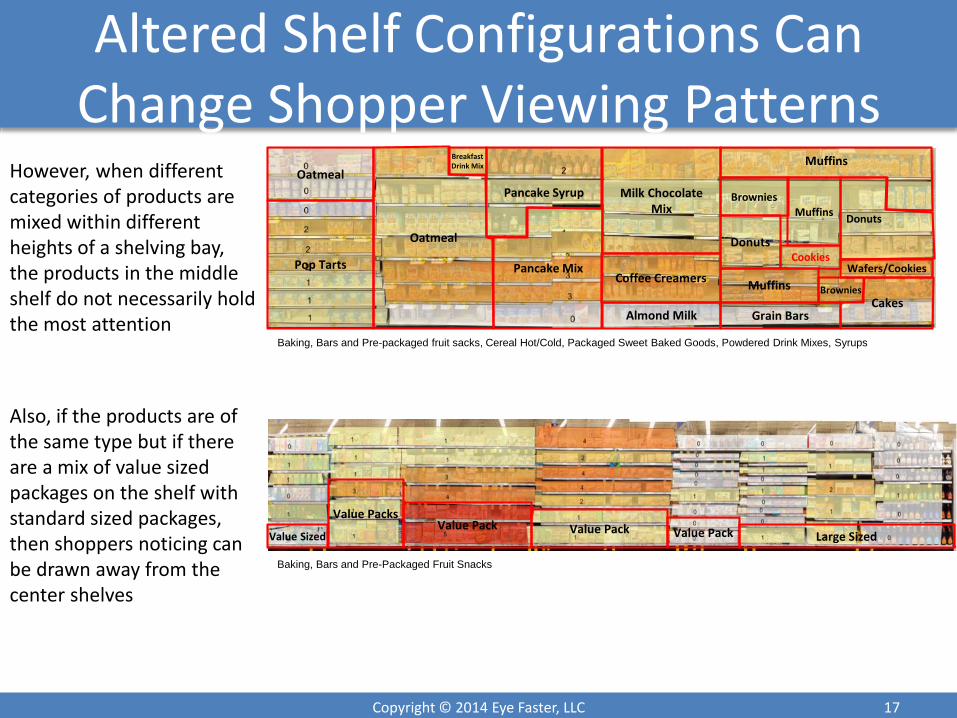
However, when different categories of products are mixed within different heights of a shelving bay, the products in the middle shelf do not necessarily hold the most attention
Also, if the products are of the same type but if there are a mix of value sized packages on the shelf with standard sized packages, then shoppers noticing can be drawn away from the center shelves
Baking, Bars and Pre-packaged fruit sacks, Cereal Hot/Cold, Packaged Sweet Baked Goods, Powdered Drink Mixes, Syrups
Baking, Bars and Pre-Packaged Fruit Snacks
Oatmeal
Pop Tarts
Pancake Syrup
Pancake Mix
Milk Chocolate Mix
Coffee Creamers
Almond Milk
Breakfast Drink Mix
Oatmeal
Muffins
Brownies
Donuts
Muffins
Grain Bars
Cookies
MuffinsDonuts
Brownies
Cakes
Wafers/Cookies
Value Sized
Value PacksValue Pack Value Pack Value Pack Large Sized

DISPLAY PERFORMANCERetailer: All
18Copyright © 2014 Eye Faster, LLC

Display Analysis
19Copyright © 2014 Eye Faster, LLC
• Shoppers were exposed to 1,378 displays across 3 retailers and 6 stores
• Individual stores ranged from 95 to 349 displays
• Of these displays, 980 were seen by shoppers• The typical shopper noticed 32 displays
• Because stores had widely varying counts of displays, the typical shopper noticed 12% of the displays in their store
• Noticing was brief for most, <1 second
05F-04F Endcap (DSP-11MEJ-263-a)
• 366 displays had sufficient attention for analysis• These displays were the most frequently viewed displays in each of the stores
• Of the top-viewed displays, the typical shopper saw 18
• Of the top-viewed displays, participants shopped them for an average of 6.9 seconds
• Display performance was evaluated using a combination of:• Density of displays by location
• Views of display by location
• Shopper path taken through the store
• Displays were also grouped according to performance characteristics and then evaluated based on descriptive characteristics of the displays

Shopper Path Is Primary Driver of
Display Noticing
Low Density High DensityDISPLAY DENSITY
Copyright © 2014 Eye Faster, LLC 20
• Endcap displays are the most common displays found throughout a shopper’s pathway
• In general, shoppers notice displays in proportion to their pathway through the store
• Increasing density of displays does not increase the amount of time spent interacting with the displays
• If the shopper doesn’t walk by it, the display is still not seen
Shopper Path
Display Noting

Display Density Has Limited
Impact
Low Density High DensityDISPLAY DENSITY
Copyright © 2014 Eye Faster, LLC 21
• Areas densely covered with displays still have no more views than the proportion of the shoppers that cross its path
Low traffic,
High Density,
Low viewing
High traffic,
Moderate Density,
High viewing
Shopper Path
Display Noting

Displays That Interrupt the
Racetrack More Highly Noticed
Copyright © 2014 Eye Faster, LLC 22
• Bins in the racetrack receive disproportionately large attention compared to nearby endcaps
• Racetrack placement ensures consistent foot traffic
• Central placement makes the bins largely unavoidable
Low Density High DensityDISPLAY DENSITY
Bins Focus Attention
Shopper Path
Display Noting
Display Cluster Analysis
• Display Performance Metrics
– Average % Shoppers Viewed
– Average Time Viewed
– Average % Shoppers Interacted with Product
• Display Descriptive Characteristics
– Location in store
– Display Characteristics
• Integrated
• Retailer Generic Signs
• Sale signs (with/without price)
• Product-Related Signage
• Freestanding
• Seasonal Themed
• Static
• Video
• Audio
• Motion
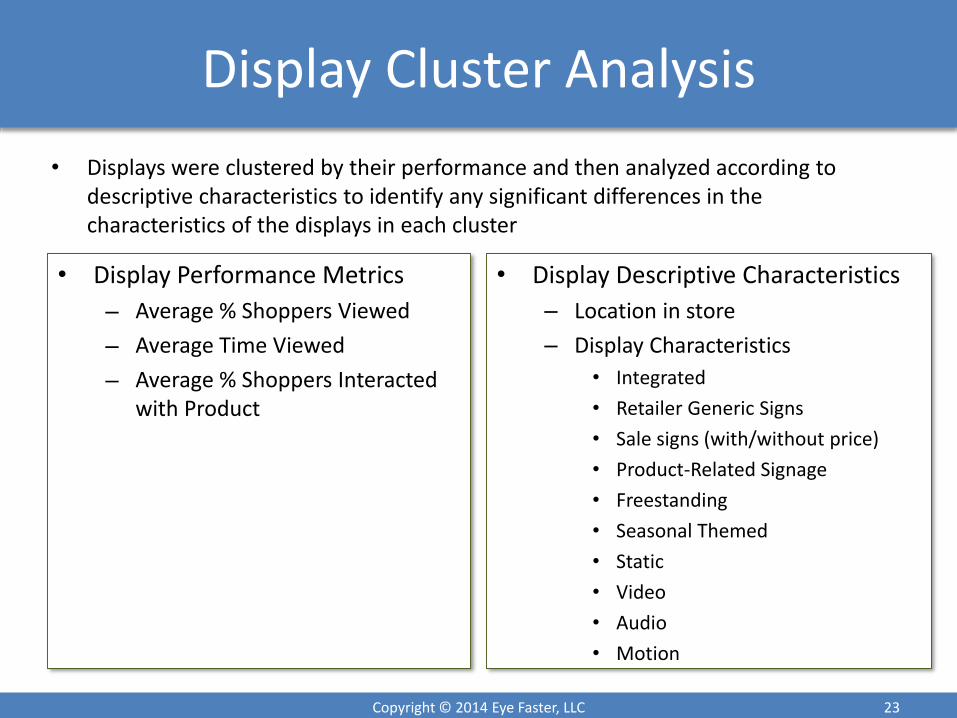
• Displays were clustered by their performance and then analyzed according to descriptive characteristics to identify any significant differences in the characteristics of the displays in each cluster
Copyright © 2014 Eye Faster, LLC 23
Displays Cluster Into Different Performance Levels
Copyright © 2014 Eye Faster, LLC 24
Cluster
Average % Shoppers Viewed
Average Time Viewed
(seconds)
Average % Shoppers
Interacted with Product
% of Displays in Cluster
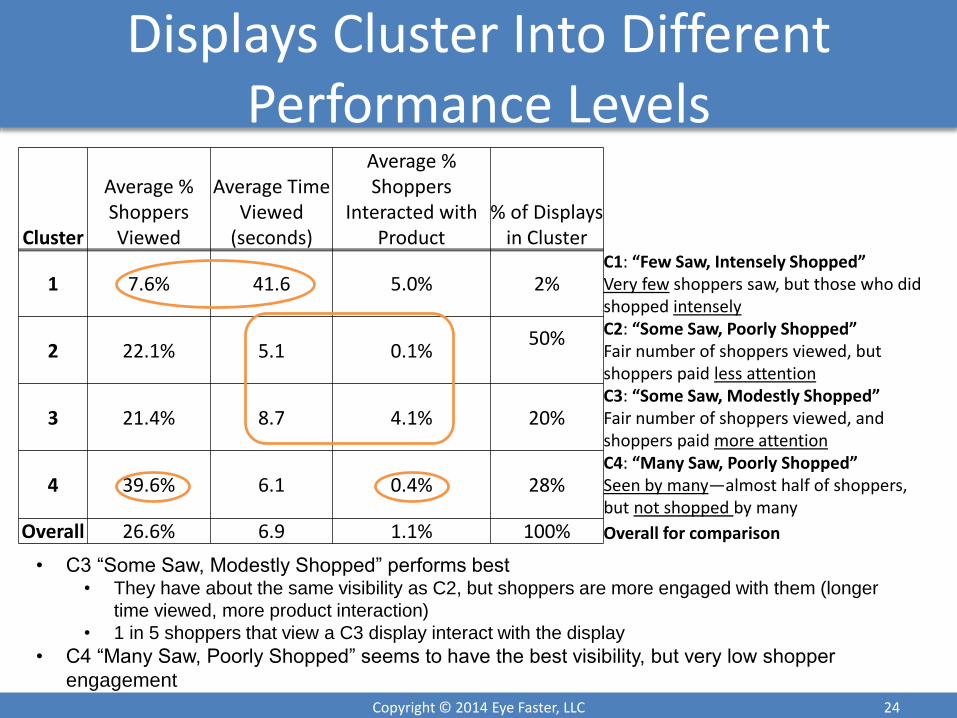
1 7.6% 41.6 5.0% 2%C1: “Few Saw, Intensely Shopped”Very few shoppers saw, but those who did shopped intensely
2 22.1% 5.1 0.1%50% C2: “Some Saw, Poorly Shopped”
Fair number of shoppers viewed, but shoppers paid less attention
3 21.4% 8.7 4.1% 20%C3: “Some Saw, Modestly Shopped”Fair number of shoppers viewed, and shoppers paid more attention
4 39.6% 6.1 0.4% 28%C4: “Many Saw, Poorly Shopped”Seen by many—almost half of shoppers, but not shopped by many
Overall 26.6% 6.9 1.1% 100% Overall for comparison
• C3 “Some Saw, Modestly Shopped” performs best• They have about the same visibility as C2, but shoppers are more engaged with them (longer
time viewed, more product interaction)
• 1 in 5 shoppers that view a C3 display interact with the display
• C4 “Many Saw, Poorly Shopped” seems to have the best visibility, but very low shopper
engagement

Displays Heat Map Cluster Examples
Cluster 1 “Few Saw, Intensely Shopped”
Meijer 263 - 02B-03B Endcap (DSP-7MEJ-263-B)
Cluster 2 “Some Saw, Poorly Shopped”
Shopko 87 - A31F-A32F Endcap (DSP-45SHOP-87-C)
Cluster 3 “Some Saw, Modestly Shopped” Cluster 4 “Many Saw, Poorly Shopped”
Target 1083 - A03 Endcap (DSP-67TAR-1083-B)Shopko 731 - X13 Bin (DSP-45SHOP-731-B)
25Copyright © 2014 Eye Faster, LLC
Display Location Impacts Display Performance
26Copyright © 2014 Eye Faster, LLC
0%
5%
10%
15%
20%
25%
30%
35%
40%
45%
50%
END OF AISLE -BACK OF STORE
END OF AISLE -CENTER OF
STORE
END OF AISLE -FRONT OF
STORE
IN-AISLE RACETRACK -BACK OF STORE
RACETRACK -CENTER OF
STORE
RACETRACK -FRONT END
RACETRACK -SIDE
% o
f D
isp
lays
in C
lust
er
Location in Store
Display Location
Cluster 1
Cluster 2
Cluster 3
Cluster 4
Grand Total
Statistically significant at 95% confidence level
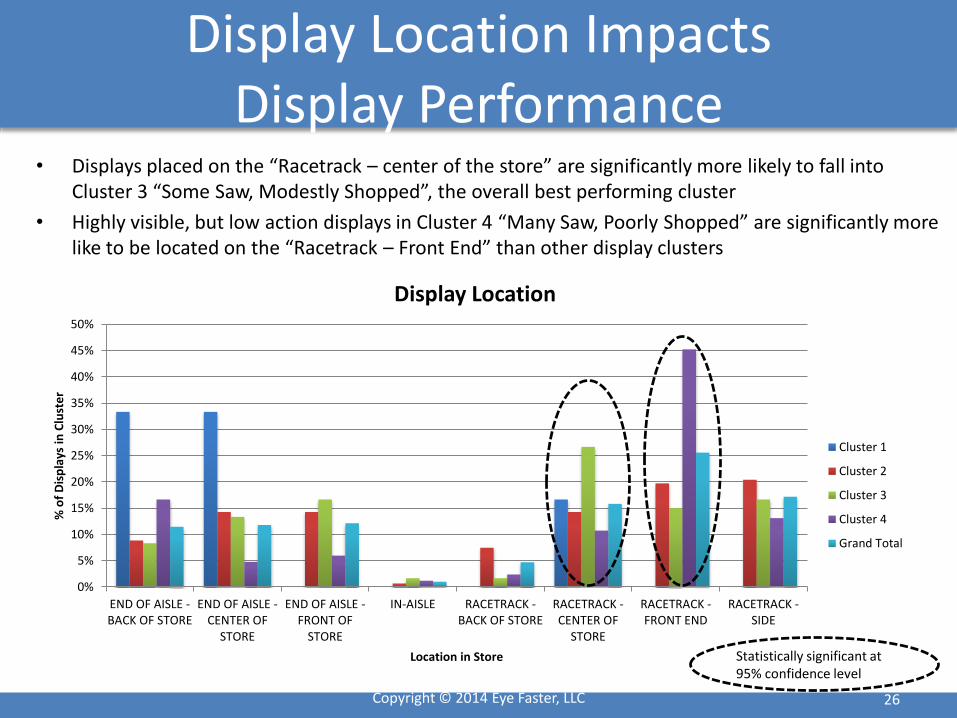
• Displays placed on the “Racetrack – center of the store” are significantly more likely to fall into Cluster 3 “Some Saw, Modestly Shopped”, the overall best performing cluster
• Highly visible, but low action displays in Cluster 4 “Many Saw, Poorly Shopped” are significantly more like to be located on the “Racetrack – Front End” than other display clusters

C2 and C3 Display Location Differ By Primary Racetrack Location
27Copyright © 2014 Eye Faster, LLC
0%
5%
10%
15%
20%
25%
30%
END OFAISLE - BACK
OF STORE
END OFAISLE -
CENTER OFSTORE
END OFAISLE -
FRONT OFSTORE
IN-AISLE RACETRACK- BACK OF
STORE
RACETRACK- CENTER OF
STORE
RACETRACK- FRONT
END
RACETRACK- SIDE
% o
f D
isp
lays
in C
lust
er
Location in Store
Display Location – Clusters 2 vs. 3
Cluster 2
Cluster 3
• Both clusters were spread fairly evenly throughout the store, but most were somewhere
along the racetrack
(C2 “Some Saw, Poorly Shopped” 62%, C3 “Some Saw, Modestly Shopped” 60%)
• C3 “Some Saw, Modestly Shopped” had more displays along the racetrack in the center
of the store
Statistically significant at 95% confidence level

Integrated Element Separates High Performance Clusters
• Different display elements were evaluated to explain the difference in performance between the clusters
• C3 “Some Saw, Modestly Shopped”, the best performing cluster, was significantly more likely than C4 “Many Saw, Poorly Shopped” and somewhat more likely than C2 “Some Saw, Poorly Shopped” to have an integrated display
• C3 “Some Saw, Modestly Shopped” had significantly more seasonal themed displays than C2 “Some Saw, Poorly Shopped” and C4 “Many Saw, Poorly Shopped” and more integrated displays than C4 “Many Saw, Poorly Shopped”
• C4 “Many Saw, Poorly Shopped” had significantly more freestanding displays than C3 “Some Saw, Modestly Shopped” and C2 “Some Saw, Poorly Shopped”
Copyright © 2014 Eye Faster, LLC 28
Statistically significant at 95% confidence level
0%
10%
20%
30%
40%
50%
60%
70%
80%
90%
100%
Retailer GenericSigns
Sale signs(with/without price)
Product-RelatedSignage
Freestanding Seasonal Themed Static Integrated
Pe
rce
nt
of
Dis
pla
ys w
ith
in C
lust
er
Display Characteristic
Cluster 1
Cluster 2
Cluster 3
Cluster 4
Grand Total
Statistically significant at 90% confidence level
KEY CONCLUSIONS & IMPLICATIONSRetailer: All
Copyright © 2014 Eye Faster, LLC 29

Key Conclusions And
ImplicationsKey Conclusions Implications for Retailers
• Unplanned purchasing declines in the last 20% of the shopping trip
• Unplanned purchasing makes up the majority of purchases
• Unplanned purchasing, and therefore purchasing in general, sharply declines during the last 20% of a shopping trip
• As the shopper is reaching checkout, their unplanned purchasing is dropping-off dramatically
• Shoppers see the displays but they don’t act• Rather than trying to capture the last few unplanned
purchases at checkout, we suggest researching how improving the shopping conclusion experience can increase return trips to the retailer, which will have far more impact on store sales
• Can reducing checkout time lead to increased return trips?
• How can the retailer provide a positive experience at the last moment of experience for the shopper?
• A primary destination category, such as grocery, focuses customer shopping path
• Stores without a primary destination have more variation in shopping paths
• Shopper make fewer unplanned purchases in the last 20% of the shop when they are in a store with a primary destination
• Display views are correlated most strongly with density of shopper traffic passing by
• For retailers lacking a destination category, creating a destination category could lead to increased shopper visit frequency
• For retailers with a destination category, the destination category should require shoppers to traverse a large portion of the store
• In addition, the path to the destination category should pass by impulse purchase or high value categories, such as pharmacy and health & beauty
30Copyright © 2014 Eye Faster, LLC

Key Conclusions And
ImplicationsKey Conclusions Implications for Retailers
• For most categories, the longer a customer spends in the category, the more likely the customer is to purchase
• Noticing a product in the category is not guarantee that a shopper will buy it
• In fact noticing products, is only mildly positively correlated (R2 =0.15) with purchasing products, while noticing is required for purchase, it is not sufficient
• Getting a customer to pick-up a product has the highest correlation with the customer purchasing
• 30% of all products held are purchased• 56% of shoppers that hold a product in a category
will buy a product in the category• Increases to 62% if more than 1
• Rather than the primary objective to be driving attention to the category, the primary objective should be to engage the customers that do pay attention to the category
• Engagement will increase time in category and increase the number of products held
• More products held lead to more purchases• Engagement can be achieved through:
• Interactive displays (mechanical & electronic)• On package promotions• Integrated displays• Store staff suggesting products so that the product
is in the shopper’s hands• Shoppers prefer to focus on products at slightly below
eye level• For bays with single categories and similar
products, shoppers focus on products at slightly below eye level
• This pattern is altered by either mixing categories in bays or incorporating value sized packages in the same bay
• Where possible, a category should be oriented horizontally, with as limited vertical spread as possible
• For larger categories, placing value packages lower, shoppers looking for the value packages will search for them on lower shelves, and other shoppers will focus on the higher price per unit products placed in the center shelves
31Copyright © 2014 Eye Faster, LLC

Key Conclusions And
ImplicationsKey Conclusions Implications for Retailers
• Display viewing frequency is largely a matter of the path shoppers take through the store
• If it is not on their path, they won’t see it• If it is on their path, they will notice it based on the
time in that area and not the density of the displays in the area
• High traffic = high viewing, low traffic = low viewing
• High value displays should be placed in high traffic areas• In low traffic areas, we recommend low effort, low
involvement displays, which do not change as frequently as other displays
• Use the display space for way finding, providing information, or assistance to the shoppers
• It is a low traffic area, the shopper is likely looking for something specific that is not obviously in other locations
• Help them find it• Shoppers see a small portion of the displays in a store
and for a brief time during any individual trip• Typical shopper notices 32 displays• This represents approximately 12% of the displays
in a store• Most notices are fairly brief, <1 second
• Given the limited number of displays that an individual shopper sees and the limited time allocated by the shoppers to noticing displays, the goal of the display should be engagement over noticing
• Engagement needs to be encouraged rapidly and communicated clearly to the shopper
32Copyright © 2014 Eye Faster, LLC

Key Conclusions And
ImplicationsKey Conclusions Implications for Retailers
• As with categories, engagement with displays, rather than merely viewing, is essential for purchase
• Highly noticed displays are not necessarily the best performing displays
• Highly viewed displays toward front of store on racetrack are noticed by 40% of shoppers who pass by
• However, these same displays have a product interaction rate of 0.4%, 1/10th the rate of lesser viewed displays placed in the center of the store
• Display engagement is highest when the display is integrated with the adjacent aisle and products and is in the center of the store along the racetrack
• Displays with these conditions are only modestly seen (21% of shoppers)
• They are highly engaged (4.1% of shoppers)
• From these results, custom displays along the racetrack in the center of the store are the most likely displays to generate incremental sales
• 0.4% interaction rates, which then lead to a much smaller purchase rate suggest that the front of store, largely non-integrated displays should be changed to minimized, especially in consideration of purchasing behavior and the decline in purchasing as shoppers approach the end of the shopping journey
33Copyright © 2014 Eye Faster, LLC