Extremes of heat conduction in molecular materials
29
Extremes of heat conduction in molecular materials David G. Cahill, Xiaojia Wang, and Wen-Pin Hsieh Department of Materials Science and Engineering University of Illinois at Urbana-Champaign Research groups of Rachel Segalman (UC Berkeley), Michael Chabinyc (UC Santa Barbara) and Paul Braun (UIUC) supported by AFOSR and CDAC
Transcript of Extremes of heat conduction in molecular materials

Extremes of heat conduction in molecular materials
David G. Cahill, Xiaojia Wang, and Wen-Pin HsiehDepartment of Materials Science and Engineering
University of Illinois at Urbana-Champaign
Research groups of Rachel Segalman (UC Berkeley),Michael Chabinyc (UC Santa Barbara) and Paul Braun (UIUC)
supported by AFOSR and CDAC

Outline
• Extremely low thermal conductivity in fullerene derivatives.
– Report of 0.03 W m-1 K-1 by Duda et al.– Lowest we observe is 0.05 W m-1 K-1
• Polymer under extreme pressure (up to 12 GPa) behaves as predicted by the minimum thermal conductivity model.
• Extremely high thermal conductivity in high modulus polymer fibers.
– Report of 100 W m-1 K-1 by Shen et al.– Highest we observe (Zylon) is 20 W m-1 K-1.
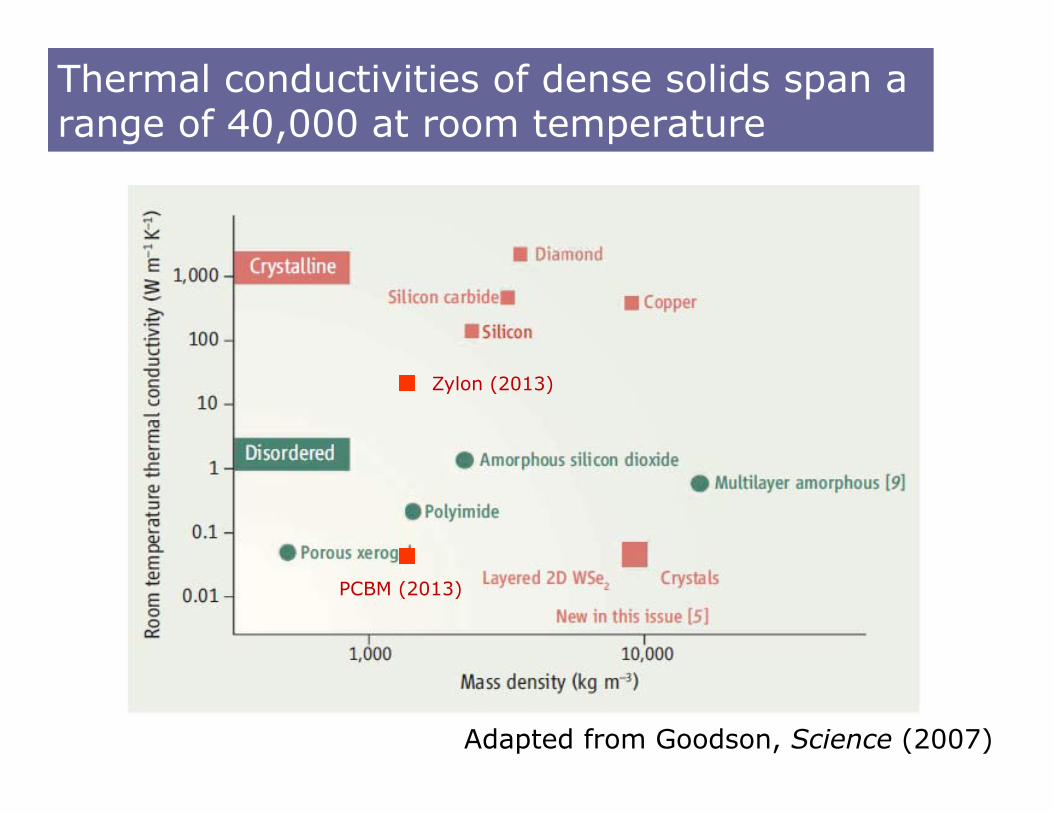
Thermal conductivities of dense solids span a range of 40,000 at room temperature
Adapted from Goodson, Science (2007)
PCBM (2013)
Zylon (2013)
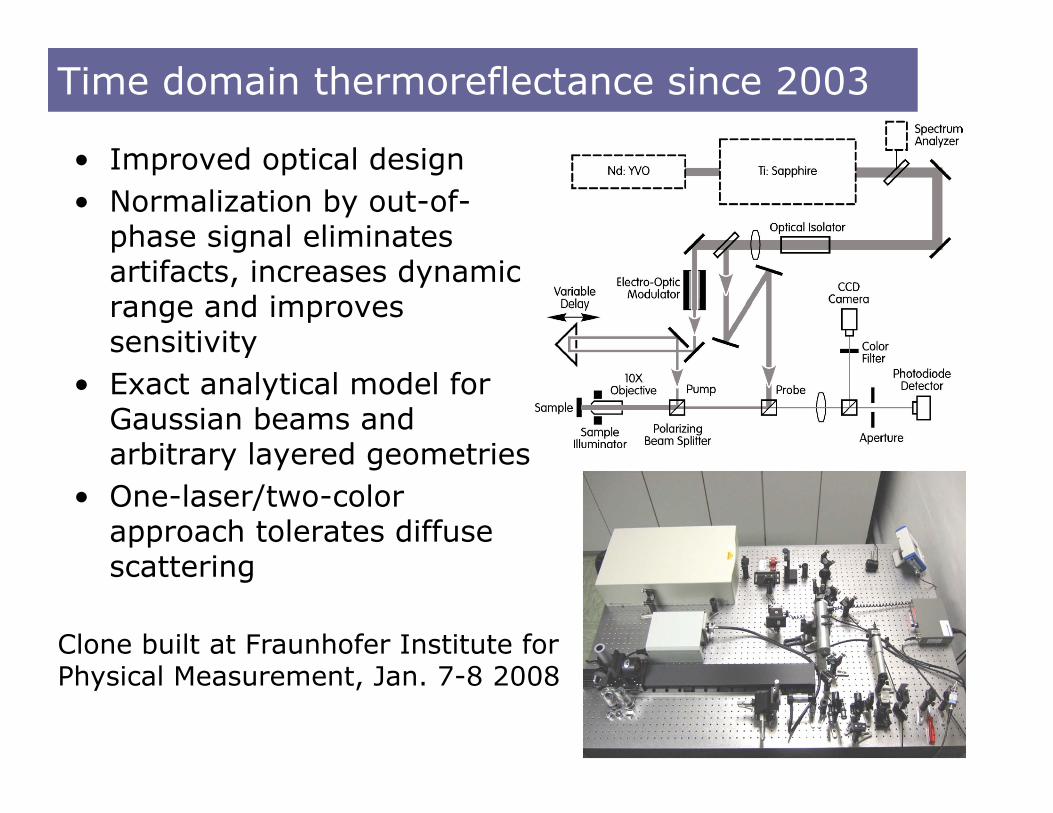
Time domain thermoreflectance since 2003
• Improved optical design• Normalization by out-of-
phase signal eliminates artifacts, increases dynamic range and improves sensitivity
• Exact analytical model for Gaussian beams and arbitrary layered geometries
• One-laser/two-color approach tolerates diffuse scattering
Clone built at Fraunhofer Institute for Physical Measurement, Jan. 7-8 2008
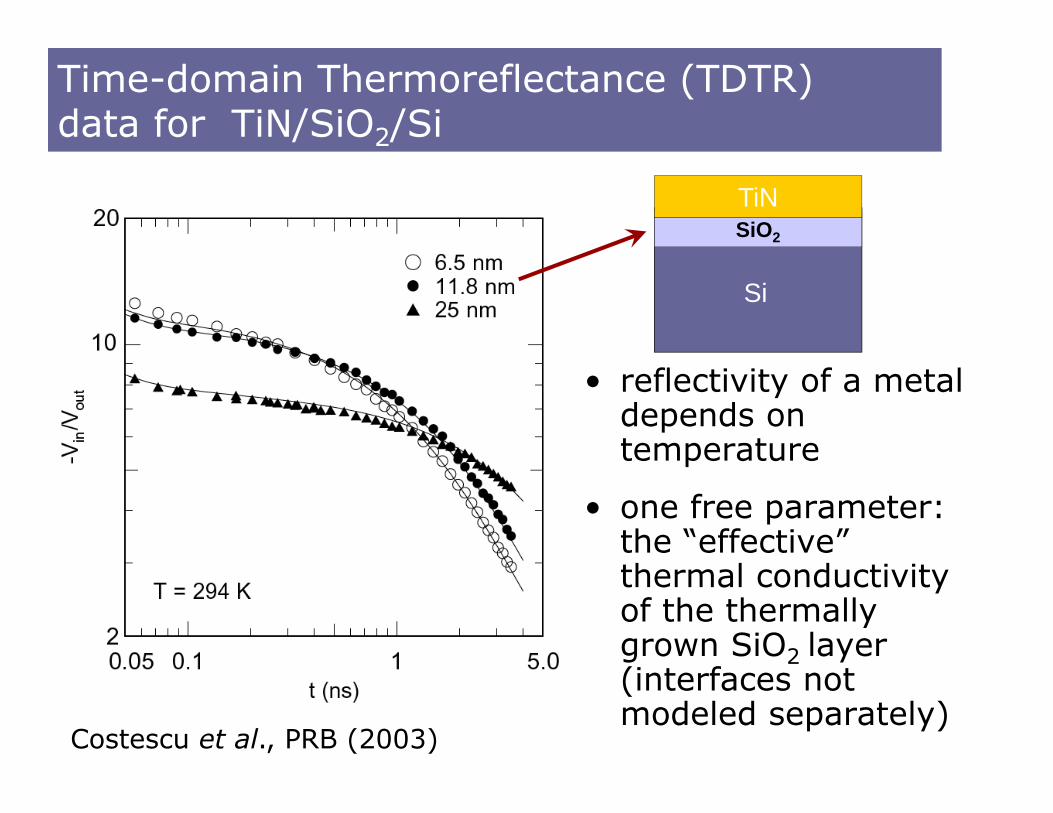
Time-domain Thermoreflectance (TDTR) data for TiN/SiO2/Si
• reflectivity of a metal depends on temperature
• one free parameter: the “effective” thermal conductivity of the thermally grown SiO2 layer (interfaces not modeled separately)
SiO2
TiN
Si
Costescu et al., PRB (2003)
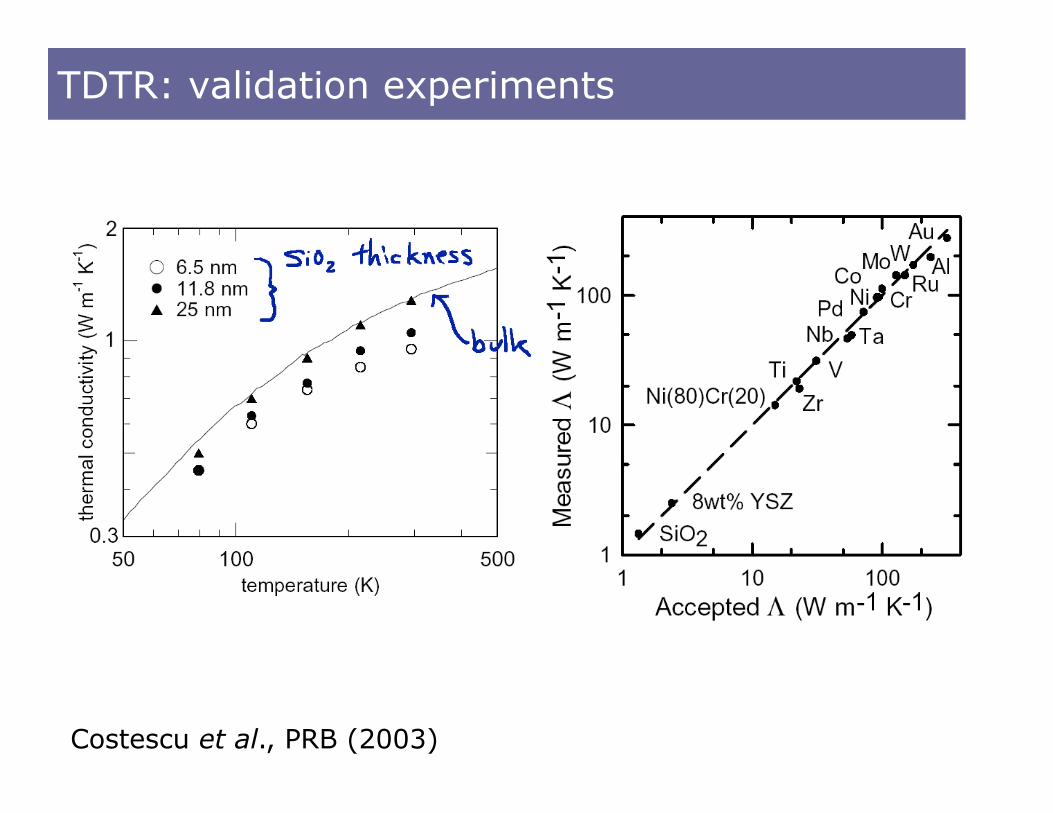
TDTR: validation experiments
Costescu et al., PRB (2003)

TDTR: Flexible, convenient, and accurate
2 10 1000
1
2
l (
W m
-1 K
-1)
h (nm)
PbTe/PbSe superlattices
Radiation damage
High resolution mapping
Transfer-printed interfaces

Can we beat the amorphous limit of the thermal conductivity min
• Einstein (1911): random walk of thermal energy
• Not good for crystals: Debye (1914)
• but does work for amorphous solids, Birch and Clark (1940); Kittel (1948)
• and crystals with strong atomic-scale disorder, Slack (1979); Cahill and Pohl (1988).

Einstein (1911)
• coupled the Einstein oscillators to 26 neighbors
• heat transport as a random walk of thermal energy between atoms; time scale of ½ vibrational period
• did not realize waves (phonons) are the normal modes of a crystal
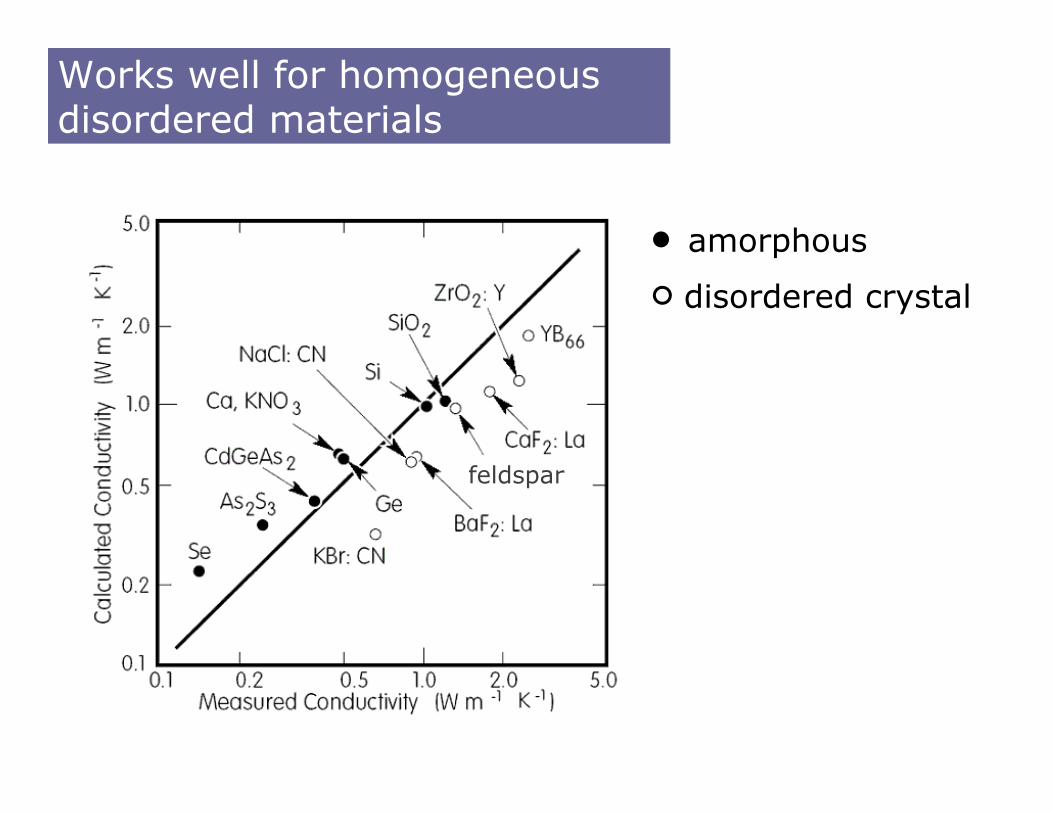
Works well for homogeneous disordered materials
disordered crystal
amorphous
feldspar

Fullerene derivatives have “ultralow” thermal conductivity, i.e., conductivity well below the conventional lower-limit
• Duda et al. (2013) reported 0.03 W m-1 K-1.
• We find all samples are in the range 0.05 to 0.06 W m-1 K-1.

Use thin films (≈60 nm and ≈120 nm thick ) and variable modulation frequency to separate thermal conductivity and heat capacity
60 nm 120 nm
ln( / )ln( )
in outd V VSd
Wang et al., PRB, in press.

Fit two parameters (C and Λ) to multiple data sets (modulation frequency, thickness)
• Assume heat capacity C doesn’t depend on thickness but allow thermal conductivity to vary with thickness.
Wang et al., PRB, in press.Heat capacity (J/cm3-K)
Ther
mal
con
duct
ivity
(W/m
-K)
0.5 1 2 0.02
0.05
0.1
0.2PMMA
C60
PCBNB-2PCBNB-3
PCBNB-1PCBM-EVP

Surprising result: fullerene derivative thermal conductivity (0.05 to 0.06 W m-1 K-1) is smaller than either C60 (by a factor of 2) or bulk polymer (by a factor of 3-4)
• Lowering of sound velocities (vl of PCBNB is 70% of vl for C60) but hard to explain the suppression of conductivity based on sound velocities alone.
Wang et al., PRB, in press.

Why is the thermal conductivity a factor of 2 less than disordered C60 and a factor of 4 less than a glassy polymer?
• Heat capacity per unit volume is almost the same.
• Longitudinal sound velocities are 2.8 nm/ps, 40% smaller than C60. So lower vibrational frequencies of the C60 center of mass explains some of the difference.
• Vibrational states of the polymer chains do not seem to be contributing to the heat transport.
• Computational studies would be useful to understand the mechanism and optimize the polymer chain molecular weight.
Wang et al., PRB, in press.

Analyze ratio Vin/Vout using an exact solution of the heat diffusion equation

TDTR is all optical method: adaptable to “extreme” environments such as high pressure
Diamond anvil cell
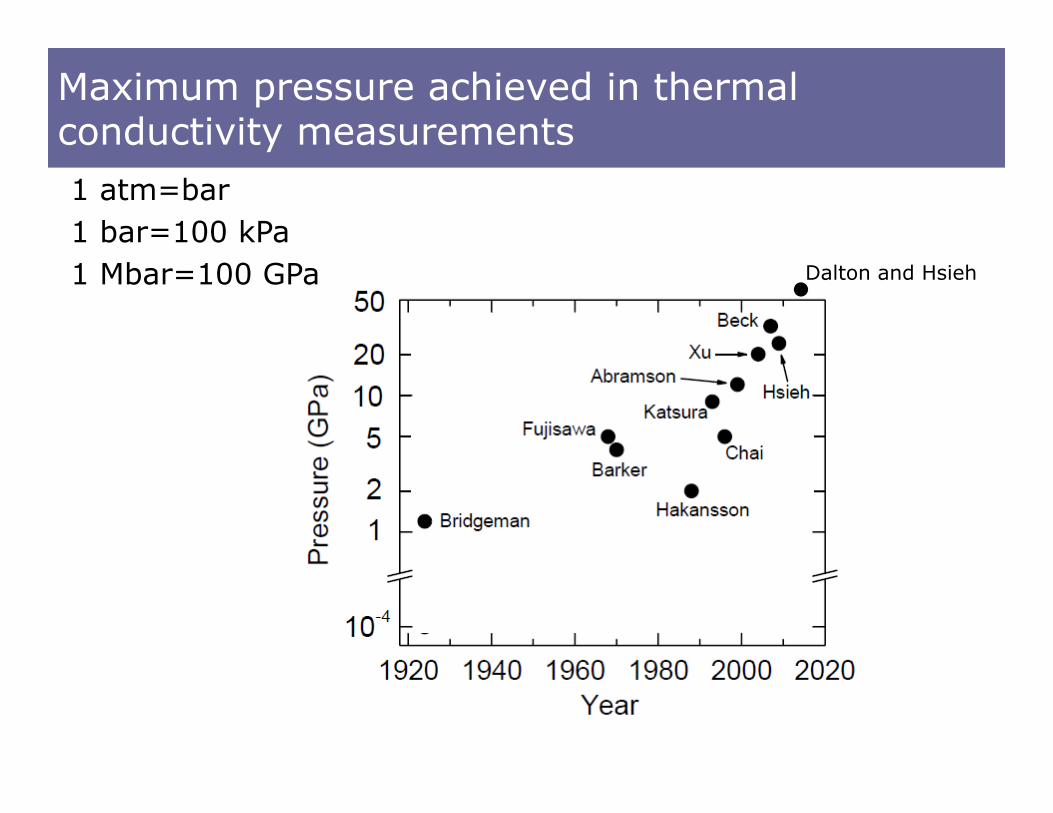
Maximum pressure achieved in thermal conductivity measurements
Dalton and Hsieh
1 atm=bar1 bar=100 kPa1 Mbar=100 GPa

Core-mantle boundary is ≈135 GPa
http://my.opera.com/nielsol/blog/2008/11/13/core-mantle-boundary
TDTR data for MgO
Currently working on (Mg,Fe)O
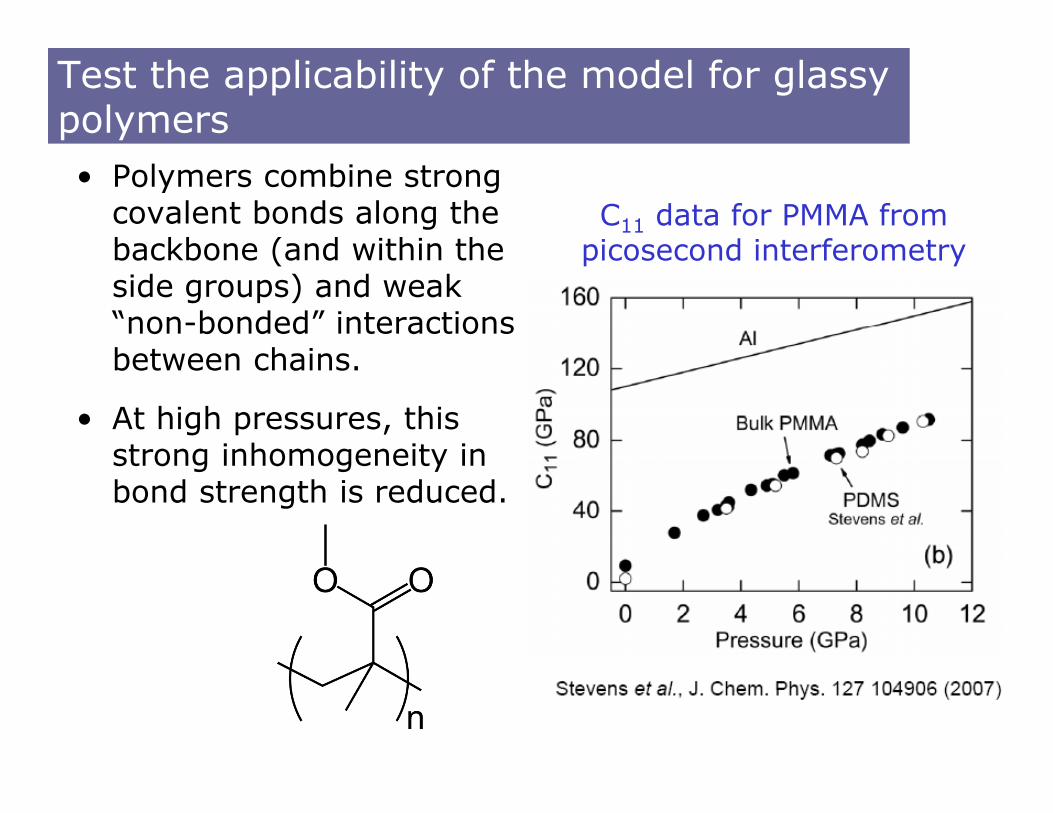
Test the applicability of the model for glassy polymers• Polymers combine strong
covalent bonds along the backbone (and within the side groups) and weak “non-bonded” interactions between chains.
• At high pressures, this strong inhomogeneity in bond strength is reduced.
C11 data for PMMA from picosecond interferometry
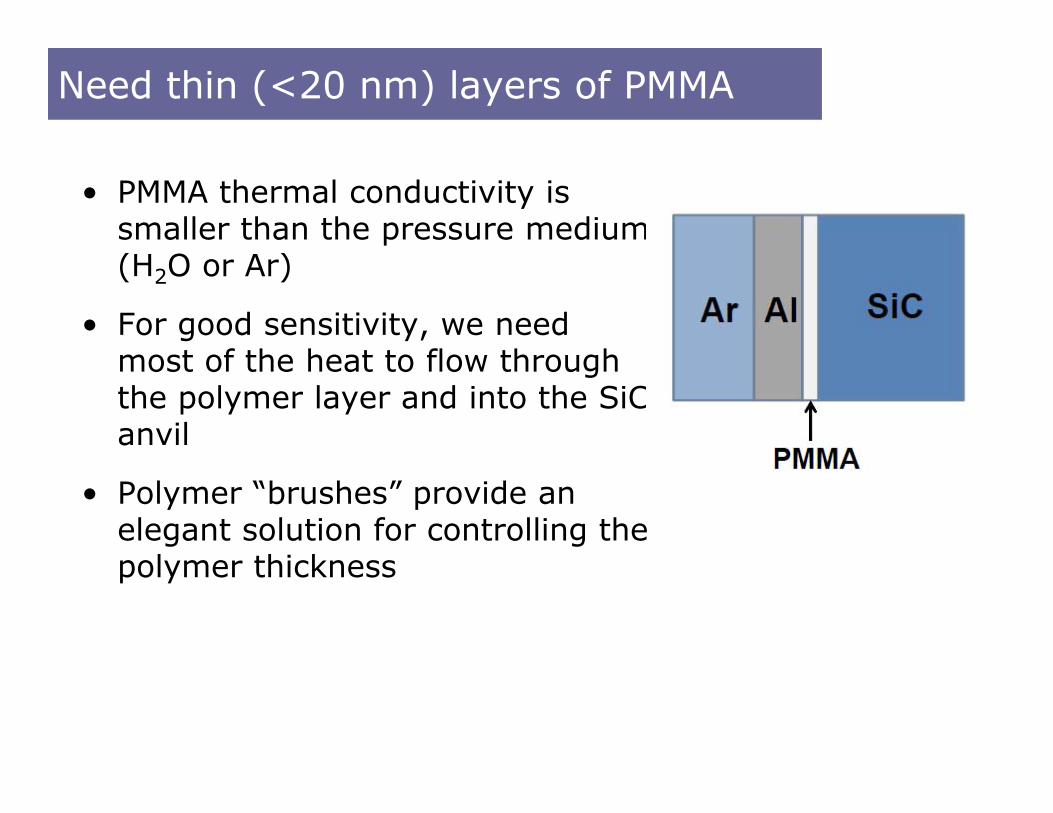
Need thin (<20 nm) layers of PMMA
• PMMA thermal conductivity is smaller than the pressure medium (H2O or Ar)
• For good sensitivity, we need most of the heat to flow through the polymer layer and into the SiCanvil
• Polymer “brushes” provide an elegant solution for controlling the polymer thickness
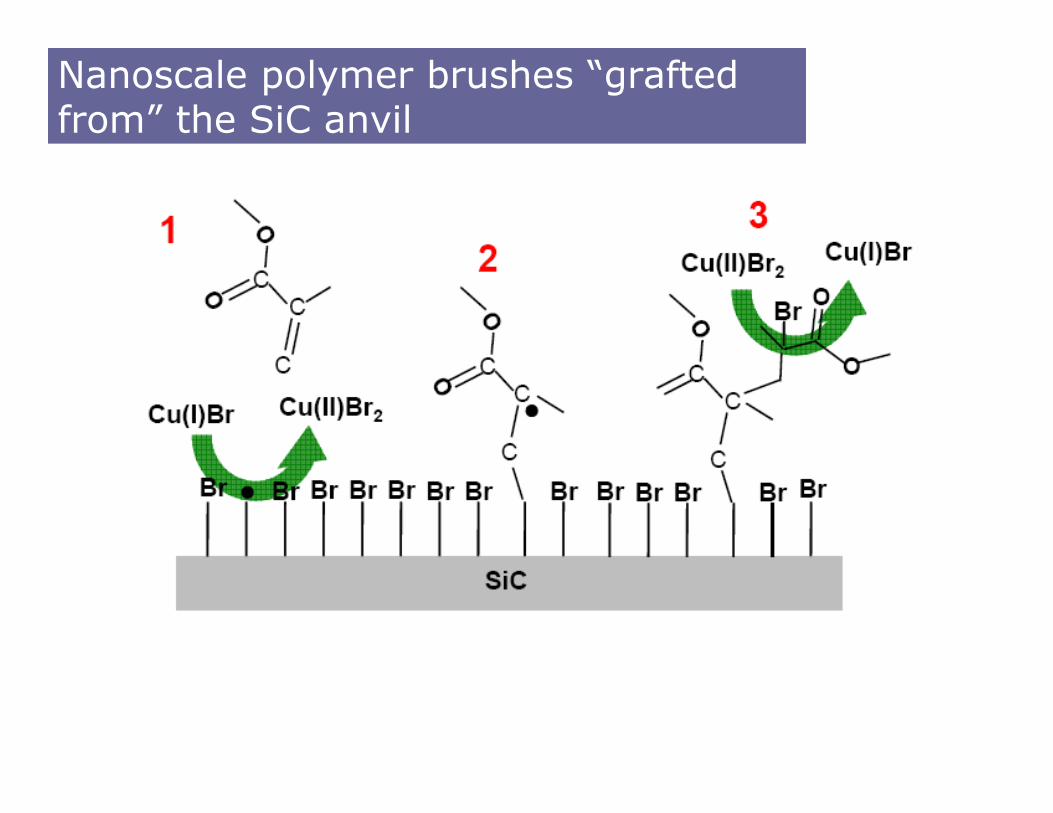
Nanoscale polymer brushes “grafted from” the SiC anvil
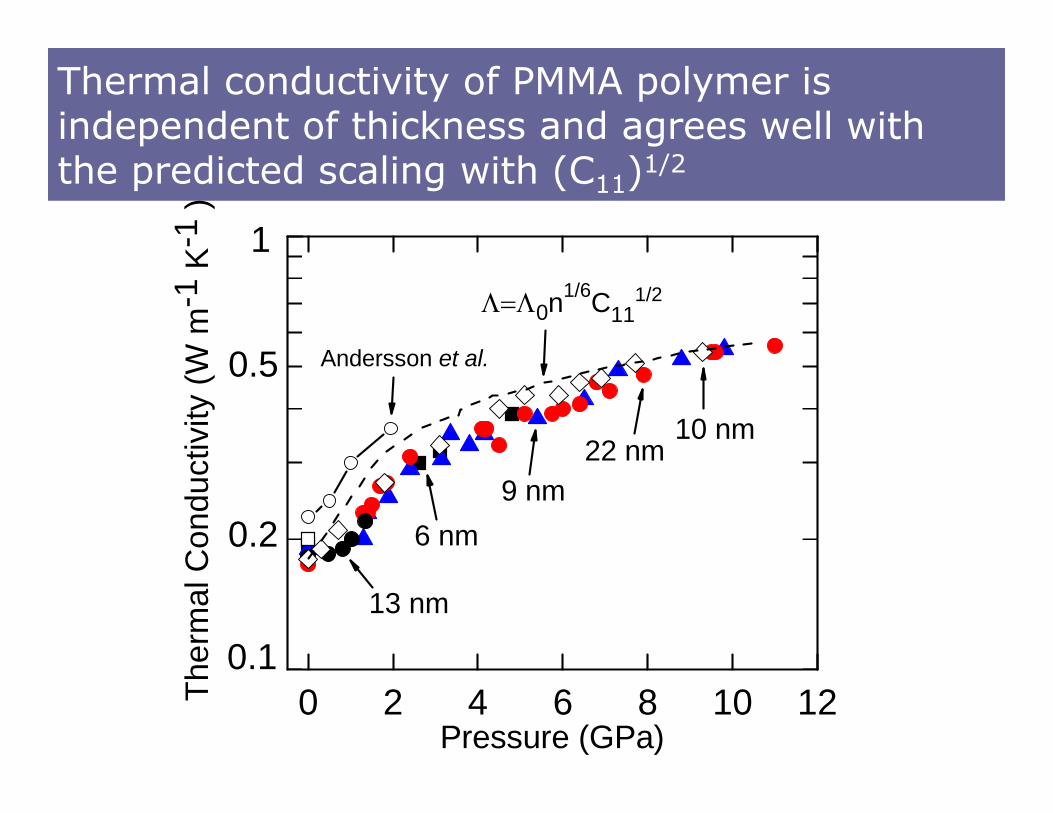
Thermal conductivity of PMMA polymer is independent of thickness and agrees well with the predicted scaling with (C11)1/2
0 2 4 6 8 10 12
1
10 nm
Andersson et al.
0.1
0.2
0.5
13 nm
9 nm6 nm
22 nm
0n1/6C111/2
Th
erm
al C
ondu
ctiv
ity (W
m-1
K-1
)
Pressure (GPa)

Reports of extremely high thermal conductivity in polymer fibers
• Fujishiro et al., Jpn. J. Appl. Phys. (1997) Dyneema polyethylene fibers
60 W/m-K
• Shen et al., Nature Nanotechnol. (2010) individual polyethylene nanofiber,
100 W/m-K
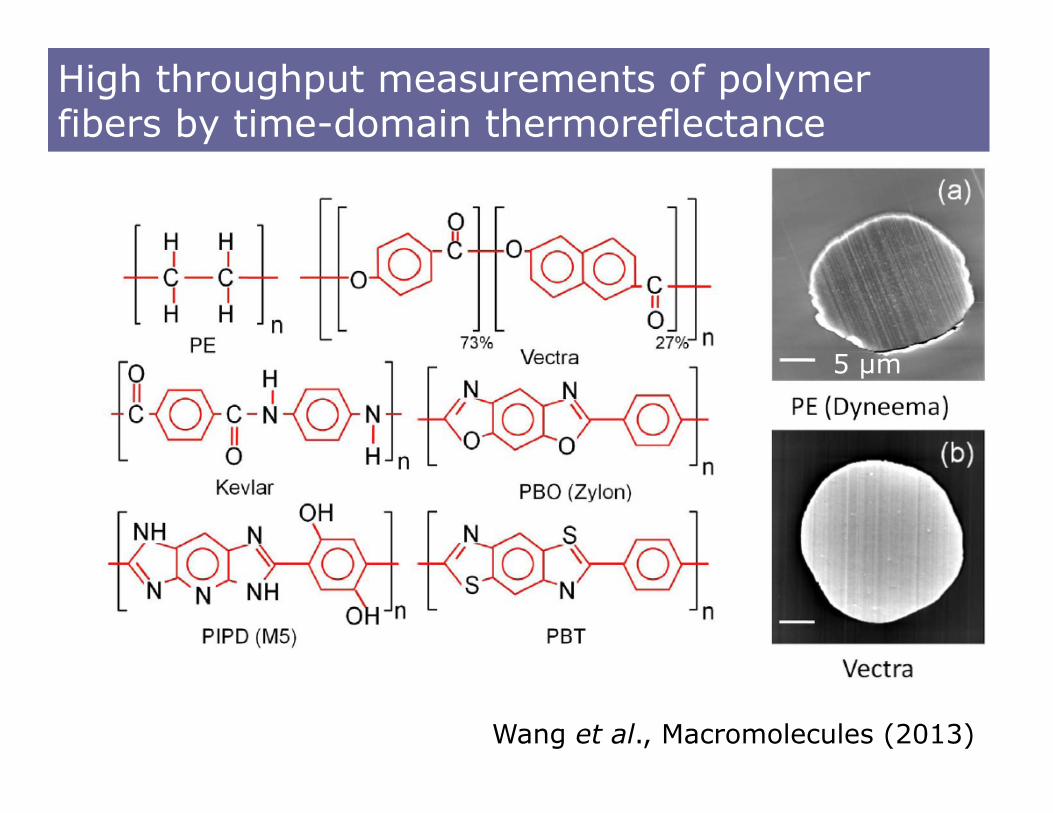
High throughput measurements of polymer fibers by time-domain thermoreflectance
30 μm
5 μm
Wang et al., Macromolecules (2013)

High throughput measurements of polymer fibers by time-domain thermoreflectance
Wang et al., Macromolecules (2013)
30 μm
5 μm
50 100 200200 5001
2
5
10
20
30
Th
erm
al c
ondu
ctiv
ity (W
m-1K
-1)
Vectra
Kevlar
PBT
M5AS
Dyneema
Spectra2000Spectra900
ZylonAS
ZylonHM
Tensile modulus (GPa)
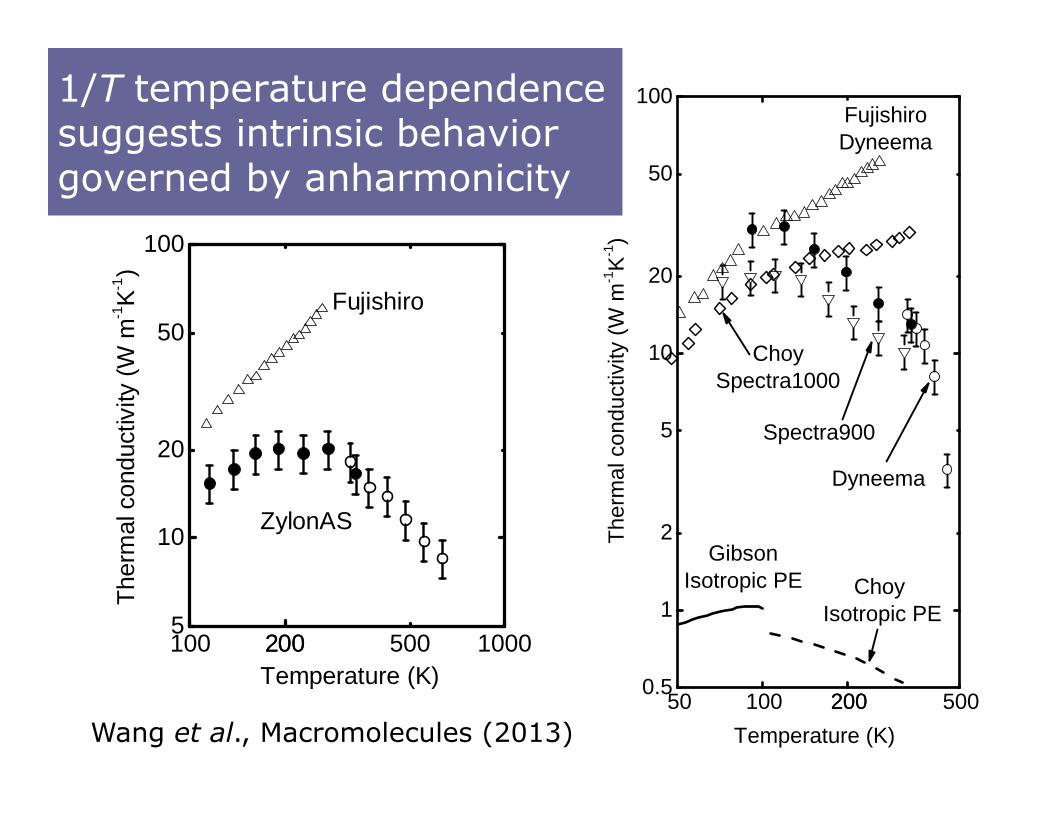
1/T temperature dependence suggests intrinsic behavior governed by anharmonicity
30 μm
5 μm
50 100 200200 5000.5
1
2
5
10
20
50
100
ChoySpectra1000
Ther
mal
con
duct
ivity
(W m
-1K
-1)
Choy Isotropic PE
GibsonIsotropic PE
FujishiroDyneema
Spectra900
Temperature (K)
Dyneema
100 200200 500 10005
10
20
50
100
ZylonAS
Temperature (K)
Ther
mal
con
duct
ivity
(W m
-1K-1
)
Fujishiro
Wang et al., Macromolecules (2013)

Work backwards to estimate vibrational state lifetime and mean-free-path
2 ( ) ( )zv C d
• Assume high velocity longitudinal modes dominate the thermal transport
• Average velocity in the z-direction (fiber axis) is cz.
• Make the usual Debye approximation but assume that only a small fraction of C is due to longitudinal acoustic modes, C≈0.06 J cm-3 K-1 for PBO
• With vz=104 m s-1:
2 21, zz z
x
c v cc
3 ps and 30 nmzv
Wang et al., Macromolecules (2013)
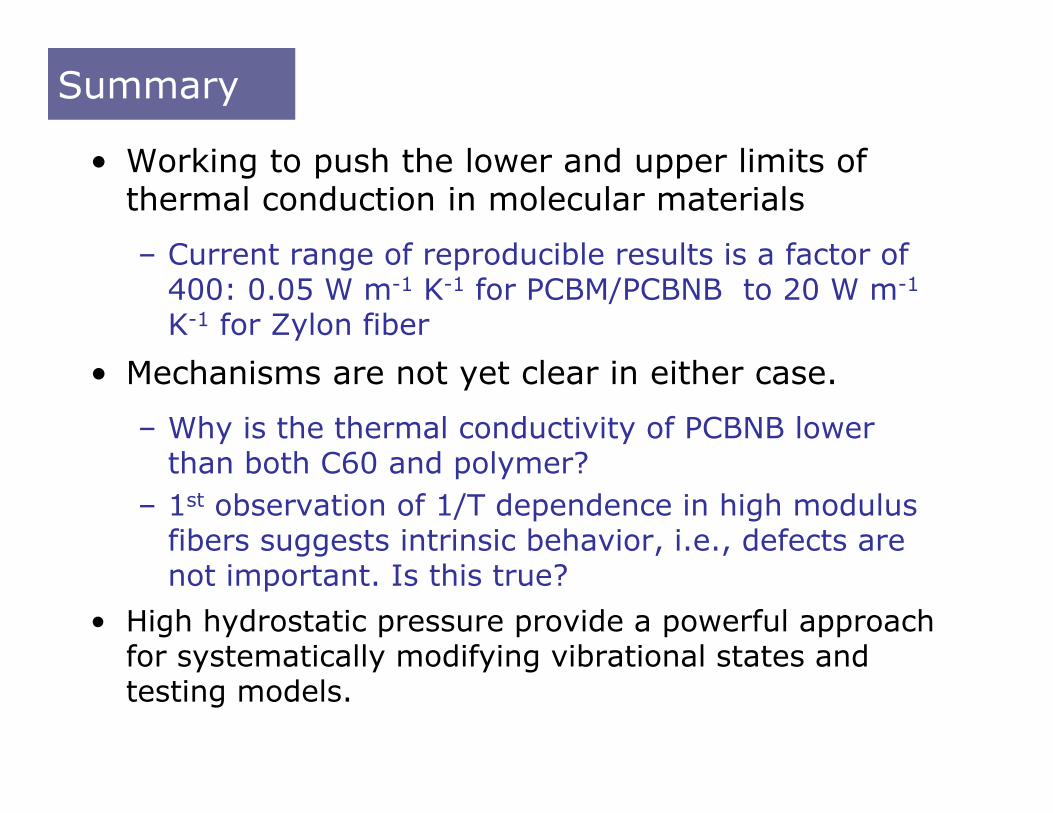
Summary
• Working to push the lower and upper limits of thermal conduction in molecular materials
– Current range of reproducible results is a factor of 400: 0.05 W m-1 K-1 for PCBM/PCBNB to 20 W m-1
K-1 for Zylon fiber• Mechanisms are not yet clear in either case.
– Why is the thermal conductivity of PCBNB lower than both C60 and polymer?
– 1st observation of 1/T dependence in high modulus fibers suggests intrinsic behavior, i.e., defects are not important. Is this true?
• High hydrostatic pressure provide a powerful approach for systematically modifying vibrational states and testing models.