EXTREME VACUUM TECHNOLOGY DEVELOPMENTS · EXTREME VACUUM TECHNOLOGY DEVELOPMENTS By Paul J. Bryant,...
49
i NASA CONTRACTOR REPORT N d M e U I 4 m 4 2 EXTREME VACUUM TECHNOLOGY DEVELOPMENTS I https://ntrs.nasa.gov/search.jsp?R=19650027165 2020-06-11T13:59:45+00:00Z
Transcript of EXTREME VACUUM TECHNOLOGY DEVELOPMENTS · EXTREME VACUUM TECHNOLOGY DEVELOPMENTS By Paul J. Bryant,...

i
N A S A C O N T R A C T O R
R E P O R T
N d
M
e U
I
4 m 4 2
EXTREME VACUUM TECHNOLOGY DEVELOPMENTS
I
https://ntrs.nasa.gov/search.jsp?R=19650027165 2020-06-11T13:59:45+00:00Z
EXTREME VACUUM TECHNOLOGY DEVELOPMENTS
By Paul J. Bryant, Charles M. Gosselin, and William W. Longley, Jr.
Distribution of this report is provided in the interest of information exchange. Responsibility for the contents resides in the author or organization that prepared it.
Prepared under Contract No. NASr-63(06) by MIDWEST RESEARCH INSTITUTE
Kansas City, Mo.
for
NATIONAL AERONAUTICS AND SPACE ADMINISTRATION ~~~~~ ~ ~~ ~
For sale by the Clearinghouse for Federal Scientific and Technical Information Springfield, Virginia 22151 - Price $2.00

CONTENTS
Development of a Dual Expansion Nozzle for Improved Diffusion Pump Operation 2
Residual Gas Analysis of UHV Systems 6
A Study of Cryopumping for Inert Gases 13
A Study of the Cold Welding Ability of Structural Materials Under Typical Conditions of Use 26
A Pressure Calibration Study for the Ultra-High Vacuum Range Including the Use of a Field Emission Microscope 33
iii
SUMMARY
Several phases re la t ing to the a t ta inment , measurement and applica- t i on of u l t ra -h igh vacuurrt environments axe reported below. The phases covered a re : developntent of a dual expansion nozzle for vapor-jet studies; determina- t ion o f the gases p resent in UHV systems with o i l d i f f u s i o n and ge t te r - ion purrtping; measurements and theory on cryopane'l operation; establishment of cold welding cri teria; and determination of r e sponse cha rac t e r i s t i c s fo r extreme high vacuunl gauges and field emission ndcroscopes.
A vapor nozzle with dual expansion chambers has been designed. Many people have dismissed the Florescu design on the bas i s o f h i s u l t imate p res - sure runs; however, those runs were vapor-pressure limited. The high velocity, low density upper j e t does improve pump performance, but more d e f i n i t i v e tests must be nlade .
An analysis of the gas species present in a UHV system with getter- ion and o i l d i f f u s i o n pumping has shown many interesting comparisons. An i m - portant discovery was made regarding the operation of traps above o i l d i f f u s i o n pumps. A combined cryogenic and chemical trap has shown t h e a b i l i t y t o g i v e more r e l i a b l e and economical service.
Experimental data for helium cryopumping a t 4.28'K on a s t a i n l e s s steel cryopanel has been obtained. In addition, the physical adsorption iso- therm based on a t r i angu la r s i te model has been improved i n , s e v e r a l ways. The energy contributions due to nearest neighbors have been evaluated on an i m - proved model. The change in e f fec t ive adsorp t ion energy i s notable. Predic- t ions of the revised theory are presented.
A guidelines study on cold welding has been performed. The r e s u l t s from three cases rray be surmarized as follows. For the ideal case, when molecularly smooth c leaved c rys ta l s are permit ted to reheal , cold welding takes place due t o t h e l a r g e area of contact which i s reformed a t normal atomic la t t ice spac ings . When s t ruc tura l meta ls wi th o r ig ina l o r po l i shed sur faces make touch contact after exposure t o simulated space environments, cold weld- ing does not take place. When s t ruc tu ra l ma te r i a l s are sub jec t ed t o vibra- t ional contact under a 250 p s i normal load cold welding takes place t o a g r e a t e r e x t e n t i n vacuurtt than at atmospheric pressure.
The response of magnetron gauges i n t h e i r o r i g i n a l form and with a cesiat ion t reatment i s reviewed. Nunterous data have shown t h a t a charac te r i s - t i c break f rom l inear i ty and cu tof f l eve l exists f o r magnetron gauges and t h a t the pressure values a t which these characterist ics occur can be lowered by a cesiat ion t reatment . A f ie ld emission microscope has been constructed and tested.
I. INTRODUCTION
The simulation of a given vacuum or known environment i s required by rnany research programs. The investigation of physical or chemicai interac- t i o n s between materials r equ i r e s t ha t t he materials be pure, that the surface be c lean, or that the tes t environment be known and control led. The required l e v e l or accuracy for these condi t ions i s often greater than present technology provides , espec ia l ly in the case of space simulation.
For example, a number of space simulation experiments specify a vacuunt of to r r . The at ta inment of this pressure level appears to be within the abi l i ty of present technology. However, t h e measurement of 10-13 t o r r i s questionable. Only a few in t r ica te research ins t ruments for p ressure estimation are capable of ope ra t ing i n this range, while standard techniques and cormercial equipment give erroneous indications. Thus, the ability to measure a pressure of the level required for space s imulat ion is,at best, un- cer ta in . Present adsorpt ion isotherm predict ions for ideal ized condi t ions ind ica te , as mentioned above, t h a t it shou ld be poss ib l e t o a t t a in t o r r o r lower with l iquid helium cryopumping techniques. However, the isotherms for vapor pressures versus quant i t ies of various gas species cryosorbed by a given panel material are not complete. Thus, the length of time over which a specif ied pressure can be maintained i s a l so uncer ta in .
We may summarize t h i s g e n e r a l i n t r o d u c t i o n t o t h e problems of simu- l a t i n g t h e vacuum of space by observing that both the measurement and main- tenance of such low pressures are beyond the normal range of standard technol- ogy. Some special techniques may be applied, but these research methods are s t i l l in the experimental s tages . The development of several such areas of vacuum science and technology are desc r ibed i n t h i s r epor t .
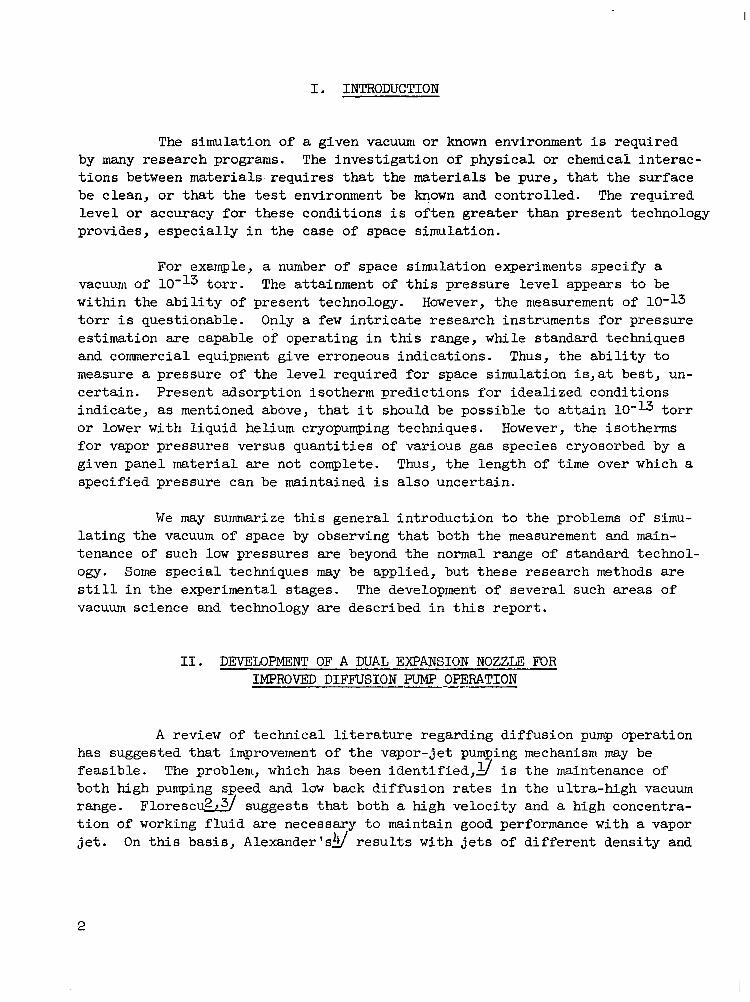
11. DEVELOPMENT OF A DUAL EXPANSION NOZZLE FOR IMPROVED DIFFUSION PUMP OPERATION
A review of technical l i terature regarding diffusion pump operation has suggested that improvement of the vapor- je t pumping mechanism may be feas ib le . The problem, which has been identified$ i s t h e maintenance of both high pumping speed and low back diffusion rates i n t h e u l t r a - h i g h vacuum range. F l o r e s c u d suggests that both a high velocity and a high concentra- t i o n of working f l u i d are necessary to maintain good performance with a vapor j e t . On t h i s basis, Alexander 'skl resul ts wi th j e t s of d i f f e ren t dens i ty and
2

veloci ty are explained by not ing that for high je t densi t ies an appreciable rebounding of gas nlolecules was the l imi t ing f ac to r i n pump speed, while for low j e t dens i t i e s t he re was an insufficient entrainment of gas rnolecules t o maintain a high pumping speed.
Kennedyg has performed experintents which tend t o support h is hy- po thes i s t ha t random compression waves from erupt ive boi l ing are an important source of backspreading, especially in baff led systems. Resul ts obtained under this program have shown t h a t punping speed i s lowered by overdriving the boiler temperature. The increase of fluid temperature does raise the j e t veloci ty; however, t he j e t densi ty rises even more rapidly. Partly due t o t h e increase in concentrat ion of vapor and p a r t l y due t o t h e r e l a t i v e l y low vapor velocity, increased backspreading of the vapor occurs a t high-jet concentra- t i ons . The decrease of pumping speed on overdriving a pump i s therefore be- l i e v e d t o be due t o t h i s backspreading. The f a l l o f f i n pump speed, as u l t i - mate or desorption l imited pressure i s reached, does indicate a difference of various pump f luids in regard to behavior under overdriving. The competition between increased veloci ty and increased backspreading thus lindts the usefu l hea t input to a normal diffusion pump.
Data obtained with a single jet under various conditionslz/ showed t h a t t h e punping speed reached a rnaxirnwn and then began t o f a l l o f f , a s b o i l e r pressure was raised. However, the pressure difference across the j e t continued to increase with boiler pressure. These data nay be in te rpre ted as a confirna- tion of higher entrainment by a more dense je t ; it a l so shows the de le te r ious e f f e c t upon entrainment caused by backspreading front a too dense je t . In addi - t ion , the exper imenta l resu l t s ind ica ted tha t the ab i l i ty o f a j e t to wi ths tand back diffusion i s d i r ec t ly p ropor t iona l t o i t s densi ty and t h a t more of t h a t ab i l i t y cou ld be r ea l i zed i f the conpeting process of backspreading could be reduced so t h a t s t i l l higher boiler pressures could be employed.
The use of a dual expansion nozzle design was proposed by F l o r e s c u d as a means of reconci l ing the two competing factors described above. Such a jet consis ts of a main nozzle surrounded by an umbrella nozzle (see Fig. 1). The umbrella. nozzle (according to Florescu's design) should have a greater ex- pansion ra t io than the main nozzle so t h a t t h e umbrella j e t w i l l consis t of a lower density stream than the main je t . The advantage of such a cornbination should be the reduct ion of backspreading, due t o t h e lower densi ty of the urn- brella, and a large pressure difference across the main je t , due t o i t s high densi ty . The use of higher boiler pressures should then be poss ib le s ince backspreading of the umbrella je t would be neg l ig ib l e un t i l h ighe r bo i l e r pressures are applied.
3

I
UMBRELLA NOZZLE MAIN NOZZLE
.DRIVE WHEEL
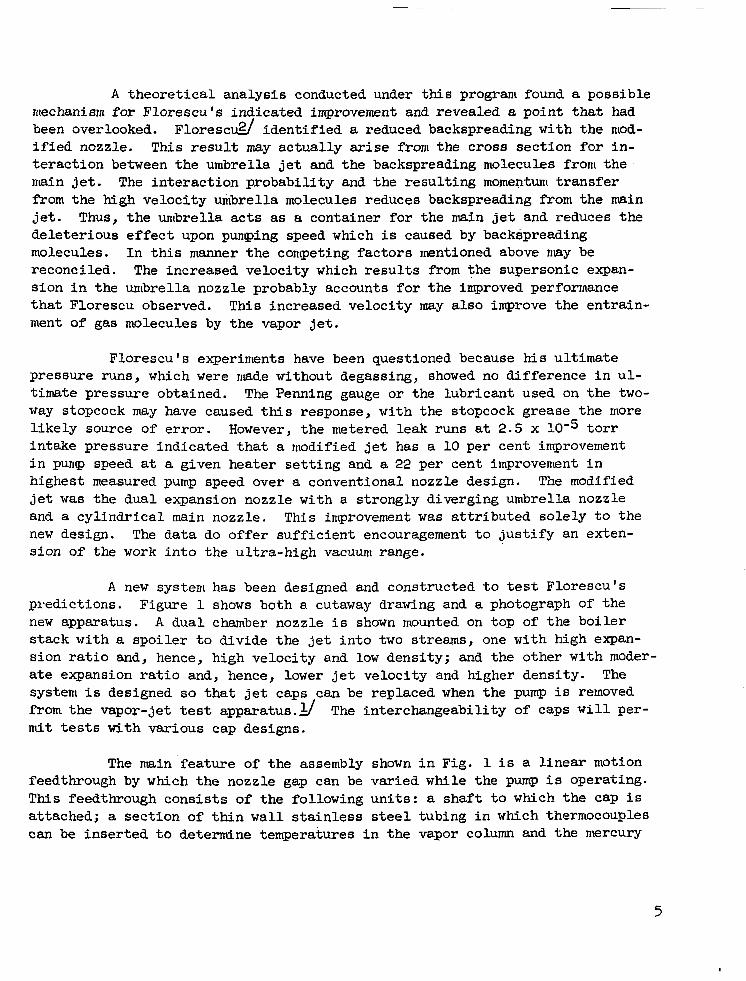
Fig. 1 - Diagram (Right) and Photograph (Left) of a Special Test Apparatus for Evaluation of Experimental Diffusion Pump Nozzles. A Dual Expansion Nozzle i s Shown. The Drive Mechanism Provides for Continuous Variation of Nozzle Gap During Operation.
A theoretical analysis conducted under t h i s program found a possible ntechanism for F lorescu’s ind ica ted improvement and revealed a po in t t ha t had been overlooked. F l o r e s c d i d e n t i f i e d a reduced backspreading with the mod- i f ied nozzle . This resul t may ac tua l ly arise from the c ross sec t ion for in - t e r ac t ion between the umbrella j e t and the backspreading molecules frorn the nlain je t . The in te rac t ion probabi l i ty and the resu l t ing momentum t r ans fe r f’rom the high velocity umbrella molecules reduces backspreading from the main jet. Thus, t h e umbrella a c t s as a container for the nlain j e t and reduces the de le te r ious e f fec t upon punrping speed which i s caused by backspreading molecules. I n t h i s manner the competing fac tors mentioned above nlay be reconciled. The increased velocity which r e s u l t s from the supersonic expan- sion in the umbrella nozzle probably accounts for the improved performance that Florescu observed. This increased velocity may a l so improve the en t ra in- ment of gas molecules by the vapor je t .
Florescu ‘ s experiments have been questioned because his ult imate pressure runs, which were rmde without degassing, showed no d i f f e rence i n u l - timate pressure obtained. The Penning gauge or the lubricant used on the two- way stopcock may have caused this response, with the stopcock grease the more l ikely source of error. However, the nletered leak runs a t 2.5 x 10” t o r r intake pressure indicated that a rnodified j e t has a 10 per cent improvement i n pur~rp speed a t a given heater set t ing and a 22 per cent improvement i n highest measured pump speed over a conventional nozzle design. The modified j e t was the dual expansion nozzle with a strongly diverging umbrella nozzle and a cy l ind r i ca l main nozzle. This improvement was a t t r i b u t e d s o l e l y t o t h e new design. The data do of fer suf f ic ien t encouragement t o j u s t i f y an exten- sion of the work in to the u l t ra -h igh vacuum range.
A new system has been designed and cons tmc ted t o test Florescu’s predictions. Figure 1 shows both a cutaway drawing and a photograph of the new apparatus. A dua l chamber nozzle i s shown mounted on top of the bo i le r s tack with a spo i l e r t o d iv ide t he j e t i n t o two streams, one with high expan- s ion r a t io and, hence, high velocity and low density; and the other with moder- ate expansion r a t i o and, hence, lower j e t v e l o c i t y and higher density. The system i s designed so t h a t j e t caps can be replaced when the pump is removed from the vapor-jet test appa ra tus .g The interchangeability of caps w i l l per- mit tests with various cap designs.
The nlain feature of the assembly shown i n Fig. 1 i s a l i nea r motion feedthrough by which the nozzle gap can be var ied while the pump i s operating. T h i s feedthrough consists of the following units: a s h a f t t o which the cap i s attached; a sect ion of t h i n w a l l stainless s teel tub ing i n which thermocouples can be inserted to determine temperatures in the vapor column and the mercury
5
boi le r ; a bellows assembly a t the bot tom of the boi ler to permit ver t ical dis- placement of the tube; a square shaft and square hole bushing t o reduce the danger of twisting the bellows assembly; and a threaded shaft through a ‘hlicrom- e t e r ” dial t o i n d i c a t e t h e n o z z l e gap. Both heater tapes and a r ing hea te r are provided so that thermal gradients within the mercury can be control led to reduce .e rupt ive bo i l ing . The nozzle gap can be var ied t o check the sensi- t i v i t y of pump speed t o nozzle spacing a t a given boiler temperature. The present method of gap va r i a t ion w i th a positive mechanical attachment w i l l avoid the blow-off problem which was encountered at very high boiler pressures with the punq assembly described i n Ref. 1.
I n i t i a l tests were run with the dual nozzle geometry shown in F ig . 1. The nozzle gap was varied over the ful l range of values to check the operat ion of the spoiler assembly. The dens i t i e s o f t he umbrella j e t and main j e t were determined by means of the quant i t ies o f f lu id t ransfer red by each per unit t ime. Results consistently showed a h igher t ransfer rate and thus a higher dens i ty for the ntain j e t than for the umbrella j e t . Thus, the larger expansion ratio of the untbrella nozzle together with the lower observed t r a n s f e r rate assures a higher j e t veloci ty as desired.
The r e s u l t s j u s t l i s t e d dentonstrate the basic operation of a dua l expansion nozzle of the Florescu type. They a l s o show the successful operation of our modified version of Florescu’s design over the full range of gap va.ria- t ion provided. The vapor-jet tes t system has been redesigned t o i n c r e a s e s e n s i t i v i t y so t h a t data co l l ec t ed i n t he fu tu re may possibly show irrproved operation with a dual nozzle.
111. RFSIDUAL GAS ANALYSIS OF UHV SYSTEMS
Analyses of the residual gases which a re p re sen t i n a well baked g l a s s s t a i n l e s s s t e e l vacuum system employing o i l d i f f u s i o n , i o n , and g e t t e r - ion pumping are reported below.
The residual gases above an o i l d i f f u s i o n pump (using a s p e c i a l t r a p with and without chemicals) have been determined for various trapping condi- t ions . The diff’usion punp, s p e c i a l t r a p (which can be operated with or without chemicals)* and par t ia l p ressure ana lyzer (PPA) used i n this work have been d e s c r i b e d e a r 1 i e r . g DC-705 s i l i c o n e o i l was chosen as the d i f fus ion pump fluid. Preceding the gas analysis, the PPA system, the spec ia l t r ap , and the plumbing connect ing the t rap t o t h e i n l e t o f the d i f fus ion pump were baked t o 400°C. The to ta l p ressure in the sys tem was from 2 t o 4 x 10’’ t o r r . It has
* CVC Absorbant A .
6
been r e p o r t e d t h a t chendcal traps operated a t room temperature are not suff i - c ient to reduce oi l contaminat ion i n UHV sys t em which are evacuated by o i l d i f fus ion punrp techniques. A study had been made of the effects of tempera- t u r e on the ab i l i t y o f t he t r ap ope ra t ion w i th and without chemicals t o reduce o i l contamination.
The vacuum system used i n th i s s tudy was described previous1y.g However, two major modifications have been ntade as follows. (.I) the ge t te r - ion pump was i so l a t ed from the PPA system by a 1-1/2 in. valve. This change was necessary because the getter-ion pump had a measurable e f f ec t on the r e s idua l gases in a vacuurlt system ( i n t h e UHV range) even when it i s not energized (e.g., desorption of gases such as argon and gettering of chemically active gases such as hydrogen) ; and (2 ) t he 2.8 kilogauss permanent magnet o r ig ina l ly used with the PPA was replaced with a 6.5 kilogauss electromagnet. The use of higher magnetic fields permit ted greater resolut ion and sensi t ivi ty in the mass t o charge r a t i o (nt/e) range above 50. Also, l inear i ty of response for the analyzer was ingroved by using magnetic scan techniques as compared t o e l e c t r o - s ta t ic scan techniques. *
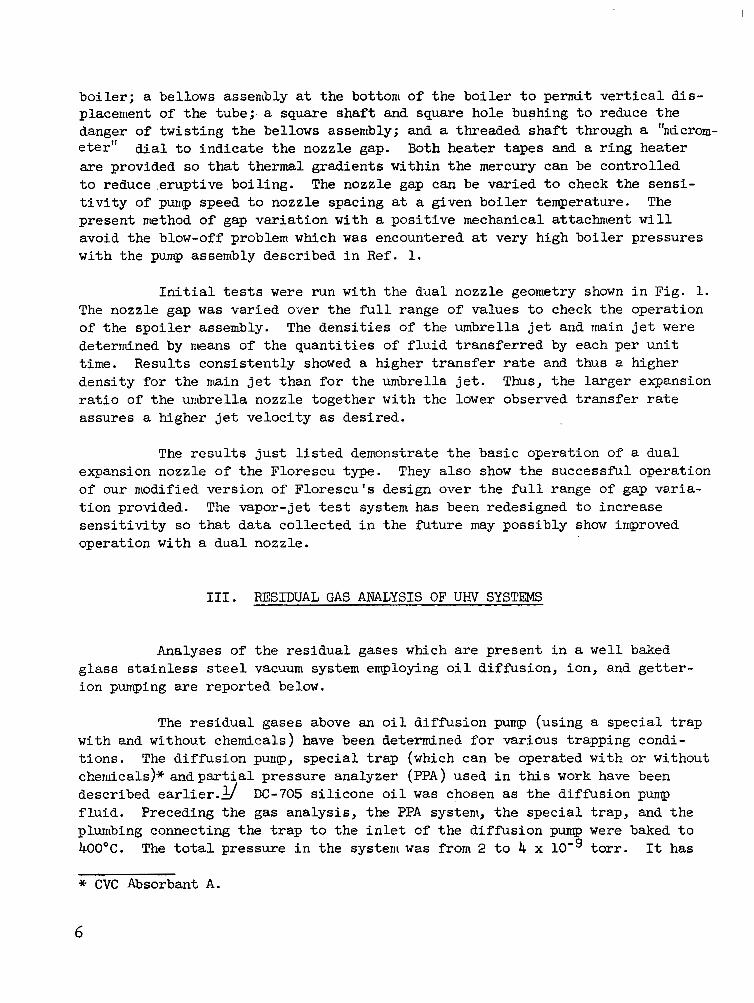
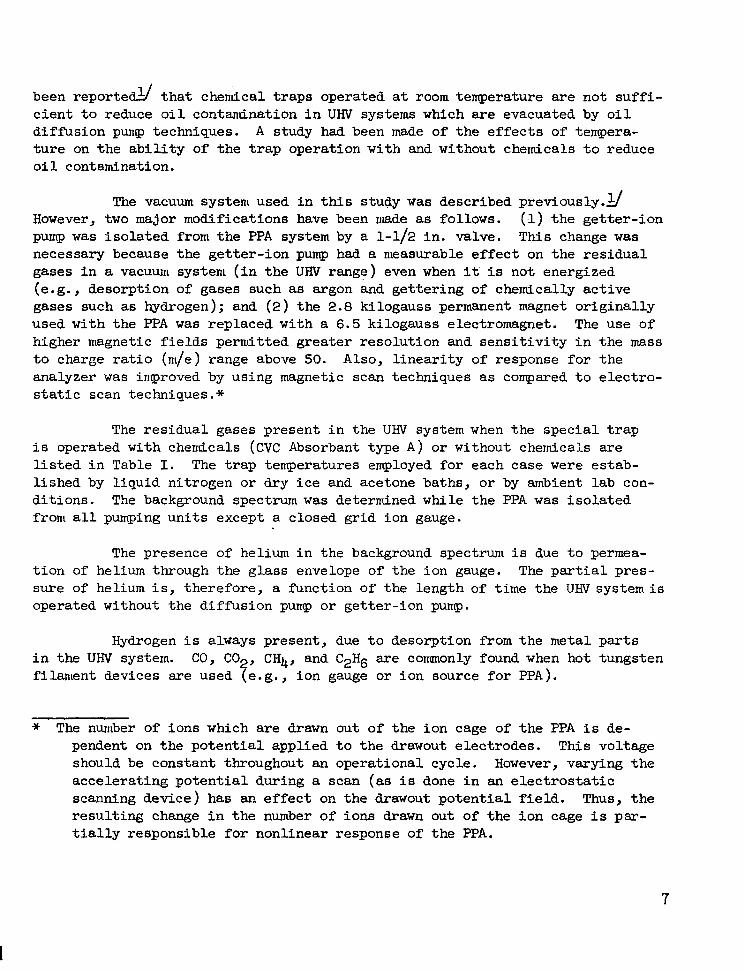
The res idua l gases p resent in the UHV system when t h e s p e c i a l t r a p i s operated with chendcals (CVC Absorbant type A ) or without chenticals are l isted i n Table I. The trap temperatures employed for each case were estab- l i shed by l iqu id n i t rogen or d ry i ce and acetone baths, or by arrtbient lab con- d i t ions . The background spectrum was determined while the PPA was i so l a t ed from a l l pumping uni ts except a c losed gr id ion gauge.
The presence of helium i n t h e background spectrum is due t o permea- t i o n of helium through t h e glass envelope of the ion gauge. The p a r t i a l p r e s - sure of helium i s , therefore , a function of the length of time the U W system i s operated without the d i f fus ion pump or get ter- ion punrp.
Hydrogen i s always present, due to desorp t ion from the metal p a r t s i n t h e UMT system. CO, CO , CH4, and C2H6 are commonly found when hot tungsten filantent devices are used ?e.@;. , ion gauge or ion source for PPA).
* The nunlber of ions which are drawn out of the ion cage of the PPA i s de- pendent on the po ten t i a l app l i ed t o t he drawout electrodes. This voltage should be constant throughout an operational cycle. However, varying the accelerat ing potent ia l dur ing a scan (as i s done i n an e l e c t r o s t a t i c scanning device) has ar? e f f e c t on the drawout p o t e n t i a l f i e l d . Thus, t he r e su l t i ng change i n t h e number of ions drawn out of the ion cage i s par- t ia l ly responsible for nonl inear response of t he PPA.
7
RESIDUAL GASES IN AN OIL DIFFUSION PUMPED UHV SYSTEM FOR SEVERAL TRAPPING
BACK GAS GROUND
"2 1.3 x 10⁻¹⁰ He 5.1 x 10⁻¹¹
CH4 2.2 x 10⁻¹⁰
H2O 1.6 x 10⁻¹²
c2 H2 - c2 H 4
- c o 7.8 x 10⁻¹¹
'2 H6 3 .4 x 10-12
A 5 . 8 x 10-13
'3 H6 -
co2 2.6 x 10⁻¹²
C 4 H 8
c6 H6
- -
c7 H e
ca H I 0
- -
TOTAL 4 .8 x 10-10
NO CHEMICAL IN TRAP
- I96O C - 78OC 25OC
3 . 1 ~ 1 0 - 9 2 . 5 x ~ 0 - 9 2 . 2 ~ 1 0 - 9 - - -
1.6 x 10⁻¹¹ 8.3 x IO'l1 1.3 X
9 . 4 x 10-12 5 . 0 x l0-l2 6.3 x - - 1.3 x 10⁻¹²
6.1 x 10⁻¹² 8 . 8 x 10-11 1.2 x IO-Io
2.1 x 10⁻¹¹ 1.3 x IO- lo 2 .0 x 10-1°
1.2 x 10⁻¹² 7.8 x 1.9 X 10'" - - -
4.7 x 10⁻¹³ 2.2 x 10⁻¹² 4.6 x 10⁻¹²
2 .6 x 10-12 3.8 x 10⁻¹² 4.5 x
3.6 X 10-13 8.3 X 10⁻¹³ 2.3 X 10⁻¹²
6 . 4 x 10-13 6.3 x 10⁻¹° 5.3 x - - 2.3 x 10⁻¹²
- 3.0 x 10⁻¹³ 9. I x 10-13
3.2 X 10⁻⁹ 3.8 X 10⁻⁹' 3.3 XIO-@
TABLE I - All significant gas species which constitute the total pressure are l isted for each case. DC-705 o i l was used; benzene (C6Hs) i s a characteristic gas. Note the values (torr, a i r equivalent)
of benzene fo r each condition.
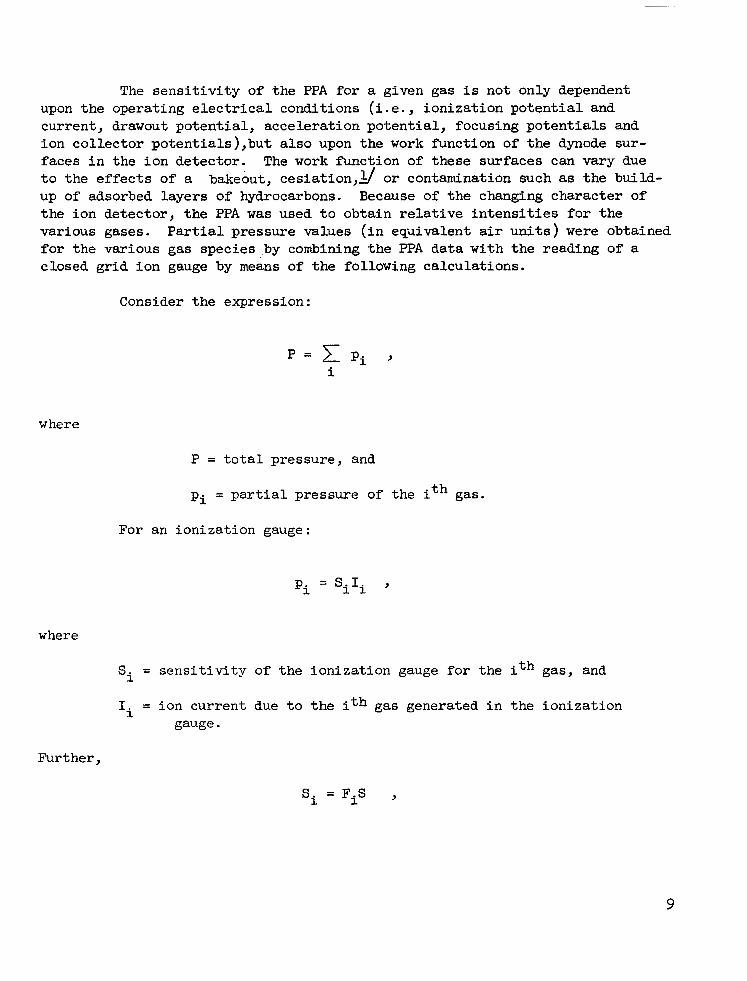
The sens i t iv i ty o f the PPA f o r a given gas i s not only dependent upon the opera t ing e lec t r ica l condi t ions ( i .e . , ionizat ion potent ia l and current, drawout potent ia l , accelerat ion potent ia l , focusing potent ia ls and ion co l lec tor po ten t ia l s ) ,bu t a l so upon the work function of the dynode sur- faces in the ion de tec tor . The work function of these surfaces can vary due t o t h e e f f e c t s of a bakeout, cesiation,g or contamination such as the bui ld- up of adsorbed layers of hydrocarbons. Because of the changing character of the ion detector , the PPA was used t o o b t a i n r e l a t i v e i n t e n s i t i e s f o r t h e various gases. Partial pressure values ( in equivalent a i r u n i t s ) were obtained for the various gas species ,by combining the PPA data with the reading of a closed gr id ion gauge by means of the following calculations.
Consider the expression:
where
P = t o t a l p re s su re , and
pi = par t ia l p ressure o f the ith gas.
For an ionization gauge:
pi = SiIi ,
where
Si = sens i t i v i ty o f t he i on iza t ion gauge f o r t h e ith gas, and
5. = ion current due t o t h e ith gas generated in the ionizat ion gauge.
Further,
Si = FiS ,
9

where = gauge constant for t h e ith gas, and Fi
S = s e n s i t i v i t y for a gas chosen t o be t he standard, e.g.,dry a i r .
Also,
Ii = a i I ,
where a = per cent of t o t a l ion current due t o t h e ith gas, and i
I = t o t a l i o n c u r r e n t .
Theref ore,
P = SI aiFi , i
but
S I = P ' ,
where P ' = i nd ica t ed t o t a l p re s su re ( a i r equivalent units)
so t h a t P = P ' x aiFi ,
i
which impl ies tha t
Pi = P'aiFi .
Expressed i n e q u i v a l e n t a i r units,
P; = P 'ai = p. 1 (equ iva len t a i r un i t s ) .
10

Now f o r t h e PPA
where ti = gauge cons t an t fo r i t h gas ,
bi j = col lector eff ic iency of the ion detector for the jth cracking product of the ith gas,
- S = s e n s i t i v i t y o f t h e PPA fo r d ry air , and
Ii = ion current due to the j th cracking product of the ith gas.
For these calculations, it w i l l be assunled t h a t :
bij = 1
x IijcrIi , and j
Fi = Fi -
These assunlptions intply t h a t
Therefore, ai can be determined by means of the PPA and appl ied to the equation
p; = P ' a i i n air equivalent units.
11

To convert these values to true p a r t i a l p r e s s u r e values, t h e set of gauge constants (Fi) i s needed,* i .e . ,
p; = P'aiFi
Surface generated ion& are no t l i s t ed i n t he t ab l e , s ince t hey do not have an observable effect on the res idua l gas . However, surface ions of L i , 0, F, Na, and C 1 were detected during this s tudy.
Reviewing the data presented in Table I, it i s noted that benzene i s the best indicator of the presence of d i f fus ion pump products in the system. A t LN2 temperature, both trapping conditions (i .e. , with or without chemicals ) are favorable for UHV operation. However, a t dry ice acetone temperature, a difference of two and one-half orders of magnitude i s noted. In this tempera- ture range, the presence of chemicals demonRtrates a s ignif icant advantage. The data a lso suggest t h a t a chemical t rap cooled to -78'C by mechanical re- f r i g e r a t i o n would provide effective trapping (even compared t o a nonchemical t r a p a t -196OC). The maintenance of l iquid ni t rogen t raps has long been a problem. Fluctuat ion of the ni t rogen level or loss of the coolant during a long term experiment has of ten nul l i f ied the experimental resul ts . The re- s u l t s o b t a i n e d i n this study show that the use of mechanical ly refr igerated chemical traps should prove to be very useful for vacuum systems employing o i l d i f fus ion PUMPS.
The res idua l gases p resent in the above described UHV system, when evacuated by a ge t te r - ion pump only, have a l s o been determined. The da t a which were taken following a 400°C bake are p resen ted i n Table 11. Again, pressures are given in equivalent air un i t s .
To obtain t rue par t ia l pressure values each of the measurements given i n Table I1 must be corrected by the gauge f ac to r s , Fi . The primary gases, hydrogen and carbon monoxide, a r e t yp ica l ly found i n metal systems i n which hot tungsten filaments are used.
* Published gauge factors for Varian c losed gr id ion gauge are 5 - 1.8, N2 - 0.9, O2 - 1.1, He - 5.6, %O - 1.0, C02 - 0.66, CO - 0.85, Hg - 0.26, A - 0.76, Ne - 3.8, K r - 0.48, Xe - 0.33, a i r - 1.0
12
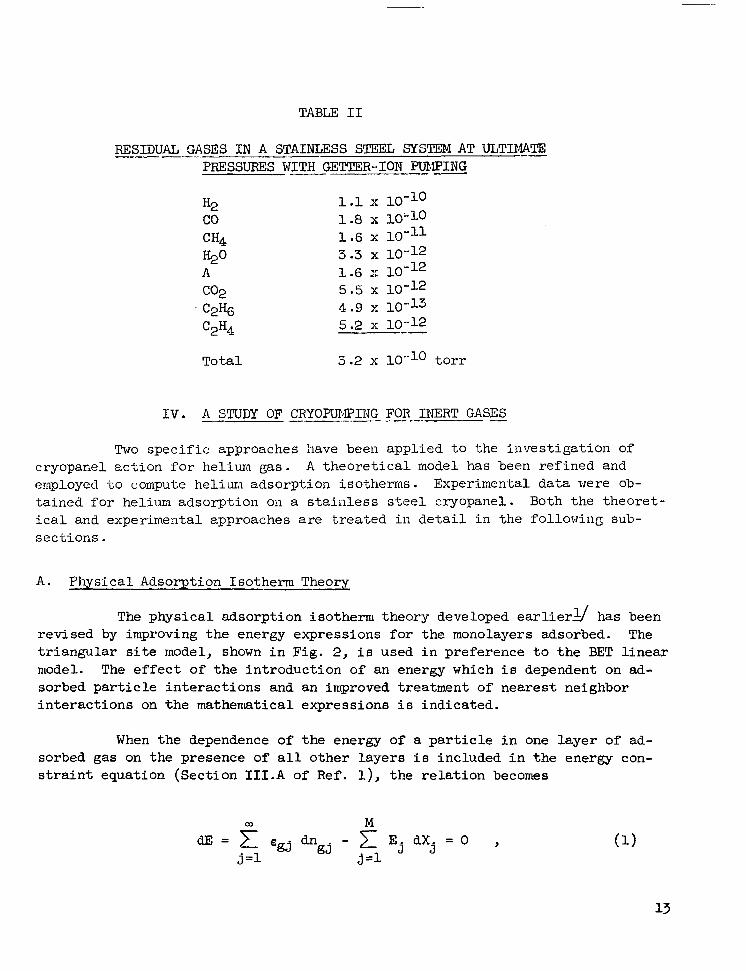
TABLE I1
”- BESUIUAL GASES I N A STA1NI;ESS S m L SYSTEM AT ULTIM@ PFfdSSURES WITH GETTER-ION PUMPING
-
H 2
CH4 H20
co2
co
A
C2H6 C2H4
1.1 x 10⁻¹⁰ 1.8 x 1 .G x 10-l’ 3.3 x l O ” 2
5.5 x 10⁻¹² 4.9 x 10⁻¹⁵ 5.2 x 10⁻¹²
1.6 ::
”
IV. A I____ STUDY OF CRYOPUI’dPING ” FOR INERT GASES
Two specific approaches have been appl ied to the inves t iga t ion of cryopanel action for helium gas. A t heo re t i ca l model has been refined and errployecl t o compute helium adsorption isotherms. Experimental data were ob- tained for helium adsorption on a s ta in less s tee l c ryopanel . Both the theoret- i c a l and experimental approaches are treated in d e t a i l i n t h e f o ~ ~ o w i l l ~ sub- sec t ions .
A . Physical Adsorption Isotherm Theory
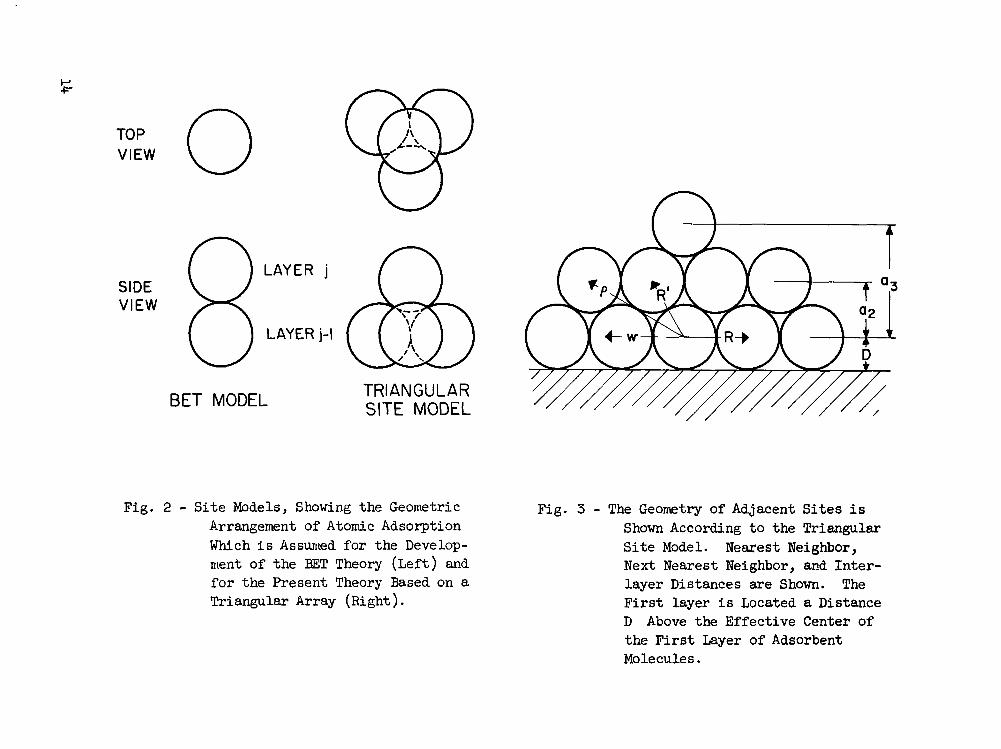
The physical adsorpt ion isotherm theory developed ear l ierg has been revised by improving the energy expressions for the monolayers adsorbed. The t r i angu la r s i te model, shown i n F i g . 2, i s used i n p r e f e r e n c e t o t h e BET l i nea r model. The effect of the introduction of an energy which i s dependent on ad- sorbed par t ic le in te rac t ions and an improved treatment of nearest neighbor in t e rac t ions on the mathenlatical expressions i s indicated.
When t h e dependence of the energy of a p a r t i c l e i n one layer of ad- sorbed gas on the presence of a l l o ther l ayers i s included in the energy con- s t ra int equat ion (Sect ion 1II.A of Ref. l), t h e r e l a t i o n becomes
m M
Top VIEW 0 SIDE VIEW 8 LAYER j
LAYER j-l
W
BET MODEL TRIANGULAR SITE MODEL
Fig. 2 - S i t e Models, Showing the Geometric Arrangement of Atomic Adsorption Which i s Assumed for the Develop- ment of the BET Theory (Left) and for the Present Theory Based on a Triangular Array (Right).
n
Fig. 3 - The Geometry of Adjacent S i t e s i s Shown According to the Triangular S i t e Model. Nearest Neighbor, Next Nearest Neighbor, and In te r - layer Distances are Shown. The Fi rs t l ayer i s Located a Distance D Above the Effective Center of t h e F i r s t Layer of Adsorbent Molecule s .
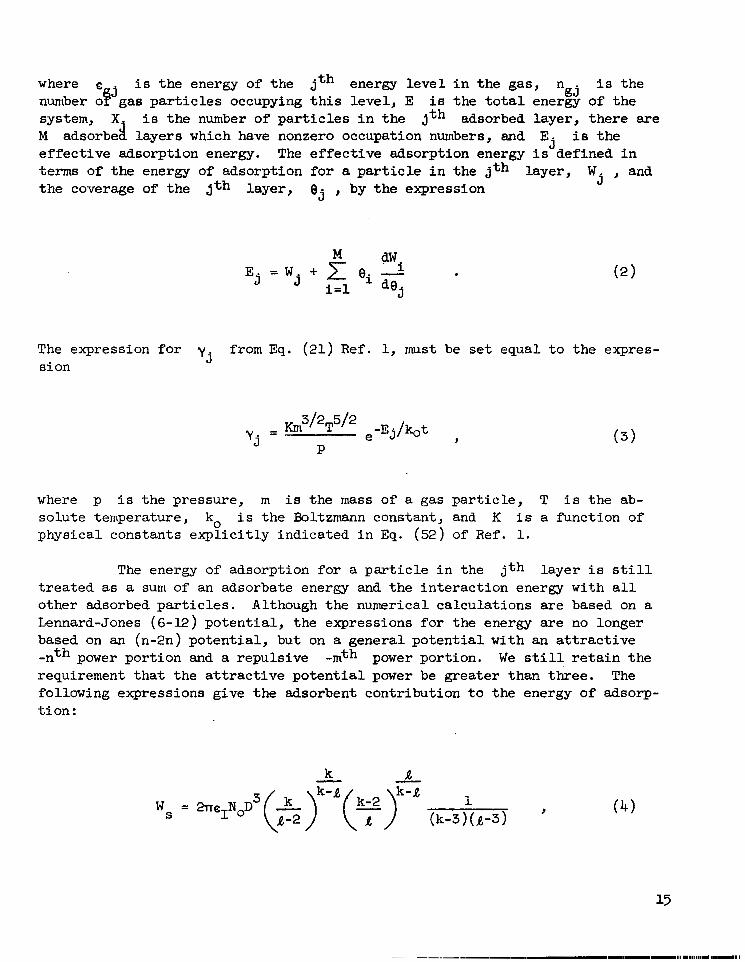
where . i s the energy of t h e jth energy level in the gas , n i s t h e number ofJgas par t ic les occupying this level , E i s the to ta l energy of t h e system, X. i s t h e number of p a r t i c l e s i n t h e jth adsorbed layer, there are M adsorbed layers which have nonzero occupation nunbers, and E i s t h e effective adsorption energy. The effective adsorption energy i s d e f i n e d i n terms of the energy of adsorpt ion for a p a r t i c l e i n t h e jth layer , W j , and the coverage of t h e j t h l a y e r , e j , by the expression
g j
j
The expression for y from Eq. (21) R e f . 1, must be set equal to the expres- s i on 3
J P
where p i s the pressure, rn i s the mass of a gas par t ic le , T i s the ab- solute temperature, ko i s t h e Boltzmann constant, and K is a function of phys ica l cons tan ts expl ic i t ly ind ica ted in Eq. (52) of R e f . 1.
The energy of adsorpt ion for a p a r t i c l e i n t h e j t h l a y e r i s s t i l l t r ea t ed as a sum of an adsorbate energy and the interact ion energy wi th a l l other adsorbed particles. Although the numerical calculations are based on a Lennard-Jones (6-12) potential , the expressions for the energy are no longer based on an (n-2n) potent ia l , but on a gene ra l po ten t i a l w i th an a t t r ac t ive -nth power port ion and a repuls ive -mth power port ion. We s t i l l r e t a i n t h e requi rement tha t the a t t rac t ive po ten t ia l parer be greater than three. The following expressions give the adsorbent contribution t o the energy of adsorp- ti on :

where cI i s t h e ntaximum a t t r ac t ive ene rgy i n the (A-k) curve for the i n t e r - ac t ion between one gas p a r t i c l e and one atom from the adsorbate , D i s the equi l ibr ium dis tance between the cen te r s of the par t ic les adsorbed in the f i rs t layer and a representat ive surface, No i s the density of adsorbate r o l e cu le s , and aj i s the d i s tance between the plane of centers for layer j and the plane of cen ters for l ayer one. Figure 3 shows D and a as wel l as the dirrensions used i n t h e c a l c u l a t i o n of cooperat ive interact ion of the adsorbed par t ic les .
j
For adsorbed particles which are not nearest neighbors, the z-func- ti on deve loped t e n t i a l ,
earlier i s s t i l l used, but it i s genera l ized to an (n-m) PO-
1
where 6 i s the maximum a t t rac t ive energy between two p a r t i c l e s , u i s the dis tance of closest approach, and cro i s the number of adsorbed molecules per u n i t area i n a corrrplete layer . If the i th layer has no s i t e s w i t h a nearest ne ighbor re la t ion to the p a r t i c l e of the j th l ayer under cons idera t ion , it contributes an amount t o W j of W i j , where
Except for layer j=1 , there i s one layer i n which three nearest neighbors are guaranteed, the j-1 layer , wi th a contr ibut ion
16
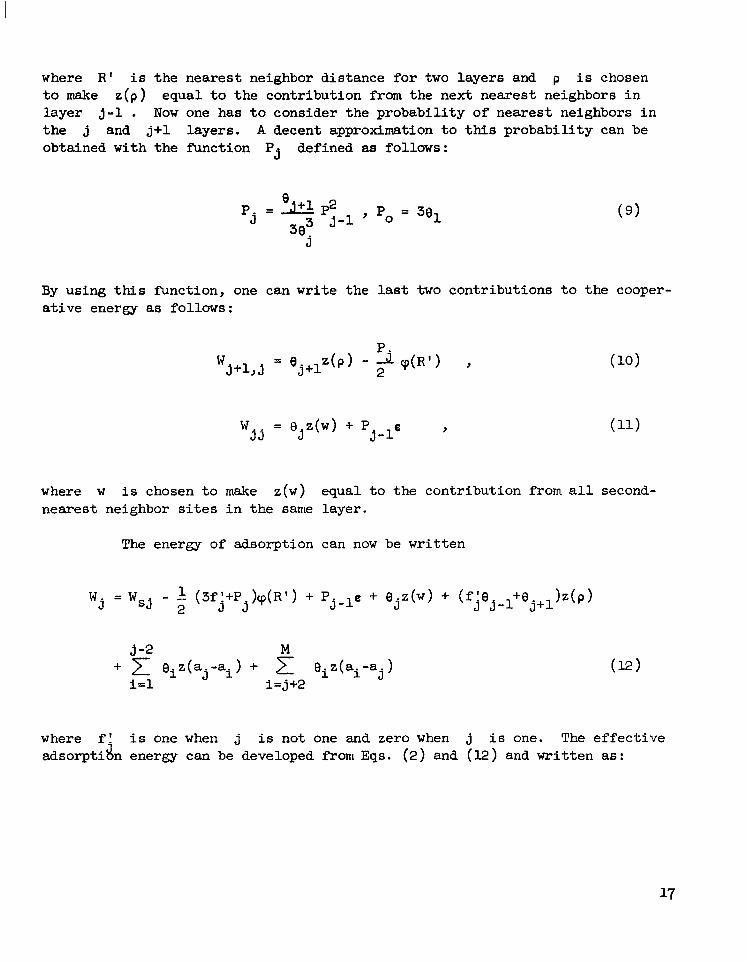
where R ' i s the nearest neighbor dis tance for two layers and p i s chosen t o make z(p ) equa l t o t he con t r ibu t ion from the next nearest neighbors in layer j-1 . Now one has to consider the probabi l i ty of nearest neighbors in t h e j and j+l layers. A decent approximation to this p robab i l i t y can be obtained with the funct ion P3 defined as follows:
BY using this function, one can wr i t e t he last two con t r ibu t ions t o t he cooper- ative energy as folluws:
where w i s chosen t o make z(w) equal t o t he con t r ibu t ion from a l l second- nearest neighbor s i tes i n the same layer.
The energy of adsorption can now be wr i t ten
W. = W - L (3f!+P.)cp(R') + Pj-le + ~.z(W) + (f;Oj-l+Bj+l)Z(P) J s j 2 J J J
J -2 M
i=1 i= j+2 + x eiz(aj-ai) + eiz(ai-a. J
where f ' i s one when j i s not one and zero when j i s one. The e f f e c t i v e adsorpti$n energy can be developed f'ronl Eqs. (2) and (12) and wr i t t en as:

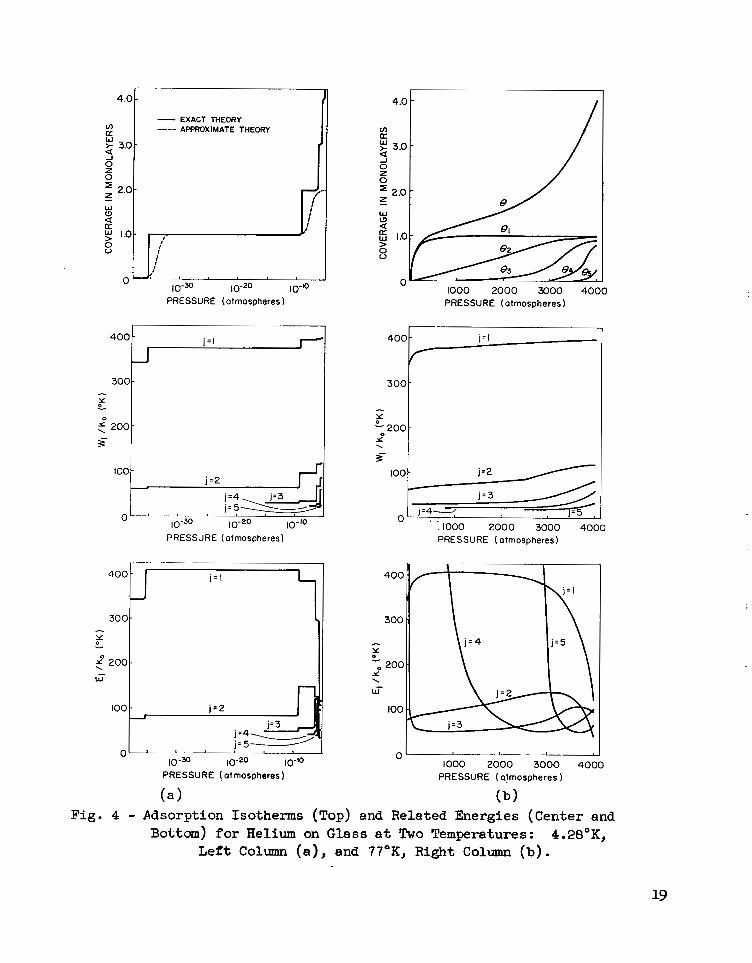
The effect of varying the energy treatment from tha t u sed i n Ref. 1 i s seen by comparing Fig. ba for helium on g l a s s at 4.28"K with Figs. 19 and 20 of R e f . 1. A demonstration that the energy dependence does not always lead t o a stepwise isotherm i s possible as shown by Fig. 4b f o r helium on g lass a t 77°K. For simplicity, an ideal hexagonal close-packed structure has been assumed for mult i layer configurat ions, thus y(R' ) has been set equa l t o - e .
The low temperature case, shown i n F i g . 4a, consists of sharp step- wise coverage of the surface with monolayers of helium. The approximate theory curve neglects the interact ion between helium p a r t i c l e s i n t h e same layer, thus not showing the s teep r ise of the exact theory. The logarithmic pressure sca le i s a convenient way t o show the fast completion of the steps. The rise of the energy of adsorption, Wj , with pressure is shown. The lower port ion of Fig. 4s shows the variation of effective adsorption energy, E j , with pressure and demonstrates a rapid decrease in the effect ive energy in low layers as higher layers are f i l l e d . One can speculate that when the e f f ec t ive energy of a higher s i te i s higher than the effective energy of a lower s i t e , there could be a r ed i s t r ibu t ion o f pa r t i c l e s from the lower layer t o a v a i l a b l e sites in t he h ighe r l aye r un t i l e i t he r a l l permitted sites i n the higher layer are f i l l ed o r the effect ive adsorpt ion energies are equalized. Such a t r a n s i - t i o n from two dimensional t o three dimensional condensation could suggest drop- l e t formation on a uniform surface; however, t he few numerical examples per- fornted have had both layers essentially complete or a seve re r e s t r i c t ion on number of avai lable si tes in the higher layer , thus rul ing out migrat ion from layer to l ayer .
The isotherm for helihm on g lass a t 77'K i s p lo t t ed i n F ig . 4b. A l inear plot of pressure i s used t o show the smoothness of the isotherm. The p a r t i a l occupancy of the ind iv idua l l ayers i s also shown. The energies of adsorption are ntonotonically increasing functions of pressure. The e f f ec t ive adsorpt ion energy, including inter layer interact ion energy effects , i s a l s o
18
I I
PRESSURE (otmospheres)
lot I
PRESSURE (atmospheres)
" 1000 2000 3000 4000
PRESSURE (atmospheres)
3001 I
i-loo+Zl j =2
j .3 j ~ 4 -
0 . IO00 2000 3000 4000 PRESSURE (atmospheres)
II - I1 \ 1'4 11'3 \ I
- t < 200
w -
loo c i = 2 I
Y 0 I 200- i \
IT
j =3
n - " 10-30 10-20 10"O
v 1000 2000 3000 4000
PRESSURE (atmospheres) PRESSURE (atmospheres
( 4 (b 1 Fig. 4 - Adsorption Isotherms (Top) and Related Energies (Center and
Bottom) f o r Helium on Glass a t Two Temperatures: 4.28'K, L e f t Column (a) , and 77"K, Right Column (b).
shown i n Fig. 4b. The e f fec t ive energ ies for l ayers one, two, and three show maxima, while the curves for layers three, four, and f ive show ndnima. The si te a v a i l a b i l i t y i n any layer being proportional t o the cube of the coverage in the p rev ious l ayer slows or prevents the migration of atoms from layer two t o l a y e r three at 100 atmospheres and from layer three to l aye r fou r a t 2,300 atmospheres. However, the general appearance of par t ia l layers above layer one i s qui te consis tent with the crossings of e f fec t ive energy l ines in F ig . 4b. However, since the cri t ical temperature for helium i s exceeded, one does not expect condensation t o a l iqu id to occur .
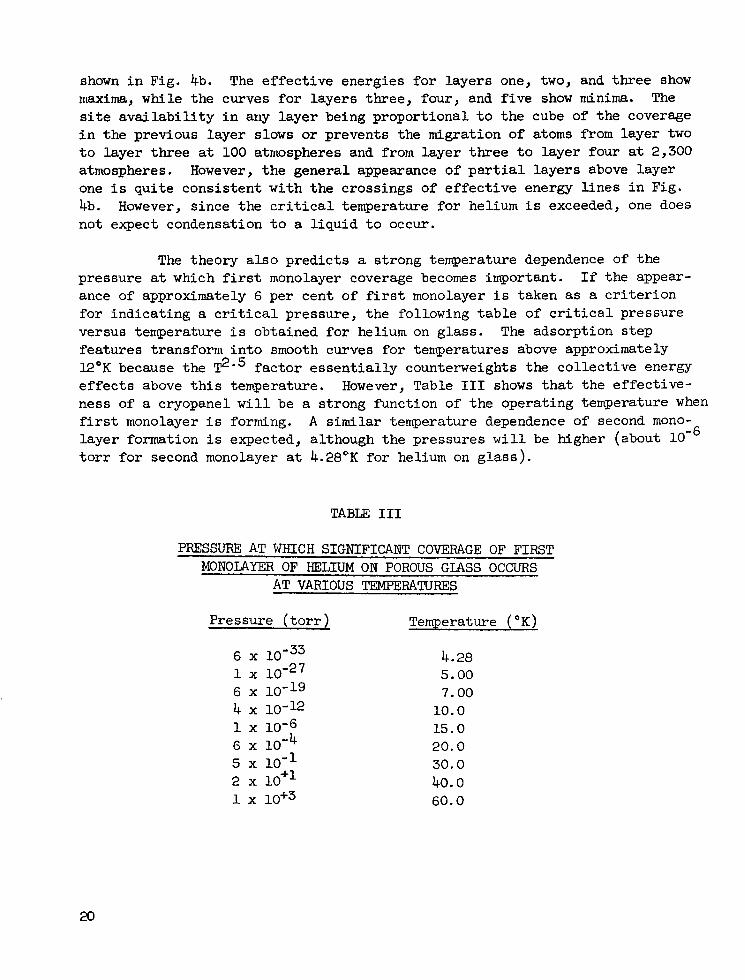
The theory a lso predicts a strong temperature dependence of the pressure at which first monolayer coverage becomes important. If the appear- ance of approximately 6 per cent of first monolayer i s taken as a c r i t e r i o n for ind ica t ing a cr i t ical pressure, the fol lowing table of c r i t i c a l p r e s s u r e versus temperature i s obtained for helium on glass . The adsorption step features t ransform into smooth curves for temperatures above approximately 12'K because the T2.5 factor essentially counterweights the collective energy e f f e c t s above this temperature . However, Table I11 shows that the e f fec t ive- ness of a cryopanel will be a strong function of the operating temperature when first monolayer i s forming. A similar temperature dependence of second mono- layer formation i s expected, although the pressures will be higher (about t o r r f o r second monolayer a t 4.28OK for helium on g l a s s ) .
TABLE I11
PRESSURE AT WHICH SIGNIFICANT COVERAGE OF FIRST MONOLAYER OF HELIUM ON POROUS GLASS OCCURS
AT VARIOUS TEMPERATURES
Pressure ( to r r )
6 x
6 x 1 x
4 x 10-12 1 x 10⁻⁶
5 x 10-I 2 x l O + l 1 X 10+3
6 x
Temperature (OK)
4.28 5.00 7.00 10.0 15.0 20.0 30.0 40.0 60.0
The inlportance of e f f ec t ive Ws neasurernents f o r systerrts of cryopurp- i n g i n t e r e s t i s i l l u s t r a t e d by t h e f a c t t h a t i f Ws/ko i s lowered by 23.0°K, then the p ressure for monolayer formation a t l O o K i s r a i sed by one order of nlagni tude.
B. Experimental . . .. . . Investigation of Heliunt Cryopumping;
The extreme high vacuum system developed under the present contract was used to evaluate cryopunping of helium gas on a s t a i n l e s s steel surface. Design of the system and experimental results are d.iscussed i n t h e two sub- sect ions below.
1. System design (experimental equipment) : The extreme high vacuum system (see Fig. 5 ) was des igned for genera l u t i l i ty . The design and opera- t ional techniques employed provide the following features: effective pumping of a l l gases including iner t species; s ignif icant reduct ion of the gases a r i s i n g from desorption and pernaation; and extremely sensi t ive par t ia l pres- sure measuring techniques.
The small gas loads expected indicated that a sealed off system with ge t te r - ion pumping and cryopurrcping would be the preferred type. Get ter- ion purrrping i s most e f f ec t ive above 10'' t o r r . Cryopumping i s very effect ive at l i qu id helium tenlperature; however, the permissible gas load at a specif ied pressure i s not well known. The applicable range of cryopumping w i l l be c l a r i - f ied by this adsorpt ion isotherm work.
The ent i re system i s bakeable t o 425OC and i s connected via a bakeable valve t o an ex terna l ge t te r - ion pump used only during bakeout. By degassing the srrlall get ter- ion purrrp, while the external pump maintains a low pressure, the get ter ing surfaces of the internal pump are thoroughly cleaned so t h a t t he exchange process between trapped and newly pumped molecules i s grea t ly reduced.
The desorption rate from the walls of the system i s lowered by standard bakeout techniques (425'C i s employed). Desorption i s fu r the r re- duced by cooling the entire system to l iquid nitrogen temperature. The dewar shown i n Fig. 5 serves as a l iquid ni t rogen container as well as a furnace jacket during bake-out .
The systerrt i s provided with ports for several pressure measuring de- vices. A short path ionizat ion gauge (Varian Mil l i torr gauge, usefu l from
and a f i e l d ernission microscope have been enlployed on the system sirnultan- eously.
t o 1 t o r r ) , a closed gr id ionizat ion gauge, a par t ia l p ressure ana lyzer ,
.21

... .
Fig. 5 - Extreme High Vacuum System f o r Experiments with: Liquid Helium Cryopanels, Field Emission Microscopy, Partial Pressure Analysis, and UHV Gauges. The Entire Unit i s Portable
and the Combination Furnace-Cryogenic Dewar i s Movable f o r Easy In t e rna l Access.
The par t ia l p ressure ana lyzer ( see F ig . 6), which i s an a l l metal and ceramic un i t , was b u i l t t o o r d e r by the General Electr ic Company. The unique fea ture of this tube i s the design of the ion iza t ion chamber envelope. T h i s design pernuts the analyzer t o be mounted i n l i n e between a tes t chamber and a vacuum system. For example, the analyzer was d i rec t ly a t tached between the cryopunqed system, Fig. 5, and a f ie ld endssion microscope. Further, because of the large conductances maintained throughout the manifold as a whole and pa r t i cu la r ly i n t he i on iza t ion chamber envelope, this tube may be considered t o have a nude source. T h i s tube i s operated with a standard model 514 parer supply unit and a 6.5 kilogauss electromagnet.
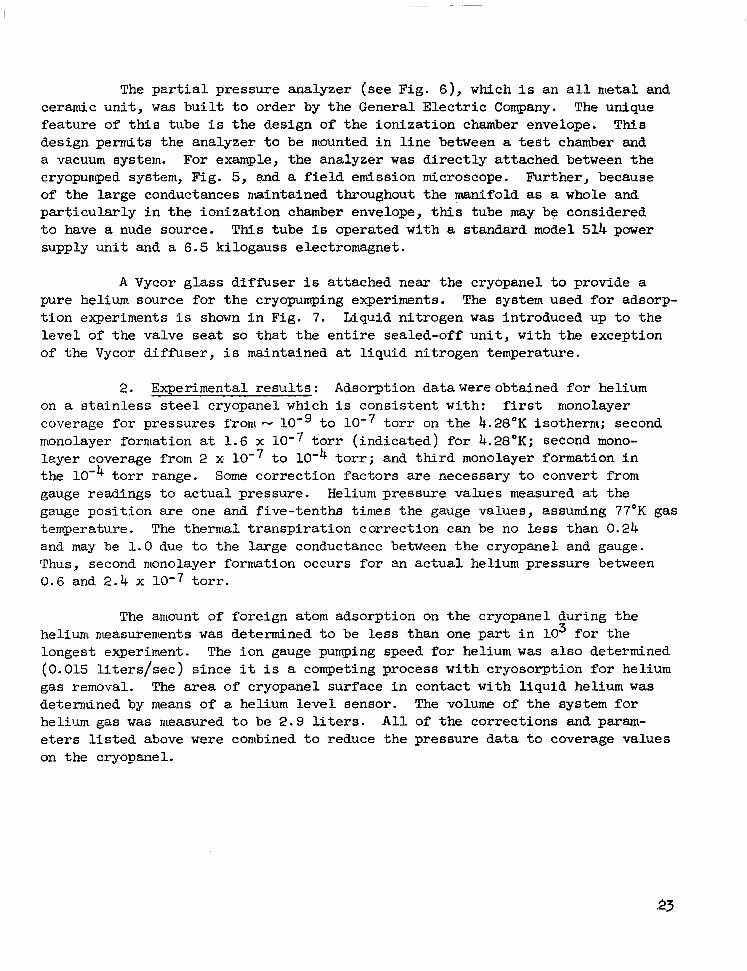
A Vycor g l a s s diffuser i s attached near the cryopanel to provide a pure helium source for the cryopurnping experiments. The system used for adsorp- tion experiments i s shown in F ig . 7. Liquid nitrogen was introduced up t o t h e level of the valve seat so that the ent i re sealed-off uni t , wi th the except ion of the Vycor diffuser, i s maintained a t liquid nitrogen temperature.
2. Experimental results: Adsorption datawereobtained for helium on a s t a in l e s s steel cryopanel which i s consistent with: f i rs t monolayer coverage for pressures front - t o t o r r on the 4.28"K isotherm; second monolayer formation at 1.6 x lom7 to r r ( i nd ica t ed ) fo r 4.28"K; second mono- layer coverage from 2 x lom7 t o t o r r ; and third monolayer formation i n the to r r range . Some cor rec t ion fac tors are necessary t o convert from gauge readings to actual pressure. Helium pressure values measured at the gauge pos i t ion are one and f ive- tenths times the gauge values, assuming 77°K gas temperature. The thernlal transpiration correction can be no k s s than 0.24 and may be 1.0 due t o t h e large conductance between the cryopanel and gauge. Thus, second ntonolayer fornmtion occurs f o r an ac tua l helium pressure between 0.6 and 2.4 x lom7 t o r r .
The amount of foreign atom adsorption on the cryopanel during the helium nteasurentents was determined t o be less than one p a r t i n lo3 f o r t h e longest experiment. The ion gauge pumping speed for helium was also determined (0.015 l i t e r s / sec ) s ince it i s a competing process with cryosorption for helium gas removal. The area of cryopanel surface in contact with l iquid helium was determined by means of a helium level sensor . The volume of the system for helium gas was nleasured t o be 2.9 liters. A l l of the corrections and param- eters l isted above were combined t o reduce the pressure data t o coverage values on the cryopanel.

Fig. 6 - Partial Pressure Analyzer with Specially Constructed Ionization Source Envelope. This Design Pernlits the Analyzer t o be Used with an In-Line NEde Ion Source Between a Test Chanlber and a Vacuum Systerrt.
.24
t
HELIUM DIFFUSER
/STAINLESS STEEL CRYOPANEL
/”- LIQUID HELIUM
P
Fig. 7 - System Used on Adsorption Isotherm Experiment. The Cryopanel (Liquid Helium Filled Finger) and Diffuser Shown i n t h e Drawing Form the Left Column
of the Vacuum System Shown i n t h e Photograph.
V. A STUDY OF THE COLD WELDING A B I L I T Y OF STRUCTURAL MATERIALS UNDER TYPICAL CONDITIONS OF USE
A guideline study of cold welding has been conducted. Three d i f - f e r en t ca ses pe r t inen t t o an ove r -a l l v i e w of t h e p o s s i b i l i t i e s f o r c o l d weld- ing were considered. The f i rs t p a r t was a review of previous' work which strongly demonstrated the phenomenon of cold welding i n an idea l case . The second par t consis ted of a set of tests which shared that l ight loads would not promote s u f f i c i e n t areas of contact between structural materials t o g i v e any nleasureable weldntent even when the samples were outgassed in UHV. The third set of tests produced welding between s t r u c t u r a l materials under vibra- t i ona l con tac t s w i th moderate loads. Some weldment occurred i n air , but was, of course, more pronounced i n vacuum.
A. Cold Welding Under Ideal Conditions
The f i rs t case (which was previously performed under another program) established the existence of the cold welding phenomenon both experimentallyd and t h e o r e t i c a l 1 y . g The study consisted of producing atomically smooth sur- faces of lamellar sol ids such as mica i n a n extreme high vacuum so tha t t hey remained clean u n t i l t h e y were allowed to r ehea l unde r t he i r own a t t r a c t i v e force. The energy required to separate the surfaces after rehea l was j u s t 13 per cent lower than the original energy expended t o produce the surfaces front the bulk material.
These idealized experiments demmstrated that the cold welding phenomenon can occur at the highest level imaginable, i . e . , t o nea r ly t he full cohesive energy of the bulk material. Two important conditions should be noted: (1) the lack of a compressive load t o r e h e a l t h e s u r f a c e s ; and (2) t he lack of added thermal energy (from frictional heating or otherwise); thus, t rue touch and contact cold welding was demonstrated. On the other hand, two other important conditions should also be noted: (1) the ex is tence of atonti- tally sntooth sur faces for the rehea l ing tests so t h a t t h e r e a l a r e a of atomic range contact was v i r t u a l l y 100 per cen t o f the p ro jec ted sur face areas t e s t ed ; and (2 ) the existence of molecularly clean surfaces for the tests. Thus, the near bulk cohesive energy established i s understandable under such ideal conditions since the surfaces could re-establish the atomic range spac- ing charac te r i s t ic o f the bu lk material.
-
26

B. Lack of Cold Welding with Touch Contact of Structural Materials
An extended series of tests were completed regarding the adhesion of three s t r u c t u r a l materials exposed t o vacuum and thermal outgassing. Pre- vious work on this subjec t was reported i n Ref. 1, pp. 61-68. The th ree materials examined were: aluminum a l l o y (x-2020-T6), t i t an ium a l loy (6A1, 4V) and s ta in less s teel (type 301-1/2 HD). Since the same materials and techniques were employed in the previous study, the following report of these extended r e s u l t s w i l l be i n t h e form of a summary.
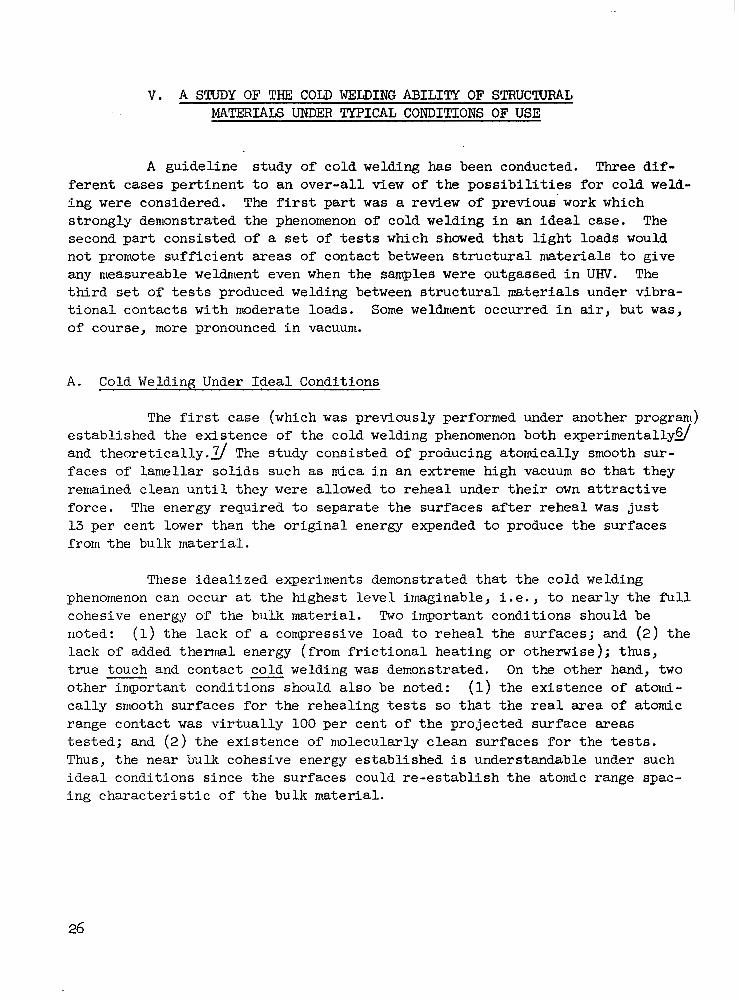
Figure 8 i l l u s t r a t e s t he t echn ique employed t o compare the adhesion by means of a measurement of t he maxim angle of repose between the samples under l ight gravitational loading. Rotation of the vacuum chamber was possible a t any time during the extended tests s ince srnall ion pumps or ge t te r - ion pumps were used. A l l o f t h e r e s u l t s f e l l w i t h i n t h e 2 1 - 28O range shown.
Table I V l i s ts some character is t ic act ivat ion temperatures for the three materials s tudied. The relevant ternperature for a thermally induced weldment i s the Tarnmann temperature, since atomic diff 'usion (sintering) may occur around this temperature level ( two-thirds of the absolute melting point value). However, i f the mel t ing point values of the bulk metals in ques t ion are compared wi th the Tanmtann temperatures of their surface oxide layers (see Table I V ) some discrepancies are noted. For example, i f two aluminum samples were in contact , their oxide layers could begin s inter ing a t 1275OC; however, the bulk aluminum melts a t j u s t 66OoC. Titanium and s t a i n l e s s s t e e l do not show a similar contradict ion; however, s in t e r ing of their oxide surfaces would requi re a temperature of 1000°C which i s above the normal useful range. Therefore, no weldment due to s inter ing should occur for the three metals l i s t e d above.
The primary condition which must be es tab l i shed for weldment i s an appreciable area of atomic range contact between the sur faces so t h a t a s ign i f - icant reduction of the net free surface energy w i l l occur. This condition was possible over the ent i re area of the a tomical ly smooth mica layers . However, f o r t h e metal samples used i n t h e second and t h i r d tes t series th i s cond i t ion i s f u l f i l l e d by only a small f r a c t i o n of the p ro jec ted sur face a rea . For touch contac t o r l igh t loading below the y i e ld s t r eng th of a material only the surface asperities, whose t i p s may be about l o m 4 cnt. i n diameter, are i n con- tact . Therefore, no significant degree of adhesion would be expected.
BAKE OUT POSITION
CONTACT IN UHV
MAX. ANGLE OF REPOSE
Fig. 8 - I l l u s t r a t i o n o f a Technique f o r Alternately Exposing the Surfaces of Two Sanples t o Vacuum Degassing
and Bringing the Same Surfaces Into Contact for an Adhesion Measurement
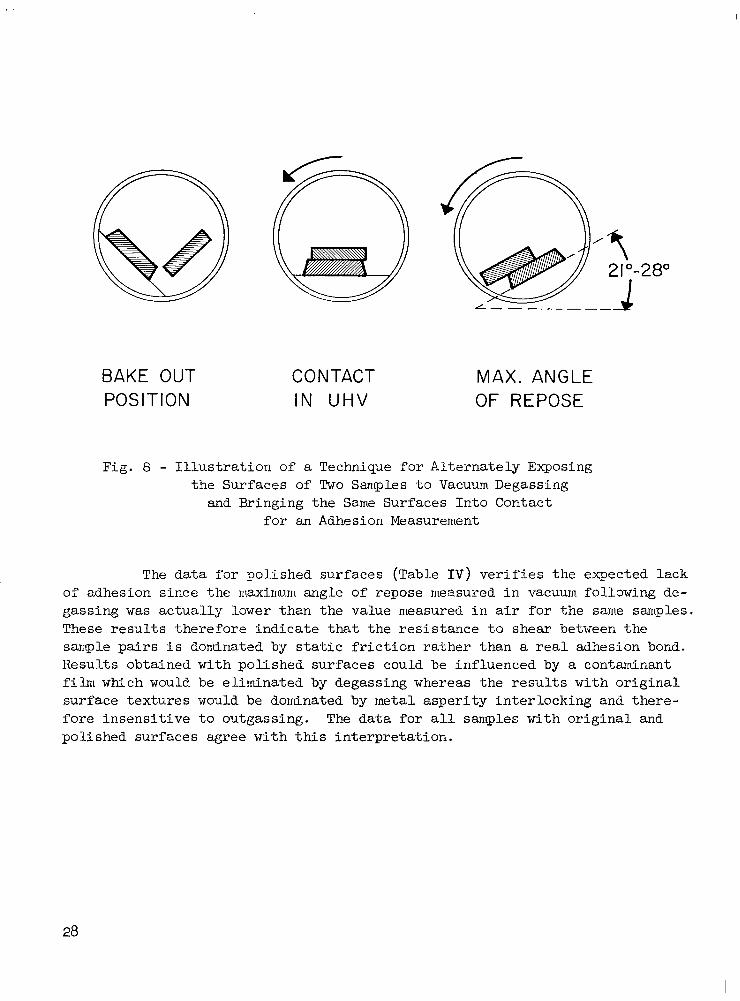
The data for polished surfaces (Table I V ) ver i f ies the expec ted l ack of adhesion since the n~axin~urn angle of repose rneasured i n vacuum following de- gassing was ac tua l ly lower than the value measured i n a i r f o r t h e same samples. These r e s u l t s t h e r e f o r e i n d i c a t e t h a t t h e r e s i s t a n c e t o s h e a r between the sarnple p a i r s i s dominated by s t a t i c f r i c t i o n r a t h e r t h a n a real adhesion bond. Results obtained with polished surfaces could be inf luenced by a contaminant f i l r r t which would be el iwinated by degassing whereas the resul ts wi th or iginal sur face t ex tures would be dominated by metal asperity interlocking and there- fore insens i t ive to ou tgass ing . The d a t a f o r a l l samples wi th o r ig ina l and pol i shed sur faces agree wi th th i s in te rpre ta t ion .
28

CHARACTERISTIC ACTIVATION TEMPERATURES 7
I
, TEST MELTING POINT TAMMANN MATERIAL TEMPERATURE TEMPERATURE
I ( O C 1 I ( "C 1 1
I ALUMINUM ,
( X - 2 0 2 0 - T 6 ) 6 6 0 , 350 """~"_"""" c
OXIDE A12 03
2050 1275
i TITANIUM I
1800 I
I100
I 6 4 0 I O 0 0
STAINLESS STEEL (TYPE 301 '12 HD) 1 - 1500 OXIDE ( Cr2 0,. Ni 0, Fez 0,) - 1000 r~ I700
TABLE I V - Thermal properties relevant to the possibil- i t y of sintering between sanple pairs of the three materials tested are tabulated above. The Tanunann temperature represents the approximate threshold for thermally activated atondc diffusion. Thus, sintering would not be expected for the three mate- rials tested since the oxide coatings would not be removed by vacuum exposure or touch contact abrasion and nornal operation would not reach 1000°C.
COLD WELDING TESTS WITH STRUCTURAL MATERIALS UNDER VARIOUS CONDITIONS
TEST
I I AI ( X-2020-T6) :
I 23 350 500 1 28 O 1 Ti ( 6 % A 1 , 4 % V ) I
S s (TYPE301&HD)
23" 23 -AIR- 1 POLISHED SURFACES
I
28" 350 165 100
1 AI ( X-2020-T6 23 350 3150 I 21"
TABLE V - The results of cold welding tests under low nondeforming loads are tabulated above. The m n a x i ~ n u m angle of repose between sample pairs (see Fig. 8) gives a measurement of the static friction for separation i n a shear mode. No ctifferences occurred for samples with orig- i na l surface texture; however, a 10 per cent decrease occurred i n vacuum for polished samples which indicates decreasedfriction be- tween clean surfaces compared t o air contand- nated surfaces.

The tabulated resul ts , Table V, confirms the expectation that cold welding w i l l not occur between lightly loaded metal samples with either the or ig ina l sur face t ex ture o f the shee t metal or with pol ished surfaces . (The polished surfaces also contact over a small area compared t o t h e p r o j e c t e d surface area.) Table V l ists r e s u l t s f o r tes t conducted i n air, after exposure t o vacuum for per iods up t o 3,150 hr, and for thermal degassing plus vacuum exposure. Thus, tes t condi t ions s imulated direct launch to the vacuum of a 350-ndle e a r t h a l t i t u d e (i .e., vacuum of 3 x t o r r a t t a ined w i thou t sample bake) and combined high temperature and UHV exposure.
C . Cold Welding Produced with . . Vibrational ~ Contacts ~~
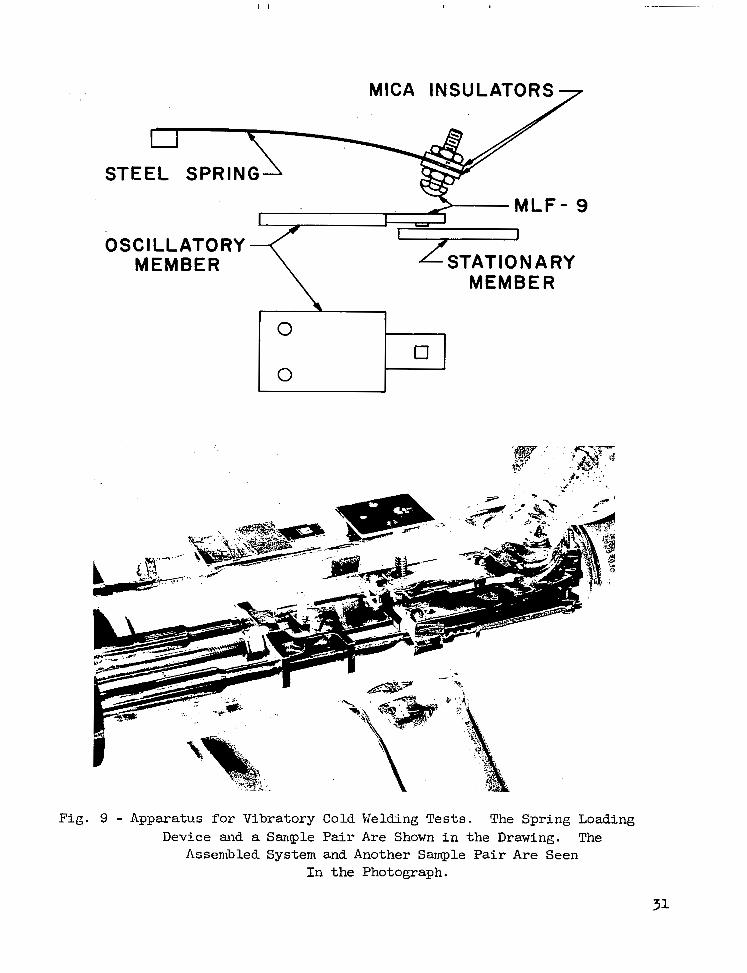
The t h i r d set of experiments within the guideline study was designed to s imula te ac tua l condi t ions for s t ruc tura l components i n con tac t w i th normal loading and under the influence of vibration (see Fig. 9). The following con- d i t i o n s were selected to s imulate possible parameters during the first few minutes of launch when vibrational loads could be s ign i f i can t : (1) a normal load of 250 ps i over the p ro jec ted in te r face area; ( 2 ) a vibratory frequency of 5 cps; (3) a vibrat ion awli tude of 0 .03 in . ; and (4 ) ambient temperatures with good thermal contact to each metal sample. ( Interfacial temperatures during vibrat ion were not recorded.) Pressures a t the start of a launch period would be fill atmospheric and would reduce rapidly with time; however, labyrinth type par ts would outgas slowly, so tha t the v ibra tory t es t s conducted i n a i r and moderate vacuum should be relevant .
Three sanrple mater ia ls were studied: aluminum (6061-T6), t i tanium (6A1, 4V) , and s t a i n l e s s s teel (301-1/2 HD). A l l three were t e s t e d i n air and t h e s t a i n l e s s samples were t e s t e d i n a moderate vacuum. A vacuum of 3 x t o r r was at ta ined without a bakeout, so that conditioning of the metal samples would be similar t o t h e a c t u a l p r o c e s s of exposure t o v a c u m a t h igh a l t i tude .
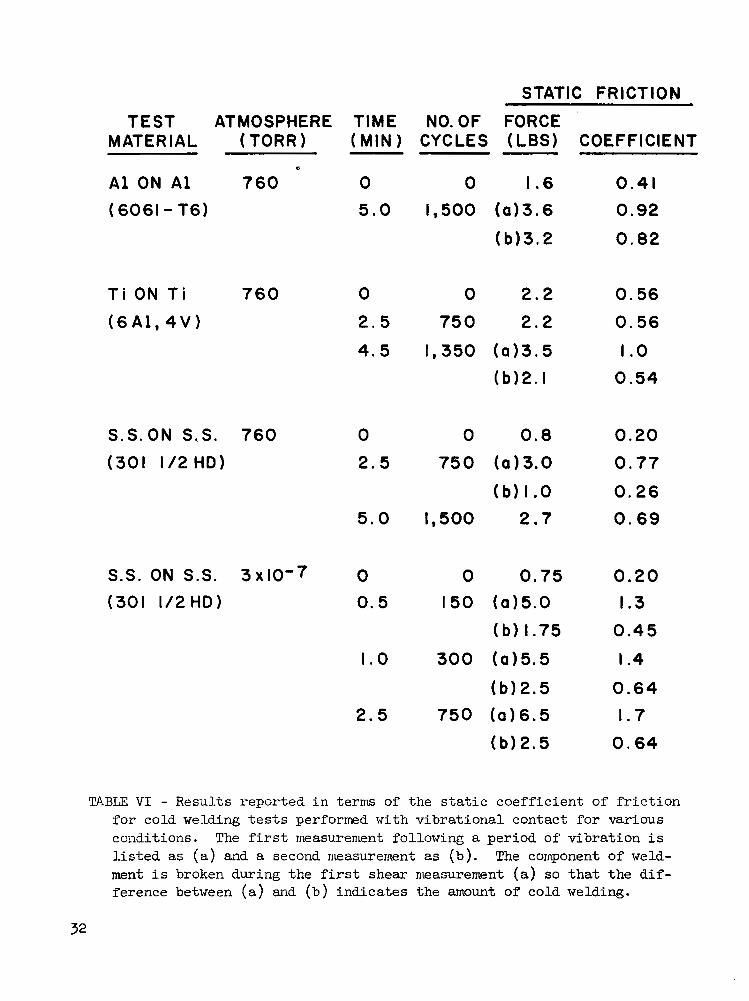
Results are l i s t e d i n Table V I as coef f ic ien t o f f r ic t ion va lues for the various samples and conditions described above. Two values are required f o r a coeff ic ient of f r ic t ion determinat ion: the normal load and t h e f r i c t i o n a l force. Normal loads were set a t 3.9 l b . , s ince the projected area of contact was 1/8 i n . x 1/8 i n . and a 250 psi value was desired. Both normal loads and f r i c t iona l fo rces were measured with a spring balance. A s e t of data was de- termined before vibration and a t the per iodic in te rva ls l isted i n Table VI. The f irst measurement following a period of vibration i s labeled (a), a second measurement i s labeled ( b ) . For each case i n which the ( b ) value was lower than the (a) value, w e may conclude that a vibrationally induced weld was broken by the f i rs t a c t of measurement (a) . A second measurement then requires a lower " f r i c t i o n a l f o r c e " t o i n i t i a t e a shearing motion between the sample faces.
MICA INSULATOR
STEEL SPRING
OSCILLATORY
Fig. 9 - Apparatus for Vibratory Cold Welding Tests. The Spring Loading Device and a Sancple P a i r Are Shown i n t h e Drawing. The
Assembled System and Another Sample P a i r A r e Seen I n t h e Photograph.
STATIC FRICTION
TEST ATMOSPHERE TIME NO.OF FORCE MATERIAL ( TORR (MIN ) CYCLES (LBS) COEFFICIENT
I
A 1 ON A 1 760 0 0 I .6 0.41
(6061 - T6) 5.0 1,500 (013.6 0.92
(b13.2 0.82
T i ON T i 760 0 0 2.2 0.56
(6A l ,4V) 2 .5 750 2 .2 0 .56
4.5 1,350 (a)3.5 I .o (b)2. I 0.54
S.S.ON S.S. 760
(301 1/2 HD)
0 0 0.8 0.20
2.5 750 (013.0 0.77
( b ) I .O 0.26 5.0 1,500 2.7 0 .69
S.S. ON S.S. 3x10'7 0 0 0.75 0.20 (301 1/2 HD) 0.5 150 (015.0 I .3
( b ) I .75 0.45
1.0 300 (a15.5 I .4
(b12.5 0.64
2.5 750 (016.5 1.7
(b12.5 0 .64
TABLE V I - Results reported i n terms of the s t a t i c c o e f f i c i e n t o f f r i c t i o n for cold welding tests performed with vibrational contact f o r various conditions. The f irst measurement following a per iod of' v ibra t ion i s l i s t e d as (a ) and a second measurement as (b ) . The component of weld- ment i s broken during the f irst shear measurement (a) so t h a t t h e d i f - ference between (a ) and (b ) i nd ica t e s the amount of cold welding.

Another interesting change of f r ic t iona l va lues may be noted between the zero reading taken before vibration tests and the (b) values . After t h e component of weldment i s broken, the coeff ic ient of f r ic t ion would be expected t o r e t u r n t o t h e i n i t i a l v a l u e . However, the plowing component of f r i c t i o n i s different after the surfaces have been deformed by a testing cycle. Consider- able plowing and metal transfer has occurred so tha t t he coe f f i c i en t of f r i c - t i o n is higher by as much as t w c times for aluminum i n air and three times f o r s t a i n l e s s s t e e l i n vacuum. However, even l a rge r i nc reases i n t o t a l shea r strength, as measured following a v ib ra t iona l test , are.recorded: e.g. , by a f ac to r of 2 f o r t i t a n i u m i n air, by 3.5 f o r s t a i n l e s s steel i n air, and by 7.5 f o r s t a i n l e s s s teel i n vacuum. The increment of shear strength above the f r i c t iona l va lue i s in t e rp re t ed as a component of weldment. Thus, v ibra t iona l motions under moderate loading cause a breakdown of the oxide layers and de- formation of the interface surfaces , so t h a t a la rger area of r e a l c o n t a c t ex i s t s . -
The amount of weldntent observed i n t h e s e s h o r t term tests i n a i r and moderate vacuum environments i s suf f ic ien t to demonst ra te the s ign i f icance o f the cold welding problem for moving or vibrat ing contacts .
V I . A PRESSURE CALIBRATION STUDY FOR THE ULTRA-HIGH VACUUM RANGE INCLUDING THE USE OF A FIELD EMISSION MICROSCOPE
A series of tests was conducted with cold cathode magnetron gauges i n their or iginal condi t ion. Another ser ies of experiments was car r ied ou t with t h e gauges following cesiation treatments. A fundamental study of gas dynamics by means of an electron f ield emission microscope in conjunction wi th a sens i t ive par t ia l p ressure ana lyzer i s also reported. A large quantity of data has been recorded and several new cha rac t e r i s t i c s have been deterndned. The response of Redhead and Kreisman gauges over their entlre range of opera- t i o n i s p lo t ted . The d e s i g n a n d i n i t i a l r e s u l t s of a f ield emission microscope operated on an ultra-high vacuum system are also described.
A. Techniques Employed
Comparative pressure measurenlents with hot filament ionization gauges and cold cathode magnetron gauges were made by a conductance regulated flow
33
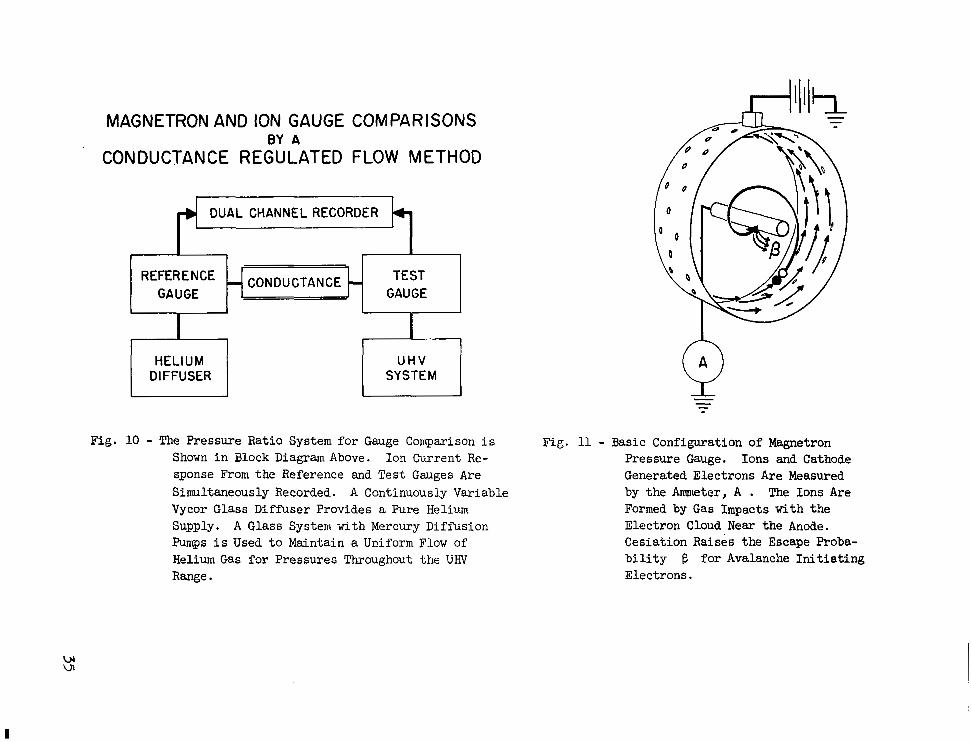
method using helium gas and a continuously pumped open type UHV system (see Fig. 10). The flow of helium was accurately regulated s ince there was essen- t i a l l y o n l y one source and one s ink for hel ium in the system. The source was a Vycor helium diffuser which p u r i f i e s t h e g a s a s well a s r egu la t ing t he f l ow r a t e . The p u r i t y l e v e l i s very high which assures the bu lk of gas with the des i red fea tures : low boiling point and chemically inert . Therefore, the f low ra te w i l l not be appreciably a l tered by physical or chemical adsorption within the system, i .e. , by cryopumping in t he l i qu id n i t rogen co ld t r aps or by get ter ing on g lass wal l s o r meta l par t s of t h e system. Thus, the pressure r a t i o remains constant for values within the molecular flow range, which a r e of i n t e r e s t i n t h i s s t u d y of gauges.
Ionization gauges were used t o e s t a b l i s h t h e v a l u e of conductance between the reference and t e s t gauge posi t ions. A magnetron gauge was then placed i n t h e t e s t p o s i t i o n and a range of pressure values was covered by varying the f low rate of helium gas. In summary, the system used was eare- f u l l y planned for control led gas f low tes ts by providing a constant evacuation speed through a s e r i e s of mercury d i f fus ion pumps and a regulated source of pure helium gas through a g l a s s d i f f u s e r .
The c h a r a c t e r i s t i c s of both Redhead and Kreisman type magnetron gauges were determined over t he i r en t i r e ope ra t ing r anges . The pressure r a t i o method described above was used fo r t he s tudy of both magnetron gauge types. In addi t ion, the Kreisman gauges were s tudied by direct comparison t o ionization gauges, since the commercial ion gauge employed (Varian type UIIV-12) covers the fu l l opera t ing range of t he commercial Kreisman gauge. A cesiation treatment was developed and employed t o g a i n a better understanding of the operat ion of magnetron gauges (see Fig. 11).
Pressure values were determined by both the pressure ratio and direct reading methods described above, using ionization gauges with constant, monitored, emission current. The ion current values , p lot ted as pressure, were cor rec ted by subt rac t ing the to ta l res idua l cur ren ts ( inc luding x- ray generated photo current and surface-generated ion current) . Ion current values were measured with a Cary model 35 vibrating reed electrometer. High voltage s e t t i n g s were r egu la r ly monitored with a sens i t ive E lec t ros ta t ic Vol tmeter .
B. Cold Cathode Magnetron Gauge Charac te r i s t ics
Resul ts from a la rge number of t e s t s With commercially available cold cathsde msgnetron gauges of two types: N3C-Redhead gauges, and GCA- Kreisman gauges are reported in subsect ions (1) and ( 2 ) below.
34
MAGNETRON AND ION GAUGE
CONDUCTANCE REGULATED BY 4
COMPARISONS
FLOW METHOD
DUAL CHANNELRECORDER
r I r I
I SYSTEM U H V I Fig. 10 - The Pressure Ratio System for Gauge Comparison i s
Shown i n Block Diagram Above. Ion Current Re- sponse From the Reference and Test Gauges Are Simultaneously Recorded. A Continuously Variable Vycor Glass Diffuser Provides a Pure Helium Supply. A Glass System with Mercury Diffusion F'umps i s Used t o Maintain a Uniform Flow of Helium Gas for Pressures Throughout the UHV Range.
Fig. 11 -
8 - -
Basic Configuration of Magnetron Pressure Gauge. Ions and Cathode Generated Electrons Are Measured by the Amncter, A . The Ions Are Formed by Gas Impacts with the Electron Cloud Near the Anode. Cesiation Raises the Escape Proba- b i l i t y E fo r Avalanche I n i t i a t i n g Electrons.
I
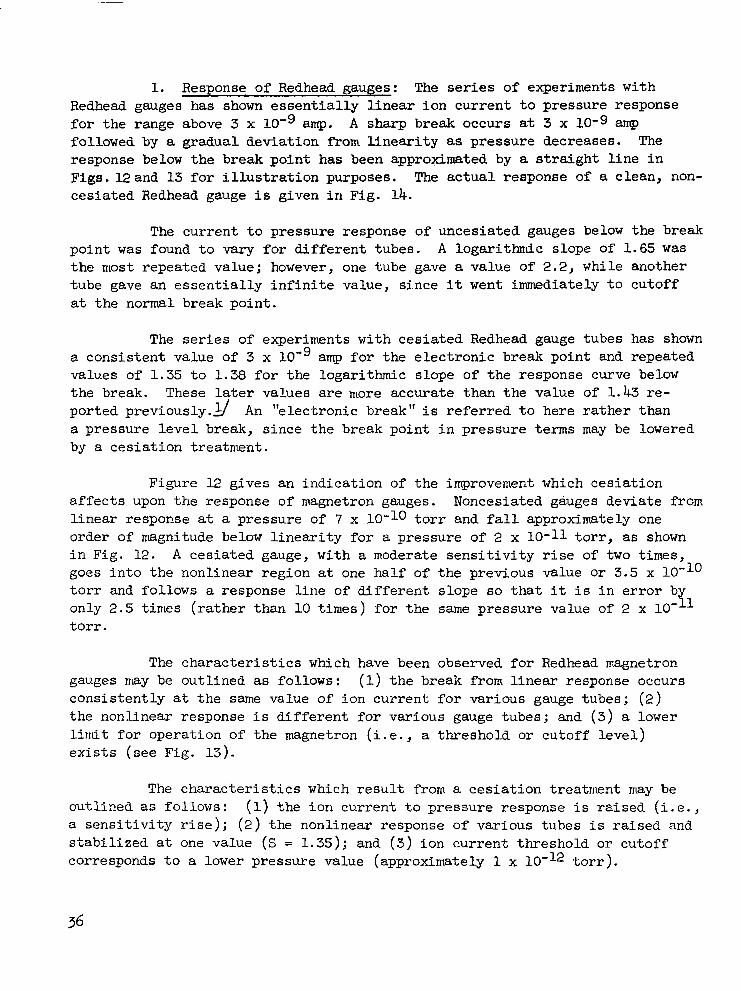
1. Response of Redhead gauges: The series of experiments with Redhead gauges has shown e s s e n t i a l l y l i n e a r i o n c u r r e n t t o pressure response for the range above 3 x amp. A sharp break occurs at 3 x 10⁻⁹ amp followed by a gradual deviat ion from l i n e a r i t y as pressure decreases. The response below the break point has been approximated by a s t r a i g h t l i n e i n Figa.12and 13 for i l lus t ra t ion purposes . The actual response of a clean, non- ces ia ted Redhead gauge i s given i n F i g . 14.
The current to pressure response of uncesiated gauges below the break poin t was found t o vary for different tubes. A logarithmic slope of 1.65 was t h e most repeated value; however, one tube gave a value of 2.2, while another tube gave an e s sen t i a l ly i n f in i t e va lue , s ince it went immediately to cu to f f a t the normal break point.
The series of experiments with cesiated Redhead gauge tubes has shown a consistent value of 3 x 10'' amp for the e lec t ronic b reak po in t and repeated values of 1.35 t o 1.38 for the logarithmic slope of the response curve below the break. These later values are more accurate than the value of 1.43 re- ported previous1y.g An "electronic break" i s r e fe r r ed t o he re r a the r t han a pressure level break, s ince the break point in pressure terms may be lowered by a cesiat ion t reatment .
Figure 12 gives an indicat ion of the improvement which ces ia t ion a f f e c t s upon the response of magnetron gauges. Noncesiated gauges deviate from linear response a t a pressure of 7 x t o r r and f a l l approximately one order of magnitude below l i n e a r i t y f o r a pressure of 2 x 10-11 t o r r , as shown in F ig . 12 . A ces ia ted gauge, with a moderate s e n s i t i v i t y rise of two times, goes into the nonl inear region a t one half of the previous value or 3.5 x 10-l' t o r r and follows a response l ine of dif ferent s lope so t h a t it i s i n e r r o r by only 2.5 t imes (rather than 10 times) f o r t h e same pressure value of 2 x 10-l' t o r r .
The c h a r a c t e r i s t i c s which have been observed fo r Redhead magnetron gauges ntay be out l ined as follows: (1) the break from linear response occurs cons is ten t ly a t t h e same value of ion current for var ious gauge tubes; (2) the nonlinear response i s d i f f e ren t fo r va r ious gauge tubes; and (3) a lower l i r rut for operat ion of the magnetron (i. e. , a threshold or cutof f l eve l ) e x i s t s (see Fig. 13).
The cha rac t e r i s t i c s which r e s u l t from a cesiat ion t reatment may be out l ined as follows: (1) the i on cu r ren t t o pressure response i s r a i s e d ( i . e . , a sens i t i v i ty r i s e ) ; (2 ) t he non l inea r r e sponse of various tubes i s ra i sed and stabil ized a t one value (S = 1.35); and (3) ion current threshold or cutoff corresponds t o a lower pressure value (approximately 1 x t o r r ) .

RESPONSE OF MAGNETRON GAUGES
10-11 1o"O IO-^ PRESSURE ( torr)
Fig. 12 - The Response of Redhead Magnetron Gauges May be Increased by a Cesium Treatment. The S e n s i t i v i t y Rise in the Linear Por- t i o n of the Character is t ic Curve i s by a Factor of TWO. A Larger var ia t ion in Nonlinear Behavior i s Indicated. For a True Pressure of 2.2 x Torr, the Average Ncncesiated Gauge Reads 2.2 x 10-l2 Torr While a Cesiated Gauge Reads 1 . 0 x Torr. Thus, an Error of 10 Times i s Reduced t o 2 . 2 Tines.
1 0 - l ~ IO"* io-" 10"O (PI PRESSURE (torr)
Fig. 13 - Nonlinear Response Occurs Below 3 x lo-' Amps and Varies for Individual Redhead Gauges. The Slope of t h e Response Curve i s 1.65 For a Representative Gauge (Best Response i s Shown i n Fig. 14). The Slope f o r a Cesiated Gauge i s 1.35 Giving the P o s s i b i l i t y of a Lower True Pressure Cor- responding t o t h e Cutoff Current of 9 x 10-13 Amp. Note That the Response Curves Are Approximated by S t r a igh t L ines i n T h i s Figure, Whereas the Actual Response of a Redhead Gauge (Fig. 14) Shows an Ever Changing Slope in the Nonlinear Begion.

10-4 I 1 1 1 1 1 1 1 1 I I 1 1 1 1 1 1 1 I I 1 1 1 1 1 1 1 I I l l l l i l l I l l t l l l l I I 1 1 1 1 1 1 1 I 1 1 1 1 1 1 1
LINEAR RESPONSE
I = CPS
s = 2 . 2 4
REDHEAD GAUGE PARAMETERS E = 4800 VOLTS H 1050 GAUSS
/ VARIAN ION GAUGE PARAMETERS GRID VOLTAGE 130 VOLTS
LINEAR EMISSION CURRENT 4 MA. RESPONSE SENSITIVITY 25 / TORR
I 0 -13 11 Fie;. 14 - Indicated Pressure from a Redhead. Gauge Versus True Pressure
(as Determined by the Pressure Ratio Method) i s Plot ted Above. The Approximate Nonlinear Response of 1.43
Represents the Best Gauge Whereas an Average Gauge Response Approximates a 1.65 Slope.
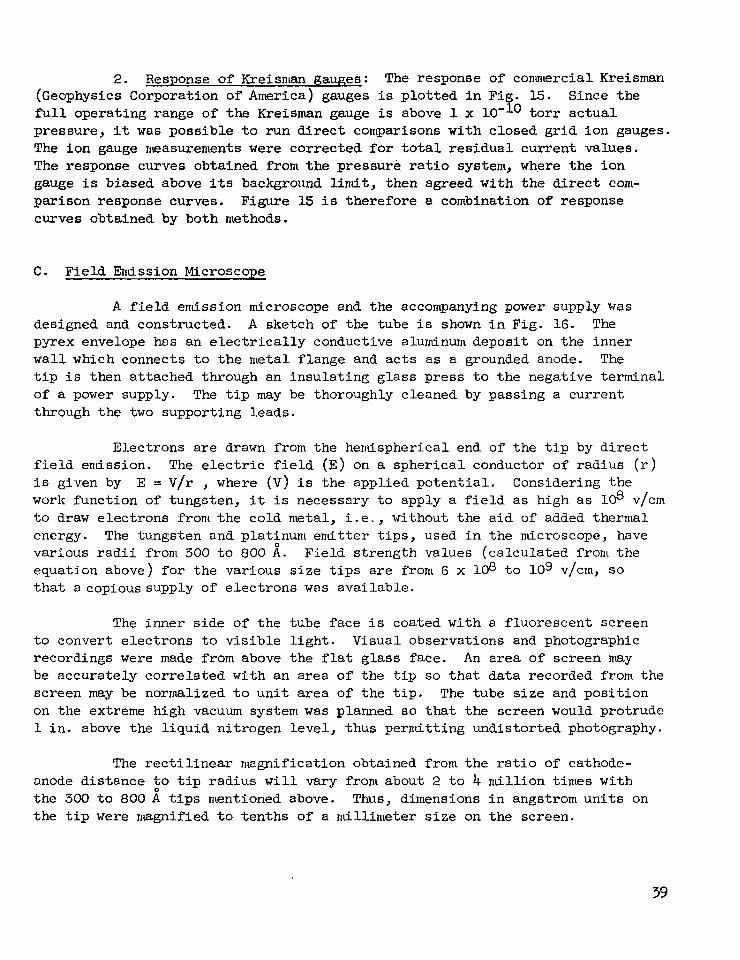
2. Response of Kreisnlan gauges: The response of conmtercial Kreisman (Geophysics Corporation of Anterica) gauges i s p l o t t e d i n F i g . 15. Since the full operat ing range of the Kreisman gauge is above 1 x 10-l-O t o r r a c t u a l pressure, it was p o s s i b l e t o r u n d i r e c t comparisons with closed grid ion gauges. The ion gauge nteasurentents were corrected f o r total res idua l cur ren t va lues . The response curves obtained from the pressure ra t io system, where the ion gauge i s biased above i t s background lindt, then agreed with the direct cont- pazison response curves. Figure 15 i s therefore a combination of response curves obtained by both methods.
C . F i e ld Emission Microscope
A field enussion microscope and the accontpnying power supply was designed and constructed. A sketch of the tube i s shown i n F i g . 16. The pyrex envelope has an electrically conductive aluminum deposi t on the inner wall which connects t o t h e metal f lange and ac t s as a grounded anode. The t i p i s then attached through an insu la t ing g lass p ress to the nega t ive t e rmina l of a power supply. The t i p may be thoroughly cleaned by passing a current through the two supporting leads.
Electrons are drawn from the hemispherical end of the t ip by d i r e c t f ie ld enussion. The e l e c t r i c f i e l d ( E ) on a spherical conductor of radius ( r ) i s given by E = V / r , where ( V ) i s the applied potential . Considering the work funct ion of tungsten, it i s necessary to apply a f i e l d a s h i g h a s lo8 v/cm t o draw e lec t rons front the cold metal , i .e . , without the aid of added thermal energy. The tungsten and platinum enli t ter t ips, used in the microscope, have var ious rad i i front 300 t o 800 i. Field s t rength values (calculated front the equat ion above) for the var ious s ize t ips are from G x 108 t o lo9 v/cm, so that acopious supply of e lectrons was avai lable .
The inner s ide of the tube face i s coated with a f luorescent screen t o conver t e lec t rons to v i s ib le l igh t . Visua l observa t ions and photographic recordings were made from above the f l a t glass face. An a rea of screen may be accura te ly cor re la ted wi th an a rea of t h e t i p so t h a t data recorded from the screen may be normalized t o u n i t a r e a o f t h e t i p . The tube s ize and pos i t i on on the extreme high vacuum system was planned so tha t the sc reen would protrude 1 i n . above the l iquid ni t rogen level , thus pernut t ing undis tor ted photography.
The recti l inear ntagnification obtained from the ratio of cathode- anode d is tance $0 t i p radius w i l l vary from about 2 t o 4 nu l l ion times with the 300 t o 800 A t ips nlentioned above. Thus, dimensions i n angstrom units on t h e t i p were nlagnified t o t e n t h s of a ndllinteter s i z e on the screen.
39
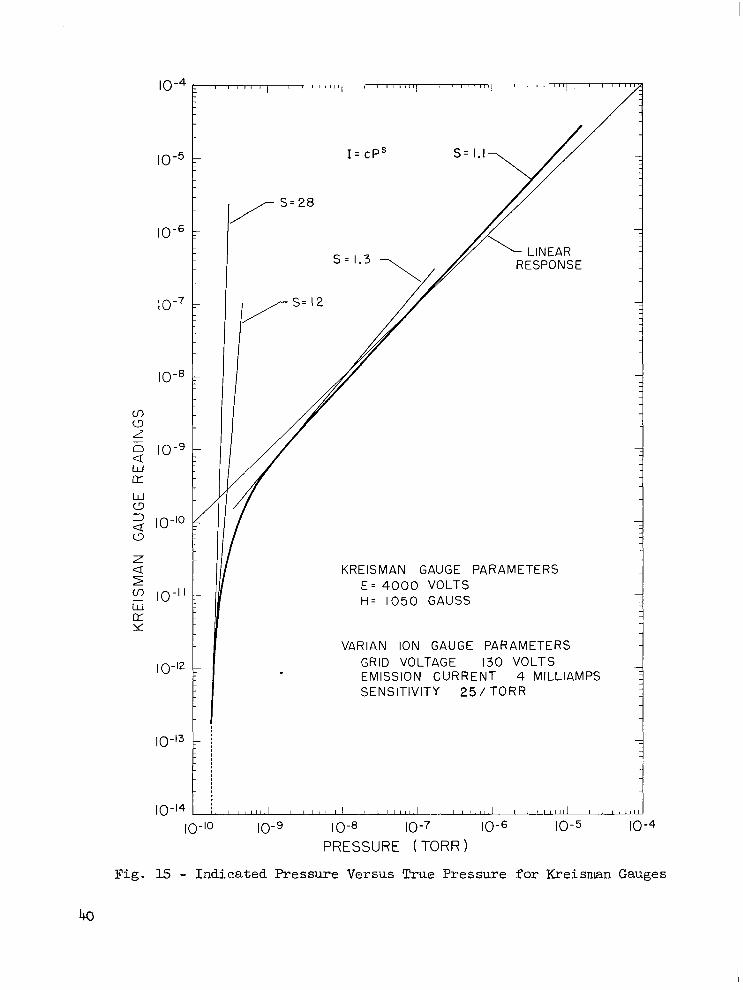
KREISMAN GAUGE PARAMETERS E = 4000 VOLTS H = 1050 GAUSS
VARIAN ION GAUGE PARAMETERS GRID VOLTAGE 130 VOLTS EMISSION CURRENT 4 MlLLlAMPS SENSITIVITY 25 / TORR
1O"O 10-9 10-8 10-7 10-6 10-5 IO -4
PRESSURE (TORR)
Fig. 15 - Indicated Pressure Versus T m e Pressure for Kreisntan Gauges

/TIP ( W , Pt)
\ 4 NICKEL
SLEEVES
I I
Fig. 1 7 - Field Endssion Microscope Tube (Not Mounted) and Parer Supply Which Can Heat the Tip While an Ehussion.Pattern i s Being Viewed
Fig. 16 - Field Enussion Microscope Tube Details. Tip
$= Assembly and Support Rods Are Eas i ly P Removed from Press Fit Mountings.
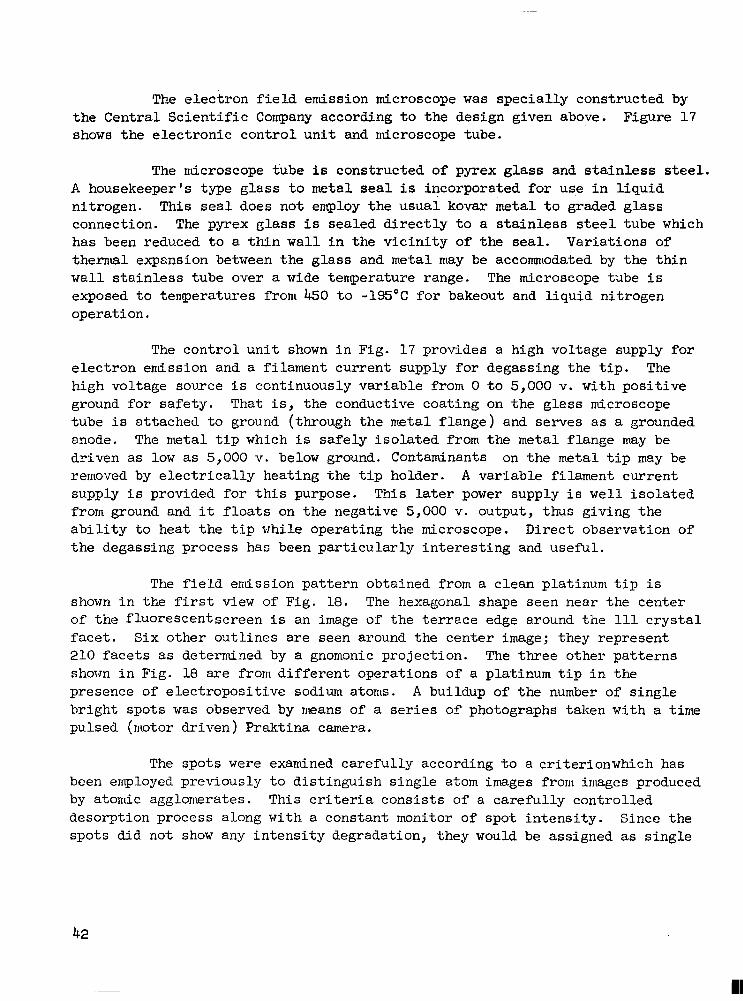
The e lec t ron f ie ld emission microscope was special ly constructed by the Cen t ra l Sc i en t i f i c Company according to t he des ign g iven above. Figure 1 7 shows the electronic control unit and ndcroscope tube.
The nucroscope tube is constructed of pyrex glass and s t a i n l e s s s t e e l . A housekeeper's type g la s s t o me ta l seal i s incorporated for u s e i n l i q u i d nitrogen. T h i s seal does not employ the usual kovar metal t o graded glass connection. The pyrex glass i s sealed d i r e c t l y t o a s t a i n l e s s steel tube which has been reduced t o a t h i n wall i n t h e v i c i n i t y of the seal. Variations of thermal expansion between the glass and metal may be accomtodated by t h e t h i n w a l l s ta inless tube over a wide temperature range. The microscope tube i s exposed t o temperatures from 450 t o -195°C f o r bakeout and l iquid ni t rogen operation.
The c o n t r o l u n i t shown i n F i g . 1 7 provides a high voltage supply for electron emission and a f i lament current supply for degassing the t ip . The high voltage source i s continuously variable from 0 t o 5,000 v. wi th posi t ive ground for safety. That i s , the conductive coating on the glass microscope tube is a t t ached t o ground (through the metal f lange) and serves as a grounded anode. The metal t i p which i s s a f e l y i s o l a t e d from the metal flange may be dr iven as low as 5,000 v. below ground. Contaminants on the metal t i p may be rerrtoved by e l ec t r i ca l ly hea t ing t he t i p ho lde r . A variable f i lament current supply i s provided for this purpose. T h i s l a t e r power supply i s we l l i so l a t ed from ground and it f l o a t s on the negative 5,000 v. output , thus giving the ab i l i ty to hea t the t ip whi le opera t ing the microscope . Di rec t observa t ion of the degassing process has been par t icular ly interest ing and u s e f i l .
The f i e l d errdssion pattern obtained from a c lean p la t inum t ip i s shown i n t h e f irst view of Fig. 18. The hexagonal shape seen near t h e center of the f luorescentscreen is an image of the terrace edge around the 111 c r y s t a l facet. Six other outl ines are seen around the center image; they represent 210 f a c e t s as determined by a gnomonic project ion. The three o ther pa t te rns shown i n F i g . 18 a re front different operat ions of a platinum t i p i n t h e presence of electroposit ive sodium a t o m . A buildup of the number of single br ight spots was observed by means of a series of photographs taken with a time pulsed (nlotor e i v e n ) P r a k t i n a camera.
The spots were examined carefully according t o a cri terionwhich has been employed p rev ious ly t o d i s t i ngu i sh s ing le atom images front images produced by atorrlic agglomerates . This cr i ter ia consis ts of a careful ly control led desorption process along with a constant monitor of spot intensity. Since the spots did not show any intensi ty degradat ion, they would be assigned as s ingle
42
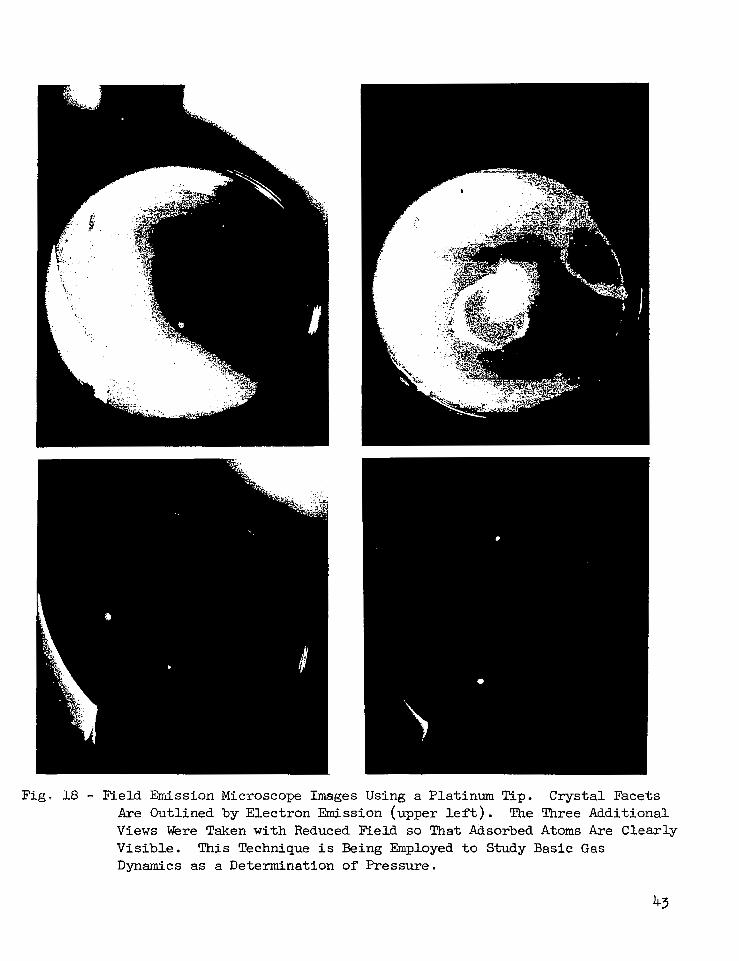
Fig. 18 - Field Emission Microscope Images Using a Platinum Tip. Crystal Facets Are Outlined by Electron Emission (upper l e f t ) . The Three Additional Views Were Taken with Reduced Field so That Adsorbed Atoms Are Clearly Visible . This Technique i s Being Employed t o Study Basic Gas Dynamics as a Determination of Pressure.
43
atom intages by t h i s c r i t e r i o n . That is , uni t desorp t ion of the spots occurred which ind ica tes a unit source for t h e inlage ra ther than an agglomerate. The observation and measurement of s ing le atom gas dynamics, as ind ica ted above, can be used for a pressure cal ibrat ion s tudy.
44

REFERENCES
1. Bryant, P. J., C. M. Gosselin, and L. H. Taylor, NASA CR-84 (1964).
2. Florescu, N. A . , Austral ian J. Appl. Sci . , - 8 , 305 (1957).
3. Florescu, N. A., Vacuum, - 10, 250 (1960).
4. Alexander, P., J. Sc i . I n s t r . , - 23, 11 (1946).
5. Kennedy, P. B., 1 9 6 1 . .Trans. of the Eighth Vacuum Symposium and Second International Congress, .320, Pergarnon Press (1962).
6. Bryant, P. J., 'kohesion of Clean Surfaces and the Effect of Adsorbed Gases,"1962 Trans. of the Ninth Vacuum Symposium,, Macmillian Press (1962).
7 . Bryent, P. J . , L. H. Taylor, and P. L. Gutshall , "Cleavage Studies of Lamellar Solids i n Various Gas Environments," 1963 Trans. of the Tenth Vacuum Synposium, McGregor Werner Press (1963).
NASA-Langley, 1965 CR-324 45