
EXTREME GROWTH BEHAVIOUR OF CORROSION PIT IN 914.4MM...
21
Transcript of EXTREME GROWTH BEHAVIOUR OF CORROSION PIT IN 914.4MM...


EXTREME GROWTH BEHAVIOUR OF CORROSION PIT IN
HYDROCARBON PIPELINE (CASE STUDY OF 914.4MM PIPELINE)
CHUAH CHONG KEAT
A thesis submitted in fulfilment of the
requirements for the award of the degree of
Master of Engineering (Civil - Structure)
Faculty of Civil Engineering
Universiti Teknologi Malaysia
JUNE 2008


iii
To my beloved family

iv
ACKNOWLEDGEMENT
First of all, I would like to thank my supervisors, Dr. Norhazilan Md Noor for
the advices, guidance, supports and times in this study.
I would also like to acknowledge my coursemates who are kind and always
willing to share their knowledge with me.
Lastly, thank to my family for supporting me throughout my study.
v
ABSTRACT
The prediction of pipeline integrity in the early stage is important in order to
provide assessment for future inspection, repair and replacement activities since the
failure of hydrocarbon pipelines contributes to economic implications and cause serious
hazards to the environment. The main objective of this research is to study the effects of
extreme growth behaviour of corrosion pit in hydrocarbon pipeline using statistical and
probability methods. The linear model is deployed due to its simplicity and flexibility to
project the corrosion dimension in the future. The research methodology consists of
three main stages, which are statistical analysis, probabilistic analysis and reliability
analysis using Monte Carlo simulation. The information of pipeline internal condition
provided by the in-line inspection tools called pig has numerous uncertainties. It is more
realistic to concern a group of data that has already exceeded a certain level of corrosion
severity rather than considering the large volume of detected data provided by the
intelligent pig inspections. Instead, the peak depth of corrosion defects is most likely to
cause the failure of hydrocarbon pipeline. Thus, peaks-over-threshold method and
extreme value statistics have been adopted. Based on the result, higher threshold value
will lead to earlier time to failure. Both peaks-over-threshold method and extreme value
statistics can be combined to produce a reliable prediction. With the results from both
methods, we can compare and make a reliable prediction. The results are important for
pipeline operators to assist their planning program of inspection, repairing and
replacement activities in the future.

vi
ABSTRAK
Ramalan keupayaan semasa pada peringkat awalan struktur talian paip minyak
adalah penting untuk menyediakan penilaian awal bagi tujuan pemeriksaan,
penyelenggaraan dan penggantian pada masa hadapan kerana kegagalan struktur talian
paip minyak akan menyebabkan implikasi kepada ekonomi dan mendatangkan bahaya
kepada alam sekitar. Objektif utama bagi penyelidikan ini adalah untuk mengkaji kesan-
kesan daripada sifat pertumbuhan pengaratan dalaman yang ekstrem dalam paip minyak
menggunakan pendekatan statistik dan kebarangkalian. Model linear digunakan kerana
sifatnya yang ringkas dan fleksibel untuk meramal dimensi karat pada masa hadapan.
Metodologi penyelidikan mengandungi tiga bahagian utama iaitu analisis statistik,
analisis kebarangkalian dan simulasi keboleharapan struktur dengan menggunakan
prosedur Monte Carlo. Maklumat keadaan dalaman paip diperolehi melalui peralatan
pemeriksaan yang dikenali sebagai pig mengandungi banyak ketaktentuan. Adalah lebih
realistik untuk mempertimbangkan sekumpulan data yang telah melebihi sesuatu tahap
pengaratan daripada mempertimbangkan data yang banyak yang diperolehi daripada
pemeriksaan Ipig. Biasanya, pengaratan yang dalam sekali akan menyebabkan
kegagalan paip minyak. Oleh itu, metode nilai atas batasan dan statistic nilai ekstrem
telah digunakan. Keputusan menunjukkan semakin tinggi nilai batasan, semakin cepat
paip minyak akan gagal. Kedua-dua metode nilai atas batasan dan statistic nilai ekstrem
boleh digabungkan untuk menghasilkan ramalan yang dapat dipercayai. Dengan adanya
keputusan daripada kedua-dua metode, kita boleh berbanding sesama metode lalu
membuat ramalan yang dapat dipercayai. Keputusan kajian sangat penting bagi
pengendali paip minyak untuk merancang aktiviti pemeriksaan, penyelenggaraan dan
penggantian pada masa hadapan.

vii
TABLE OF CONTENTS
CHAPTER SUBJECT PAGE
DECLARATION ii
DEDICATION iii
ACKNOWLEDGEMENT iv
ABSTRACT v
ABSTRACK vi
TABLE OF CONTENTS vii
LIST OF TABLES xi
LIST OF FIGURES xii
LIST OF SYMBOLS xiii
LIST OF APPENDICES xv
CHAPTER 1 INTRODUCTION 1
1.1 Introduction 1
1.2 Problem Statement 2
1.3 Objectives of Study 2
1.4 Scope of Study 3
1.5 Importance of Study 4
CHAPTER 2 LITERATURE REVIEW 5
2.1 Corrosion 5
2.1.1 Corrosion Mechanisms in Oil and Gas Industry
6
2.1.1.1 Electrochemical Corrosion 6

viii
2.1.1.2 Chemical Corrosion 7
2.1.1.3 Mechanical and Mechanical/Corrosive Effect
8
2.2 In-line Inspection Activities 9
2.2.1 Metal Loss Detection Tools 10
2.2.1.1 Magnetic Flux Leakage Tools 10
2.2.1.2 Ultrasonic Tools 10
2.3 Peaks-Over-Threshold Method 11
2.4 Extreme Value Statistics 11
CHAPTER 3 METHODOLOGY 13
3.1 Overview 13
3.2 Histogram 13
3.3 Continuous Probability Distribution 14
3.3.1 Normal Distribution 14
3.3.2 Lognormal Distribution 15
3.3.3 Exponential Distribution 16
3.3.4 Weibull Distribution 17
3.4 Parameter Estimation Using Probability Plotting 18
3.5 Goodness-Of-Fit Test 19
3.5.1 Chi-Square Test 19
3.5.2 Graphical Test 20
3.6 Peaks-Over-Threshold Method 21
3.7 Extreme Value Statistic 21
3.7.1 Extreme Value Distribution 22
3.8 Monte Carlo Simulation 22
3.8.1 Monte Carlo Simulation Procedure 23
CHAPTER 4 DATA ANALYSIS 27
4.1 Overview 27
4.2 Pipeline Corrosion Data (Pigging Data) 27
4.3 Corrosion Dimension Analysis 28

ix
4.4 Corrosion Growth Analysis 29
4.5 Probability Analysis 31
4.5.1 Construction of Histogram 31
4.5.2 Parameter Estimation 33
4.5.3 Parameter Verification 36
4.6 Correction of Verified Corrosion Rate 37
4.6.1 Z-score Correction Method 37
4.7 Corrosion Growth Model 38
4.7.1 Random Consistent Model 39
4.7.2 Random Inconsistent Model 39
CHAPTER 5 RESULTS 41
5.1 Overview 41
5.2 Simple Simulation 41
5.3 Results of Simple Simulation 42
5.4 Monte Carlo Simulation 42
5.4.1 Statistical Parameters 43
5.4.1.1 Peaks-Over-Threshold Method 44
5.4.1.2 Extreme Value Theory 45
5.4.2 Failure Model 45
5.4.3 Limit State Function 46
5.4.4 Target Probability Failure 46
5.4.5 Simulation Cycles 47
5.4.6 Random Value Equation 48
5.5 Results of Monte Carlo Simulation 48
CHAPTER 6 CONCLUSIONS AND RECOMMENDATIONS 51
6.1 Discussion on Monte Carlo Simulation 51
6.2 Discussion on Peaks-Over-Threshold Method 51
6.3 Discussion on Error of Pigging Data 52
6.4 Conclusions 53

x
6.5 Recommendations 53
REFERENCES 54
APPENDICES 56
xi
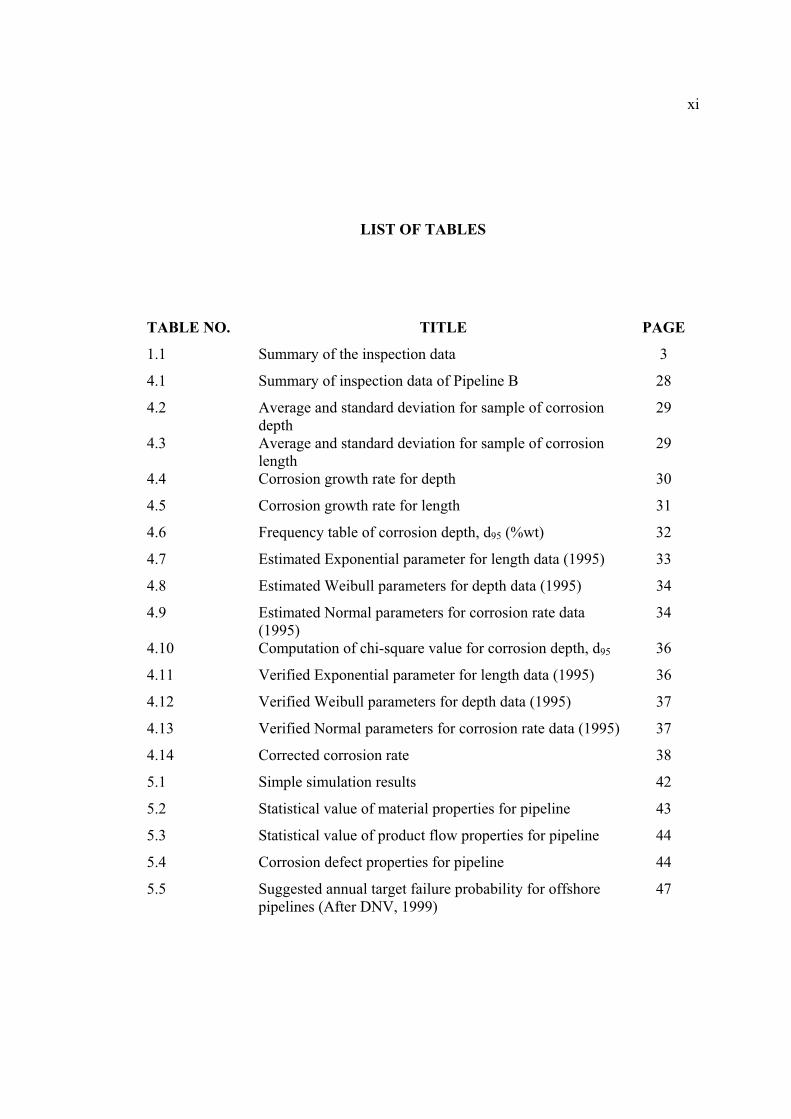
LIST OF TABLES
TABLE NO. TITLE PAGE
1.1 Summary of the inspection data 3
4.1 Summary of inspection data of Pipeline B 28
4.2 Average and standard deviation for sample of corrosion depth
29
4.3 Average and standard deviation for sample of corrosion length
29
4.4 Corrosion growth rate for depth 30
4.5 Corrosion growth rate for length 31
4.6 Frequency table of corrosion depth, d95 (%wt) 32
4.7 Estimated Exponential parameter for length data (1995) 33
4.8 Estimated Weibull parameters for depth data (1995) 34
4.9 Estimated Normal parameters for corrosion rate data (1995)
34
4.10 Computation of chi-square value for corrosion depth, d95 36
4.11 Verified Exponential parameter for length data (1995) 36
4.12 Verified Weibull parameters for depth data (1995) 37
4.13 Verified Normal parameters for corrosion rate data (1995) 37
4.14 Corrected corrosion rate 38
5.1 Simple simulation results 42
5.2 Statistical value of material properties for pipeline 43
5.3 Statistical value of product flow properties for pipeline 44
5.4 Corrosion defect properties for pipeline 44
5.5 Suggested annual target failure probability for offshore pipelines (After DNV, 1999)
47

xii
LIST OF FIGURES
FIGURE NO. TITLE PAGE
3.1 Normal distribution (Noor, 2002) 24
3.2 Lognormal distribution (Noor, 2002) 24
3.3 Exponential distribution (Noor, 2002) 25
3.4 Weibull distribution (Dodson, 1994) 25
3.5 Different extreme Normal distribution (Noor, 2002) 26
4.1 Histogram for corrosion depth, d95 (%wt) 32
4.2 Histogram for corrosion length, L95 (mm) 32
4.3 Histogram for corrosion rate, CR95 (%wt) 33
4.4 Exponential probability plot for corrosion length, L95 (mm) 34
4.5 Weibull probability plot for corrosion depth, d95(all data) (mm)
35
4.6 Normal probability plot for corrosion rate, CR92-95 (mm) 35
5.1 Probability of failure versus time for 10000 cycles and 100000 cycles
48
5.2 Probability of failure versus time (non extreme case) 49
5.3 Probability of failure versus time (extreme case) 50

xiii
LIST OF SYMBOLS
- Interval width
r - Range of the data
N - Number of data points
x - Mean
x - Standard deviation
x - Lognormal parameter
x - Lognormal parameter
- Exponential parameter or known as failure rate
xo - An offset, which is assumed to be known a priori (the smallest value)
- Shape parameter (0< < )
- Scale parameter (0< < )
- Location parameter (- < < )
x̂ - Independent variable
m - Slope
c - y-axis intercept
O - Observed frequency
E - Expected frequency 2 - Chi-square
d - Degree of freedom
k - Number of classes
r2 - Determination coefficient
CR - Corrosion rate
SMTS - Specified minimum yield stress

xiv
d - Corrosion depth
t - Pipe thickness
D - Pipe diameter
Pp - Applied fluid pressure
Pa - Calculated allowable pressure using failure model equation
xv
LIST OF APPENDICES
APPENDIX TITLE PAGE
A Table of Chi-Square Distribution 57
B Table of Standard Normal Distribution 58

CHAPTER 1
INTRODUCTION
1.1 Introduction
Hydrocarbon pipelines are one of the important elements in oil and gas industry.
They are mainly used to transport oil and gas. When pipelines aged, it is necessary that
their safety, environmental and economical interests are preserved.
The internal environments of hydrocarbon pipelines can be extremely corrosive.
Corrosion has become a major cause of the loss of strength in hydrocarbon pipelines
resulting in failures. Due to leakage, the failure of hydrocarbon pipelines contributes to
economic implications and cause serious hazards to the environment. Therefore, the
prediction of pipeline integrity in the early stage is important in order to provide
assessment for future inspection, repair and replacement activities.
This study is solely focused on the effects of extreme growth behaviour of
corrosion pit in hydrocarbon pipeline using statistical and probability methods.

2
1.2 Problem Statement
An intelligent pig inspection will provide a huge amount of defects on pipeline
even very shallow defects. It is more realistic to concern a group of data that has already
exceeded a certain level of corrosion severity. Instead, the peak depth of corrosion
defects is most likely to cause the failure of hydrocarbon pipeline. In this case, peaks-
over-threshold method and extreme value statistics have been adopted.
1.3 Objectives of Study
The main goal of the research is to study the effects of extreme growth behaviour
of corrosion pit in hydrocarbon pipeline using statistical and probability methods. To
achieve this goal, the following plans were identified:
a) To analyse real inspection data using statistical and probability methods.
b) To model extreme growth behaviour of corrosion pit base on the metal loss
volume of the hydrocarbon pipeline obtained from inspection data.
c) To determine the most suitable peaks-over-threshold range of corrosion data.
d) To predict the probability distribution of extreme growth behaviour of corrosion
pit and the remaining life of corroding pipeline at the time of inspection and in
the future using Monte Carlo simulation.

3
1.4 Scope of Study
The scope of study will include the statistical study on the inspection data
gathered from oil and gas producer and inspection vendor. In this study, there are no
dependency on the weather, environmental properties, material properties and operation
conditions. The extreme growth behaviour of corrosion pit is modelled base on solely
the metal loss volume of the hydrocarbon pipeline obtained from the inspection data.
The summary of the inspection data is presented in Table 1.1 below. All parameters are
presented as the statistical probability distributions. With different peaks-over-threshold
value, the probability distribution of the extreme growth behaviour of corrosion pit will
be predicted. To calculate the probability of failure, Monte Carlo simulation procedure
will be used.
Table 1.1 : Summary of the inspection data
INFORMATION PIPELINE B
Diameter (mm) 914.4
Inspected Distance (km) 150
Wall Thickness (mm) 22.2
Year of Inspection 1990,1992,1995
Year of Installation 1967
No. of Data (All Sets) 7009

4
1.5 Importance of Study
The study shows the systematic procedure in modeling the extreme growth
behaviour of corrosion pit in hydrocarbon pipeline based on the in-line inspection data.
Statistical and probability methods used in this study increase the accuracy in analyzing
the data. The peak depth of corrosion defects is most likely to cause the failure of
hydrocarbon pipeline. Therefore, the findings of this study are able to assist the pipeline
operator in providing assessment for future inspection, repair and replacement activities.


