Case Study Report: Development of agro-sidestreams for bioenergy

Extractive Nutrient Recovery as a
Green Option for Managing
Phosphorus in Sidestreams and
Biosolids
Wendell Khunjar, Ph.D.
Ron Latimer, P.E.
Katya Bilyk, P.E.
Joe Rohrbacher, P.E.
Paul Pitt, Ph.D., P.E.
MR396
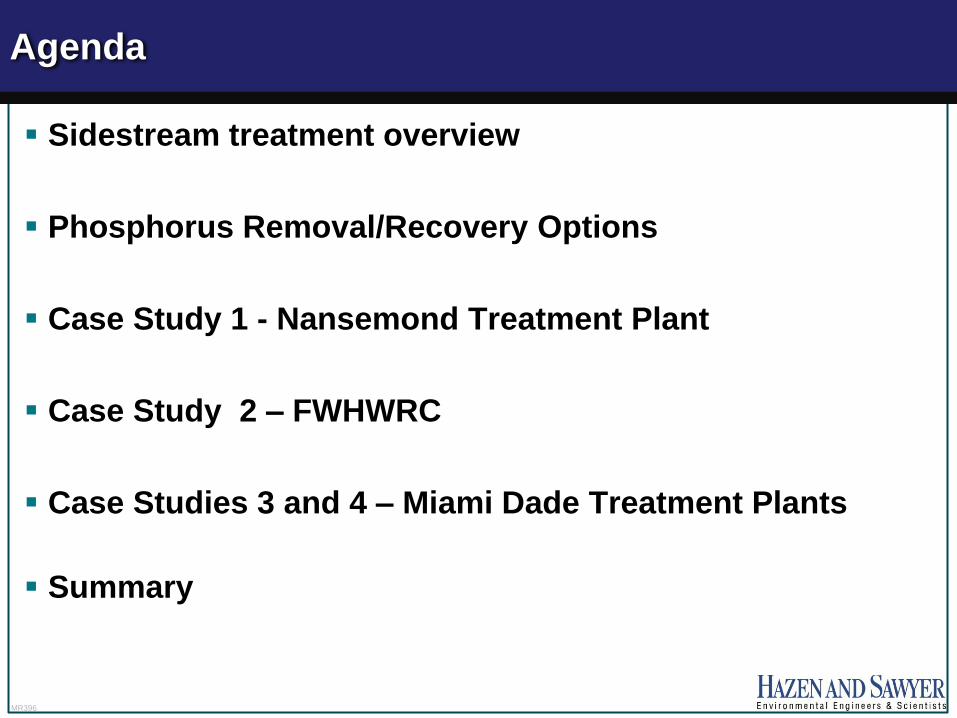
Agenda
Sidestream treatment overview
Phosphorus Removal/Recovery Options
Case Study 1 - Nansemond Treatment Plant
Case Study 2 – FWHWRC
Case Studies 3 and 4 – Miami Dade Treatment Plants
Summary

MR396
Biological treatment is a cost effective, robust
option for carbon and nutrient removal
■ Biological nutrient removal uses microorganisms
■ Solids generated must be processed before disposal
■ Anaerobic digestion is a common solids treatment
option
To solids
handling To solids
handling

MR396
Water resource reclamation facilities accumulate
nutrients within the solids process
Primary
Sludge
10-15%
EBPR or
Chem - P
Removal
35-50%
Effluent
10%
Feces
33%
Urine
67%
Secondary
Sludge
25-40%
Sludge
Up to 90%
Adapted from
Cornel et al., 2009
Adapted from
Phillips et al., 2011
Effluent
13%
Feces
20%
Urine
80%
Sludge
20%
Gaseous emission
67%
Up to 90% of the
influent P can be
present in the
solids stream
Up to 20% of the
influent N can be
present in the
solids stream
MR396
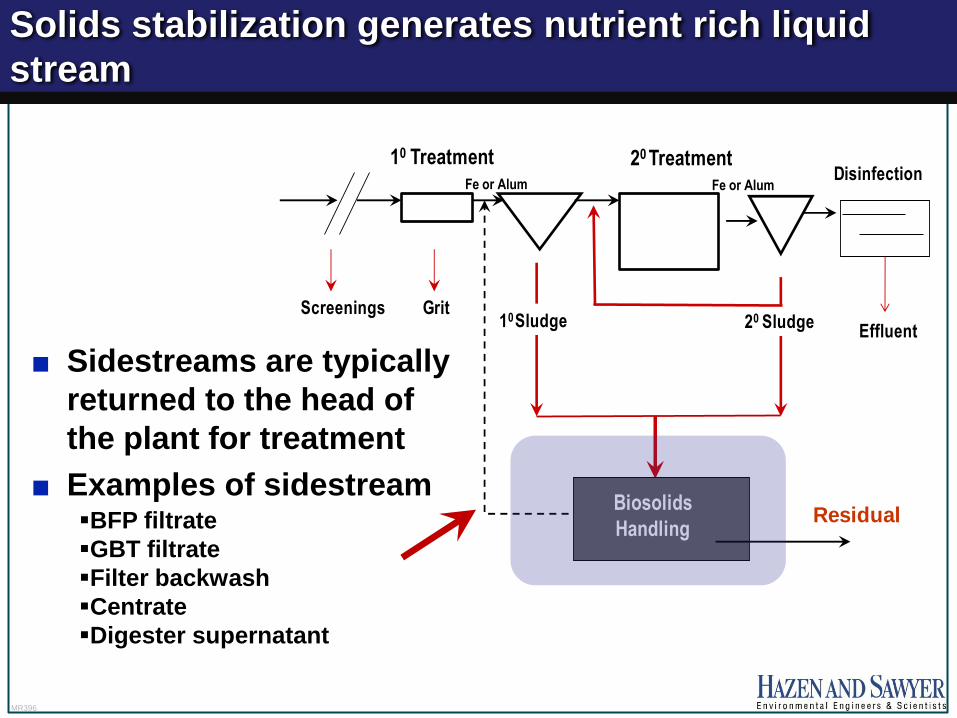
Solids stabilization generates nutrient rich liquid
stream
■ Sidestreams are typically
returned to the head of
the plant for treatment
■ Examples of sidestream BFP filtrate
GBT filtrate
Filter backwash
Centrate
Digester supernatant
Screenings Grit10 Sludge
Biosolids
HandlingResidual
10 Treatment 20 TreatmentDisinfection
Effluent20 Sludge
Fe or Alum Fe or Alum

MR396
High nutrient recycle loads can upset the
mainstream process
Description Percent of
Total Influent
Nitrogen
Load
Percent of
Total Influent
Phosphorus
Load
Nansemond,
Suffolk, VA
Centrate
13% 29%
Bowery Bay, NYC
Centrate 17% *
Henrico County, VA
Centrate 15% *
High Point Eastside,
NC Fermenter * 50%
Wards Island, NYC
Centrate 30-40% *
North Durham, NC
Centrate 19% 30%
South Durham, NC
Centrate 21% 25%
7/11/06 Recycle Stream Sampling
Phosphorus
0
100
200
300
400
500
600
700
800
900
Centrate Ash Lagoon Decant Primary Effluent
Sampling Location
TP
Lo
ad
(lb
/day)
Total P
Up to 50% of the total
influent P load can be
present in the
sidestream

MR396
Struvite can be a significant maintenance concern
with anaerobic digestion
Struvite = Mg + NH4 + PO4
NH4 & PO4 released in digestion
Typically Mg limited
Mg addition (i.e. Mg(OH)2) can
promote struvite formation
Miami Dade SDWRF
NYC Newtown Creek
WPCP

MR396
Sidestream treatment is the manipulation of the
return liquid stream for a treatment purpose
Typically focused on nutrient removal or recovery
Usually economical when sidestreams contribute:
■ ≥15% of the influent TN
■ ≥20% P load
Can often reuse existing infrastructure to reduce costs
Thickening
Biological mainstream process
Anaerobic
Digestion Dewatering
Sidestream
treatment
Biosolids

MR396
What options are available for sidestream nutrient
treatment?
Nutrient rich
sidestream
Treatment
process
Nutrient free
effluent
Removed/recovered
nutrient
Nitrification/Denitrification
Nitritation/Denitritation
Deammonification
Gas stripping and/or ion
exchange
N Removal and
recovery
Coagulant aided precipitation
Struvite crystallization
P removal and
recovery
MR396
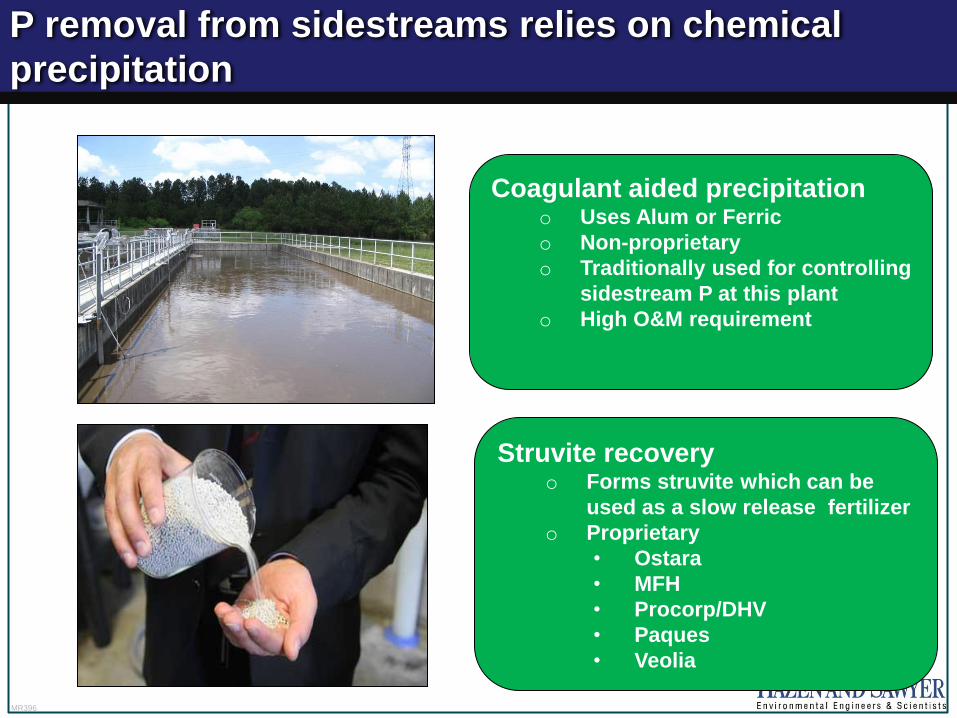
P removal from sidestreams relies on chemical
precipitation
Coagulant aided precipitation o Uses Alum or Ferric
o Non-proprietary
o Traditionally used for controlling
sidestream P at this plant
o High O&M requirement
Struvite recovery o Forms struvite which can be
used as a slow release fertilizer
o Proprietary
• Ostara
• MFH
• Procorp/DHV
• Paques
• Veolia

MR396
Struvite recovery exploits pH dependent chemical
precipitation phenomena
Struvite precipitation
N:P ratio in struvite = 0.45 lbs N required per lb P removed
N:P ratio in filtrate ~ 2.4-2.6, ammonia in excess
Mg+2
NH4+-N
PO4-3 - P
Struvite
Recovery
Reactor
Mg(NH4)PO4(s)
External
NaOH
External
Mg+2
Mg(NH4)PO4(s) = struvite
MR396
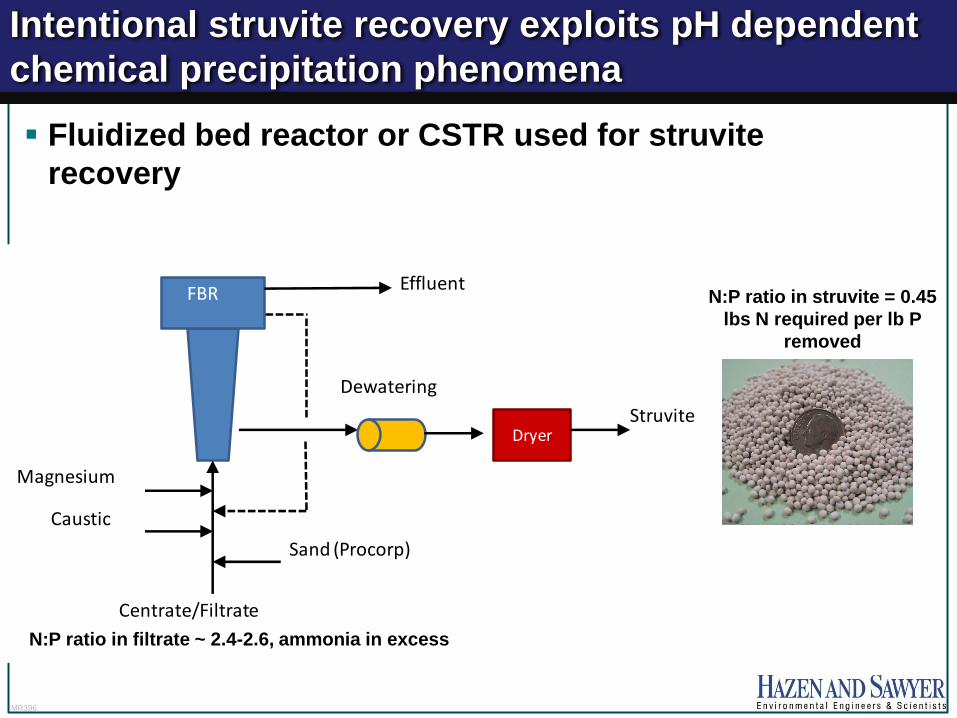
Intentional struvite recovery exploits pH dependent
chemical precipitation phenomena
Fluidized bed reactor or CSTR used for struvite
recovery
Magnesium
Caustic
Centrate/Filtrate
Dryer
Effluent
Struvite
Dewatering
Sand (Procorp)
FBR
N:P ratio in filtrate ~ 2.4-2.6, ammonia in excess
N:P ratio in struvite = 0.45
lbs N required per lb P
removed

MR396
There are several commercial options for struvite
recovery
Name of
Technology Ostara Pearl®
Multiform
Harvest struvite
technology
Phospaq Crystalactor® NuReSys
Name of product
recovered Crystal Green ® struvite fertilizer struvite fertilizer
Struvite,
Calcium‐phosphate,
Magnesium‐phosphate
BioStru®
% efficiency of
recovery from
sidestream
80-90% P
10-40% NH3-N
80-90% P
10-40% NH3-N
80% P
10-40% NH3-N
85-95% P
10-40% NH3-N
>80% P
5-20% N
Product
marketing/resale Ostara Multiform Harvest N/A
Third party facilitated by
Procorp N/A
# of full-scale
installations in
design/operation
8 2 2 4 7
MR396
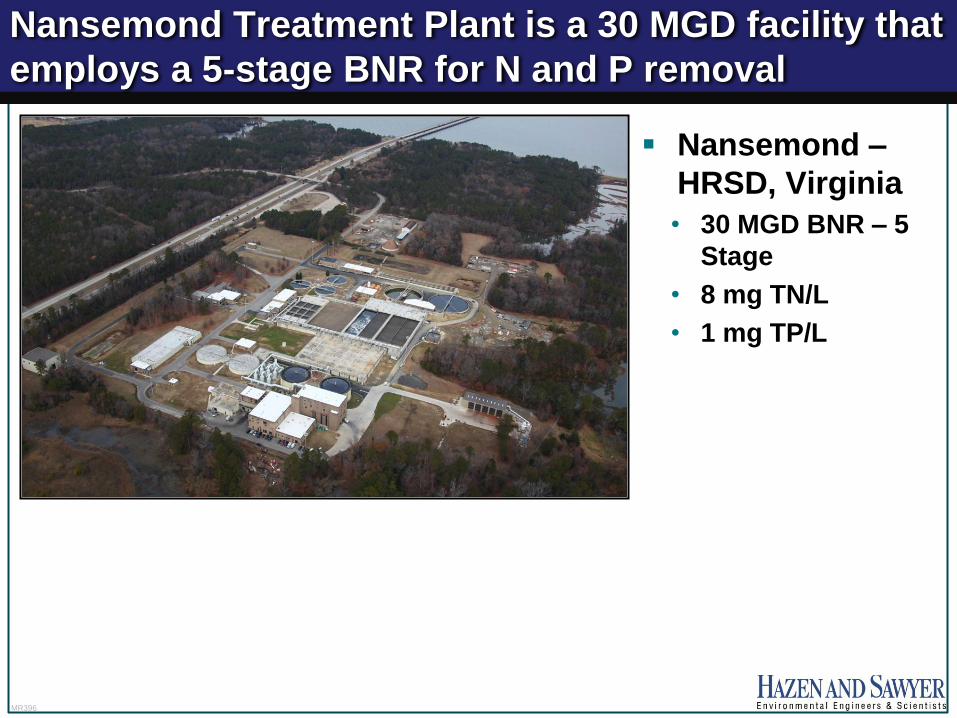
Nansemond Treatment Plant is a 30 MGD facility that
employs a 5-stage BNR for N and P removal
TN = 8
mg/L
TP = 1
mg/L
Nansemond –
HRSD, Virginia
• 30 MGD BNR – 5
Stage
• 8 mg TN/L
• 1 mg TP/L

MR396
Nansemond Treatment Plant is a 30 MGD facility that
employs a 5-stage BNR for N and P removal
TN = 8
mg/L
TP = 1
mg/L
Diurnal Sampling
0.00
2.00
4.00
6.00
8.00
10.00
12.00
14.00
16.00
12:00 AM 2:00 am 4:00 am 6:00 am 8:00 AM 9:00 AM 12:00 PM 2:00 PM 4:00 pm 6:00 pm 8:00 pm 10:00 pm
Time
TP
(m
g/L
)
Day 1 Influent TP
Day 2 Influent TP
Day 1 PE TP
Day 2 PE TP
Sidestream load
represents up to
30% of the plant
influent P load

MR396
Two options were considered for sidestream P
Treatment at NTP
Ferric addition o Forms ferric phosphate and ferric
hydroxide
o Non-proprietary
o Traditionally used for controlling
sidestream P at this plant
o High O&M requirement
Struvite recovery o Ostara Pearl
o Treatment fee option
o OSTARA provides facility
and HRSD pays fee for use
o Capital purchase option
o NTP purchases equipment
and receives annual
payments from OSTARA

MR396
Net present worth analyses indicated that the capital
purchase option was the most cost-effective solution
Nutrient recovery option was more cost effective than
Ferric addition option
Item Treatment Fee
Option
Capital Purchase
Option
Ferric Chloride Chemical Cost $ (290,000) $ (290,000)
Sludge Savings $ (155,000) $ (155,000)
Methanol Savings $ (29,000) $ (29,000)
Oxygen Savings $ (19,000) $ (19,000)
Ostara Paybacks $ (87,850) $ (135,850)
Total Annual Savings $ (580,850) $ (628,850)
Caustic Cost Allowance $ 25,000 $ 25,000
Ostara Annual Fee $ 444,000 $ -
Total Annual Operating Cost $ 469,000 $ 25,000
Total Capital Cost $ 1,080,000 $ 4,143,000
Present Worth Operating Costs $ (1,505,750) $ (8,129,160)
Net Present Worth5 $ (425,750) $ (3,986,050)
Present worth cost of line 10 over 20 years at 5% cost of financing

MR396
NTP constructed and has operated the nutrient
recovery facility for ~ 2 years
MR396
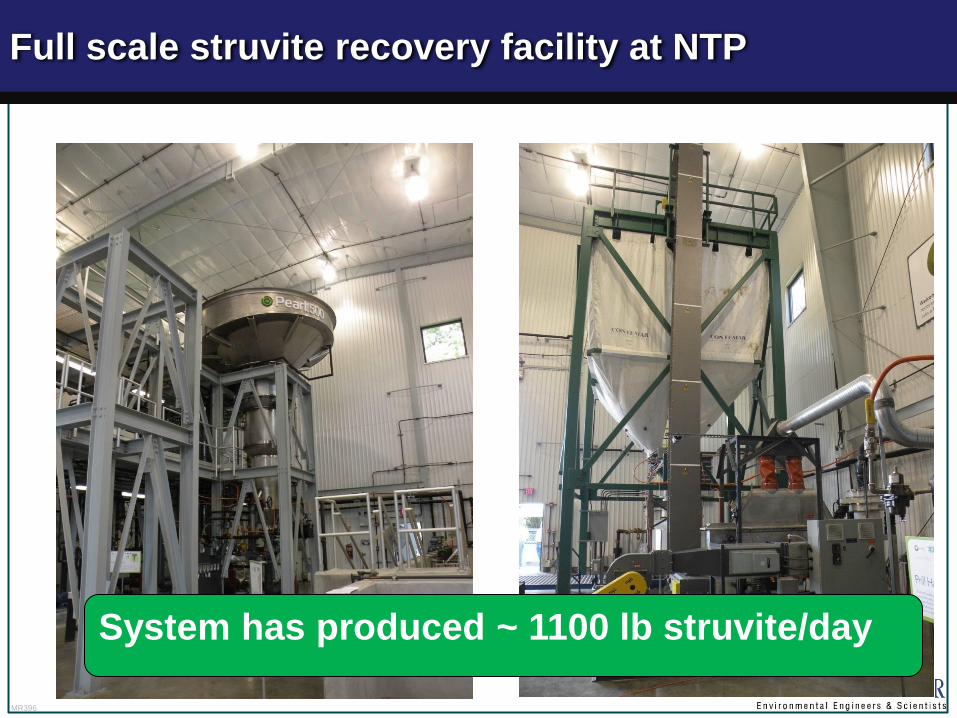
Full scale struvite recovery facility at NTP
System has produced ~ 1100 lb struvite/day

MR396
The struvite recovery facility has reduced ortho-P
concentrations by approximately 85%
0%
10%
20%
30%
40%
50%
60%
70%
80%
90%
100%
0
100
200
300
400
500
600
700
800
900
1000
May-10 Aug-10 Nov-10 Mar-11 Jun-11 Sep-11 Dec-11 Apr-12 Jul-12 Oct-12 Jan-13 May-13
Perc
ent R
emov
al
Conc
entr
atio
n m
g/L
Inf.& Eff. Ortho-P and % Removal for OstaraInfluent ortho-P to Ostara Average Eff. ortho-P% ortho-P Removal 7 per. Mov. Avg. (Influent ortho-P to Ostara)7 per. Mov. Avg. (Average Eff. ortho-P) 7 per. Mov. Avg. (% ortho-P Removal)
MR396
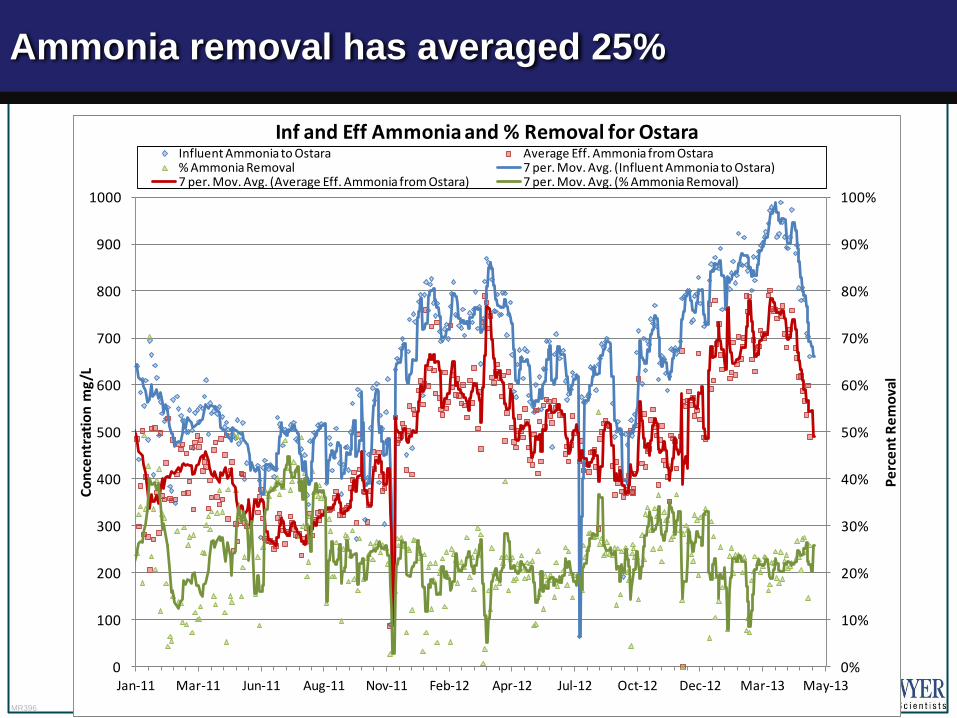
Ammonia removal has averaged 25%
0%
10%
20%
30%
40%
50%
60%
70%
80%
90%
100%
0
100
200
300
400
500
600
700
800
900
1000
Jan-11 Mar-11 Jun-11 Aug-11 Nov-11 Feb-12 Apr-12 Jul-12 Oct-12 Dec-12 Mar-13 May-13
Pe
rce
nt
Re
mo
val
Co
nce
ntr
atio
n m
g/L
Inf and Eff Ammonia and % Removal for OstaraInfluent Ammonia to Ostara Average Eff. Ammonia from Ostara% Ammonia Removal 7 per. Mov. Avg. (Influent Ammonia to Ostara)7 per. Mov. Avg. (Average Eff. Ammonia from Ostara) 7 per. Mov. Avg. (% Ammonia Removal)

MR396
F. Wayne Hill Water Reclamation Center
• Gwinnett County, GA
• 60 MGD advanced WWTP
• 0.08 mg/L TP effluent limit
• Bio-P and chemical trim for P-removal

MR396
In 2009, F. Wayne Hill Changed from Bioxide to
Mg(OH)2 in Collection System for Odor Control
Pros: Eliminated need for ALK addition at plant
Cons: Struvite formation in centrate lines, centrifuges, digester
complex
Sludge from 22 mgd Yellow River Bio-P plant coming, which
would substantially increase P load in sidestreams and SFP
Struvite taken from centrifuge

MR396
Limiting effluent P and struvite formation are key
drivers for this plant
Phosphorus outlets: o Effluent (Limit TP = 0.08 mg/L)
o Sludge cake (precipitated complex, biomass, struvite)
o Struvite solids from nuisance formation
Study goal: determine best solution for struvite
issue (Mg continues) or P recycle issue (Mg stops) o Nutrient Recovery
o Metal salts
MR396
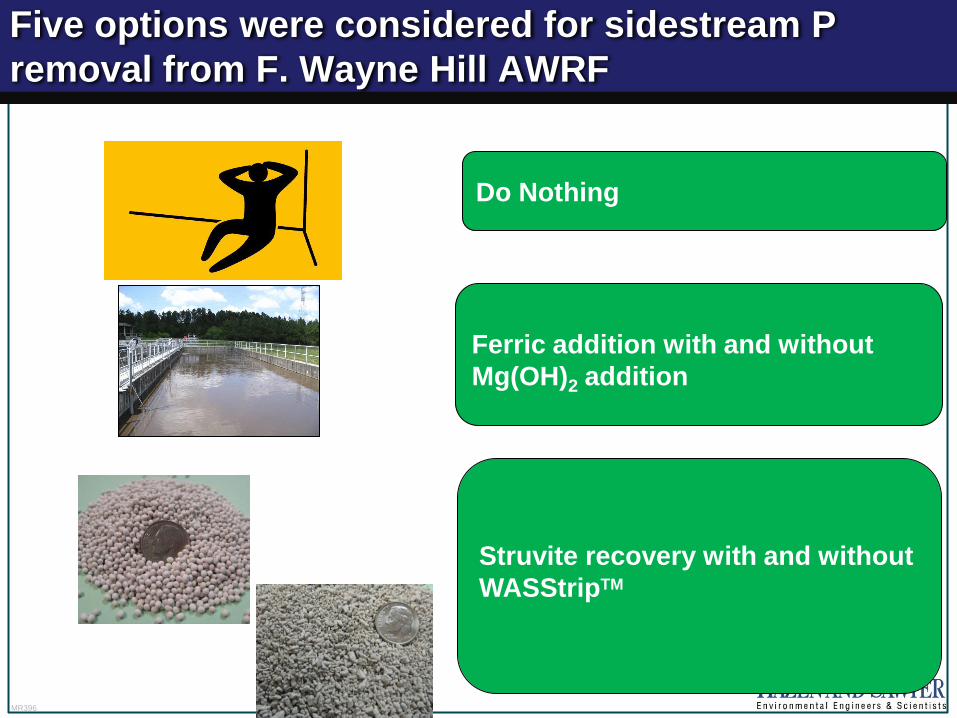
Five options were considered for sidestream P
removal from F. Wayne Hill AWRF
Ferric addition with and without
Mg(OH)2 addition
Struvite recovery with and without
WASStripTM
Do Nothing

MR396
WASSTRIP™ concept minimizes nuisance struvite
production
Release P
from sludge
using VFA
rich stream
Low P content of
sludge minimizes
nuisance struvite
formation from
digester onwards
Send P rich sidestream to recovery process
MR396
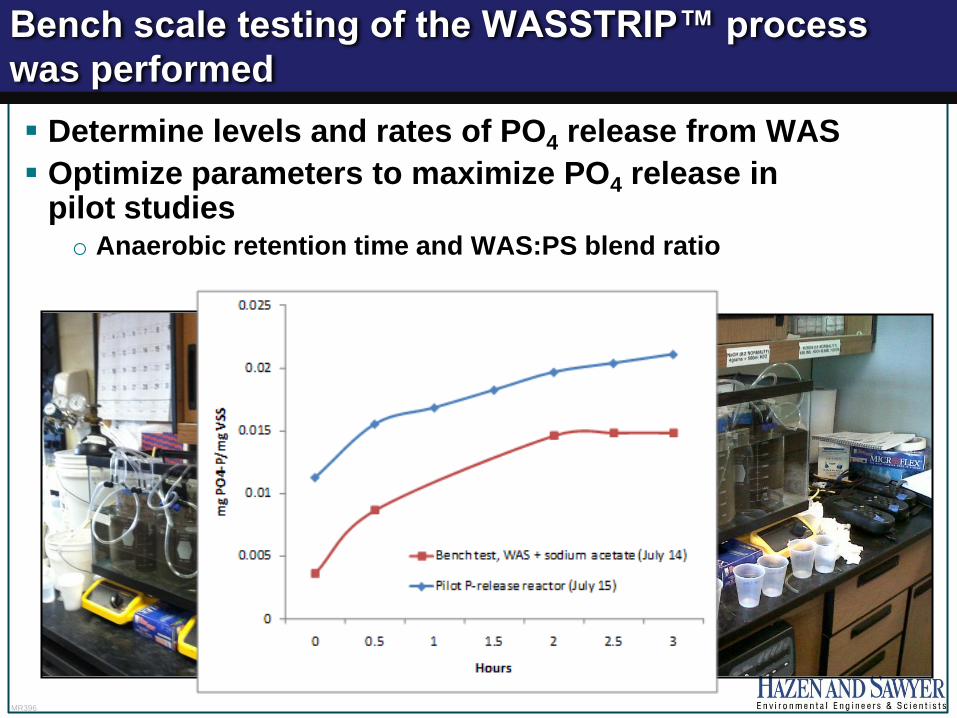
Bench scale testing of the WASSTRIP™ process
was performed
Determine levels and rates of PO4 release from WAS
Optimize parameters to maximize PO4 release in pilot studies o Anaerobic retention time and WAS:PS blend ratio
MR396
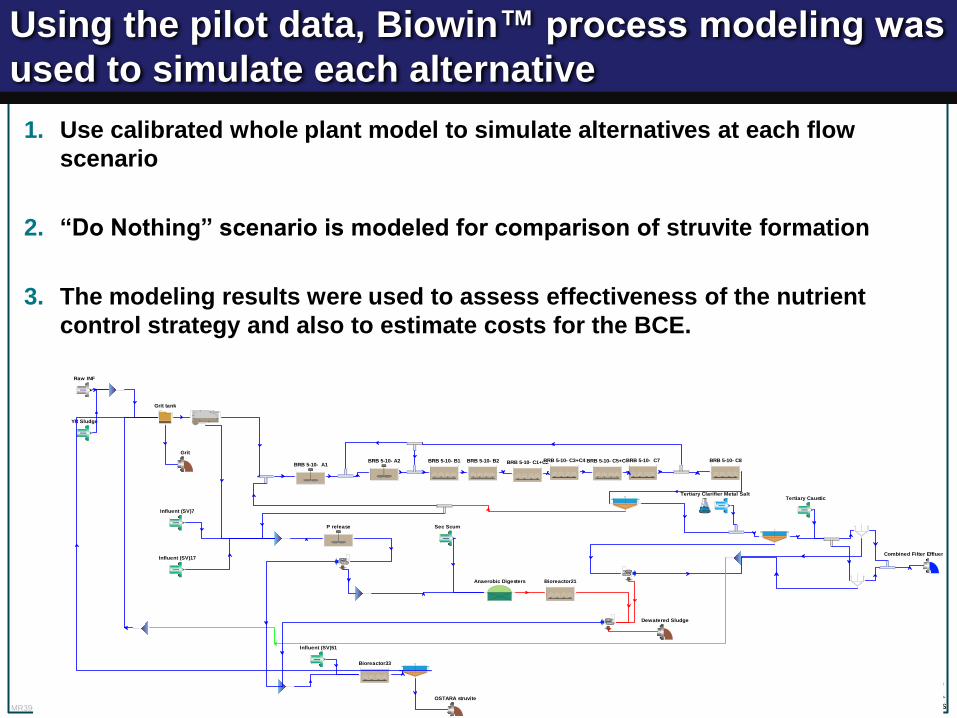
Using the pilot data, Biowin™ process modeling was
used to simulate each alternative
1. Use calibrated whole plant model to simulate alternatives at each flow
scenario
2. “Do Nothing” scenario is modeled for comparison of struvite formation
3. The modeling results were used to assess effectiveness of the nutrient
control strategy and also to estimate costs for the BCE.
Grit tank
BRB 5-10- A1BRB 5-10- A2 BRB 5-10- B1 BRB 5-10- B2 BRB 5-10- C5+C6 BRB 5-10- C8BRB 5-10- C1+C2BRB 5-10- C3+C4 BRB 5-10- C7
Anaerobic Digesters
Dewatered Sludge
Grit
Tertiary Clarifier Metal Salt
Combined Filter Effluent - Pre O3 Infl
Tertiary Caustic
Sec Scum
Bioreactor21
Raw INF
YR Sludge
Influent (SV)7
Influent (SV)17
P release
Bioreactor33
OSTARA struvite
Influent (SV)51

MR396
P recovery provides equivalent struvite reduction
compared with the ferric addition option
0
2,000
4,000
6,000
8,000
10,000
12,000
14,000
Do Nothing Ostara + WASSTRIP +
Mag
Ostara + WASSTRIP +
No Mag
Ostara Centrate No Mag
Ferric Digesters
Mag
Ferric Centrate No Mag
PP
D o
f St
ruvi
te in
Slu
dge
Cak
e
Scenario
30 mgd
40 mgd
50 mgd

MR396
Struvite recovery + WASSTRIP has lowest net
present cost and 8-Year Payback
FWHWRC is pursuing nutrient recovery option
$0.0
$5.0
$10.0
$15.0
$20.0
$25.0
20
13
20
14
20
15
20
16
20
17
20
18
20
19
20
20
20
21
20
22
20
23
20
24
20
25
20
26
20
27
20
28
20
29
20
30
20
31
20
32
20
33
NP
C, $
Mill
ion
s
Year
Ostara + WASSTRIP, Mag
Ostara + WASSTRIP, No Mag
Ostara Centrate, No Mag
Ferric Digesters, Mag
Ferric Centrate, No Mag

MR396
Miami-Dade resource recovery
CDWWTP – 143 mgd
AADF
SDWWTP – 112.5 mgd
AADF
■ Pure oxygen facilities
■ Meets secondary treatment standards
■ Disposal through deep injection wells
■ Significant
nuisance struvite
formation issue

MR396
Miami Dade resource recovery - evaluations
In-situ Coupon Testing to
Determine Degree of Struvite
Formation and Confirm
Theoretical Ferric Dose
Bench Scale Testing to
Determine Optimal Ferric Dose
Ostara
Pilot Test
Modeled Struvite Potential and
Reduction for Each Alternative
& Performed Cost Evaluation

MR396
Nutrient Recovery was the most cost effective
option at both plants
Long term recommendation is to implement nutrient
recovery at both facilities
Notes: * 6% interest and escalation
** Could be significantly higher

MR396
Summary
Thickening Anaerobic
Digestion Dewatering
Sidestream
treatment
clarificatio
n
Biosolids 1. Manipulate the nutrient content of the
biosolids
2. Provide plant with alternative revenue
stream
1. Reduce energy and chemical consumption
in the mainstream process
2. Provide factor of safety for mainstream
nutrient removal process
3. Minimize nuisance struvite formation and
reduce O&M costs
To
mainstream

MR396
Summary
Compare struvite crystallization with precipitation with
coagulant (i.e., alum or ferric)
Payback site-specific and dependent on the P load
Tool for Evaluating Resource RecoverY (TERRY)
developed through WERF grant to help facilities perform
high level evaluation for implementing P recovery

MR396
Contact Information
Wendell O. Khunjar, PhD
4035 Ridge Top Road, Suite 400, Fairfax VA 22030
703 267-2759 (direct) | [email protected]
Katya Bilyk
4011 Westchase Blvd., Suite 500, Raleigh, NC 27607
Phone: 919-755-8593| [email protected]
Ron J. Latimer, PE
5775 Peachtree Dunwoody Rd. Suite D-520, Atlanta, GA
30342
404-459-6363 (main) | [email protected]