EXTRACTION OF CAPROLACTAM IN A ROTATING … · stators that serve to provide mixing-separation...
117
EXTRACTION OF CAPROLACTAM IN A ROTATING DISK CONTACTOR EXTRACTOR by DAVID A. CATO B.S., Georgia Southern University, 2001 M.S., University of Georgia, 2005 B.S., Michigan State University, 2010 A REPORT submitted in partial fulfillment of the requirements for the degree MASTER OF SCIENCE Department of Chemical Engineering College of Engineering KANSAS STATE UNIVERSITY Manhattan, Kansas 2016 Approved by: Major Professor Larry Erickson
Transcript of EXTRACTION OF CAPROLACTAM IN A ROTATING … · stators that serve to provide mixing-separation...
EXTRACTION OF CAPROLACTAM IN A ROTATING DISK CONTACTOR EXTRACTOR
by
DAVID A. CATO
B.S., Georgia Southern University, 2001 M.S., University of Georgia, 2005
B.S., Michigan State University, 2010
A REPORT
submitted in partial fulfillment of the requirements for the degree
MASTER OF SCIENCE
Department of Chemical Engineering College of Engineering
KANSAS STATE UNIVERSITY Manhattan, Kansas
2016
Approved by:
Major Professor Larry Erickson

Copyright
DAVID A. CATO
2016
Abstract
Caprolactam (C6H11NO) is produced in industry primarily as a monomer to be converted
to nylon-6 via a polymerization reaction. More demanding purity requirements for nylon-6 have
increased the performance requirements of extraction columns in the purification train of
caprolactam production. Caprolactam is produced by performing a Beckmann Rearrangement
on cyclohexanone oxime followed by a neutralization of the excess oleum post reaction. The
resulting side product is ammonium sulfate in water with a residual amount of caprolactam that
has to be extracted with benzene from the aqueous ammonium sulfate solution to reduce product
losses. The aqueous caprolactam liquor is extracted in another column into benzene which
purifies the product from water soluble impurities. The resulting caprolactam dissolved in
benzene is back extracted into water where the final purification steps are completed prior to
storage.
Rotating disk contactor (RDC) extraction columns were invented by Royal Dutch Shell in
the early 1950’s. The columns have a rotor in the center that is driven by an electric motor to
rotate equally spaced flat disks inside the column. There are equally spaced annulus shaped
stators that serve to provide mixing-separation compartments for each of the mounted disks on
the rotor. Of the variables to consider for the optimum performance of the extraction in the RDC
extraction column is the rotor speed. Rotor speed curves are generated for the 3 RDC extraction
columns of the caprolactam purification as well as calculations of the number of theoretical
stages for each of the columns based on actual performance data.
Benzene is the solvent of choice in this purification process however recent push by
environmental groups and agencies as well as tightening regulations have driven a desire to find
a more benign alternative to benzene for this process. A review of the research and literature on

potential alternative solvents for caprolactam purification is summarized with positives and
drawbacks for each possible alternative.
v
Table of Contents
List of Figures ......................................................................................................................... viii
List of Tables ..............................................................................................................................x
Acknowledgements ................................................................................................................... xi
Chapter 1 - Introduction ..............................................................................................................1
Solvent Extraction ...................................................................................................................1
Surface Area ........................................................................................................................2
Surface Tension/Interfacial Tension.....................................................................................3
Solute Concentration Effects on Interfacial Tension .........................................................5
Interfacial Turbulence ......................................................................................................7
Salt Concentration Effects on Interfacial Tension ............................................................7
Effects on Surface Tension by pH, Surfactants and Solvent-Solvent Solubility ................8
Drop Coalescence ................................................................................................................9
Extraction Columns .................................................................................................................9
Types of Extraction Columns ................................................................................................ 10
Solvent Extraction Columns with Static Internals .............................................................. 10
Agitated Solvent Extraction Columns ................................................................................ 11
RDC Extraction Columns ...................................................................................................... 13
Rotor Speed ....................................................................................................................... 16
Rotor Speed Curves ........................................................................................................... 20
Theoretical Stages of Extraction for RDC extractors .......................................................... 20
RDC Extraction Columns Under Investigation ...................................................................... 21
Process Flow Diagram ....................................................................................................... 21
RDC-1 ............................................................................................................................... 21
RDC-2 ............................................................................................................................... 22
RDC-3 ............................................................................................................................... 22
Proposed Work .................................................................................................................. 23
Chapter 2 - Rotor Speed ............................................................................................................ 24
Effect of Rotor Speed ............................................................................................................ 24
Mean Droplet Diameter ..................................................................................................... 24
vi
Maximum RDC Extraction Column Throughput and Holdup at Flooding .......................... 26
RDC Extraction Column Dispersed Phase Holdup ............................................................. 27
Critical Rotor Speeds ......................................................................................................... 29
RDC-1 .................................................................................................................................. 30
Mean Droplet Diameter, Reynolds Number and Power Dissipation for RDC-1 .................. 30
Rotor Speed Curves for RDC-1 ......................................................................................... 33
RDC-2 .................................................................................................................................. 35
Mean Droplet Diameter, Reynolds Number and Power Dissipation for RDC-2 .................. 35
Rotor Speed Curves for RDC-2 ......................................................................................... 39
RDC-3 .................................................................................................................................. 43
Mean Droplet Diameter, Reynolds Number and Power Dissipation for RDC-3 .................. 43
Rotor Speed Curves for RDC-3 ......................................................................................... 46
Critical Rotor Speeds ............................................................................................................ 48
First Critical Rotor Speed .................................................................................................. 48
Second Critical Rotor Speed .............................................................................................. 49
Conclusion on Critical Rotor Speeds ................................................................................. 49
Chapter 3 - Theoretical Stages of the RDC Extraction Columns ................................................ 51
Number of Stages in an Extraction Column ........................................................................... 51
Rotating Disk Contactor Extraction Column Stages ............................................................... 52
Phase Velocities and Dispersed Phase Holdup ................................................................... 52
HETS, HTU and HDU ....................................................................................................... 55
RDC-1: Extraction of Caprolactam from Aqueous Ammonium Sulfate ............................. 58
HTUeff and HETS for RDC-1......................................................................................... 58
RDC-2: Forward Extraction of Caprolactam from Aqueous Caprolactam Oil .................... 61
HTUeff and HETS for RDC-2......................................................................................... 61
RDC-3: Back Extraction of Caprolactam from Benzene to Water ...................................... 65
Chapter 4 - Alternative Solvents for Caprolactam Extraction ..................................................... 69
Caprolactam Extraction ......................................................................................................... 69
Impurity Profile ................................................................................................................. 69
Solvent Selection Requirements......................................................................................... 71
Solvents ................................................................................................................................ 73
vii
Water ................................................................................................................................ 73
Benzene and Aromatic Solvents ........................................................................................ 74
Alkanes and Cyclic Alkanes .............................................................................................. 80
Chlorinated Hydrocarbons ................................................................................................. 81
Alcohols ............................................................................................................................ 84
Ketones ............................................................................................................................. 87
Solvent Mixtures ............................................................................................................... 89
Chapter 5 - Conclusions ............................................................................................................ 93
Caprolactam Extraction ......................................................................................................... 93
RDC Extraction Columns ...................................................................................................... 93
Rotor Speed Curves ........................................................................................................... 93
Theoretical Extraction Stages ............................................................................................ 94
Alternative Solvents for Caprolactam Extraction ................................................................... 95
Nomenclature ............................................................................................................................ 96
English .............................................................................................................................. 96
Greek Letters ..................................................................................................................... 99
References .............................................................................................................................. 100
viii
List of Figures
Figure 1-1 Liquid-liquid extraction..............................................................................................1
Figure 1-2 Water Surface Tension vs. Salt Concentration ............................................................8
Figure 1-3 Solvent Extraction Columns with Static Internals .................................................... 11
Figure 1-4 Scheibel Column ...................................................................................................... 12
Figure 1-5 Section of a RDC Extraction Column ....................................................................... 14
Figure 1-6 RDC Vortex Flow ................................................................................................... 15
Figure 1-7 Power Input per Rotor Disk ..................................................................................... 19
Figure 1-8 RDC Extraction Columns for Caprolactam Purification ........................................... 21
Figure 2-1 RDC-1 Reynolds Number vs. Rotor Speed .............................................................. 31
Figure 2-2 RDC-1 Power Number vs. Rotor Speed ................................................................... 31
Figure 2-3 RDC-1 Power Dissipation in Compartment vs. Rotor Speed..................................... 32
Figure 2-4 RDC-1 Mechanical Power Dissipation vs. Rotor Speed ............................................ 32
Figure 2-5 RDC-1 Mean Droplet Diameter vs. Rotor Speed .................................................... 33
Figure 2-6 RDC-1 Rotor Speed Curve - Total Flow ................................................................... 34
Figure 2-7 RDC-1 Rotor Speed Curve - Solvent Flow .............................................................. 35
Figure 2-8 Reynolds Number vs. Rotor Speed for the Top Section of RDC-2 ........................... 36
Figure 2-9 Reynolds Number vs. Rotor Speed for the Bottom Section of RDC-2....................... 37
Figure 2-10 RDC-2 Power Number vs. Rotor Speed ................................................................. 37
Figure 2-11 RDC-2 Power Dissipation vs. Rotor Speed ............................................................ 38
Figure 2-12 RDC-2 Mechanical Power Dissipation vs. Rotor Speed ......................................... 38
Figure 2-13 RDC-2 Mean Drop Size vs. Rotor Speed ............................................................... 39
Figure 2-14 Rotor Speed Curve vs. Total Flow for the Top Section of RDC-2 .......................... 40
Figure 2-15 Rotor Speed Curve vs. Solvent Flow for the Top Section of RDC-2 ...................... 41
Figure 2-16 Rotor Speed Curve vs. Total Flow for the Bottom Section of RDC-2 .................... 41
Figure 2-17 Rotor Speed Curve vs. Solvent Flow for the Bottom Section of RDC-2 ................. 42
Figure 2-18 RDC-3 Reynolds Number vs. Rotor Speed ............................................................ 43
Figure 2-19 RDC-3 Power Number vs. Rotor Speed ................................................................. 44
Figure 2-20 RDC-3 Power Dissipation in Compartment vs. Rotor Speed .................................. 44
Figure 2-21 RDC-3 Mechanical Power Dissipation vs. Rotor Speed ......................................... 45
ix
Figure 2-22 RDC-3 Mean Drop Size vs. Rotor Speed ............................................................... 45
Figure 2-23 RDC-3 Rotor Speed Curve vs. Total Flow ............................................................. 46
Figure 2-24 RDC-3 Rotor Speed Curve vs. Solvent Flow ......................................................... 47
Figure 3-1 Dispersed Phase Holdup at Flooding ....................................................................... 54
Figure 3-2 Kd vs Ammonium Sulfate Concentration ................................................................ 59
Figure 3-3 RDC-1 NTS vs Solvent Flow at Various Rotor Speeds ............................................ 60
Figure 3-4 RDC-1 NTS vs Total Flow at Various Rotor Speeds ............................................... 61
Figure 3-5 Kd Based on Temperature and Caprolactam Concentration ..................................... 62
Figure 3-6 RDC-2 NTS vs Feed Flow at Various Rotor Speeds ................................................ 64
Figure 3-7 RDC-2 NTS vs Total Flow at Various Rotor Speeds ............................................... 64
Figure 3-8 RDC-2 NTS vs Solvent Flow at Various Rotor Speeds ............................................ 67
Figure 3-9 RDC-3 NTS vs Total Flow at Various Rotor Speeds ................................................ 68
Figure 4-1 Impurities formed by Neber Rearrangement ............................................................. 70
Figure 4-2 Impurities in Caprolactam due to Purity of Cyclohexanone Oxime .......................... 71
Figure 4-3 Caprolactam - Water Hydrogen Bonding ................................................................. 74
Figure 4-4 Aromatic Solvent Structures ..................................................................................... 76
Figure 4-5 Ternary Diagram Water + Caprolactam + Benzene .................................................. 77
Figure 4-6 Ternary Diagram Water + Caprolactam + Toluene ................................................... 77
Figure 4-7 Ternary Diagram Water + Caprolactam + Nitrobenzene .......................................... 78
Figure 4-8 Partition Coefficient for Caprolactam (Toluene vs. Benzene) .................................. 80
Figure 4-9 Chlorinated Hydrocarbons....................................................................................... 81
Figure 4-10 Ternary Diagram Water + Caprolactam + Chloroform........................................... 83
Figure 4-11 Ternary Diagram Water + Caprolactam + Carbon Tetrachloride ............................ 83
Figure 4-12 Ternary Diagram Water + Caprolactam + Trichloroethylene ................................. 84
Figure 4-13 Alcohols ................................................................................................................ 85
Figure 4-14 Ternary Diagram Water + Caprolactam + Cyclohexanol ....................................... 86
Figure 4-15 Ternary Diagram Water + Caprolactam + 1-Heptanol ............................................ 87
Figure 4-16 Water + Caprolactam + 2-Heptanone .................................................................... 88
Figure 4-17 Ketone Structures ................................................................................................... 89
Figure 4-18 Water + Caprolactam + 40% 1-Heptanol in Methylcyclohexane ............................ 90
Figure 4-19 Water + Caprolactam + 40% 1-Heptanol in Heptane ............................................. 91
x
List of Tables
Table 2-1 RDC Extraction Column Parameters ......................................................................... 29
Table 2-2 Values of the First Critical Rotor Speed .................................................................... 48
Table 2-3 Values of the Second Critical Rotor Speed ............................................................... 49
Table 3-1 RDC-1 Stages as Mixer-Settlers ............................................................................... 60
Table 3-2 RDC-2 Stages as Mixer-Settlers ............................................................................... 63
Table 3-3 RDC-3 Stages as Mixer Settlers................................................................................ 66
Table 4-1 Caprolactam Solubility Capacities of Various Solvents ............................................. 72
Table 4-2 Mutual Solubility Between Aromatic Solvents and Water ......................................... 79

xi
Acknowledgements
First I would like to acknowledge Felice Cato, my wife, for being so patient and
supportive over the past few years while I spent many nights and weekends consumed in
coursework. Second, my children Brianna and Evan for being supportive as well, and I hope that
I set a good example of how you can accomplish anything you want as long as you are dedicated
to doing so. I would like to acknowledge my committee members Dr. Bin Liu and Dr. Jennifer
Anthony, my advisor Dr. Larry Erickson and the entire staff at the Department of Chemical
Engineering at Kansas State University.
1
Chapter 1 - Introduction
Solvent Extraction
Liquid-liquid extraction, also known as solvent extraction, is the chemical process of
transferring a solute from one solvent into another in a system where the solvents are immiscible.
The efficiency of the mass transfer in solvent extraction is dependent upon a number of
parameters of each fluid and of the system in whole including density and viscosity of each
phase, droplet size of the dispersed phase which equilibrates to surface area for mass transfer,
interfacial tension of the system, and partitioning coefficients for mass transfer among others[1].
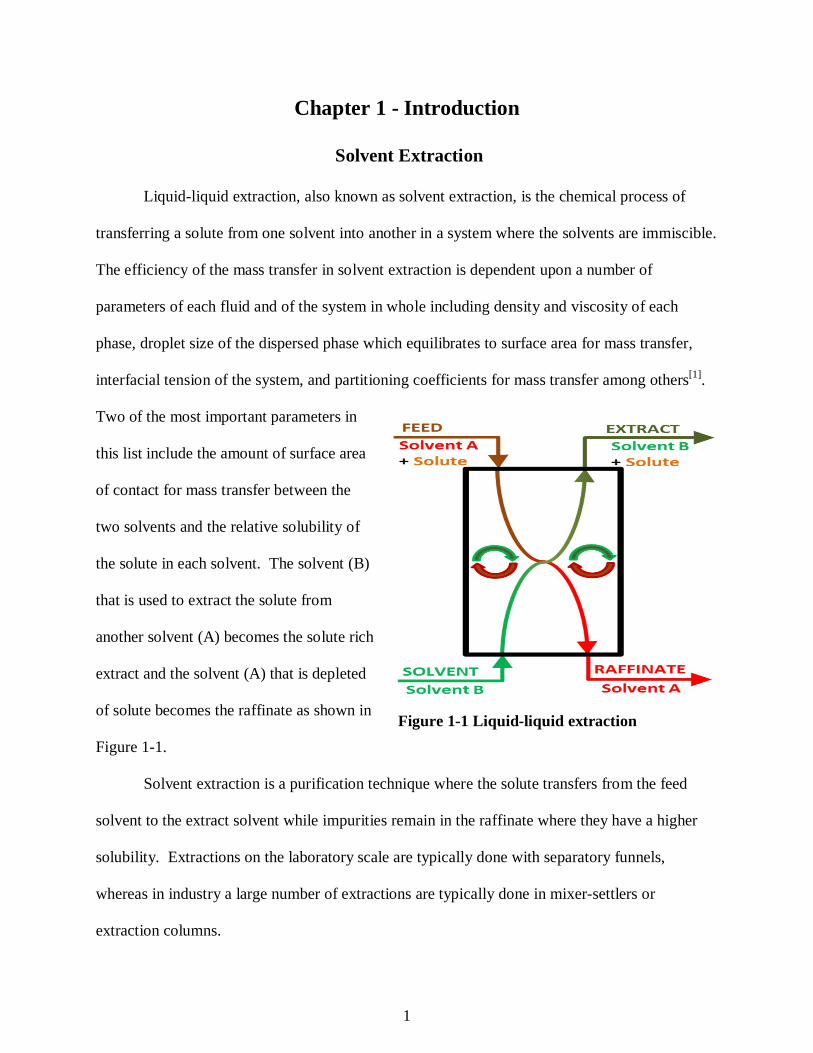
Two of the most important parameters in
this list include the amount of surface area
of contact for mass transfer between the
two solvents and the relative solubility of
the solute in each solvent. The solvent (B)
that is used to extract the solute from
another solvent (A) becomes the solute rich
extract and the solvent (A) that is depleted
of solute becomes the raffinate as shown in
Figure 1-1.
Solvent extraction is a purification technique where the solute transfers from the feed
solvent to the extract solvent while impurities remain in the raffinate where they have a higher
solubility. Extractions on the laboratory scale are typically done with separatory funnels,
whereas in industry a large number of extractions are typically done in mixer-settlers or
extraction columns.
Figure 1-1 Liquid-liquid extraction
2
Surface Area
Solute transfer occurs at the interface between the two immiscible solvents. Therefore
solute transfer is highly dependent upon the surface area between the solvents where the transfer
of the solute occurs. As two immiscible solvents are fed countercurrent to one another, there is a
driving force of the dispersed phase to coalesce into a single stream with the lowest possible
surface area. This driving force is the free energy reduction by minimization of surface area.
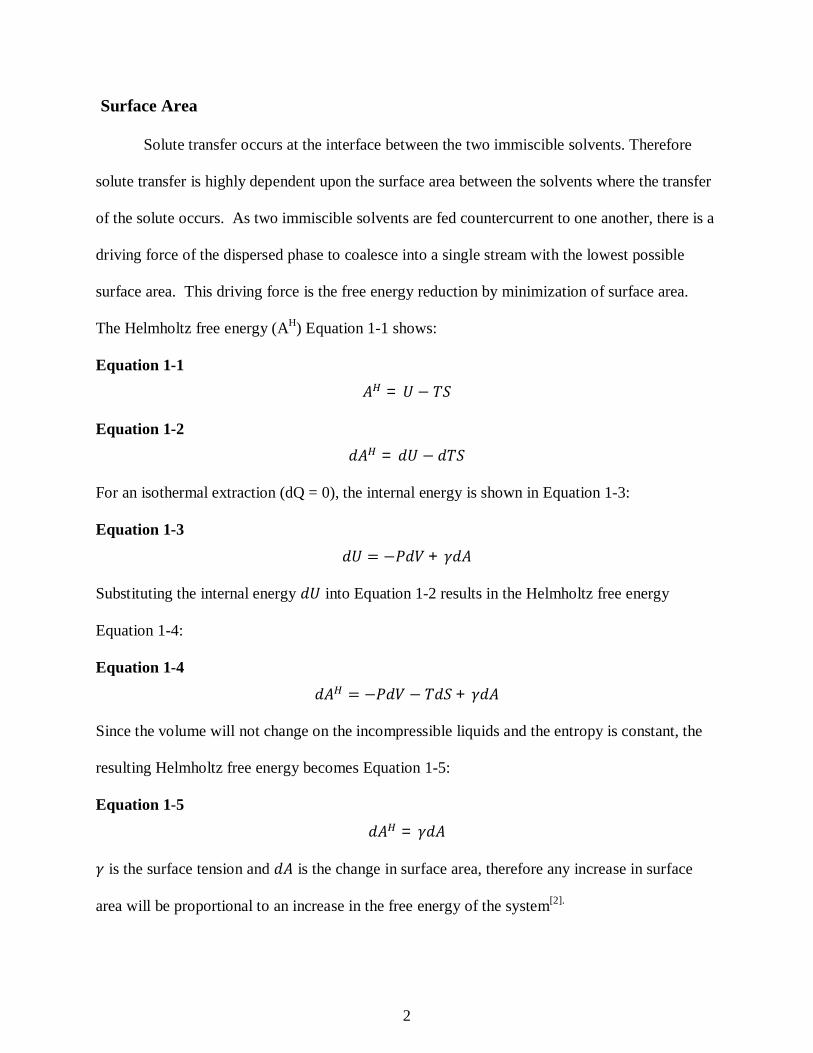
The Helmholtz free energy (AH) Equation 1-1 shows:
Equation 1-1
=
Equation 1-2
=
For an isothermal extraction (dQ = 0), the internal energy is shown in Equation 1-3:
Equation 1-3
+
Substituting the internal energy into Equation 1-2 results in the Helmholtz free energy
Equation 1-4:
Equation 1-4
+
Since the volume will not change on the incompressible liquids and the entropy is constant, the
resulting Helmholtz free energy becomes Equation 1-5:
Equation 1-5
=
is the surface tension and is the change in surface area, therefore any increase in surface
area will be proportional to an increase in the free energy of the system[2].
3
Surface Tension/Interfacial Tension
Surface tension is caused by the attraction between molecules of the liquid by one
or more intermolecular forces such as hydrogen bonding or van der Waals forces. Interfacial
tension is the driving force for coalescence of the dispersed droplets immersed in another
immiscible liquid in order to reduce the interfacial area between the two liquids. The internal
energy of an extraction system is a function of the interfacial area and interfacial tension between
the two fluids as shown in the Helmholtz equation above. The energy of the system is
proportional to interfacial area and therefore smaller droplets means increased interfacial area
which results in a higher energy system[3]. A low interfacial tension will favor dispersion and
smaller dispersed phase droplets whereas a high interfacial tension will require more energy
input into the system in order to maintain the proper droplet dispersion required for efficient
solute transfer. Stable emulsions may occur when the interfacial tension of the dispersed phase
is low enough and large enough energy per area that continued energy input into the system will
result in maintaining the emulsion which is not desirable in most liquid extractions. Extraction
columns have a set residence time based on feed rates and stable emulsions can lead to very poor
separation and carryover of the dispersed phase.
Extraction is dependent upon the interfacial tension between the two immiscible liquids
in that there has to be the capability to break droplets of the dispersed phase in the continuous
phase and there has to be strong enough surface tension to drive coalescence at a rate that makes
the extraction reasonably effective. In terms of energy, surface tension of a liquid is the ratio of
the change in the energy of the liquid to the change in the surface area of the liquid where the
surface area change led to the change in energy as seen in Equation 1-6.
4
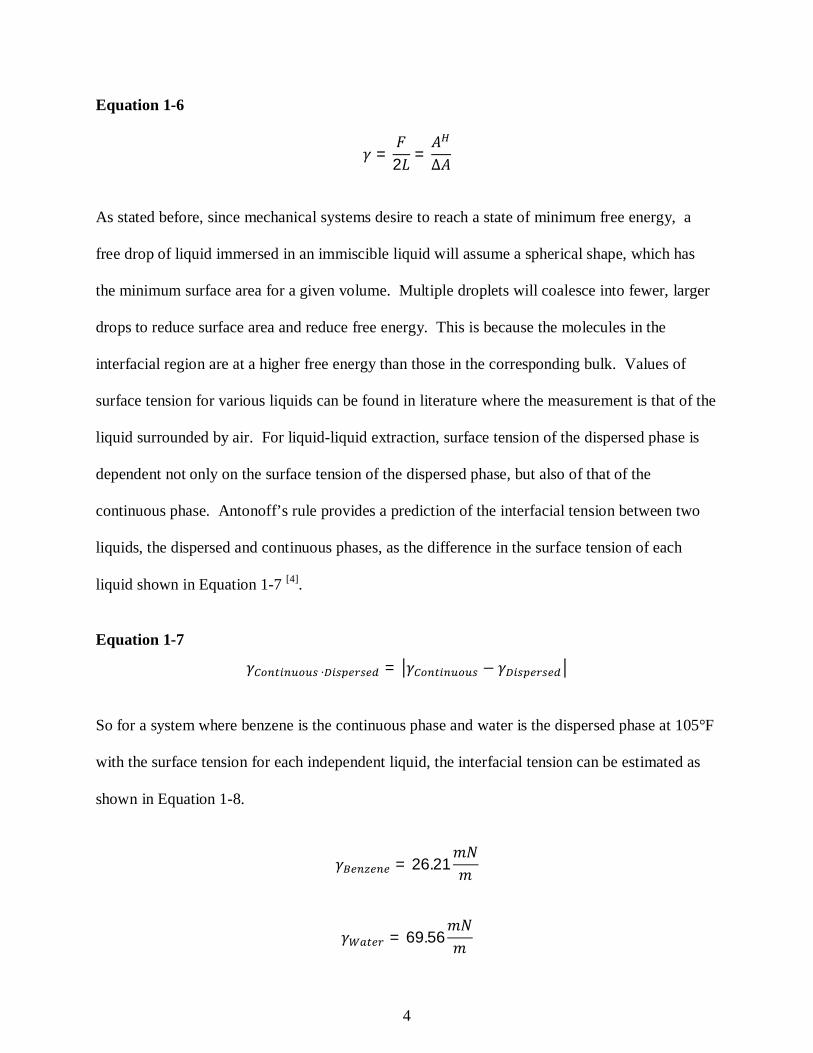
Equation 1-6
= 2 =
As stated before, since mechanical systems desire to reach a state of minimum free energy, a
free drop of liquid immersed in an immiscible liquid will assume a spherical shape, which has
the minimum surface area for a given volume. Multiple droplets will coalesce into fewer, larger
drops to reduce surface area and reduce free energy. This is because the molecules in the
interfacial region are at a higher free energy than those in the corresponding bulk. Values of
surface tension for various liquids can be found in literature where the measurement is that of the
liquid surrounded by air. For liquid-liquid extraction, surface tension of the dispersed phase is
dependent not only on the surface tension of the dispersed phase, but also of that of the
continuous phase. Antonoff’s rule provides a prediction of the interfacial tension between two
liquids, the dispersed and continuous phases, as the difference in the surface tension of each
liquid shown in Equation 1-7 [4].
Equation 1-7
=
So for a system where benzene is the continuous phase and water is the dispersed phase at 105°F
with the surface tension for each independent liquid, the interfacial tension can be estimated as
shown in Equation 1-8.
= 26.21
= 69.56
5
Equation 1-8
= 26.21 69.56 = 43.35
This is also the value for the interfacial tension when benzene is the dispersed phase in
water. A low interfacial tension between solvents means the drive to phase separate is reduced
and the coalescing rate is reduced in comparison to a system with high interfacial tension
between solvents. This is known as the surface tension case where the droplets of the dispersed
phase remain so small that they stay suspended in the continuous phase with a significantly
reduced rate of coalescence.
Solute Concentration Effects on Interfacial Tension
Surface tension can also be affected by solute concentration which is dependent on the
structure of the solute. The interfacial tension tends to decrease considerably with increasing
solute concentration in the system, and the transfer of solute retards drop coalescence due to the
decrease in surface tension. The surface tension of a solute in a solvent can be calculated using
the Gibbs adsorption isotherm Equation 1-9[5].
Equation 1-9
Where 1 is the solvent and 2 is the solute. Assuming the interface is ideal we can conclude that
= 0 simplifying to Equation 1-10.
Equation 1-10
And the chemical potential of the solute can be obtained from Equation 1-11:
6
Equation 1-11
= + ln
Which results in the Gibbs Isotherm shown in Equation 1-12:
Equation 1-12
1,
Where C is the concentration of the solute in the bulk solution. The surface concentration, ,
represents excess of solute per unit area of the surface with the assumption that the bulk
concentration is equivalent all the way to the surface. Transfer of the solute out of the dispersed
phase aids in coalescence whereas transfer from the continuous phase into the dispersed phase
reduces the rate of coalescence.
The Szyzkowski isotherm can also be used to calculate the effects of solute concentration
on the interfacial tension shown in Equation 1-13[6].
Equation 1-13
, = , ln + 1
Where ASZ and BSZ are Szyzkowski adsorption coefficients.
The temperature influence on the interfacial tension of a system without solute present
can be determined by Equation 1-14, the Jasper correlation[7].
7
Equation 1-14
, = , ( 293)
Where AJ is the Jasper coefficient.
Interfacial Turbulence
Interfacial turbulence is the spontaneous agitation of the interface between two
unequilibrated liquids. This is known as the Marangoni effect which involves the rapid
movement at a liquid interface caused by local variations in surface tension[8, 9, 10, 11]. The
gradient in surface tension causes a hydrodynamic drag which leads to movement of the liquid at
the interface. Some extraction systems are stable with transfer of the solute from one solvent to
another, but are unstable with transfer in the opposite direction. Interfacial turbulence is
promoted by solute transfer out of the higher viscosity phase, out of the phase in which its
diffusivity is lower, steep concentration gradients near the interface, low viscosities and
diffusivities in both phases, interfacial tensions that are highly sensitive to solute concentration,
interfaces of large extent, and large differences in kinematic viscosity and solute diffusivity
between the two phases[9, 12]. Interfacial turbulence can increase coalescence rates in some cases
and reduce coalescence rates in others.
Salt Concentration Effects on Interfacial Tension
Surface tension of water can be affected by salts. The surface tension tends to increase
with increasing concentration of salt dissolved in water[13]. The increased surface tension of the
water will increase the interfacial tension between water and another immiscible solvent.
8
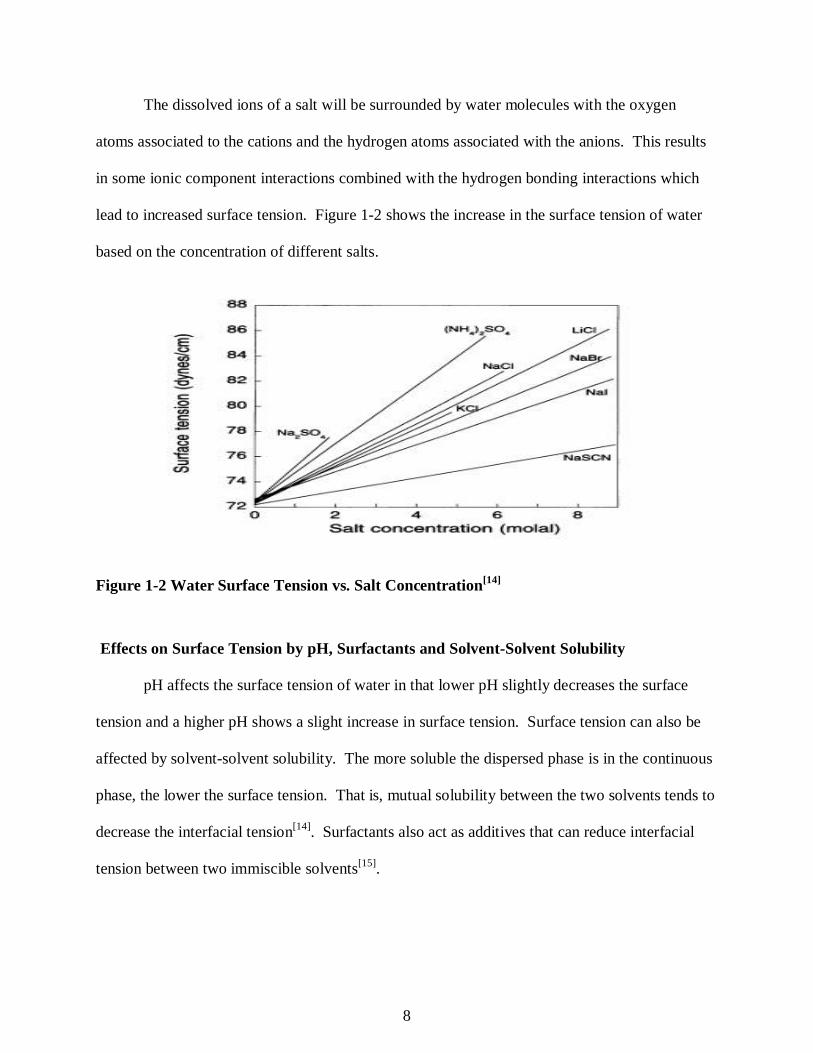
The dissolved ions of a salt will be surrounded by water molecules with the oxygen
atoms associated to the cations and the hydrogen atoms associated with the anions. This results
in some ionic component interactions combined with the hydrogen bonding interactions which
lead to increased surface tension. Figure 1-2 shows the increase in the surface tension of water
based on the concentration of different salts.
Figure 1-2 Water Surface Tension vs. Salt Concentration[14]
Effects on Surface Tension by pH, Surfactants and Solvent-Solvent Solubility
pH affects the surface tension of water in that lower pH slightly decreases the surface
tension and a higher pH shows a slight increase in surface tension. Surface tension can also be
affected by solvent-solvent solubility. The more soluble the dispersed phase is in the continuous
phase, the lower the surface tension. That is, mutual solubility between the two solvents tends to
decrease the interfacial tension[14]. Surfactants also act as additives that can reduce interfacial
tension between two immiscible solvents[15].
9
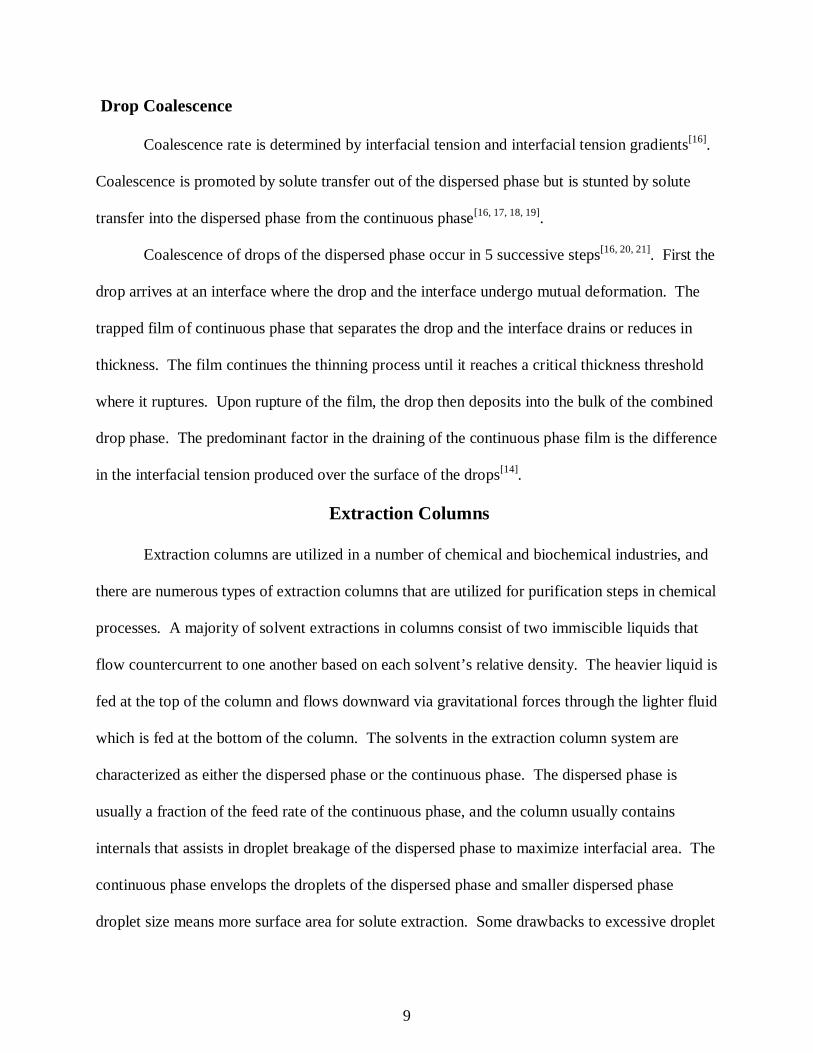
Drop Coalescence
Coalescence rate is determined by interfacial tension and interfacial tension gradients[16].
Coalescence is promoted by solute transfer out of the dispersed phase but is stunted by solute
transfer into the dispersed phase from the continuous phase[16, 17, 18, 19].
Coalescence of drops of the dispersed phase occur in 5 successive steps[16, 20, 21]. First the
drop arrives at an interface where the drop and the interface undergo mutual deformation. The
trapped film of continuous phase that separates the drop and the interface drains or reduces in
thickness. The film continues the thinning process until it reaches a critical thickness threshold
where it ruptures. Upon rupture of the film, the drop then deposits into the bulk of the combined
drop phase. The predominant factor in the draining of the continuous phase film is the difference
in the interfacial tension produced over the surface of the drops[14].
Extraction Columns
Extraction columns are utilized in a number of chemical and biochemical industries, and
there are numerous types of extraction columns that are utilized for purification steps in chemical
processes. A majority of solvent extractions in columns consist of two immiscible liquids that
flow countercurrent to one another based on each solvent’s relative density. The heavier liquid is
fed at the top of the column and flows downward via gravitational forces through the lighter fluid
which is fed at the bottom of the column. The solvents in the extraction column system are
characterized as either the dispersed phase or the continuous phase. The dispersed phase is
usually a fraction of the feed rate of the continuous phase, and the column usually contains
internals that assists in droplet breakage of the dispersed phase to maximize interfacial area. The
continuous phase envelops the droplets of the dispersed phase and smaller dispersed phase
droplet size means more surface area for solute extraction. Some drawbacks to excessive droplet
10
breakage include carryover, flooding or emulsion formation in the extraction column. Solute
extraction can occur in either direction from the dispersed to the continuous phase or from the
continuous to the dispersed phase.
Types of Extraction Columns
There are various types of columns used in industry with varying internal components
that assist in maintaining dispersion of the droplets. Some of these columns achieve this with
static internals and other by inputting mechanical energy into the fluids in the extraction column.
Solvent Extraction Columns with Static Internals
Static solvent extraction columns have no internal moving parts to induce mixing or
internal droplet formation of the solvents. The surface area of the dispersed phase and thereby
the transfer of the solute from one solvent to the other is controlled by the flow past immobile
column internals.
The most elementary of this type of column is the spray column where the dispersed
phase is fed through a dispersion ring of nozzles either from the top or bottom of the column.
The drops formed by each nozzle flow up/down the column and have the ability to coalesce
without internal resistance other than distance between the drops of the dispersed phase in the
continuous phase. Therefore the spray column is the least efficient of the solvent extraction
columns.
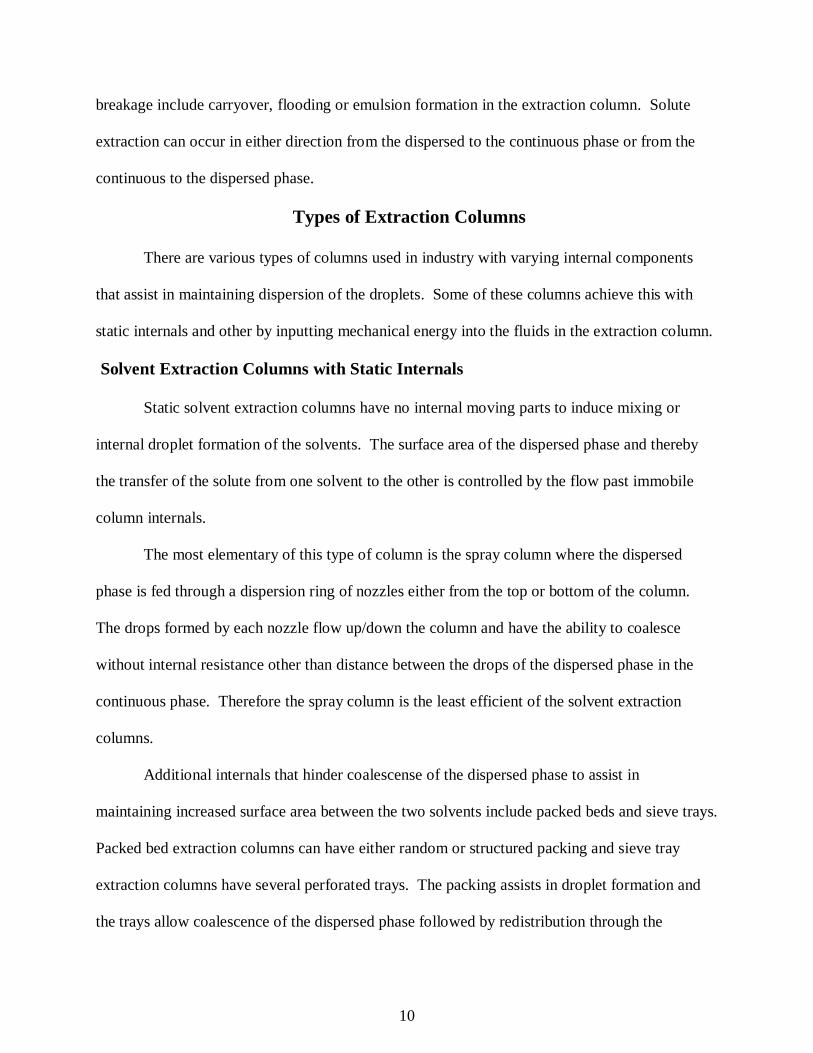
Additional internals that hinder coalescense of the dispersed phase to assist in
maintaining increased surface area between the two solvents include packed beds and sieve trays.
Packed bed extraction columns can have either random or structured packing and sieve tray
extraction columns have several perforated trays. The packing assists in droplet formation and
the trays allow coalescence of the dispersed phase followed by redistribution through the
11
perforations into the continuous phase[22]. An illustration of these three types of extraction
columns is shown in Figure 1-3.
Figure 1-3 Solvent Extraction Columns with Static Internals
Agitated Solvent Extraction Columns
Agitated solvent extraction columns incorporate a mechanically driven apparatus within
the column that agitates the liquids as they flow through the column. The purpose of the
agitation is to apply the necessary force to the dispersed phase causing breakage of droplets
thereby increasing interfacial surface area.
Pulse-packed columns are structure packed extraction columns that incorporate a pulse of
pressure in the liquid from the bottom of the column typically by utilizing a pump with wing
vessels and a rotary valve located in the bottom of the column. As the rotary valve opens and
closes the flow path into the column from the pump, the pulsation that occurs in the liquid assists
in droplet breakage of the dispersed phase within the packing.
12
Rotating disk contactor (RDC) extraction columns have a rotor shaft with mounted disks
that penetrate down the center of the column. Rotation of the shaft and disks serve to agitate the
liquid and thereby maintain droplet dispersion[23]. These RDC columns also contain baffles
called stators that allow regions along the walls of the column for phase separation between each
rotating disk contactor. Some major advantages to RDC extraction columns are the
minimization of axial mixing compared to non-agitated columns and these columns are less
prone to fouling and solids plugging the flow path.
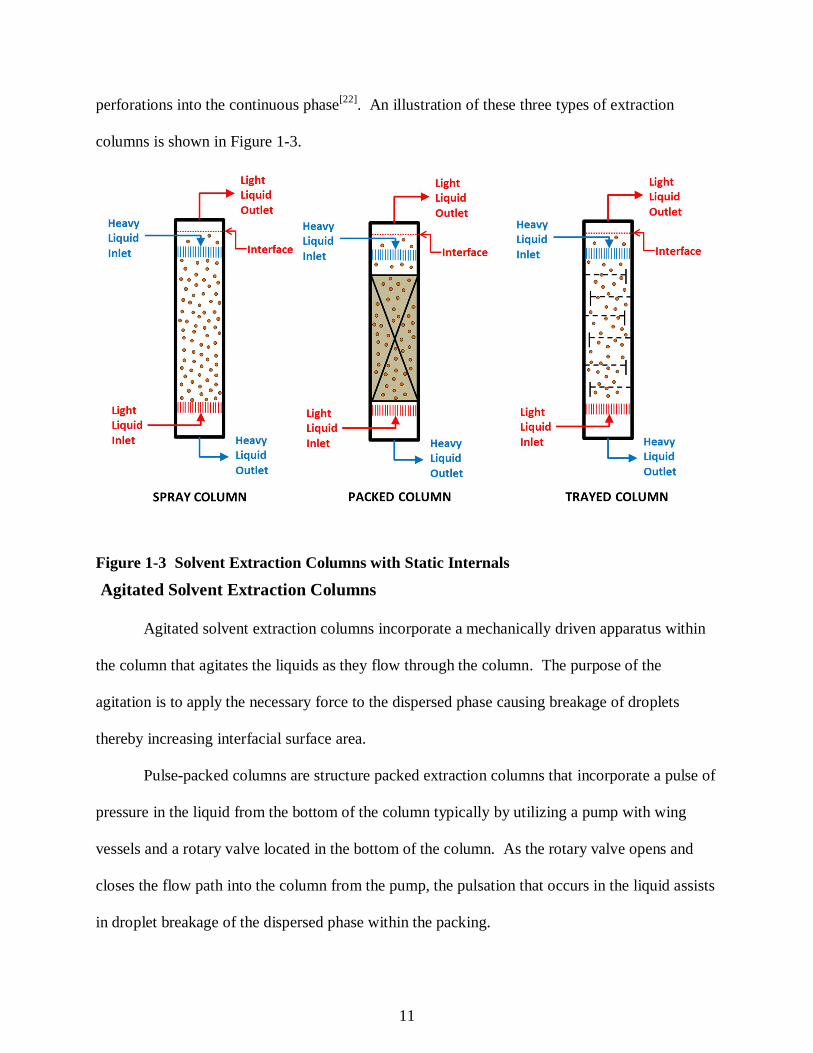
More advanced agitated columns include the Scheibel column and the Karr column. The
Scheibel column incorporates a rotating shaft with agitation paddles on the disks that mix the
liquids between two inner baffles and separation occurs in compartments with outer baffles and
in the screen mesh settling regions between the outer baffle sections[24]. A depiction of a section
of the Scheibel column between two of
the horizontal outer baffles is shown in
Figure 1-4. The Oldshue-Rushton
column is very similar to the Scheibel
column with the exception that the
Oldshue-Rushton column does not have
the inner baffles or the screen mesh
settling region[74].
The Karr column incorporates
a set of perforated plates and baffles mounted to a shaft in the column that moves up and down in
a piston-like motion within the column[25, 26]. Further modifications to the original RDC column
include the Kuhni, Modified RDC and Asymmetric RDC columns. The Kuhni column
Figure 1-4 Scheibel Column[24]

13
incorporates rotary disk contactors that have perforations in the disks with agitation disks spaced
and located between each contactor disk[27]. There are also modified RDC columns where only a
fraction of the disks in the RDC are perforated[28]. Asymmetrical RDC columns have the shaft
with the disk contactors asymmetric to the column and the column has a stator section typically
on the side of the column farthest from the shaft location. The stators are only located on
approximately a third of the column diameter[29, 30].
Each type of extraction column has its advantages and disadvantages[31]. The spray
columns are the least expensive option but they also provide the lowest efficiency extraction
capabilities. The packed bed columns are highly efficient however they are prone to fouling and
plugging caused by solids. The packing also reduces throughput and there is a potential for
channeling of the dispersed liquid through the column. Sieve tray columns allow for a sizeable
throughput, but similarly to the packed columns, they are prone to solids plugging the
perforations of the trays and potential for channeling flow. The pulse packed columns provide
good dispersion, improve efficiency two-fold, and have no internal mechanical parts. However
the pulse packed columns provide lower throughput and are more expensive than the non-
agitated columns. The rotating disk contactor columns deliver good dispersion with little axial
mixing, however any maintenance on the interior mechanical parts can require significant
process downtime.
RDC Extraction Columns
The rotating disk contactor columns were originally developed by the Royal Dutch/Shell
group in Amsterdam Laboratories in the 1950’s[32]. It is a mechanically driven extraction
column that is widely used in industry due to its efficiency in liquid-liquid systems with low
interfacial tension. The RDC column has a shaft that protrudes down the center of the column,
14
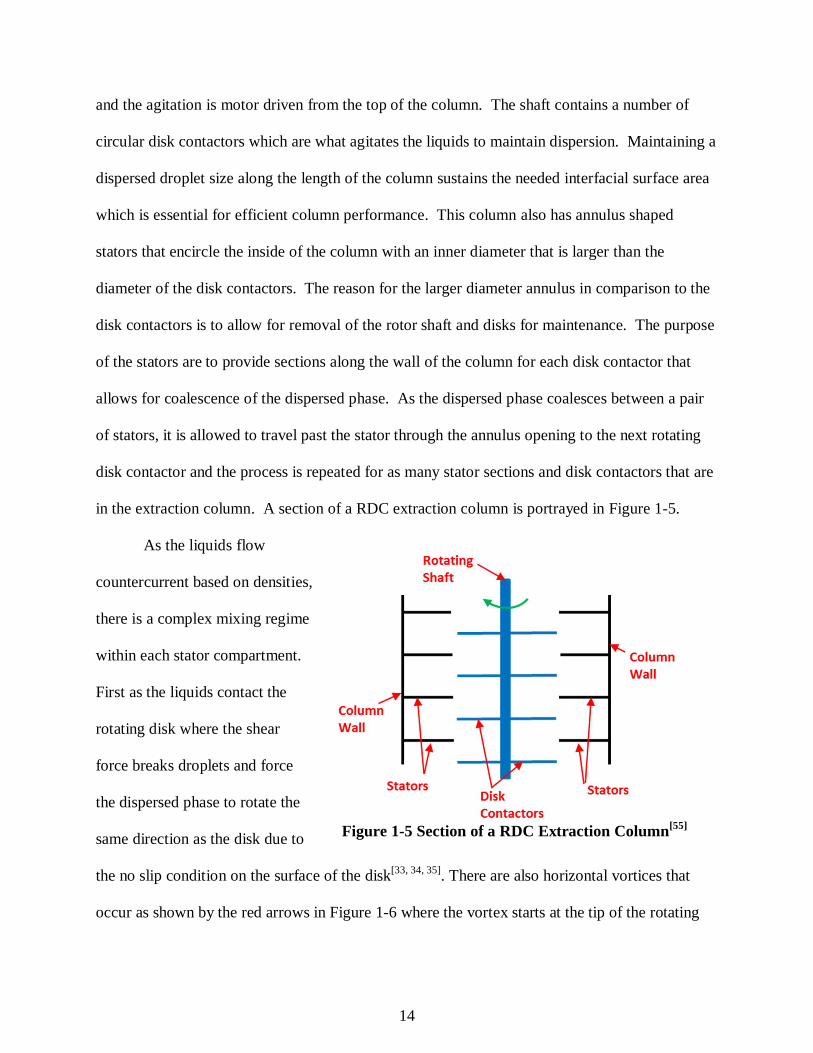
and the agitation is motor driven from the top of the column. The shaft contains a number of
circular disk contactors which are what agitates the liquids to maintain dispersion. Maintaining a
dispersed droplet size along the length of the column sustains the needed interfacial surface area
which is essential for efficient column performance. This column also has annulus shaped
stators that encircle the inside of the column with an inner diameter that is larger than the
diameter of the disk contactors. The reason for the larger diameter annulus in comparison to the
disk contactors is to allow for removal of the rotor shaft and disks for maintenance. The purpose
of the stators are to provide sections along the wall of the column for each disk contactor that
allows for coalescence of the dispersed phase. As the dispersed phase coalesces between a pair
of stators, it is allowed to travel past the stator through the annulus opening to the next rotating
disk contactor and the process is repeated for as many stator sections and disk contactors that are
in the extraction column. A section of a RDC extraction column is portrayed in Figure 1-5.
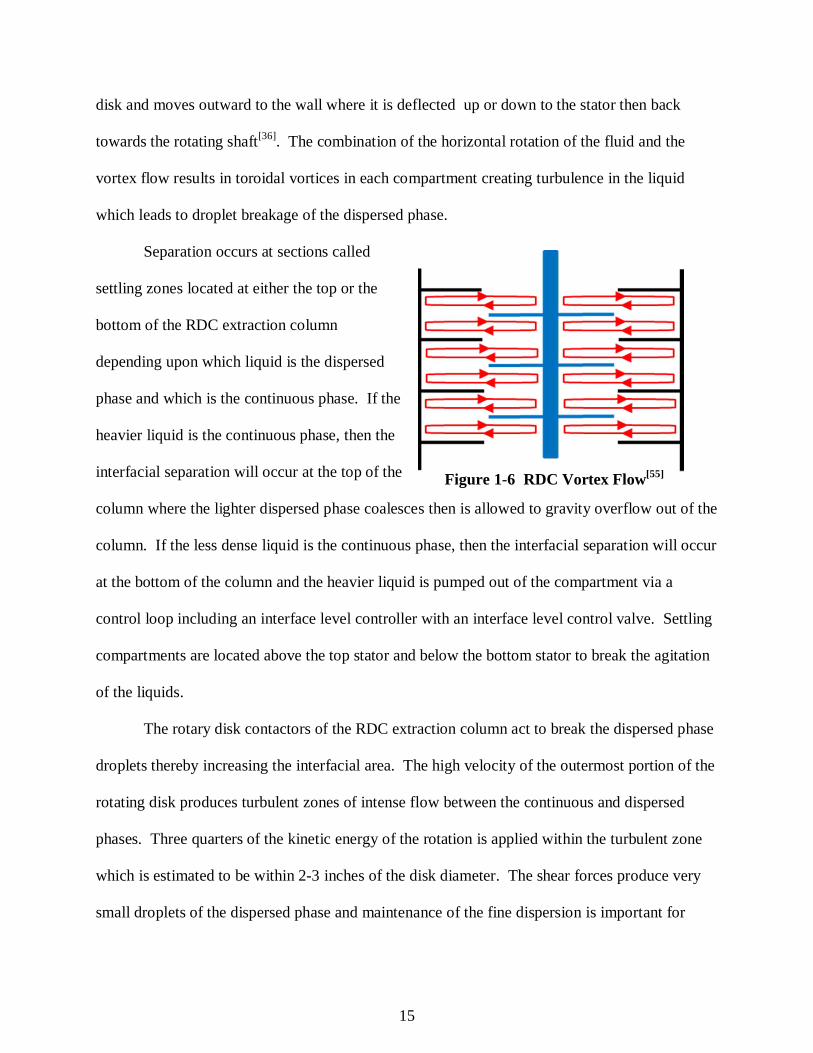
As the liquids flow
countercurrent based on densities,
there is a complex mixing regime
within each stator compartment.
First as the liquids contact the
rotating disk where the shear
force breaks droplets and force
the dispersed phase to rotate the
same direction as the disk due to
the no slip condition on the surface of the disk[33, 34, 35]. There are also horizontal vortices that
occur as shown by the red arrows in Figure 1-6 where the vortex starts at the tip of the rotating
Figure 1-5 Section of a RDC Extraction Column[55]
15
disk and moves outward to the wall where it is deflected up or down to the stator then back
towards the rotating shaft[36]. The combination of the horizontal rotation of the fluid and the
vortex flow results in toroidal vortices in each compartment creating turbulence in the liquid
which leads to droplet breakage of the dispersed phase.
Separation occurs at sections called
settling zones located at either the top or the
bottom of the RDC extraction column
depending upon which liquid is the dispersed
phase and which is the continuous phase. If the
heavier liquid is the continuous phase, then the
interfacial separation will occur at the top of the
column where the lighter dispersed phase coalesces then is allowed to gravity overflow out of the
column. If the less dense liquid is the continuous phase, then the interfacial separation will occur
at the bottom of the column and the heavier liquid is pumped out of the compartment via a
control loop including an interface level controller with an interface level control valve. Settling
compartments are located above the top stator and below the bottom stator to break the agitation
of the liquids.
The rotary disk contactors of the RDC extraction column act to break the dispersed phase
droplets thereby increasing the interfacial area. The high velocity of the outermost portion of the
rotating disk produces turbulent zones of intense flow between the continuous and dispersed
phases. Three quarters of the kinetic energy of the rotation is applied within the turbulent zone
which is estimated to be within 2-3 inches of the disk diameter. The shear forces produce very
small droplets of the dispersed phase and maintenance of the fine dispersion is important for
Figure 1-6 RDC Vortex Flow[55]
16
providing large interfacial area for solute diffusion. The rotating disks provide enough energy to
the dispersed phase to break the droplets into smaller droplets thereby increasing surface area
and increasing the free energy of the system.
Rotor Speed
An important factor to consider for solvent extraction for rotating disk contactor
extraction columns is the range of agitation at which solute transfer is maximized while
carryover, holdup and axial mixing are minimized. If the droplets are broken into such small
droplets by the agitation and the flowrate does not allow the residence time required for full
coalescence of the dispersed phase, then carryover of the dispersed phase in the continuous phase
can occur. This can be very problematic if the next step in the purification train after the RDC
extraction column is negatively affected by the liquid carried over. These problems can include
reduced extraction efficiency in another extraction column in series, fouling of the internals of
the equipment in the next process step, or even formation of an extremely slow separating
emulsion in the next purification step.
For RDC extraction columns, energy is input into the liquids via the rotating disks, and
rotor speed is proportional to the energy delivered to the extraction column media. Each
flowrate in an RDC extraction column has a characteristic rotor speed that produces the highest
extraction efficiency while exceeding or undershooting this rotor speed can result in one or more
complications with the extraction. Axial mixing is back mixing of either the continuous or
dispersed phases in the extraction column which reduces the driving force of mass transfer and
therefore reduces extraction efficiency. Hold up, flooding and axial mixing in an extraction
column are where the dispersed phase stays dispersed in the column to a point where it remains
in the column much longer than expected and there is potential for two different interfacial
17
separations to occur in the separation compartments at the top and the bottom of the column.
Carryover, axial mixing and holdup are typical problems incurred when the rotor speed is too
high[37]. Poor extraction efficiency is prominent when the rotor speed is too low, therefore rotor
speed is very important for efficient extraction of the solute.
The upper and lower critical rotor speeds are generated based on the probability of
droplet breakage of the dispersed phase. The upper critical rotor speed correlates to a droplet
breakage probability of 1 and the lower critical rotor speed is for a probability of 0. Equation 1-
15 was developed to determine the lower critical speed for any liquid-liquid system and for any
column geometry[38].
Equation 1-15
= 25
.
This equation was further modified to obtain the relationship shown in Equation 1-16 for
the upper critical rotor speed[39].
Equation 1-16
= 9
.
The lower critical rotor speed represents the rotor speed where drop breakage begins to
occur, and any rotor speed lower than this critical speed has a probability of zero for breaking
droplets of a specific size. The upper critical rotor speed is the point where the probability for
breaking droplets of a specific size equals 1. It can be expected that running the rotor speed
below the lower critical speed, extraction efficiency will be poor.
18
Bahmanyar and Slater proposed the correlation in Equation 1-17 where drop size was
introduced into the rotor speed equation[40]. They utilized a simplified balance of shear force
arising from a generalized velocity gradient and the resisting force due to interfacial tension.
Equation 1-17
= (3.856 × 10 ). .
= (3.856 × 10 )( ) . ( ) .
The characteristic velocity of the dispersed phase droplets remains constant up to a
certain rotor speed, and it then decreased with further increases in rotor speed as seen in
Equation 1-18[41, 42].
Equation 1-18
=. . .
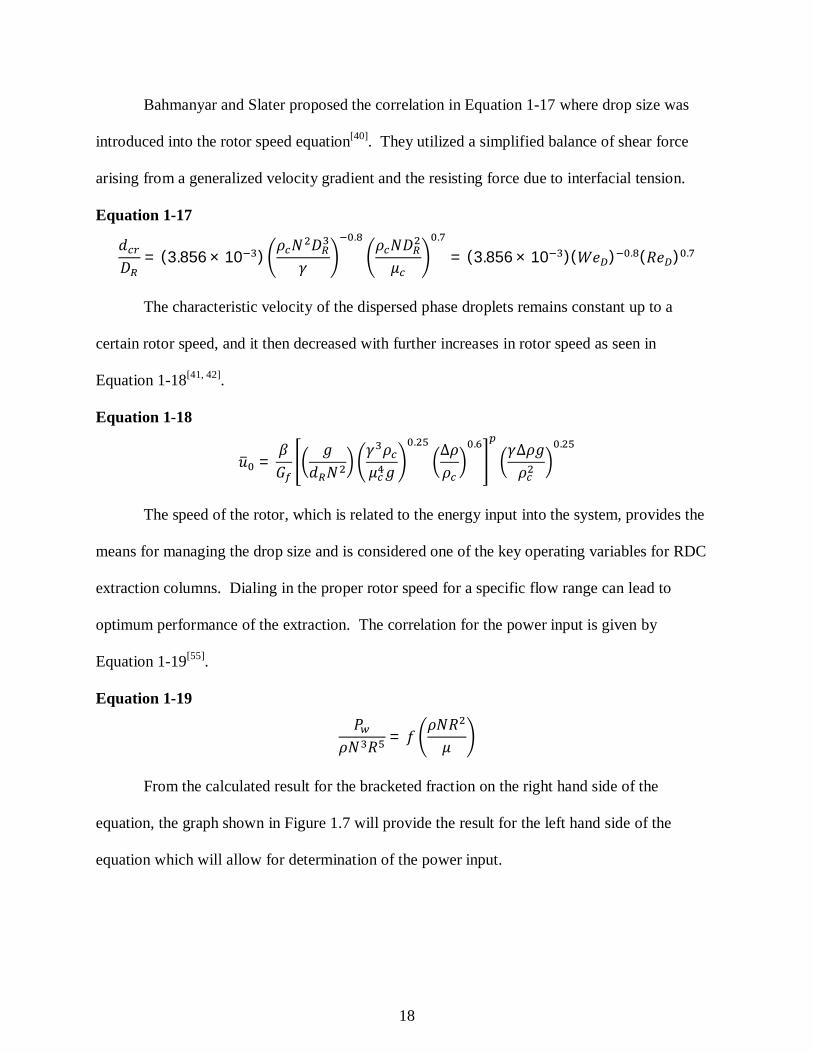
The speed of the rotor, which is related to the energy input into the system, provides the
means for managing the drop size and is considered one of the key operating variables for RDC
extraction columns. Dialing in the proper rotor speed for a specific flow range can lead to
optimum performance of the extraction. The correlation for the power input is given by
Equation 1-19[55].
Equation 1-19
=
From the calculated result for the bracketed fraction on the right hand side of the
equation, the graph shown in Figure 1.7 will provide the result for the left hand side of the
equation which will allow for determination of the power input.
19
Figure 1-7 Power Input per Rotor Disk[55]
Typically RDC extraction columns are operated at ranges above 2 × 10 for the
bracketed fraction on the right hand side of the equation because in this region, the left hand side
of the equation becomes constant. The power input per unit mass is proportional to the specific
power input shown in Equation 1-20 which is typically used to correlate RDC extraction column
performance.
Equation 1-20
20
Rotor Speed Curves
Developing rotor speed curves for an RDC extraction column is dependent upon the
dispersed phase holdup in the column. The amount of dispersed phase holdup is a function of
the superficial velocities of the continuous and dispersed phases within the column. Dispersed
phase holdup is a phenomena where the velocity of the continuous phase impedes the counter-
current flow of the dispersed phase and thereby increases the residence time and overall volume
fraction of the dispersed phase in the column. Phase inversion can occur when the volume of the
dispersed phase exceeds the volume of the continuous phase thereby reversing the roles where
the continuous phase becomes a pseudo-dispersed phase and vice versa. This typically occurs at
what is known as the flooding point. Rotor speed curves are generated by determining the rotor
speed at a given feed and solvent flowrate that affords a percentage of the holdup at flooding of
the dispersed phase. Typically the ideal operating range of rotor speeds fall within 75% to 85%
of the dispersed phase holdup at flooding.
Theoretical Stages of Extraction for RDC extractors
The height of a theoretical stage for extraction columns is dependent on the type of
extraction column. The height of a theoretical stage of an RDC extraction column depends on
phase velocities, droplet size, axial mixing and rotor speed. The theoretical stages are also
dependent upon fluid characteristics such as interfacial tension and the partition coefficient of the
solute. Higher rotor speeds afford more achieved equilibrium stages and therefore running closer
to the holdup at flooding curve achieves more actual equilibrium stages and hence more efficient
extraction.
21
RDC Extraction Columns Under Investigation
Process Flow Diagram
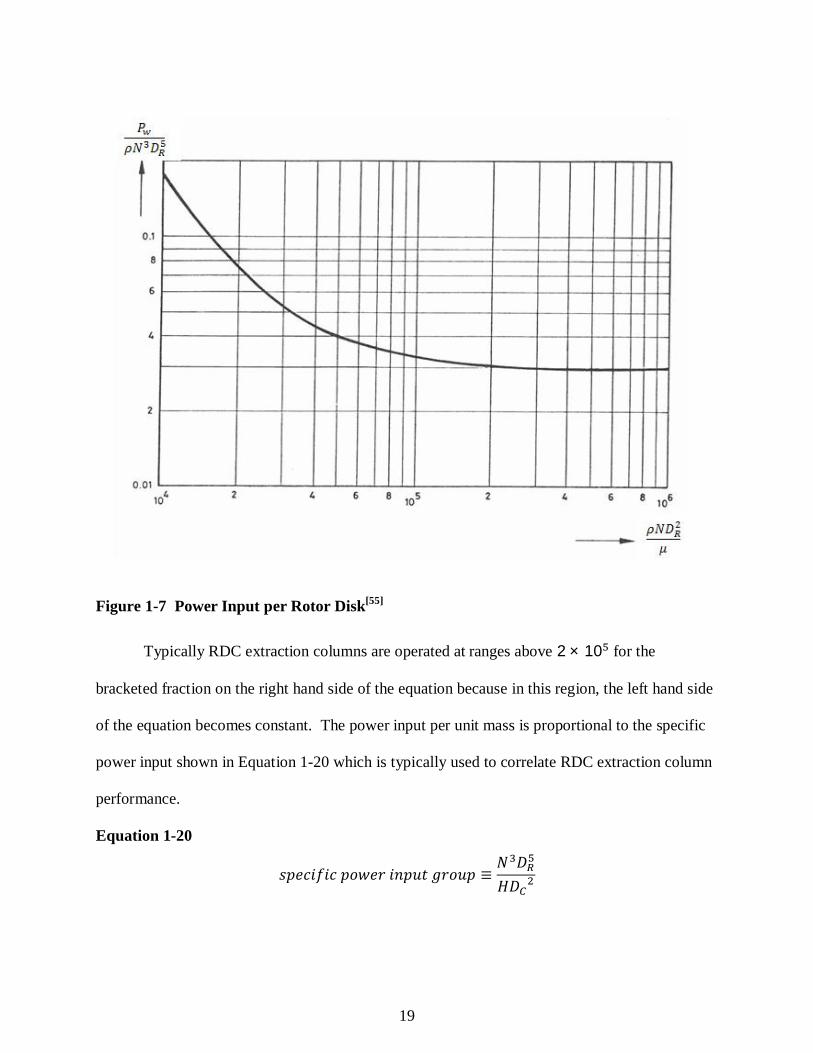
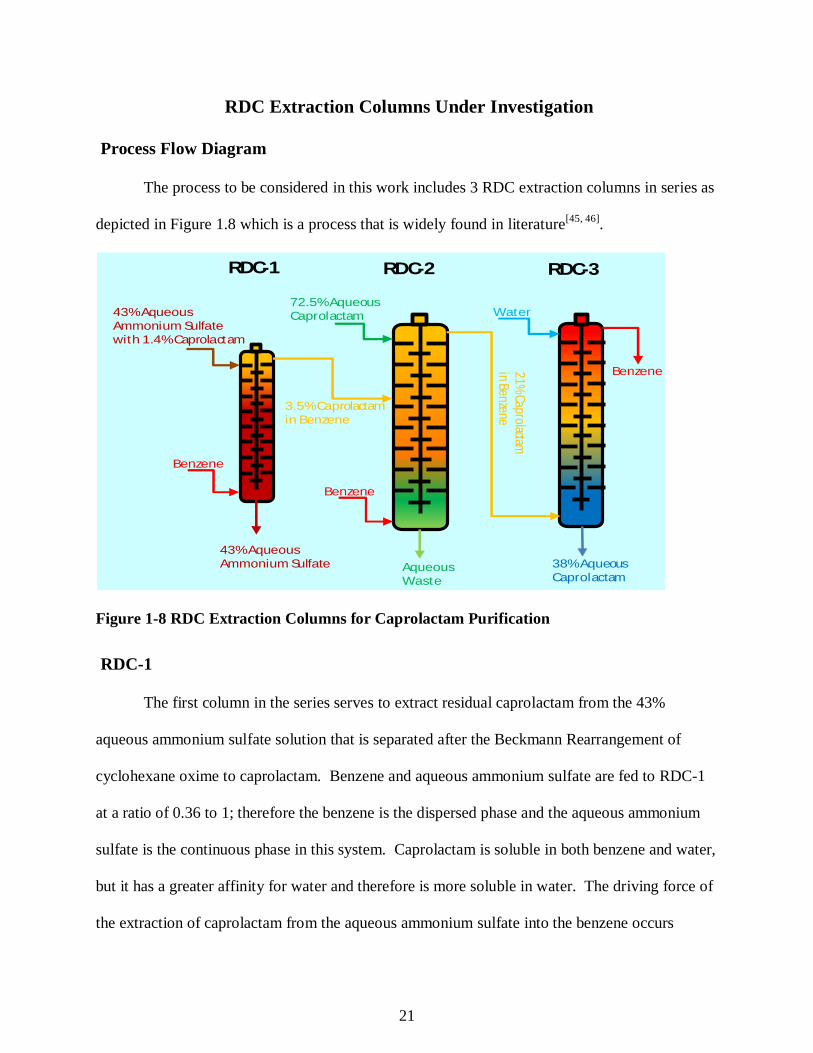
The process to be considered in this work includes 3 RDC extraction columns in series as
depicted in Figure 1.8 which is a process that is widely found in literature[45, 46].
Figure 1-8 RDC Extraction Columns for Caprolactam Purification
RDC-1
The first column in the series serves to extract residual caprolactam from the 43%
aqueous ammonium sulfate solution that is separated after the Beckmann Rearrangement of
cyclohexane oxime to caprolactam. Benzene and aqueous ammonium sulfate are fed to RDC-1
at a ratio of 0.36 to 1; therefore the benzene is the dispersed phase and the aqueous ammonium
sulfate is the continuous phase in this system. Caprolactam is soluble in both benzene and water,
but it has a greater affinity for water and therefore is more soluble in water. The driving force of
the extraction of caprolactam from the aqueous ammonium sulfate into the benzene occurs
43% Aqueous Ammonium Sulfatewith 1.4% Caprolactam
43% Aqueous Ammonium Sulfate
RDC-1 RDC-2 RDC-3
72.5% Aqueous Caprolactam
Aqueous Waste
Benzene
Benzene
Benzene
Water
38% Aqueous Caprolactam
3.5% Caprolactamin Benzene
21% Caprolactamin Benzene
22
because the water is nearly saturated with ammonium sulfate and the ammonium sulfate is not
soluble in benzene. If the concentration of ammonium sulfate in the aqueous phase drops, then
more caprolactam will exit the column in the aqueous stream. The separation interface for this
column is located at the top section of the column. The resulting 3.7% caprolactam in benzene
overflows from RDC-1 into the top third of RDC-2.
RDC-2
The second column in the series functions to extract caprolactam from the crude
Beckmann Rearrangement 72.5% caprolactam in water solution into benzene. Most aqueous
soluble impurities remain in the waste water stream exiting the bottom of the extraction column,
however some caprolactam, approximately 0.5%, remains in the stream as well. The feed to
RDC-2 consists of 72.5% caprolactam in water at a 1:2.3 ratio to benzene. The column also has
3.7% caprolactam in benzene entering the top third of the column from the overflow of RDC-1.
In RDC-2 the benzene is the continuous phase and the aqueous stream is the dispersed phase.
The interface is controlled at the bottom section of the column. The driving force to extract the
caprolactam is the excessive amount of benzene to water which is roughly 10:1 considering the
amount of water in the aqueous caprolactam feed and the incoming caprolactam/benzene
solution from the first column. Therefore the benzene is the continuous phase and the aqueous
stream is the dispersed phase.
RDC-3
The third column in the series is considered a back-extraction. RDC-3 uses the higher
affinity between caprolactam and water to extract the caprolactam back into an aqueous stream
from the organic, benzene stream. Water is fed to RDC-3 at a 0.4:1 ratio to the 21% caprolactam
in benzene. The benzene exiting this column is in a loop that feeds RDC-1 and RDC-2 so if the
23
caprolactam concentration in the benzene exiting RDC-3 increases, the extraction efficiency of
the first two columns suffers. The amount of caprolactam in the benzene overflow from RDC-3
is typically less than 0.1%. Water feed temperature has an effect on extraction efficiency in
RDC-3. As the temperature increases, more caprolactam is carried over in the benzene as higher
temperatures tend to reduce the hydrogen bonding capabilities of the caprolactam and water
molecules. The benzene serves to remove organic impurities that have less solubility in water
from the caprolactam, and the benzene loop has a “kidney loop” stripper to help maintain purity
of the benzene. In RDC-3, the benzene is the continuous phase and the aqueous stream is the
dispersed phase. The interface in RDC-3 is controlled at the bottom of the column.
Proposed Work
The purpose of this work is to first determine the rotor speed curves for each of the RDC
extraction columns for 100%, 85% and 75% of dispersed phase holdup at flooding. Then to
calculate the number of theoretical stages achieved in each of the RDC extraction columns. The
resulting rotor speeds will then be compared to the correlations discussed above concerning the
upper and lower critical rotor speeds for comparison to droplet breakage probability.
The number of theoretical stages achieved at each rotor speed up to the rotor speed at
85% of dispersed phase holdup at flooding will be calculated. This will provide a better
understanding of the effect on extraction of slower rotor speeds.
This work will include a literature and research review on the numerous solvent
alternatives to benzene in caprolactam purification as well as potential drawbacks for each
alternative solvent.
24
Chapter 2 - Rotor Speed
Effect of Rotor Speed
As the disks on the shaft of an RDC extraction column rotate, toroidal vortices within
each stator compartment causes turbulence which in effect breaks up droplets of the dispersed
phase. Increased breakage of droplets leads to increased surface area which in turn improves the
efficiency of the solute transfer between solvents. RDC performance is highly dependent upon
the geometry of the column and the speed at which the disks rotate. The rotor speed is
proportional to the energy that is input into the system, however a disproportionate energy input
can lead to excessive droplet breakage that in turn causes dispersed phase flooding in the
extraction column.
Development of rotor speed curves for RDC extraction columns is based on the
characteristic flooding curves. The flooding curves provide a theoretical correlation of desired
rotor speeds as a function of the extraction column loading. These desired rotor speeds fall
within a range that are based on a percentage of the amount of dispersed phase holdup that
occurs at the point of flooding. The maximum throughput of an RDC extraction column is
calculated by estimating the mean droplet size and the maximum superficial velocity of the
continuous phase subsequently. The resulting curves estimate theoretical rotor speeds that
should be evaluated with plant testing to ensure validity. The range from 75% to 85% of the
holdup that is achieved at flooding for each rotor speed is the target range for ideal rotor speeds
to maximize extraction efficiency while minimizing the potential for column flooding.
Mean Droplet Diameter
Correlations for predicting the average drop size of the dispersed phase in RDC
extraction columns were generated by Kumar and Hartland[47]. The mean droplet diameter is
25
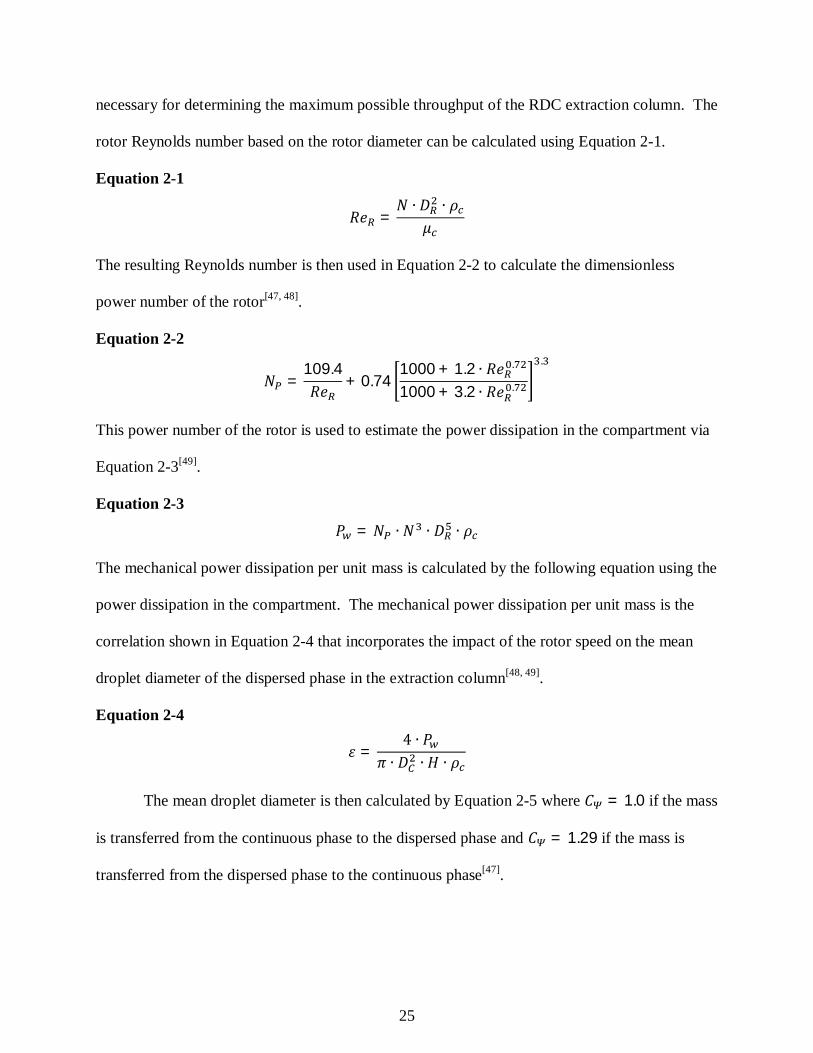
necessary for determining the maximum possible throughput of the RDC extraction column. The
rotor Reynolds number based on the rotor diameter can be calculated using Equation 2-1.
Equation 2-1
=
The resulting Reynolds number is then used in Equation 2-2 to calculate the dimensionless
power number of the rotor[47, 48].
Equation 2-2
=109.4
+ 0.741000 + 1.2 .
1000 + 3.2 .
.
This power number of the rotor is used to estimate the power dissipation in the compartment via
Equation 2-3[49].
Equation 2-3
=
The mechanical power dissipation per unit mass is calculated by the following equation using the
power dissipation in the compartment. The mechanical power dissipation per unit mass is the
correlation shown in Equation 2-4 that incorporates the impact of the rotor speed on the mean
droplet diameter of the dispersed phase in the extraction column[48, 49].
Equation 2-4
=
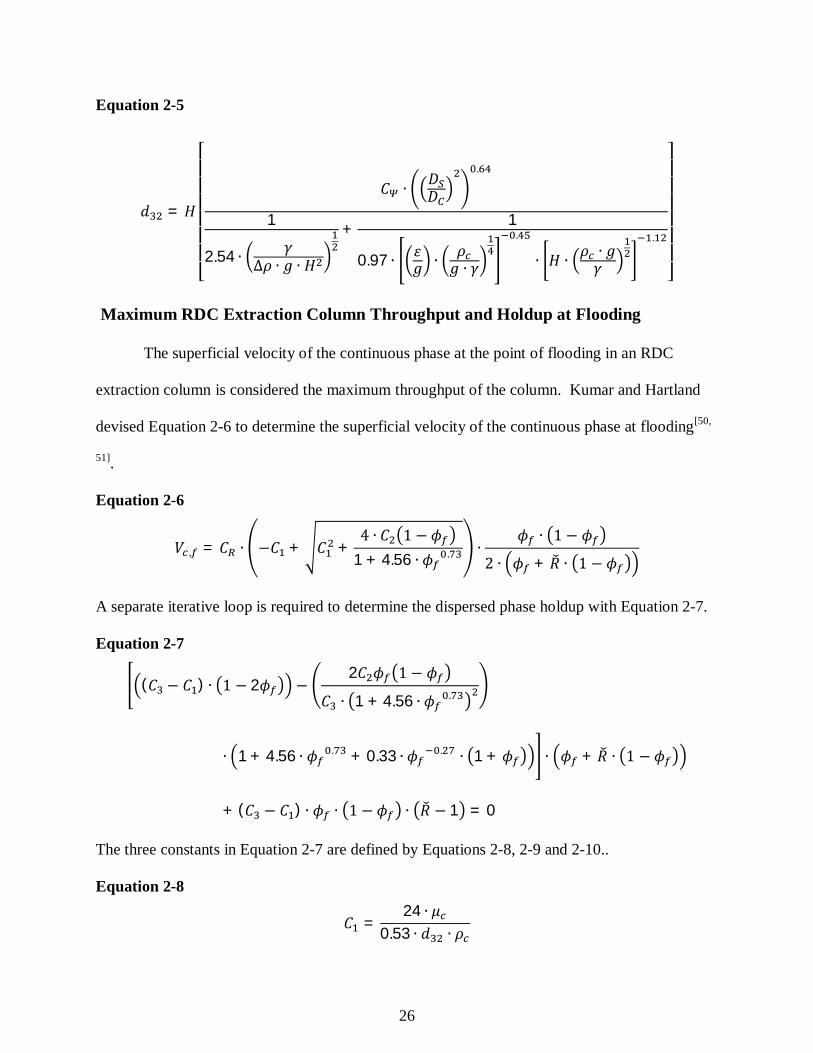
The mean droplet diameter is then calculated by Equation 2-5 where = 1.0 if the mass
is transferred from the continuous phase to the dispersed phase and = 1.29 if the mass is
transferred from the dispersed phase to the continuous phase[47].
26
Equation 2-5
=
.
1
2.54
+ 1
0.97
. .
Maximum RDC Extraction Column Throughput and Holdup at Flooding
The superficial velocity of the continuous phase at the point of flooding in an RDC
extraction column is considered the maximum throughput of the column. Kumar and Hartland
devised Equation 2-6 to determine the superficial velocity of the continuous phase at flooding[50,
51].
Equation 2-6
, = + +1 + 4.56 .
+
A separate iterative loop is required to determine the dispersed phase holdup with Equation 2-7.
Equation 2-7
( ) 22
1 + 4.56 .
1 + 4.56 . + 0.33 . 1 + +
+ ( ) 1 = 0
The three constants in Equation 2-7 are defined by Equations 2-8, 2-9 and 2-10..
Equation 2-8
=24
0.53
27
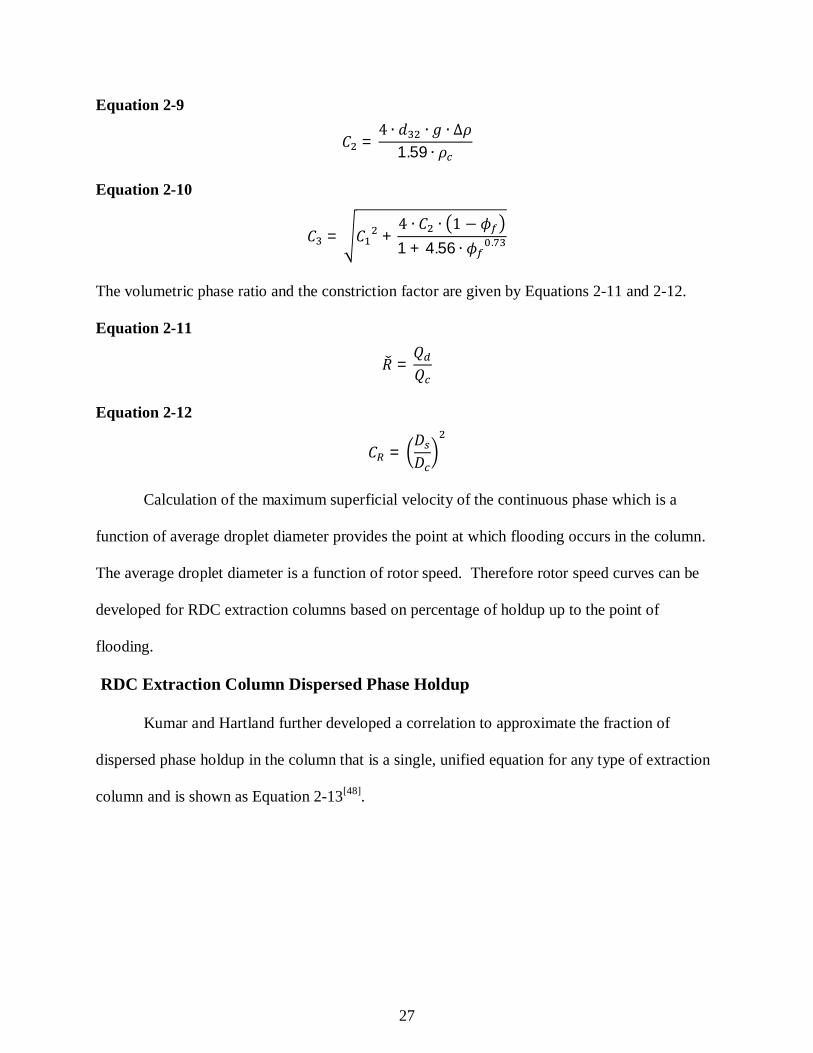
Equation 2-9
= 1.59
Equation 2-10
= +1 + 4.56 .
The volumetric phase ratio and the constriction factor are given by Equations 2-11 and 2-12.
Equation 2-11
=
Equation 2-12
=
Calculation of the maximum superficial velocity of the continuous phase which is a
function of average droplet diameter provides the point at which flooding occurs in the column.
The average droplet diameter is a function of rotor speed. Therefore rotor speed curves can be
developed for RDC extraction columns based on percentage of holdup up to the point of
flooding.
RDC Extraction Column Dispersed Phase Holdup
Kumar and Hartland further developed a correlation to approximate the fraction of
dispersed phase holdup in the column that is a single, unified equation for any type of extraction
column and is shown as Equation 2-13[48].
28
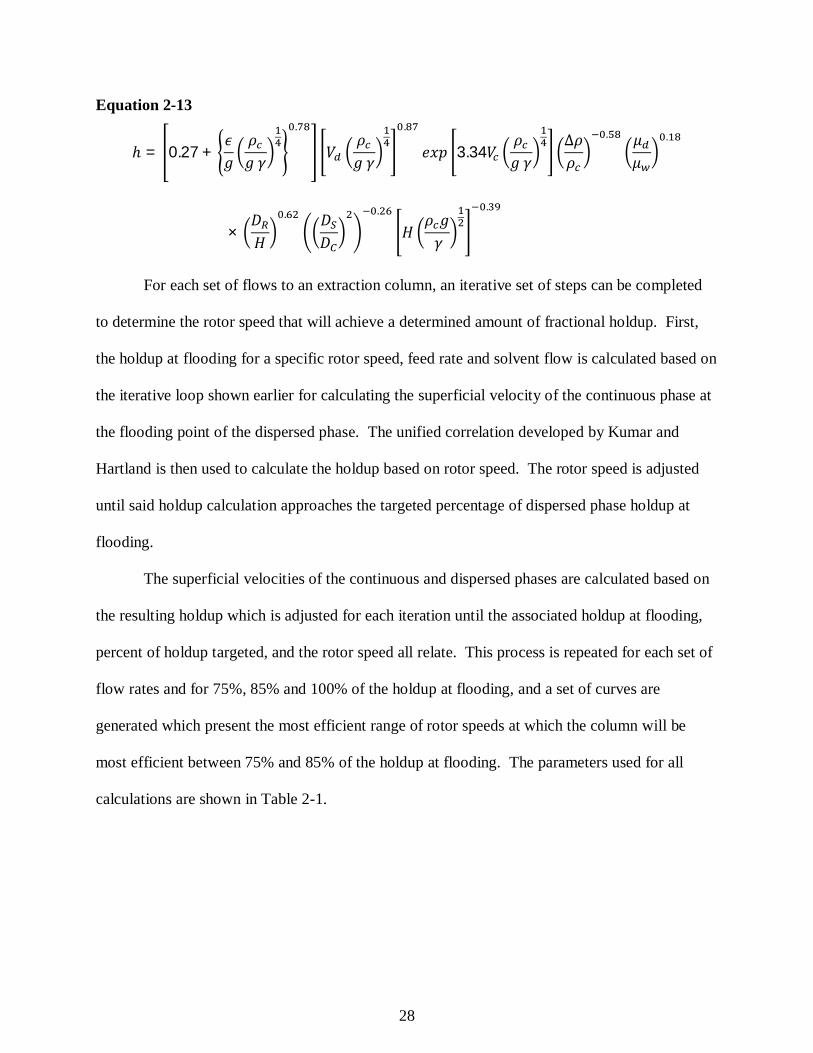
Equation 2-13
= 0.27 +
. .
3.34. .
×. . .
For each set of flows to an extraction column, an iterative set of steps can be completed
to determine the rotor speed that will achieve a determined amount of fractional holdup. First,
the holdup at flooding for a specific rotor speed, feed rate and solvent flow is calculated based on
the iterative loop shown earlier for calculating the superficial velocity of the continuous phase at
the flooding point of the dispersed phase. The unified correlation developed by Kumar and
Hartland is then used to calculate the holdup based on rotor speed. The rotor speed is adjusted
until said holdup calculation approaches the targeted percentage of dispersed phase holdup at
flooding.
The superficial velocities of the continuous and dispersed phases are calculated based on
the resulting holdup which is adjusted for each iteration until the associated holdup at flooding,
percent of holdup targeted, and the rotor speed all relate. This process is repeated for each set of
flow rates and for 75%, 85% and 100% of the holdup at flooding, and a set of curves are
generated which present the most efficient range of rotor speeds at which the column will be
most efficient between 75% and 85% of the holdup at flooding. The parameters used for all
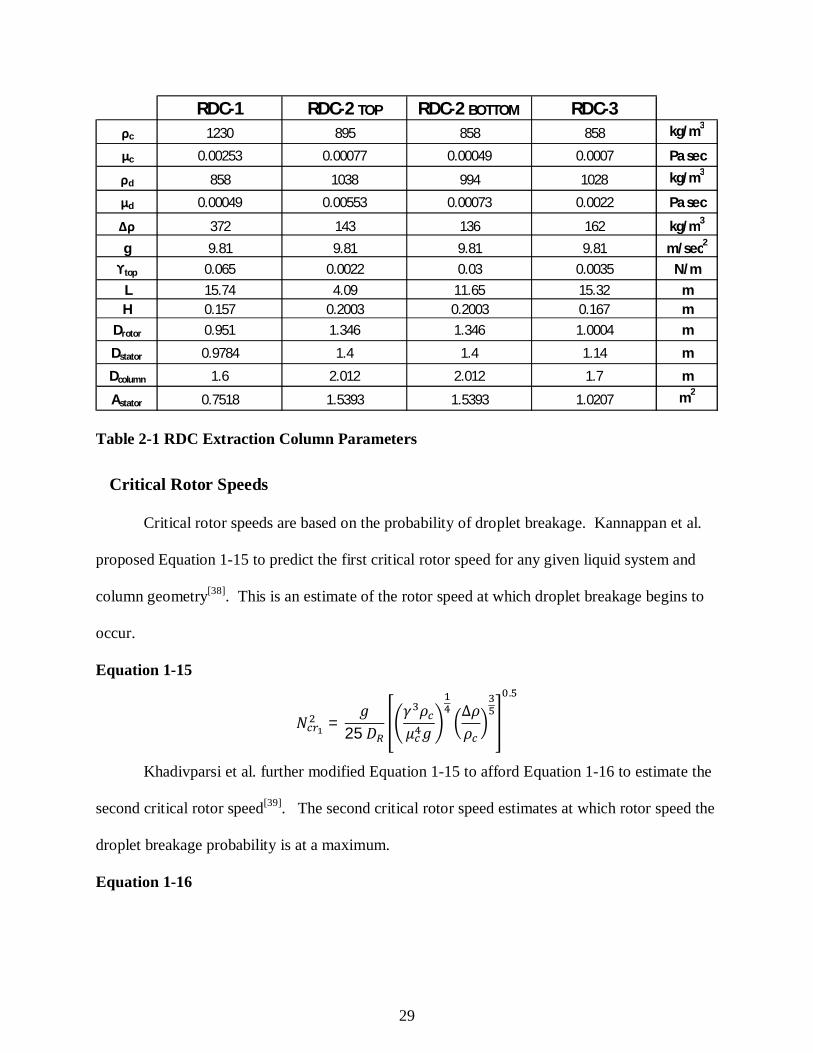
calculations are shown in Table 2-1.
29
Table 2-1 RDC Extraction Column Parameters
Critical Rotor Speeds
Critical rotor speeds are based on the probability of droplet breakage. Kannappan et al.
proposed Equation 1-15 to predict the first critical rotor speed for any given liquid system and
column geometry[38]. This is an estimate of the rotor speed at which droplet breakage begins to
occur.
Equation 1-15
= 25
.
Khadivparsi et al. further modified Equation 1-15 to afford Equation 1-16 to estimate the
second critical rotor speed[39]. The second critical rotor speed estimates at which rotor speed the
droplet breakage probability is at a maximum.
Equation 1-16
RDC-1 RDC-2 TOP RDC-2 BOTTOM RDC-3c 1230 895 858 858 kg/m3
c 0.00253 0.00077 0.00049 0.0007 Pa sec
d 858 1038 994 1028 kg/m3
d 0.00049 0.00553 0.00073 0.0022 Pa sec
372 143 136 162 kg/m3
g 9.81 9.81 9.81 9.81 m/sec2
top 0.065 0.0022 0.03 0.0035 N/mL 15.74 4.09 11.65 15.32 mH 0.157 0.2003 0.2003 0.167 m
Drotor 0.951 1.346 1.346 1.0004 m
Dstator 0.9784 1.4 1.4 1.14 m
Dcolumn 1.6 2.012 2.012 1.7 m
Astator 0.7518 1.5393 1.5393 1.0207 m2
30
= 9
.
Niasar and Bahmanyar have further modified Equations 1-15 and 1-16 for the first and
second critical rotor speeds with accountancy for the critical droplet size and the continuous
phase height to afford Equation 2-14 and 2-15[52].
Equation 2-14
= 0.56 ×.
2 . . . ..
Equation 2-15
= 1.05 ×.
2 . . . .. + 4.23
Calculations of the critical rotor speeds for each of the extraction columns are completed
for comparison to the rotor speed curves generated based on dispersed phase holdup.
RDC-1
Mean Droplet Diameter, Reynolds Number and Power Dissipation for RDC-1
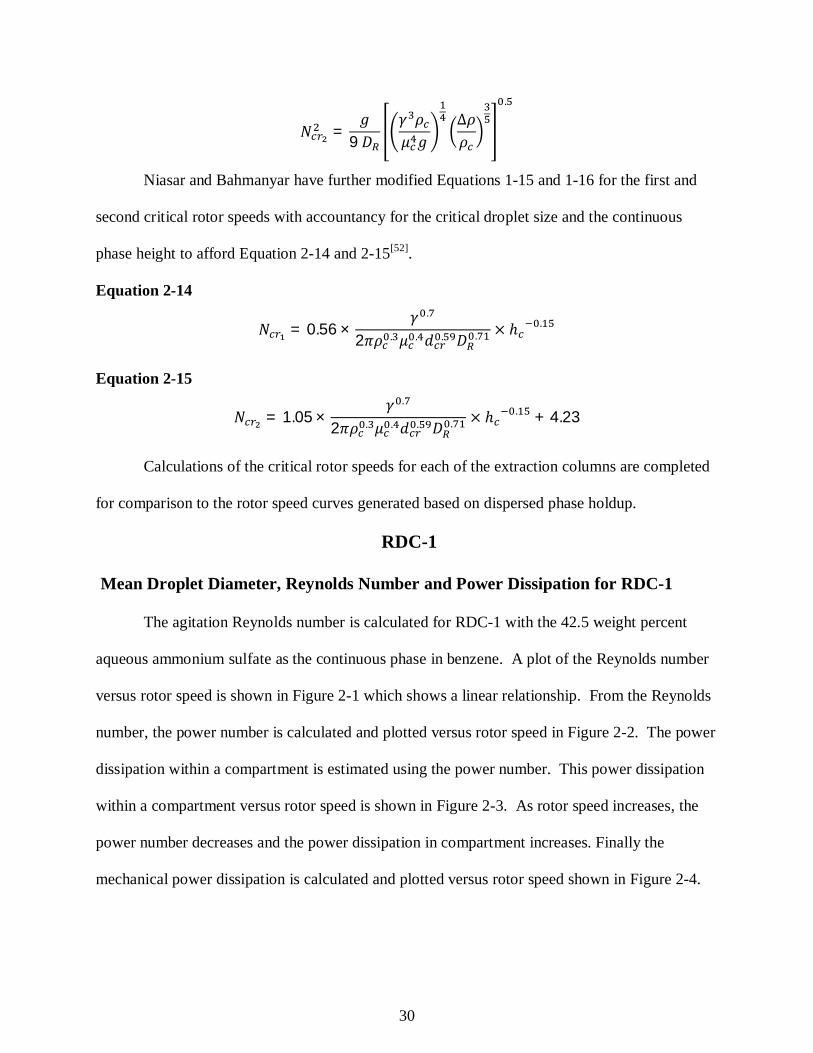
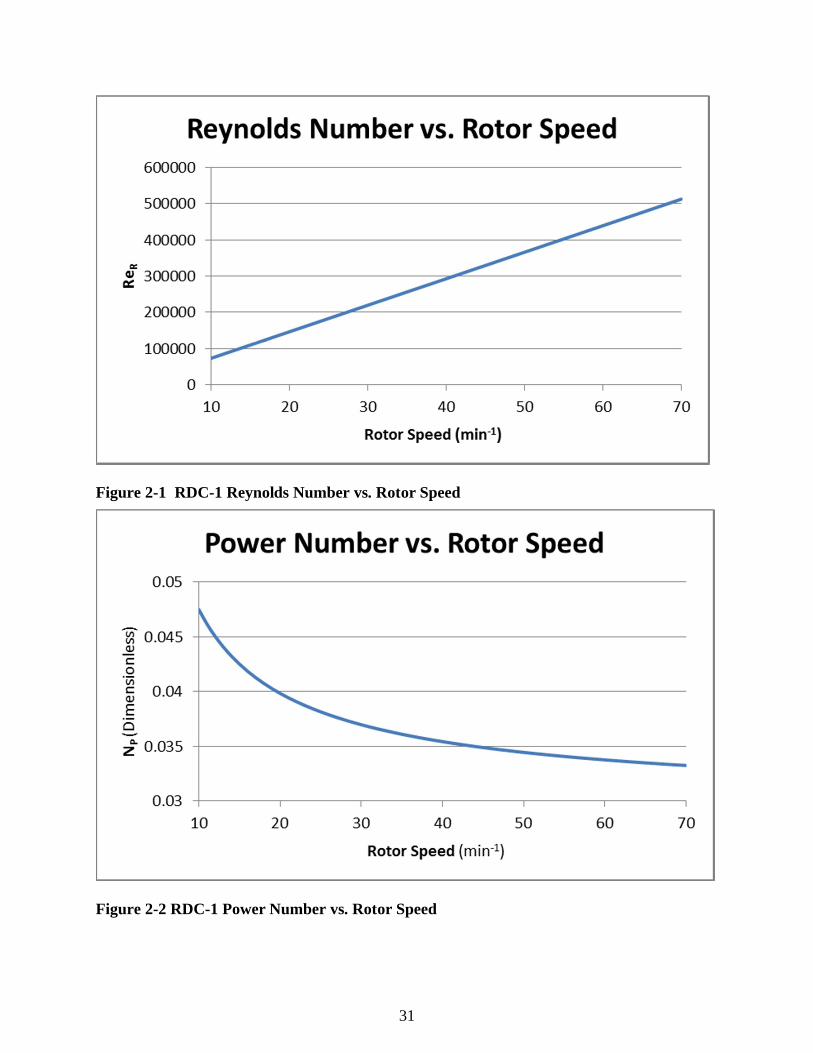
The agitation Reynolds number is calculated for RDC-1 with the 42.5 weight percent
aqueous ammonium sulfate as the continuous phase in benzene. A plot of the Reynolds number
versus rotor speed is shown in Figure 2-1 which shows a linear relationship. From the Reynolds
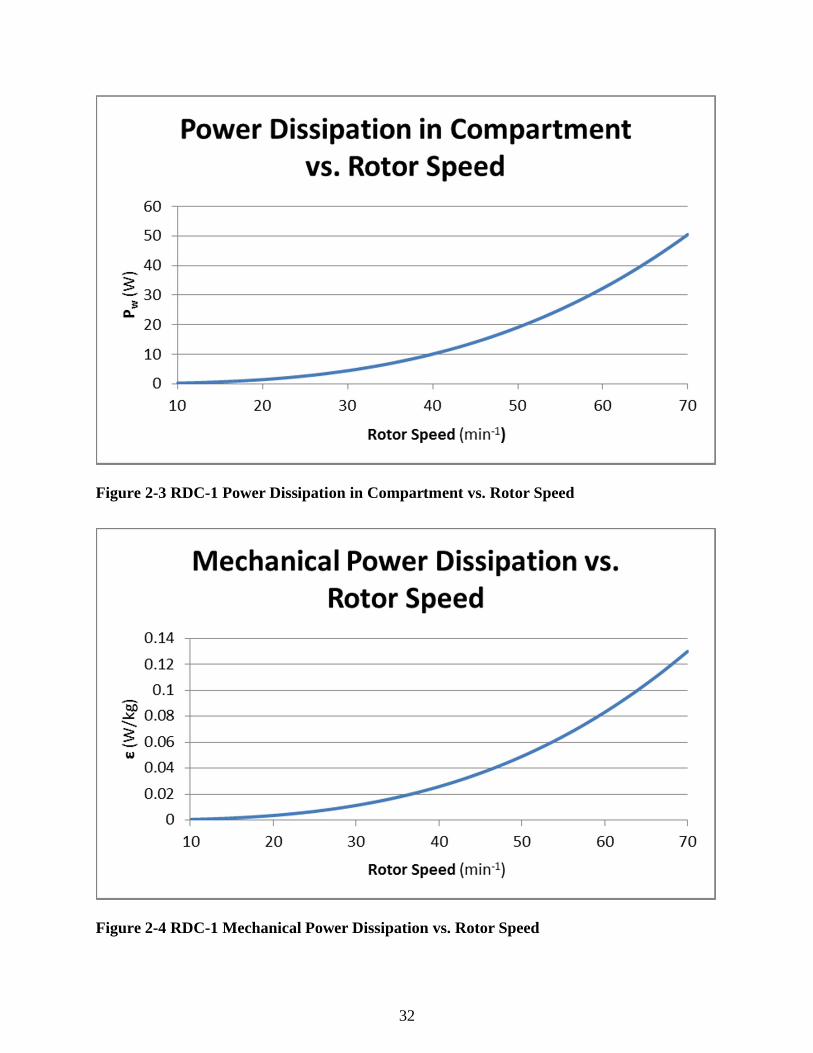
number, the power number is calculated and plotted versus rotor speed in Figure 2-2. The power
dissipation within a compartment is estimated using the power number. This power dissipation
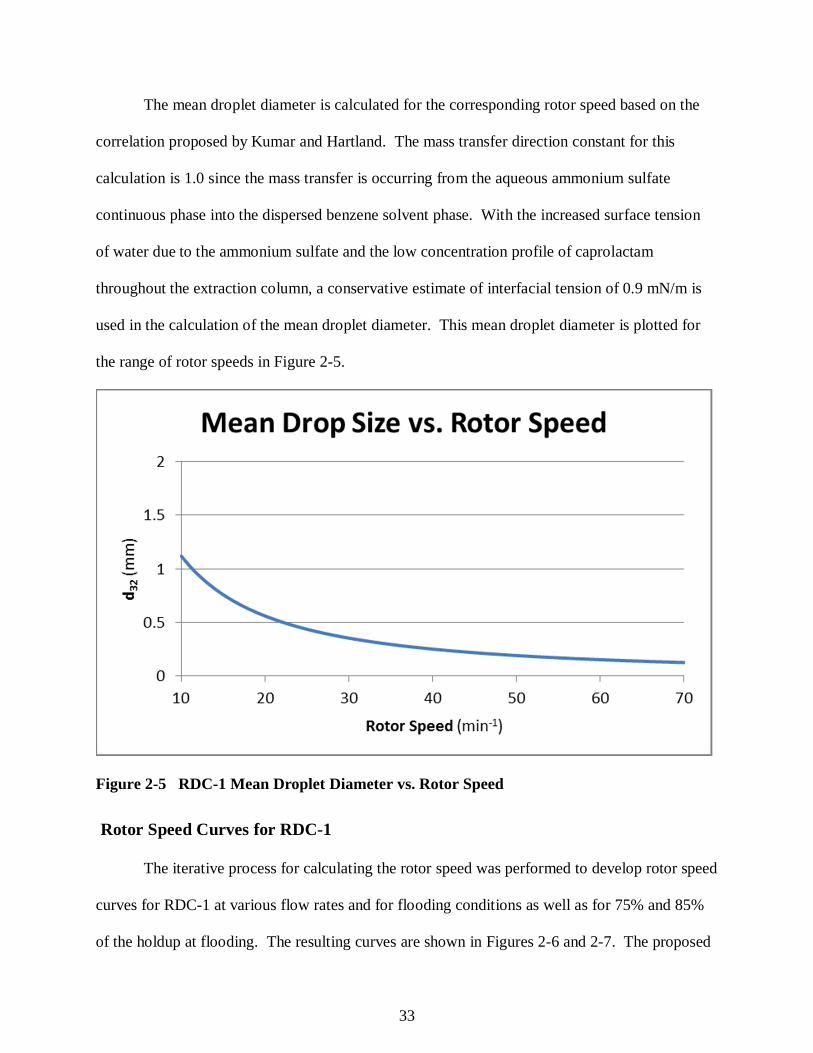
within a compartment versus rotor speed is shown in Figure 2-3. As rotor speed increases, the
power number decreases and the power dissipation in compartment increases. Finally the
mechanical power dissipation is calculated and plotted versus rotor speed shown in Figure 2-4.
31
Figure 2-1 RDC-1 Reynolds Number vs. Rotor Speed
Figure 2-2 RDC-1 Power Number vs. Rotor Speed
32
Figure 2-3 RDC-1 Power Dissipation in Compartment vs. Rotor Speed
Figure 2-4 RDC-1 Mechanical Power Dissipation vs. Rotor Speed
33
The mean droplet diameter is calculated for the corresponding rotor speed based on the
correlation proposed by Kumar and Hartland. The mass transfer direction constant for this
calculation is 1.0 since the mass transfer is occurring from the aqueous ammonium sulfate
continuous phase into the dispersed benzene solvent phase. With the increased surface tension
of water due to the ammonium sulfate and the low concentration profile of caprolactam
throughout the extraction column, a conservative estimate of interfacial tension of 0.9 mN/m is
used in the calculation of the mean droplet diameter. This mean droplet diameter is plotted for
the range of rotor speeds in Figure 2-5.
Figure 2-5 RDC-1 Mean Droplet Diameter vs. Rotor Speed
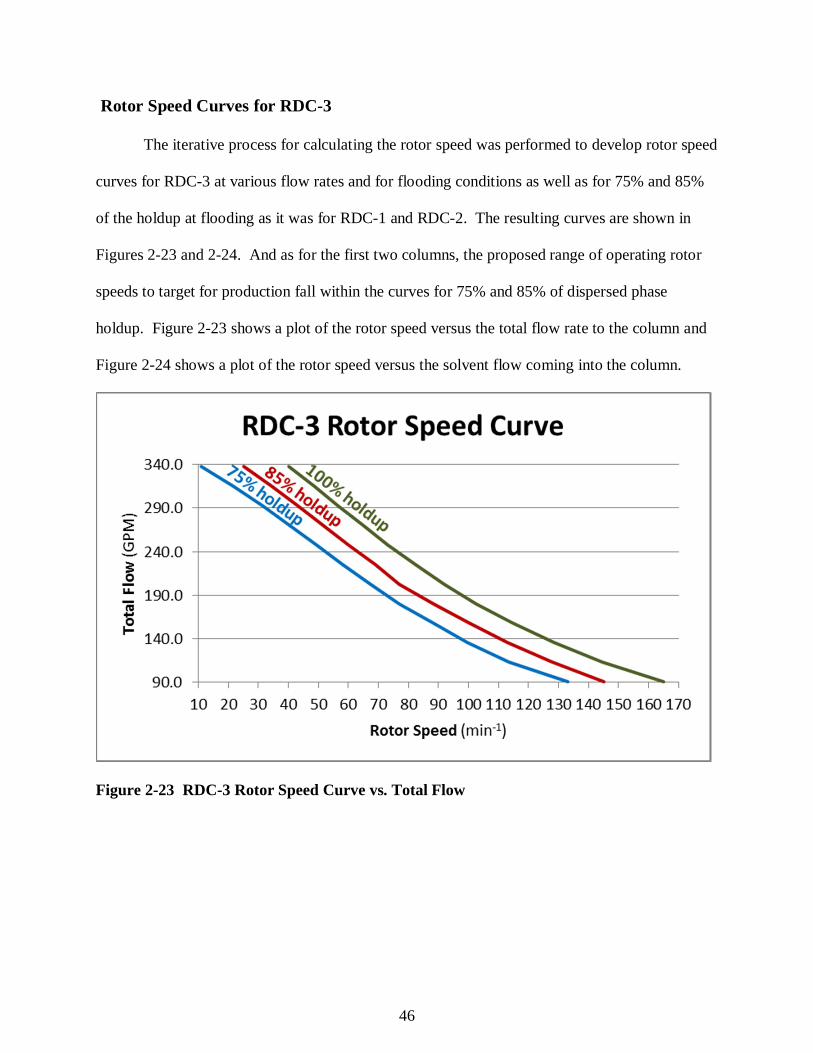
Rotor Speed Curves for RDC-1
The iterative process for calculating the rotor speed was performed to develop rotor speed
curves for RDC-1 at various flow rates and for flooding conditions as well as for 75% and 85%
of the holdup at flooding. The resulting curves are shown in Figures 2-6 and 2-7. The proposed
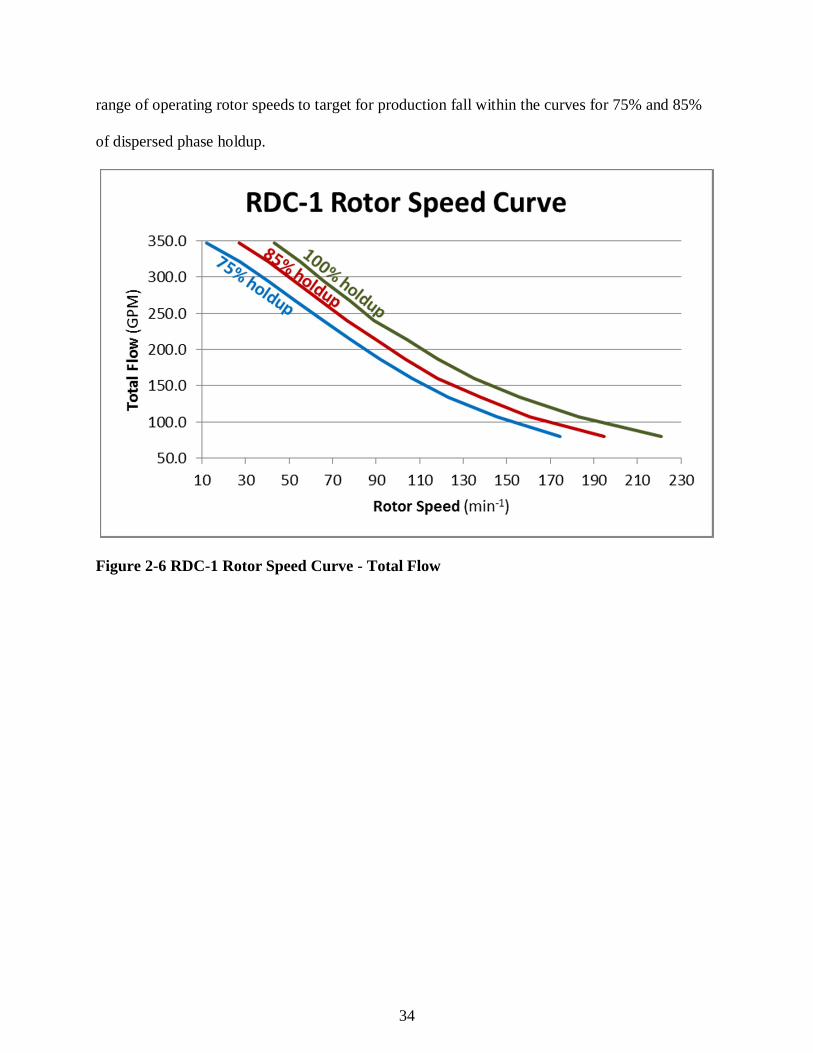
34
range of operating rotor speeds to target for production fall within the curves for 75% and 85%
of dispersed phase holdup.
Figure 2-6 RDC-1 Rotor Speed Curve - Total Flow
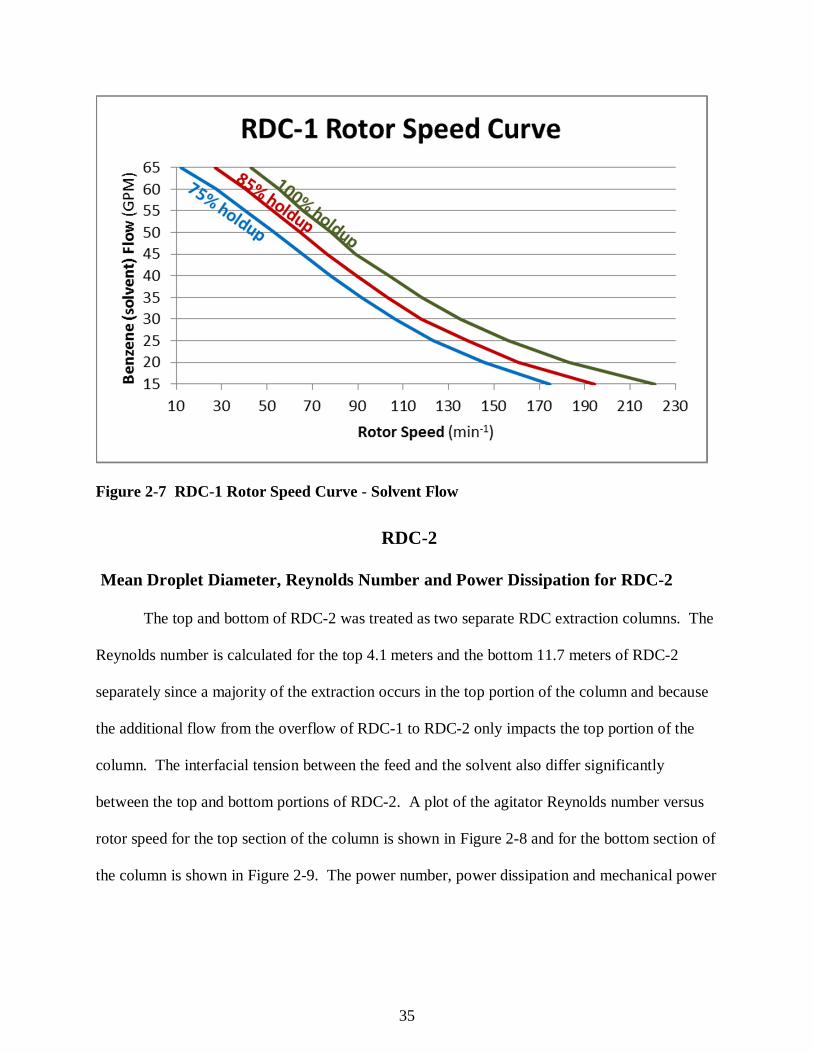
35
Figure 2-7 RDC-1 Rotor Speed Curve - Solvent Flow
RDC-2
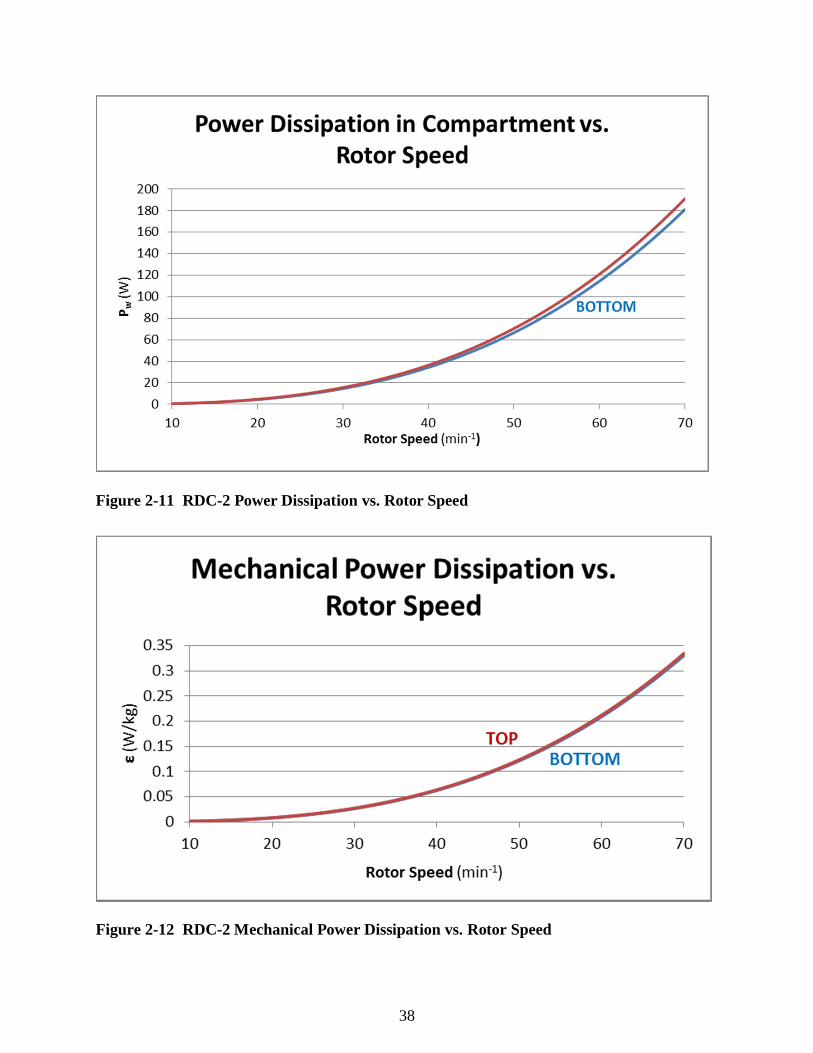
Mean Droplet Diameter, Reynolds Number and Power Dissipation for RDC-2
The top and bottom of RDC-2 was treated as two separate RDC extraction columns. The
Reynolds number is calculated for the top 4.1 meters and the bottom 11.7 meters of RDC-2
separately since a majority of the extraction occurs in the top portion of the column and because
the additional flow from the overflow of RDC-1 to RDC-2 only impacts the top portion of the
column. The interfacial tension between the feed and the solvent also differ significantly
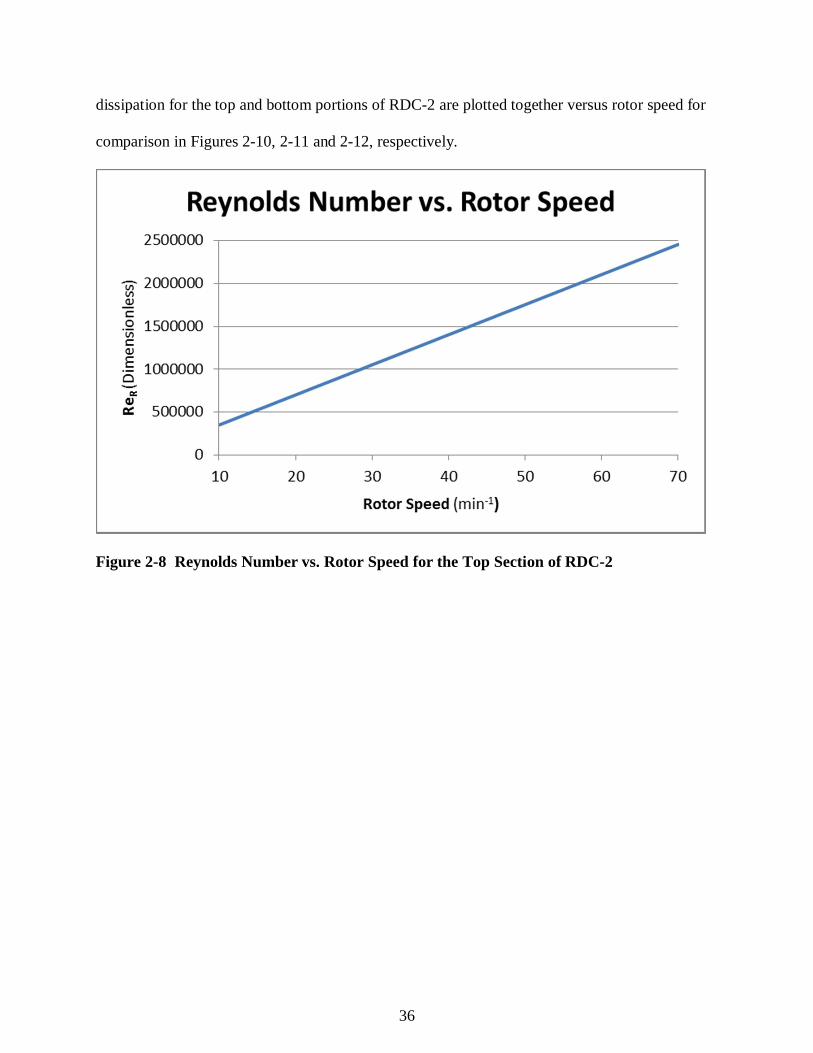
between the top and bottom portions of RDC-2. A plot of the agitator Reynolds number versus
rotor speed for the top section of the column is shown in Figure 2-8 and for the bottom section of
the column is shown in Figure 2-9. The power number, power dissipation and mechanical power
36
dissipation for the top and bottom portions of RDC-2 are plotted together versus rotor speed for
comparison in Figures 2-10, 2-11 and 2-12, respectively.
Figure 2-8 Reynolds Number vs. Rotor Speed for the Top Section of RDC-2
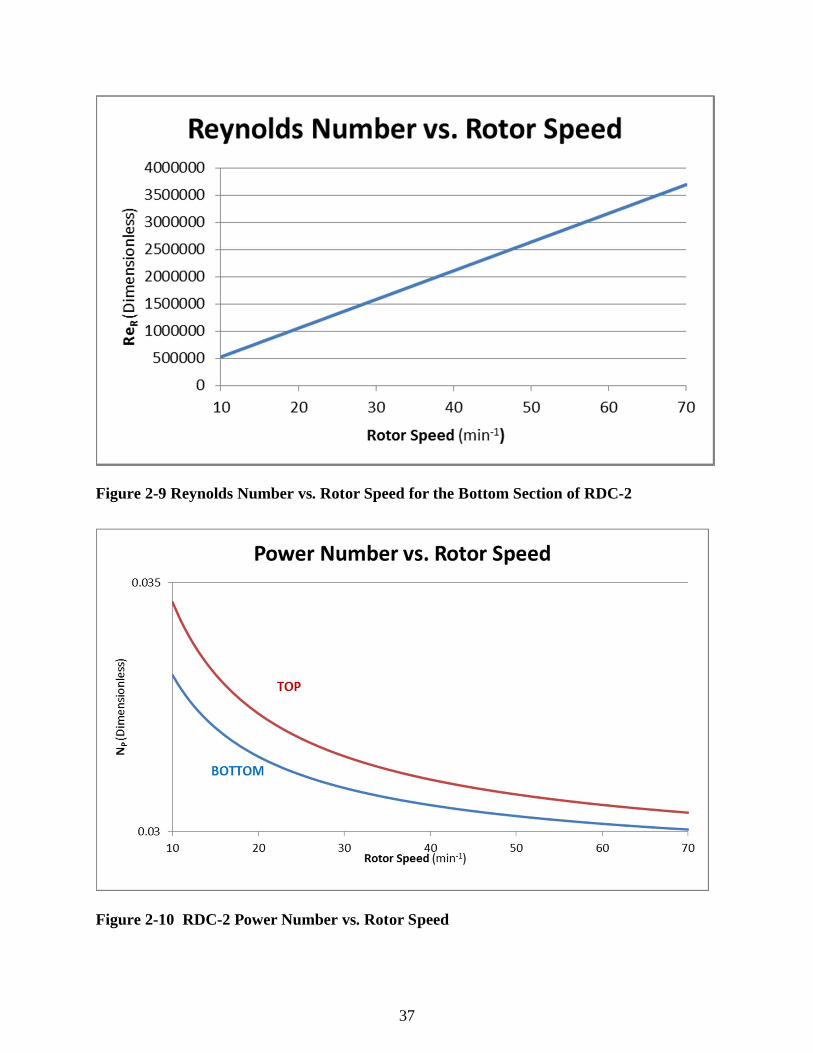
37
Figure 2-9 Reynolds Number vs. Rotor Speed for the Bottom Section of RDC-2
Figure 2-10 RDC-2 Power Number vs. Rotor Speed
38
Figure 2-11 RDC-2 Power Dissipation vs. Rotor Speed
Figure 2-12 RDC-2 Mechanical Power Dissipation vs. Rotor Speed
39
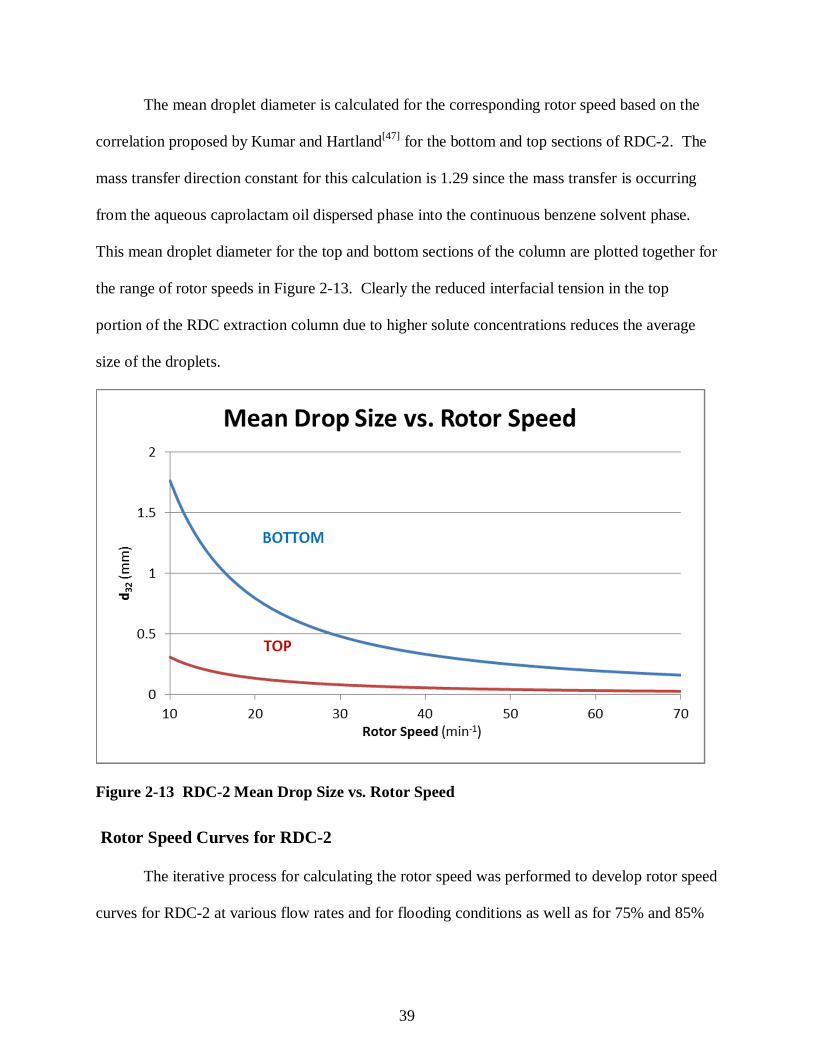
The mean droplet diameter is calculated for the corresponding rotor speed based on the
correlation proposed by Kumar and Hartland[47] for the bottom and top sections of RDC-2. The
mass transfer direction constant for this calculation is 1.29 since the mass transfer is occurring
from the aqueous caprolactam oil dispersed phase into the continuous benzene solvent phase.
This mean droplet diameter for the top and bottom sections of the column are plotted together for
the range of rotor speeds in Figure 2-13. Clearly the reduced interfacial tension in the top
portion of the RDC extraction column due to higher solute concentrations reduces the average
size of the droplets.
Figure 2-13 RDC-2 Mean Drop Size vs. Rotor Speed
Rotor Speed Curves for RDC-2
The iterative process for calculating the rotor speed was performed to develop rotor speed
curves for RDC-2 at various flow rates and for flooding conditions as well as for 75% and 85%
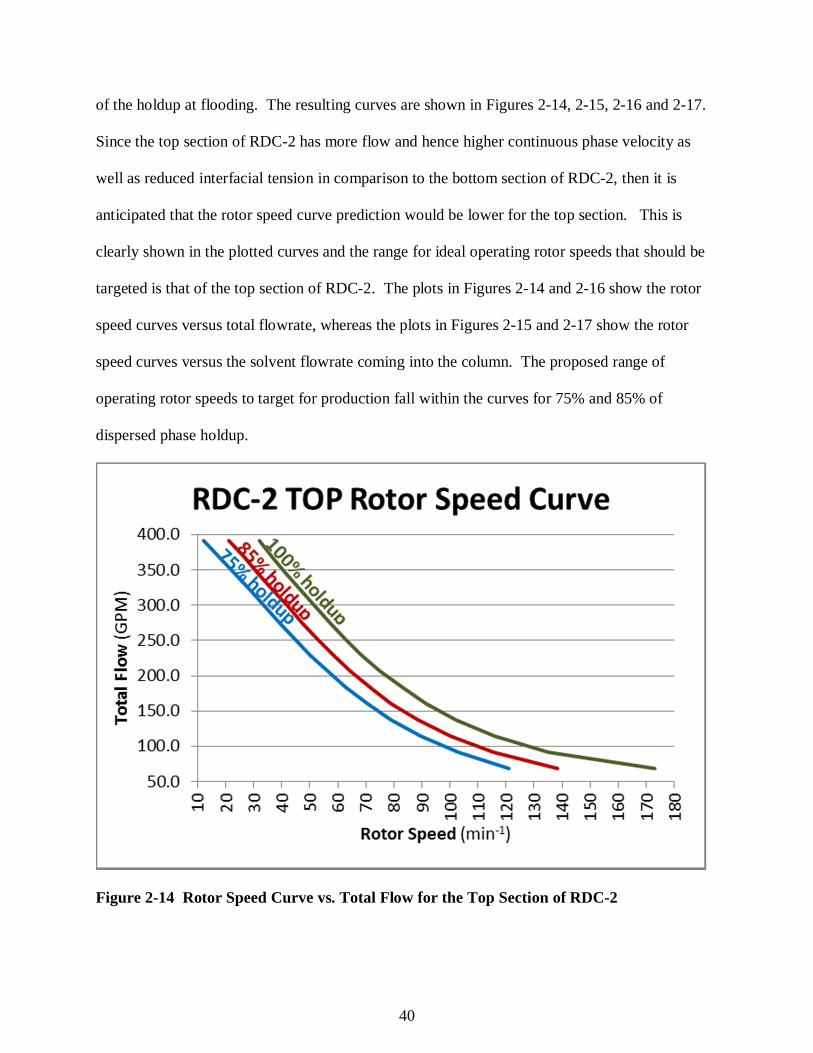
40
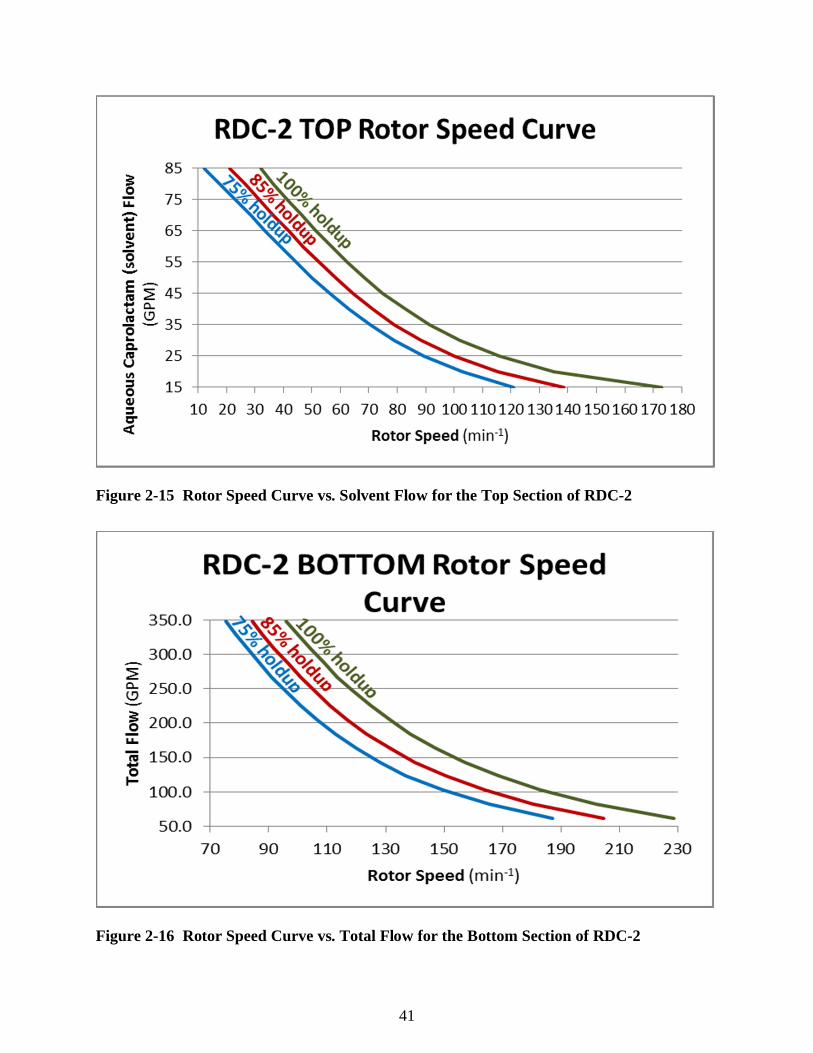
of the holdup at flooding. The resulting curves are shown in Figures 2-14, 2-15, 2-16 and 2-17.
Since the top section of RDC-2 has more flow and hence higher continuous phase velocity as
well as reduced interfacial tension in comparison to the bottom section of RDC-2, then it is
anticipated that the rotor speed curve prediction would be lower for the top section. This is
clearly shown in the plotted curves and the range for ideal operating rotor speeds that should be
targeted is that of the top section of RDC-2. The plots in Figures 2-14 and 2-16 show the rotor
speed curves versus total flowrate, whereas the plots in Figures 2-15 and 2-17 show the rotor
speed curves versus the solvent flowrate coming into the column. The proposed range of
operating rotor speeds to target for production fall within the curves for 75% and 85% of
dispersed phase holdup.
Figure 2-14 Rotor Speed Curve vs. Total Flow for the Top Section of RDC-2
41
Figure 2-15 Rotor Speed Curve vs. Solvent Flow for the Top Section of RDC-2
Figure 2-16 Rotor Speed Curve vs. Total Flow for the Bottom Section of RDC-2
42
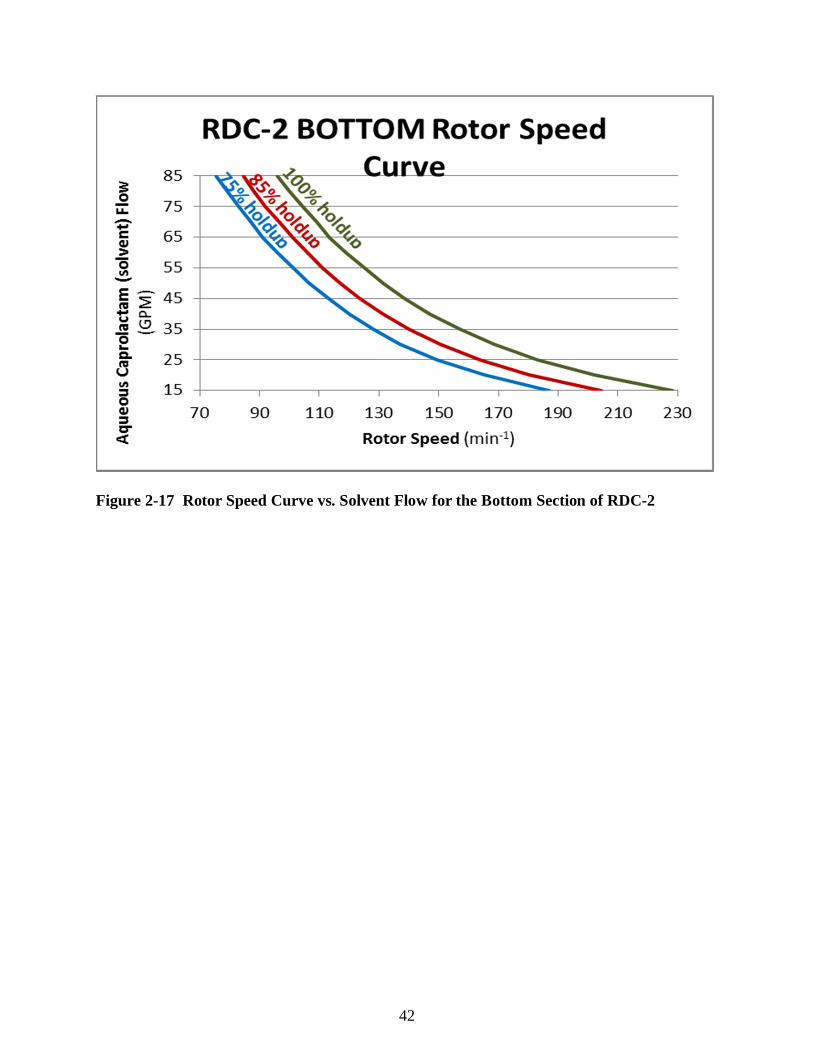
Figure 2-17 Rotor Speed Curve vs. Solvent Flow for the Bottom Section of RDC-2
43
RDC-3
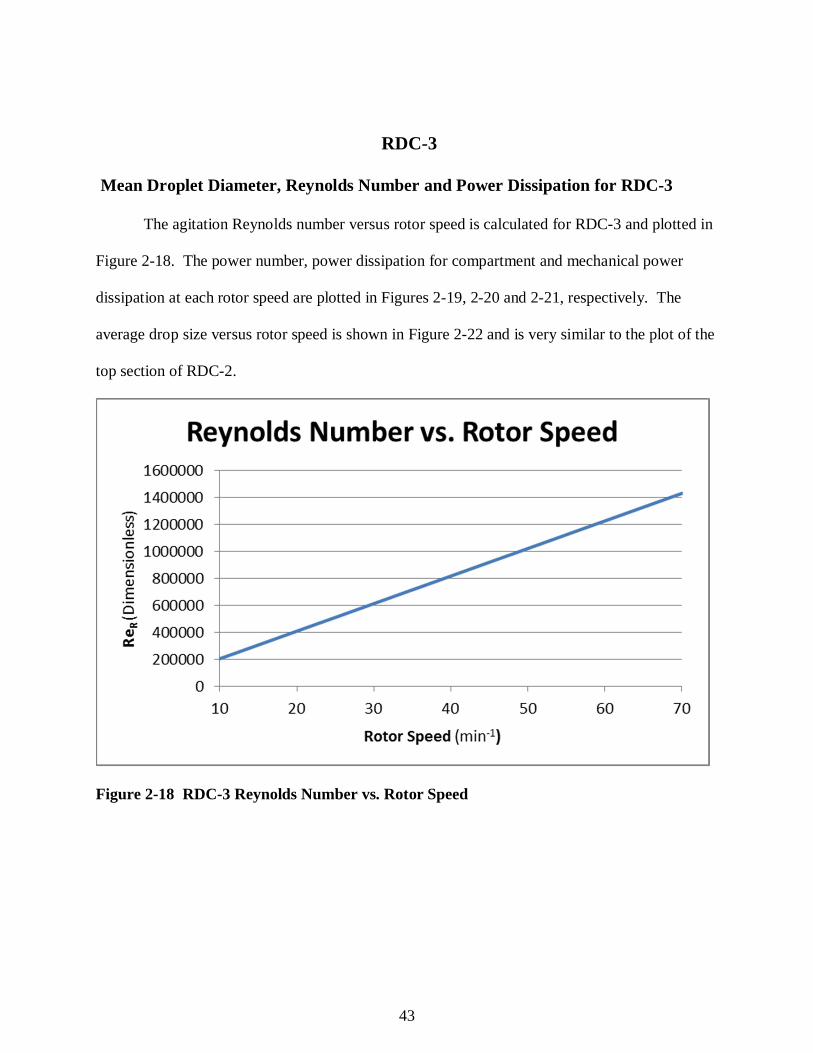
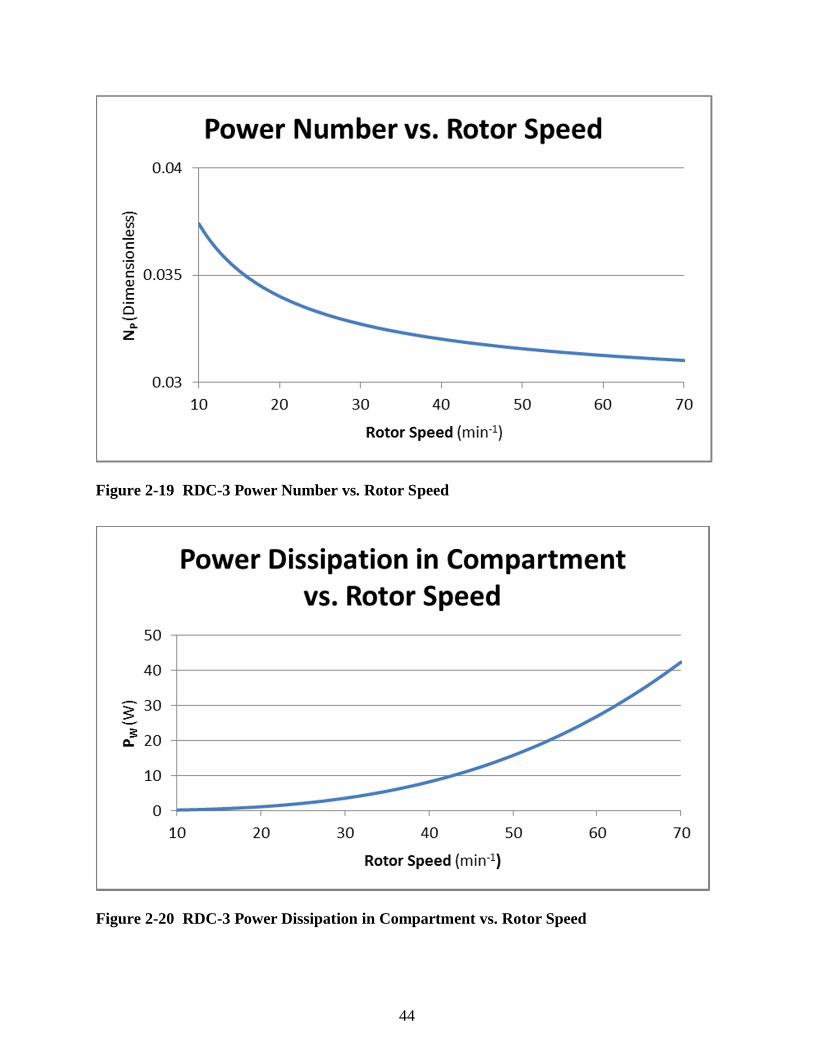
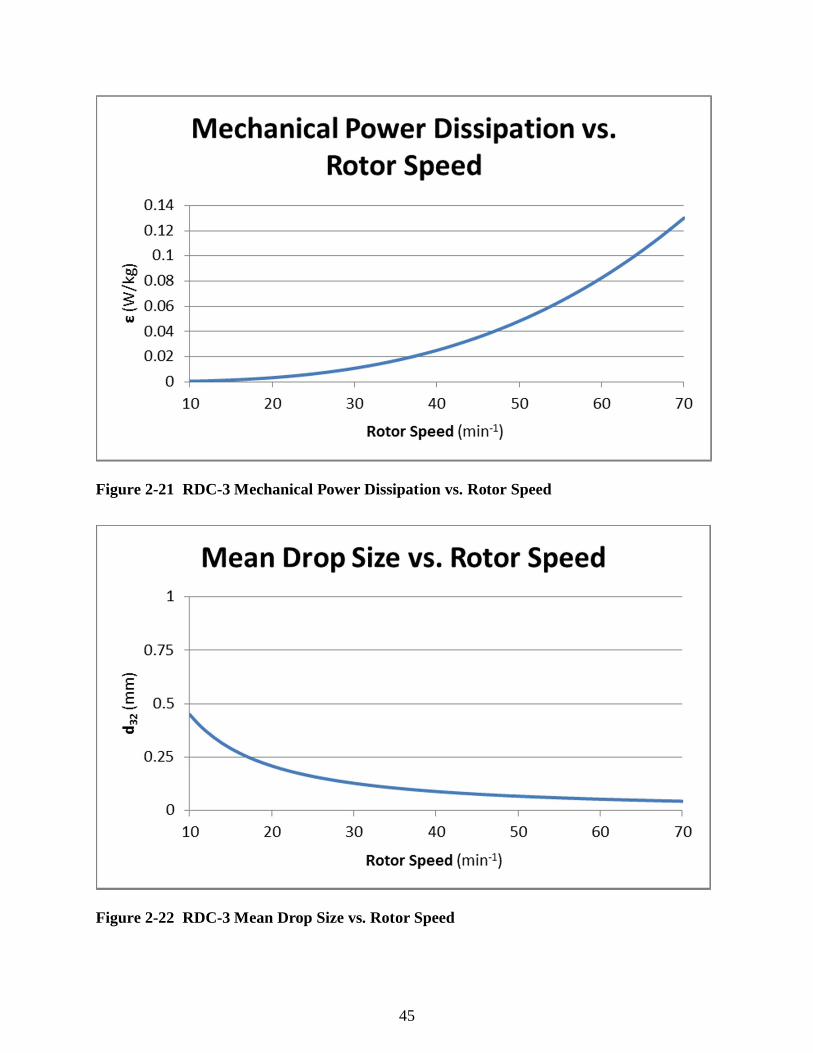
Mean Droplet Diameter, Reynolds Number and Power Dissipation for RDC-3
The agitation Reynolds number versus rotor speed is calculated for RDC-3 and plotted in
Figure 2-18. The power number, power dissipation for compartment and mechanical power
dissipation at each rotor speed are plotted in Figures 2-19, 2-20 and 2-21, respectively. The
average drop size versus rotor speed is shown in Figure 2-22 and is very similar to the plot of the
top section of RDC-2.
Figure 2-18 RDC-3 Reynolds Number vs. Rotor Speed
44
Figure 2-19 RDC-3 Power Number vs. Rotor Speed
Figure 2-20 RDC-3 Power Dissipation in Compartment vs. Rotor Speed
45
Figure 2-21 RDC-3 Mechanical Power Dissipation vs. Rotor Speed
Figure 2-22 RDC-3 Mean Drop Size vs. Rotor Speed
46
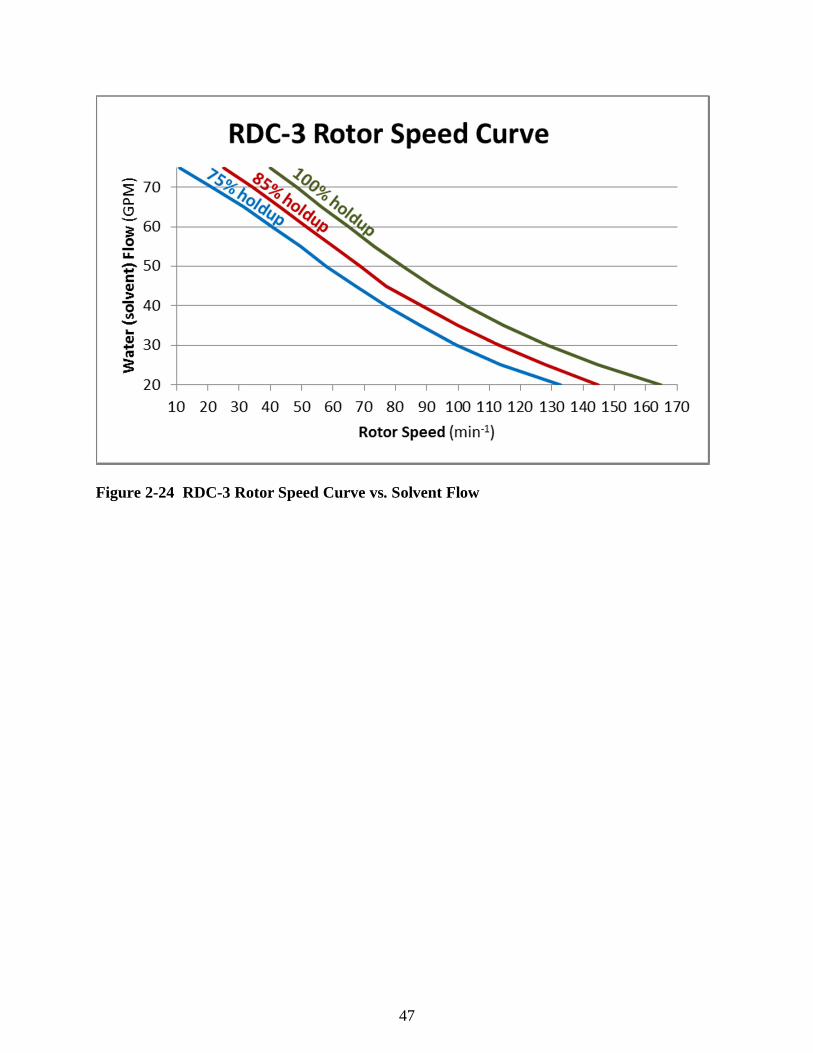
Rotor Speed Curves for RDC-3
The iterative process for calculating the rotor speed was performed to develop rotor speed
curves for RDC-3 at various flow rates and for flooding conditions as well as for 75% and 85%
of the holdup at flooding as it was for RDC-1 and RDC-2. The resulting curves are shown in
Figures 2-23 and 2-24. And as for the first two columns, the proposed range of operating rotor
speeds to target for production fall within the curves for 75% and 85% of dispersed phase
holdup. Figure 2-23 shows a plot of the rotor speed versus the total flow rate to the column and
Figure 2-24 shows a plot of the rotor speed versus the solvent flow coming into the column.
Figure 2-23 RDC-3 Rotor Speed Curve vs. Total Flow
47
Figure 2-24 RDC-3 Rotor Speed Curve vs. Solvent Flow
48
Critical Rotor Speeds
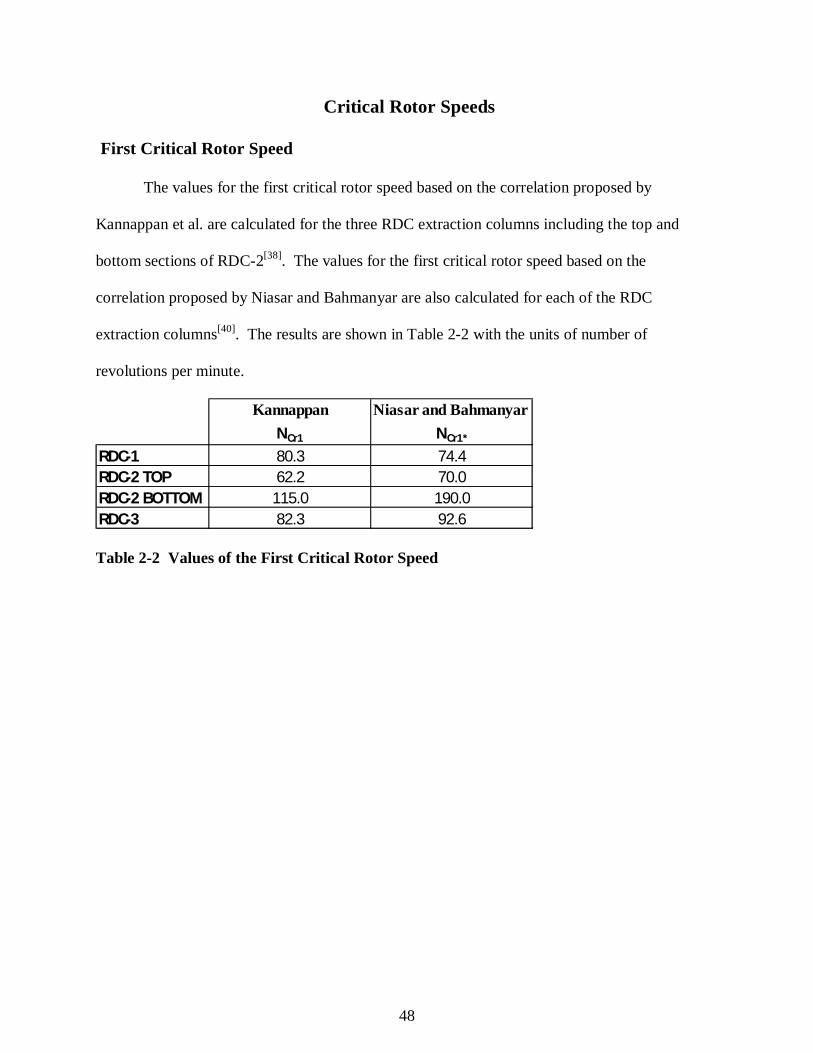
First Critical Rotor Speed
The values for the first critical rotor speed based on the correlation proposed by
Kannappan et al. are calculated for the three RDC extraction columns including the top and
bottom sections of RDC-2[38]. The values for the first critical rotor speed based on the
correlation proposed by Niasar and Bahmanyar are also calculated for each of the RDC
extraction columns[40]. The results are shown in Table 2-2 with the units of number of
revolutions per minute.
Table 2-2 Values of the First Critical Rotor Speed
Kannappan Niasar and Bahmanyar NCr1 NCr1*
RDC-1 80.3 74.4RDC-2 TOP 62.2 70.0RDC-2 BOTTOM 115.0 190.0RDC-3 82.3 92.6
49
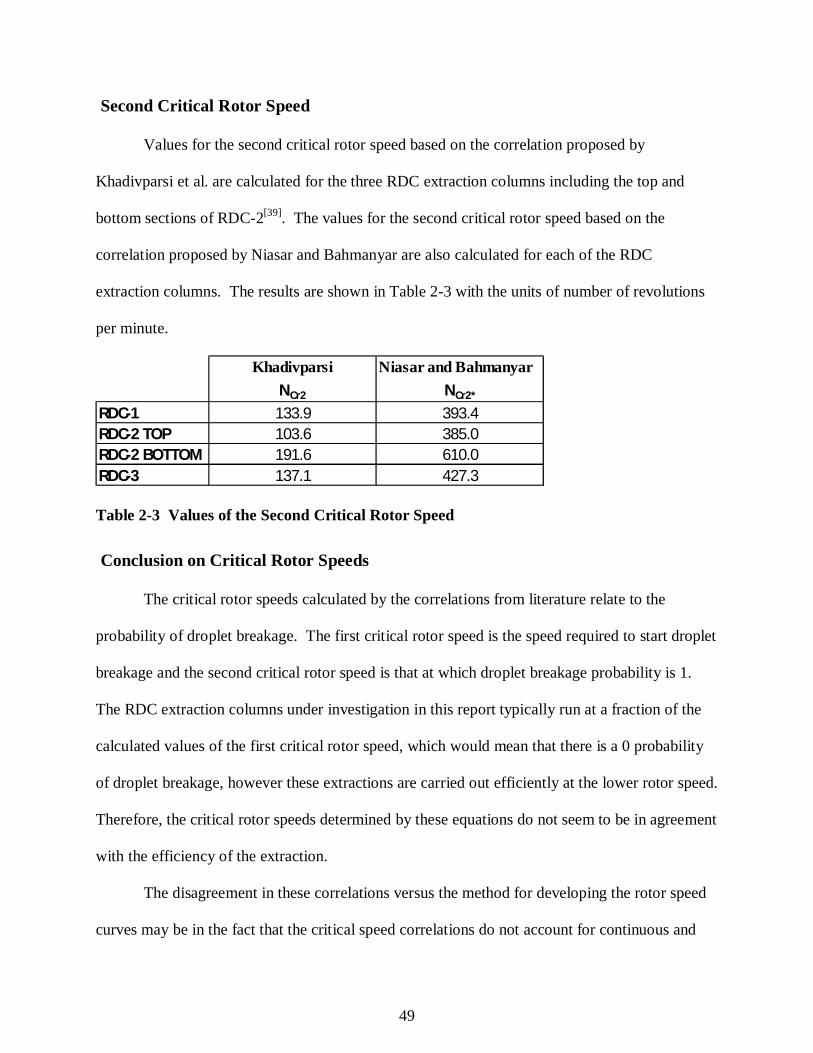
Second Critical Rotor Speed
Values for the second critical rotor speed based on the correlation proposed by
Khadivparsi et al. are calculated for the three RDC extraction columns including the top and
bottom sections of RDC-2[39]. The values for the second critical rotor speed based on the
correlation proposed by Niasar and Bahmanyar are also calculated for each of the RDC
extraction columns. The results are shown in Table 2-3 with the units of number of revolutions
per minute.
Table 2-3 Values of the Second Critical Rotor Speed
Conclusion on Critical Rotor Speeds
The critical rotor speeds calculated by the correlations from literature relate to the
probability of droplet breakage. The first critical rotor speed is the speed required to start droplet
breakage and the second critical rotor speed is that at which droplet breakage probability is 1.
The RDC extraction columns under investigation in this report typically run at a fraction of the
calculated values of the first critical rotor speed, which would mean that there is a 0 probability
of droplet breakage, however these extractions are carried out efficiently at the lower rotor speed.
Therefore, the critical rotor speeds determined by these equations do not seem to be in agreement
with the efficiency of the extraction.
The disagreement in these correlations versus the method for developing the rotor speed
curves may be in the fact that the critical speed correlations do not account for continuous and
Khadivparsi Niasar and Bahmanyar NCr2 NCr2*
RDC-1 133.9 393.4RDC-2 TOP 103.6 385.0RDC-2 BOTTOM 191.6 610.0RDC-3 137.1 427.3

50
dispersed phase velocities as they were developed with non-flowing continuous phase. The
disagreement between the correlations and experimental data with the extraction columns under
investigation could also be caused by the variations in physical properties such as interfacial
tension that can be caused by impurities that are not accounted for in the correlations.
51
Chapter 3 - Theoretical Stages of the RDC Extraction Columns
Number of Stages in an Extraction Column
The number of theoretical stages achieved can be calculated for a lot of extractions with
the Kremser Equation 3-1[53] incorporating actual data of the solute weight fractions in the feed,
raffinate and solvent and the solvent flow ratio. However, this equation alone does not account
for axial mixing within an extraction column. This equation also accounts for the partition
coefficient KD of the solute in the two solvents of the system.
Equation 3-1
=
ln 1 + 1
ln
In some cases the partition coefficient remains reasonably constant for a given solute in
the solvent system, however in many cases it can vary significantly with variances in the weight
fraction of solute in either phase. The partition coefficient for a system can be calculated with
Equation 3-2 where it is the ratio of weight percent solute in the organic phase to weight percent
solute in the aqueous phase.
Equation 3-2
=. %. %
If there is a variation in the partition coefficient with the change in the concentration, then an
average of the partition coefficient can be used in the Kremser Equation.
52
Once the number of stages has been determined, the height equivalent to a theoretical
stage (HETS) can be calculated by using Equation 3-3 with a basis on proven results from an
extraction column and using the height of the agitated portion of the column.
Equation 3-3
=
Another way to calculate the number of theoretical stages achieved is to approach the
column as a set of mixer-settlers in series where stage equilibrium is reached in each stage. This
requires knowledge of the partition coefficient (Kd) based on solute concentrations in both the
organic and aqueous phases entering each stage.
Rotating Disk Contactor Extraction Column Stages
Since an RDC extraction column does not really follow the concept of stage-wise mixing
and settling but more as a continuously operating extractor, then the solute concentration profile
will vary continuously. For RDC extraction columns, there are more variables that have to be
considered in determining the number and height of theoretical stages due to axial mixing,
dispersed phase holdup and power input by the rotor.
Phase Velocities and Dispersed Phase Holdup
The first set of variables that have to be considered are the phase and slip velocities. The
superficial velocities for the dispersed and continuous phases are calculated based on the
smallest area in the column internals which is the annular opening of the stator ring as shown in
Equations 3-4 and 3-5.
Equation 3-4
=
2
53
Equation 3-5
=
2
The volume fraction of holdup of the dispersed phase in the extraction column is
calculated by Equation 3-6[48].
Equation 3-6
= 0.27 +
. .
3.34. .
×. . .
After calculation of the dispersed phase holdup (h), the actual average continuous and
dispersed phase velocities can be calculated by Equations 3-7 and 3-8. Incorporation of the
holdup factor accounts for the fraction of space taken up by the opposite phase in the flow path.
Equation 3-7
=
Equation 3-8
= ( )
From these velocities, the second iteration of the dispersed phase holdup and the phase
velocities is executed. This iterative process is repeated until the change in either the holdup or
the velocities is insignificant from one iteration to the next.
The ratio of dispersed phase velocity to continuous phase velocity provides the dispersed
phase holdup factor at flooding which can be determined from Figure 3-1, or the dispersed phase
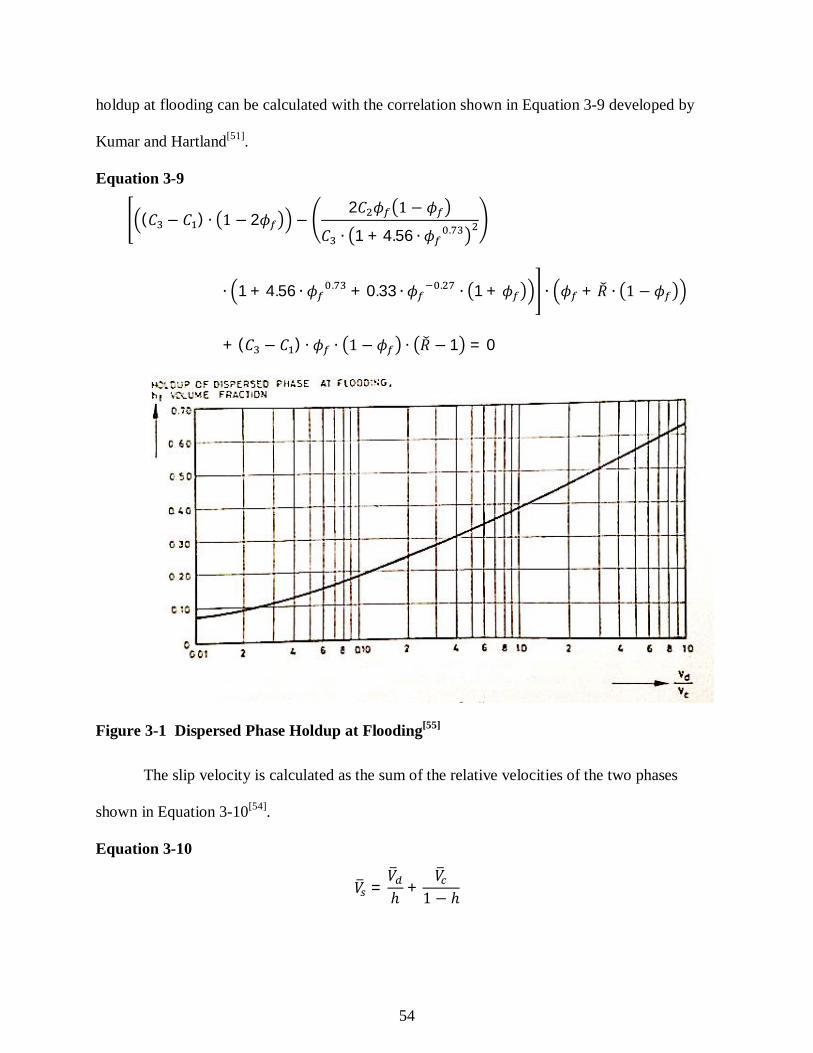
54
holdup at flooding can be calculated with the correlation shown in Equation 3-9 developed by
Kumar and Hartland[51].
Equation 3-9
( ) 22
1 + 4.56 .
1 + 4.56 . + 0.33 . 1 + +
+ ( ) 1 = 0
Figure 3-1 Dispersed Phase Holdup at Flooding[55]
The slip velocity is calculated as the sum of the relative velocities of the two phases
shown in Equation 3-10[54].
Equation 3-10
= +
55
The effective slip velocity is calculated via Equation 3-11 to account for the fractional
holdup.
Equation 3-11
= ( )
The velocity of the continuous phase adjusted for the slip velocity is then correlated by
Equation 3-12 where is the ratio of to .
Equation 3-12
=+ 1
( )
Plotting the relationship of to in the correlation above will afford a curve that will pass
through a maximum which is the dispersed phase holdup at flooding.
HETS, HTU and HDU
To calculate the HETS for an RDC extraction column as shown in Equation 3-13, the
effective height of a transfer unit (HTUeff) must be considered[55].
Equation 3-13
=ln 1
1 1
The effective height of a transfer unit is the sum of the height of a transfer unit (HTU)
and the height of a diffusion unit (HDU) as seen in Equation 3-14.
Equation 3-14 = +
The height of a transfer unit (HTU) is determined via Equation 3-15 by estimating the
number of theoretical equilibrium stages required to achieve efficient extraction and dividing the
height of the agitated section of the extraction column by this number of equilibrium stages.
56
Equation 3-15
=
The height of a diffusion unit accounts for the axial mixing that occurs in the column and
is correlated by Equation 3-16.
Equation 3-16
=1
+ 0.8 ln 1
1 1
And the Peclet number is obtained by Equation 3-17[55].
Equation 3-17
=0.1 + 1
0.1 +
Where the correlations for and are shown in Equations 3-18 and 3-19.
Equation 3-18
1=
1
+1
Equation 3-19
1=
1+
1
is the Peclet number for the solvent phase and is the Peclet number for the feed. These
can be calculated via these equations where and are the Peclet numbers for the dispersed
and continuous phases, respectively. Therefore substitution of Equations 3-20 and 3-21 into
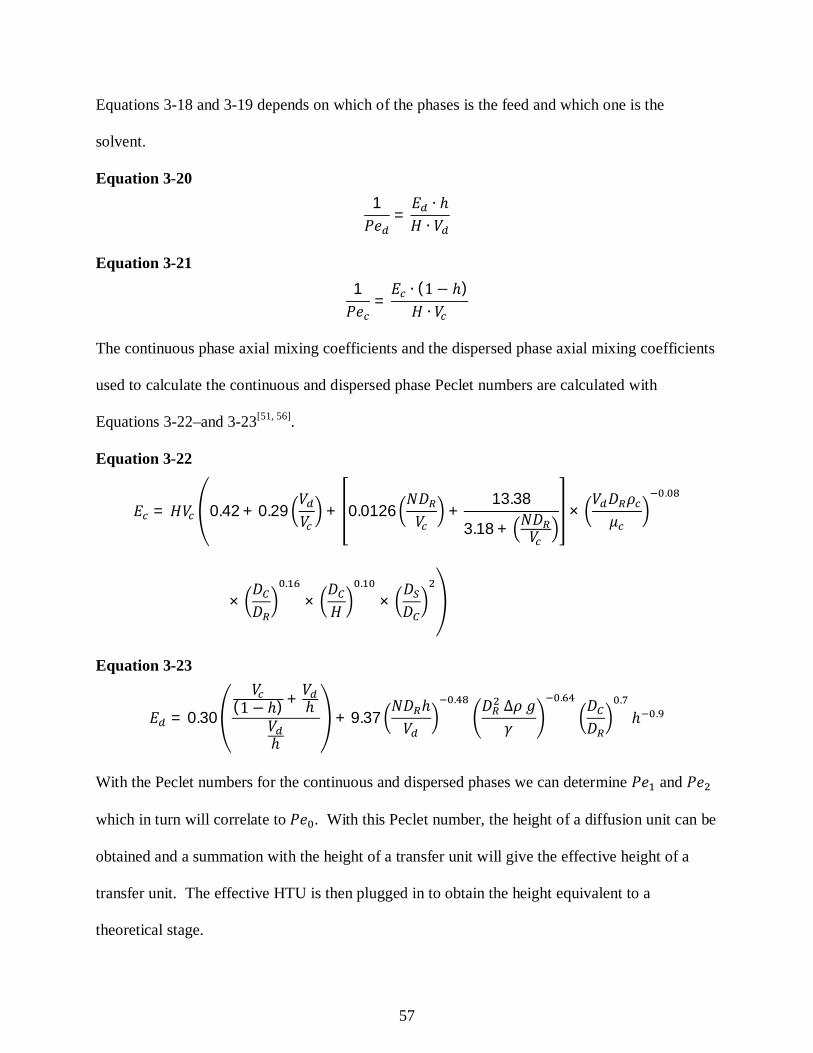
57
Equations 3-18 and 3-19 depends on which of the phases is the feed and which one is the
solvent.
Equation 3-20 1
=
Equation 3-21 1
=( )
The continuous phase axial mixing coefficients and the dispersed phase axial mixing coefficients
used to calculate the continuous and dispersed phase Peclet numbers are calculated with
Equations 3-22–and 3-23[51, 56].
Equation 3-22
= 0.42 + 0.29 + 0.0126 +13.38
3.18 +×
.
×.
×.
×
Equation 3-23
= 0.30( ) +
+ 9.37. . .
.
With the Peclet numbers for the continuous and dispersed phases we can determine and
which in turn will correlate to . With this Peclet number, the height of a diffusion unit can be
obtained and a summation with the height of a transfer unit will give the effective height of a
transfer unit. The effective HTU is then plugged in to obtain the height equivalent to a
theoretical stage.

58
RDC-1: Extraction of Caprolactam from Aqueous Ammonium Sulfate
The first of the RDC extraction columns in the series is the ammonium sulfate extraction
where residual caprolactam that remains in the 43 weight percent ammonium sulfate in water
solution resulting from the Beckmann Rearrangement is extracted with benzene. The resulting
ammonium sulfate raffinate which has 0.02 weight percent caprolactam goes to a crystallization
unit for further processing of the ammonium sulfate. The extract of this column contains about
3.7 weight percent caprolactam in benzene that overflows from RDC-1 into RDC-2 at stator
section 60 of 78. The dimensions of RDC-1 cannot be specified in this report due to the
company’s non-disclosure confidentiality agreement.
HTUeff and HETS for RDC-1
The partition coefficient, Kd, is significantly impacted by the concentration of ammonium
sulfate in the feed as shown in Figure 3-2.
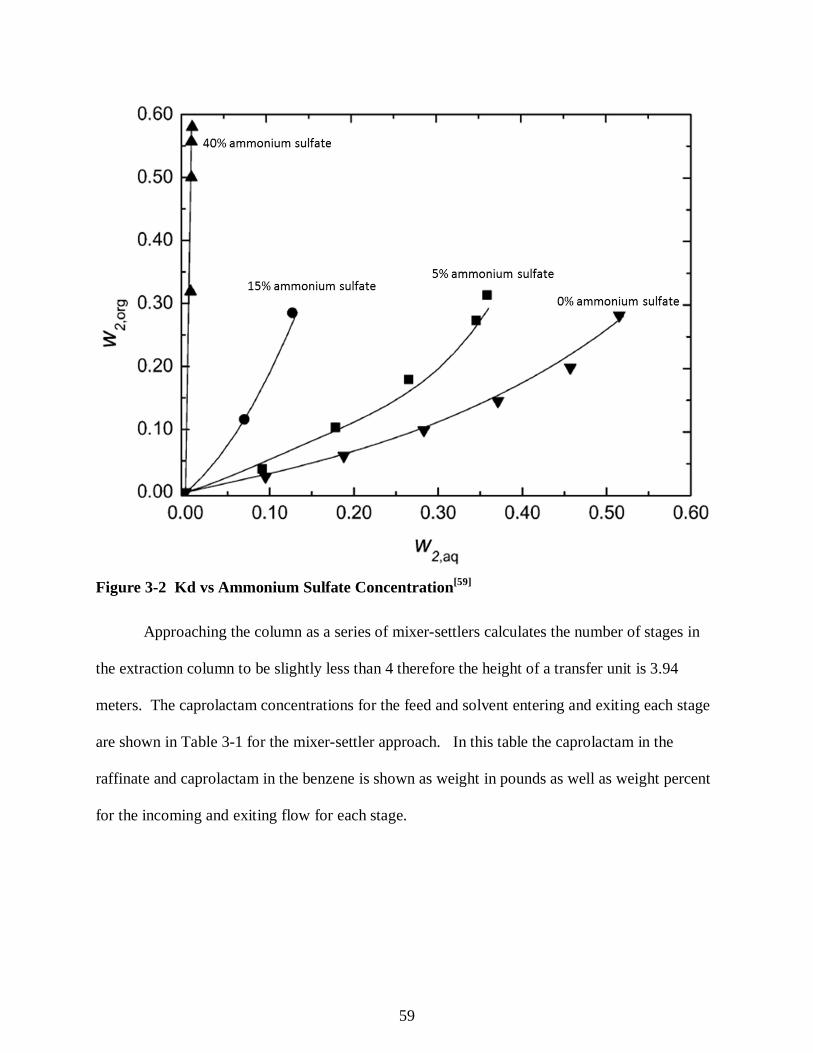
59
Figure 3-2 Kd vs Ammonium Sulfate Concentration[59]
Approaching the column as a series of mixer-settlers calculates the number of stages in
the extraction column to be slightly less than 4 therefore the height of a transfer unit is 3.94
meters. The caprolactam concentrations for the feed and solvent entering and exiting each stage
are shown in Table 3-1 for the mixer-settler approach. In this table the caprolactam in the
raffinate and caprolactam in the benzene is shown as weight in pounds as well as weight percent
for the incoming and exiting flow for each stage.
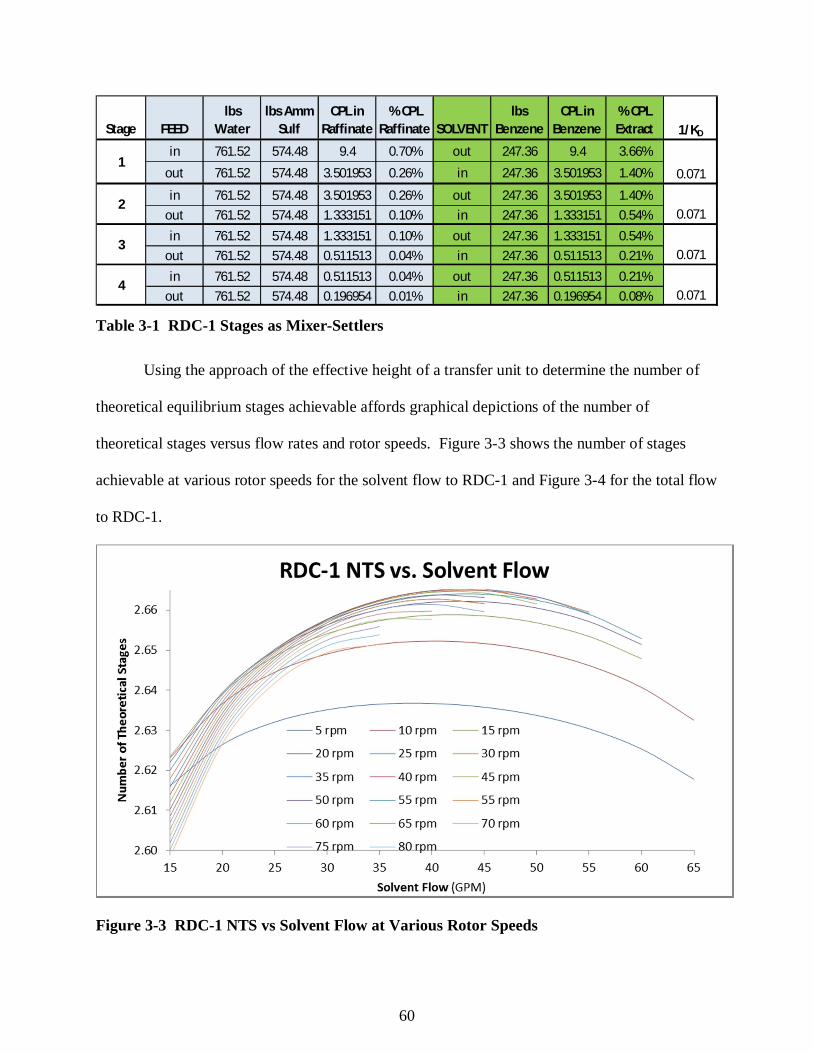
60
Table 3-1 RDC-1 Stages as Mixer-Settlers
Using the approach of the effective height of a transfer unit to determine the number of
theoretical equilibrium stages achievable affords graphical depictions of the number of
theoretical stages versus flow rates and rotor speeds. Figure 3-3 shows the number of stages
achievable at various rotor speeds for the solvent flow to RDC-1 and Figure 3-4 for the total flow
to RDC-1.
Figure 3-3 RDC-1 NTS vs Solvent Flow at Various Rotor Speeds
in 761.52 574.48 9.4 0.70% out 247.36 9.4 3.66%
out 761.52 574.48 3.501953 0.26% in 247.36 3.501953 1.40%
in 761.52 574.48 3.501953 0.26% out 247.36 3.501953 1.40%out 761.52 574.48 1.333151 0.10% in 247.36 1.333151 0.54%in 761.52 574.48 1.333151 0.10% out 247.36 1.333151 0.54%
out 761.52 574.48 0.511513 0.04% in 247.36 0.511513 0.21%in 761.52 574.48 0.511513 0.04% out 247.36 0.511513 0.21%
out 761.52 574.48 0.196954 0.01% in 247.36 0.196954 0.08%
20.071
30.071
40.071
lbs Benzene
CPL in Benzene
% CPL Extract
10.071
Stage 1/KDFEEDlbs
Waterlbs Amm
SulfCPL in
Raffinate% CPL
Raffinate SOLVENT
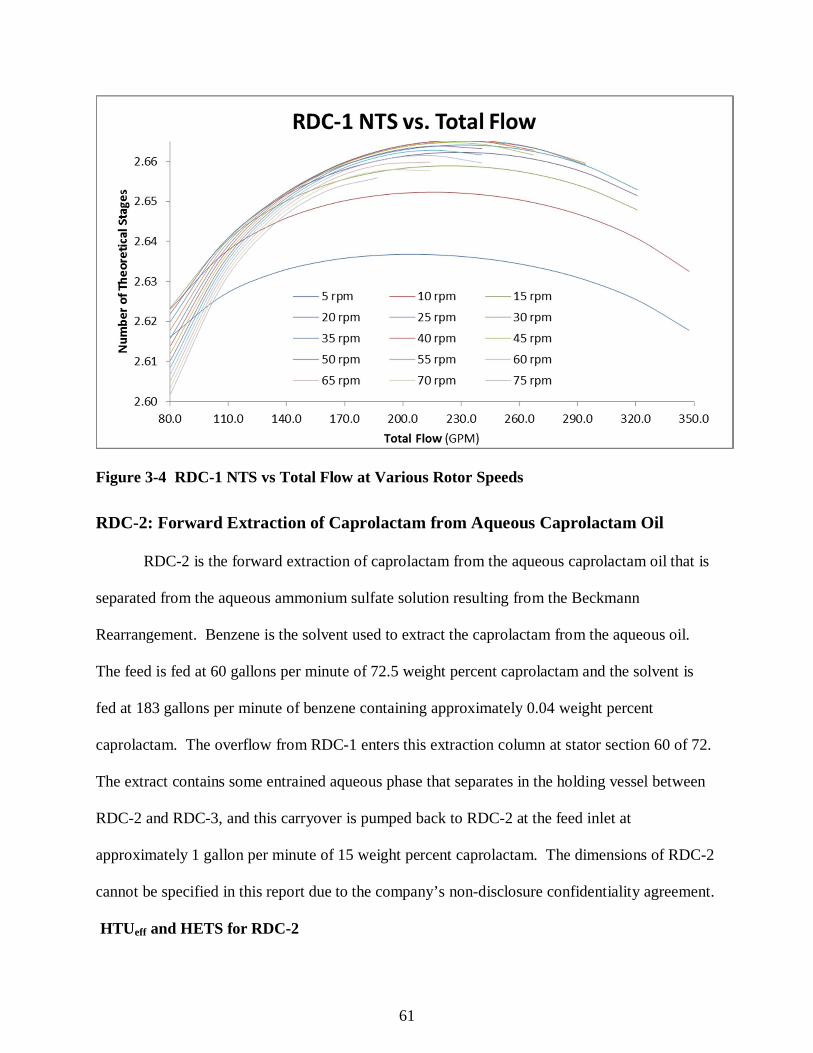
61
Figure 3-4 RDC-1 NTS vs Total Flow at Various Rotor Speeds
RDC-2: Forward Extraction of Caprolactam from Aqueous Caprolactam Oil
RDC-2 is the forward extraction of caprolactam from the aqueous caprolactam oil that is
separated from the aqueous ammonium sulfate solution resulting from the Beckmann
Rearrangement. Benzene is the solvent used to extract the caprolactam from the aqueous oil.
The feed is fed at 60 gallons per minute of 72.5 weight percent caprolactam and the solvent is
fed at 183 gallons per minute of benzene containing approximately 0.04 weight percent
caprolactam. The overflow from RDC-1 enters this extraction column at stator section 60 of 72.
The extract contains some entrained aqueous phase that separates in the holding vessel between
RDC-2 and RDC-3, and this carryover is pumped back to RDC-2 at the feed inlet at
approximately 1 gallon per minute of 15 weight percent caprolactam. The dimensions of RDC-2
cannot be specified in this report due to the company’s non-disclosure confidentiality agreement.
HTUeff and HETS for RDC-2
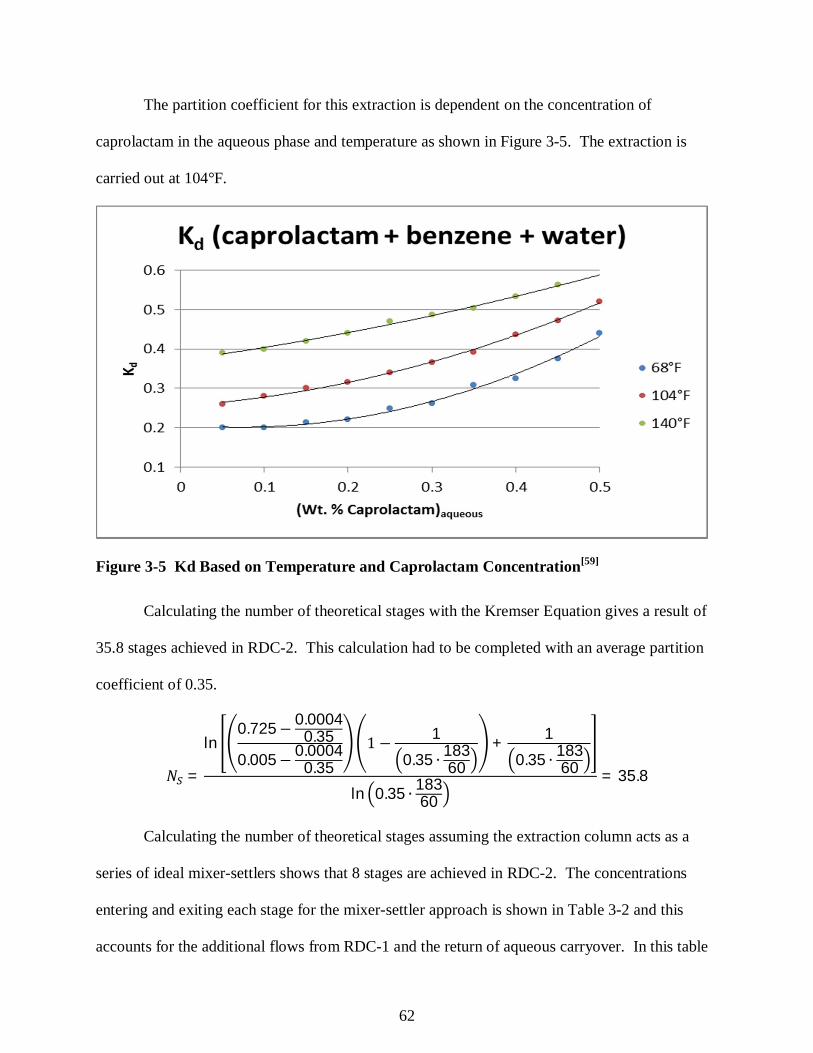
62
The partition coefficient for this extraction is dependent on the concentration of
caprolactam in the aqueous phase and temperature as shown in Figure 3-5. The extraction is
carried out at 104°F.
Figure 3-5 Kd Based on Temperature and Caprolactam Concentration[59]
Calculating the number of theoretical stages with the Kremser Equation gives a result of
35.8 stages achieved in RDC-2. This calculation had to be completed with an average partition
coefficient of 0.35.
=
ln0.725 0.0004
0.350.005 0.0004
0.35
10.35 183
60+ 1
0.35 18360
ln 0.35 18360
= 35.8
Calculating the number of theoretical stages assuming the extraction column acts as a
series of ideal mixer-settlers shows that 8 stages are achieved in RDC-2. The concentrations
entering and exiting each stage for the mixer-settler approach is shown in Table 3-2 and this
accounts for the additional flows from RDC-1 and the return of aqueous carryover. In this table
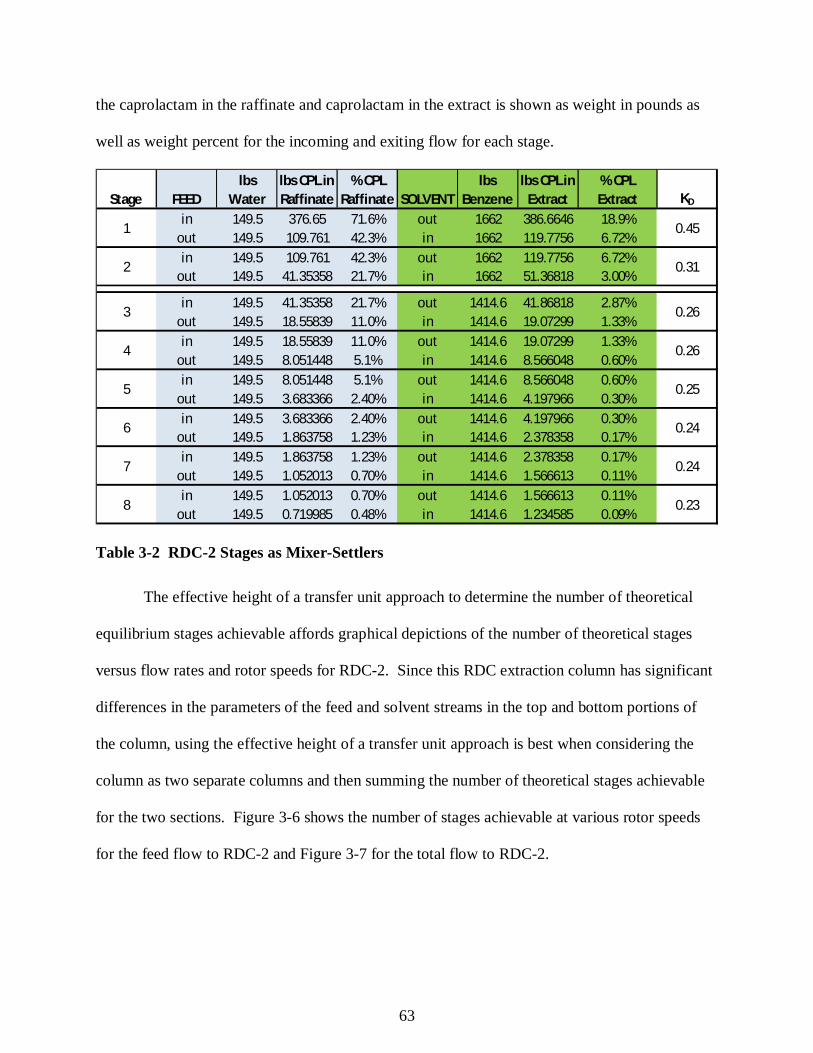
63
the caprolactam in the raffinate and caprolactam in the extract is shown as weight in pounds as
well as weight percent for the incoming and exiting flow for each stage.
Table 3-2 RDC-2 Stages as Mixer-Settlers
The effective height of a transfer unit approach to determine the number of theoretical
equilibrium stages achievable affords graphical depictions of the number of theoretical stages
versus flow rates and rotor speeds for RDC-2. Since this RDC extraction column has significant
differences in the parameters of the feed and solvent streams in the top and bottom portions of
the column, using the effective height of a transfer unit approach is best when considering the
column as two separate columns and then summing the number of theoretical stages achievable
for the two sections. Figure 3-6 shows the number of stages achievable at various rotor speeds
for the feed flow to RDC-2 and Figure 3-7 for the total flow to RDC-2.
in 149.5 376.65 71.6% out 1662 386.6646 18.9%out 149.5 109.761 42.3% in 1662 119.7756 6.72%in 149.5 109.761 42.3% out 1662 119.7756 6.72%
out 149.5 41.35358 21.7% in 1662 51.36818 3.00%
in 149.5 41.35358 21.7% out 1414.6 41.86818 2.87%out 149.5 18.55839 11.0% in 1414.6 19.07299 1.33%in 149.5 18.55839 11.0% out 1414.6 19.07299 1.33%
out 149.5 8.051448 5.1% in 1414.6 8.566048 0.60%in 149.5 8.051448 5.1% out 1414.6 8.566048 0.60%
out 149.5 3.683366 2.40% in 1414.6 4.197966 0.30%in 149.5 3.683366 2.40% out 1414.6 4.197966 0.30%
out 149.5 1.863758 1.23% in 1414.6 2.378358 0.17%in 149.5 1.863758 1.23% out 1414.6 2.378358 0.17%
out 149.5 1.052013 0.70% in 1414.6 1.566613 0.11%in 149.5 1.052013 0.70% out 1414.6 1.566613 0.11%
out 149.5 0.719985 0.48% in 1414.6 1.234585 0.09%
0.24
0.23
KD
0.45
0.31
0.26
0.26
0.25
0.24
1
2
3
Stage FEEDlbs
Waterlbs CPL in Raffinate
% CPL Raffinate SOLVENT
lbs Benzene
lbs CPL in Extract
% CPL Extract
7
8
4
5
6
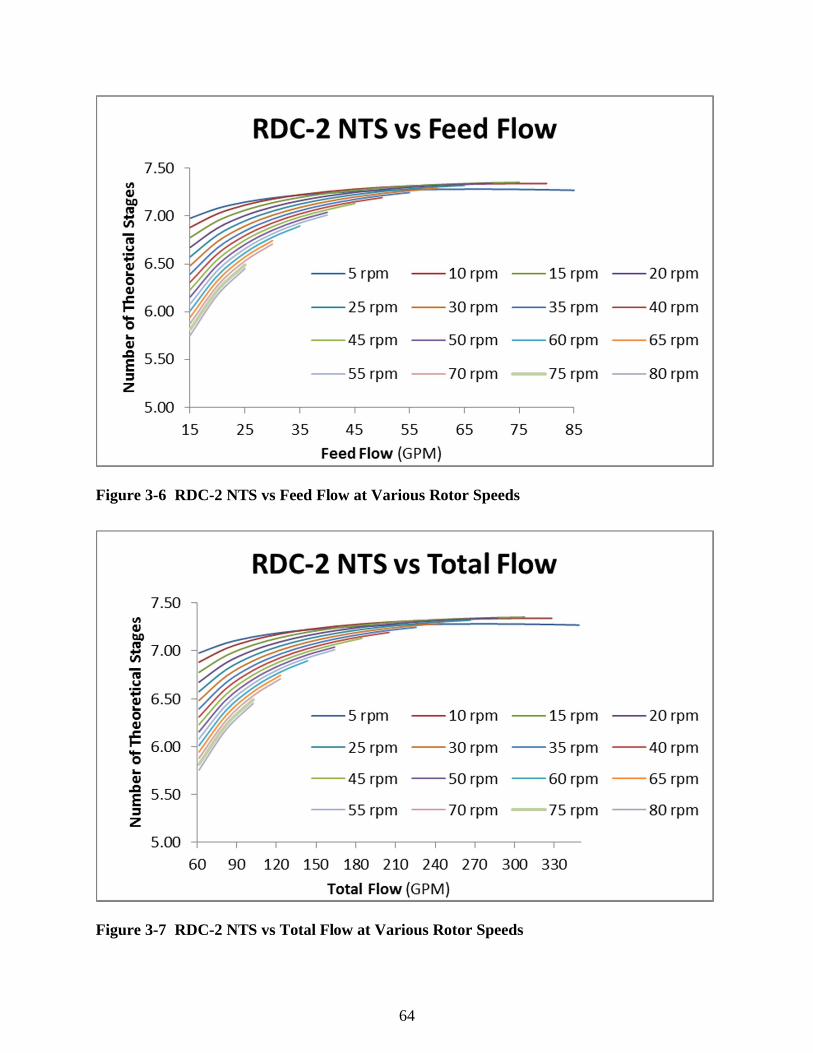
64
Figure 3-6 RDC-2 NTS vs Feed Flow at Various Rotor Speeds
Figure 3-7 RDC-2 NTS vs Total Flow at Various Rotor Speeds
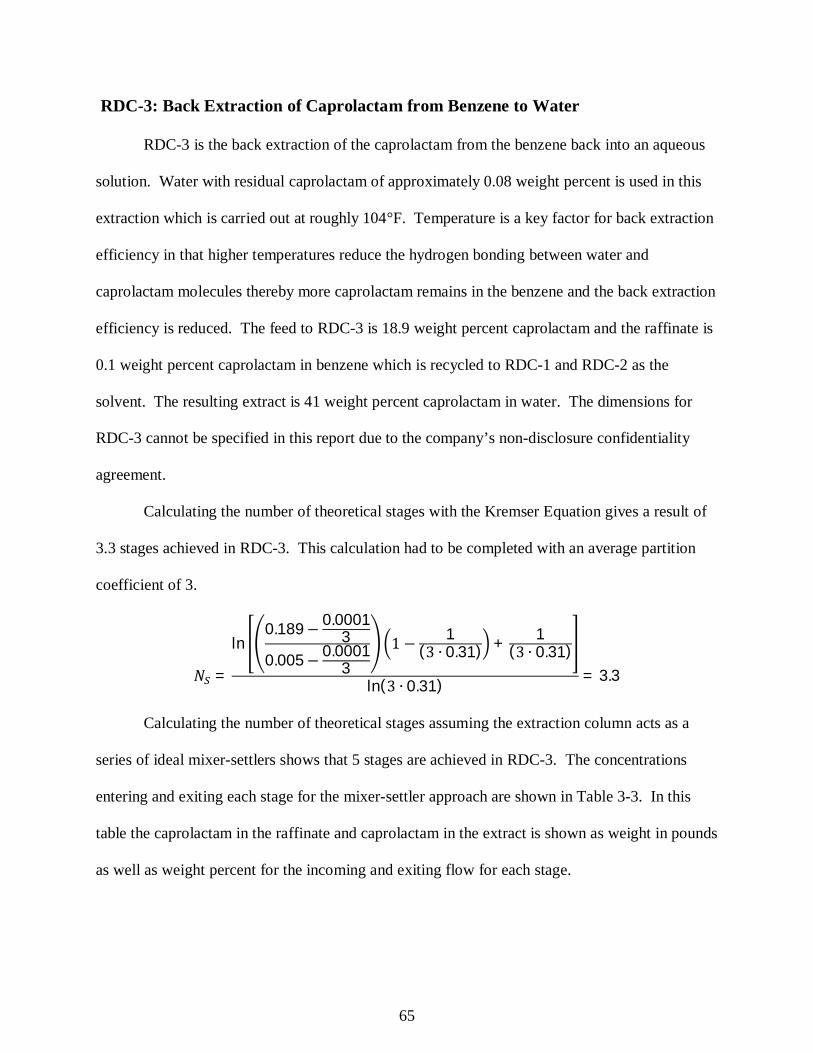
65
RDC-3: Back Extraction of Caprolactam from Benzene to Water
RDC-3 is the back extraction of the caprolactam from the benzene back into an aqueous
solution. Water with residual caprolactam of approximately 0.08 weight percent is used in this
extraction which is carried out at roughly 104°F. Temperature is a key factor for back extraction
efficiency in that higher temperatures reduce the hydrogen bonding between water and
caprolactam molecules thereby more caprolactam remains in the benzene and the back extraction
efficiency is reduced. The feed to RDC-3 is 18.9 weight percent caprolactam and the raffinate is
0.1 weight percent caprolactam in benzene which is recycled to RDC-1 and RDC-2 as the
solvent. The resulting extract is 41 weight percent caprolactam in water. The dimensions for
RDC-3 cannot be specified in this report due to the company’s non-disclosure confidentiality
agreement.
Calculating the number of theoretical stages with the Kremser Equation gives a result of
3.3 stages achieved in RDC-3. This calculation had to be completed with an average partition
coefficient of 3.
=
ln0.189 0.0001
30.005 0.0001
3
1( 0.31) + 1
( 0.31)
ln( 0.31) = 3.3
Calculating the number of theoretical stages assuming the extraction column acts as a
series of ideal mixer-settlers shows that 5 stages are achieved in RDC-3. The concentrations
entering and exiting each stage for the mixer-settler approach are shown in Table 3-3. In this
table the caprolactam in the raffinate and caprolactam in the extract is shown as weight in pounds
as well as weight percent for the incoming and exiting flow for each stage.
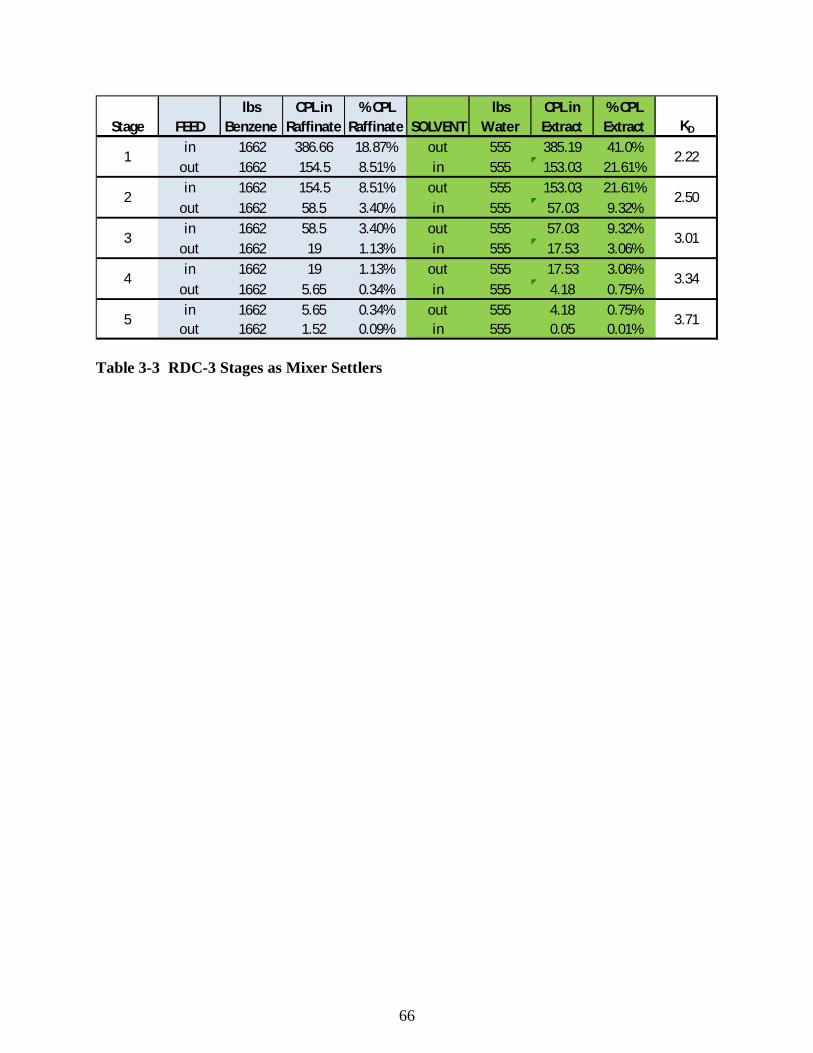
66
Table 3-3 RDC-3 Stages as Mixer Settlers
in 1662 386.66 18.87% out 555 385.19 41.0%out 1662 154.5 8.51% in 555 153.03 21.61%in 1662 154.5 8.51% out 555 153.03 21.61%
out 1662 58.5 3.40% in 555 57.03 9.32%in 1662 58.5 3.40% out 555 57.03 9.32%
out 1662 19 1.13% in 555 17.53 3.06%in 1662 19 1.13% out 555 17.53 3.06%
out 1662 5.65 0.34% in 555 4.18 0.75%in 1662 5.65 0.34% out 555 4.18 0.75%
out 1662 1.52 0.09% in 555 0.05 0.01%
lbs Water
CPL in Extract
5 3.71
% CPL Extract KD
1 2.22
2 2.50
3 3.01
4 3.34
Stage FEEDlbs
BenzeneCPL in
Raffinate% CPL
Raffinate SOLVENT
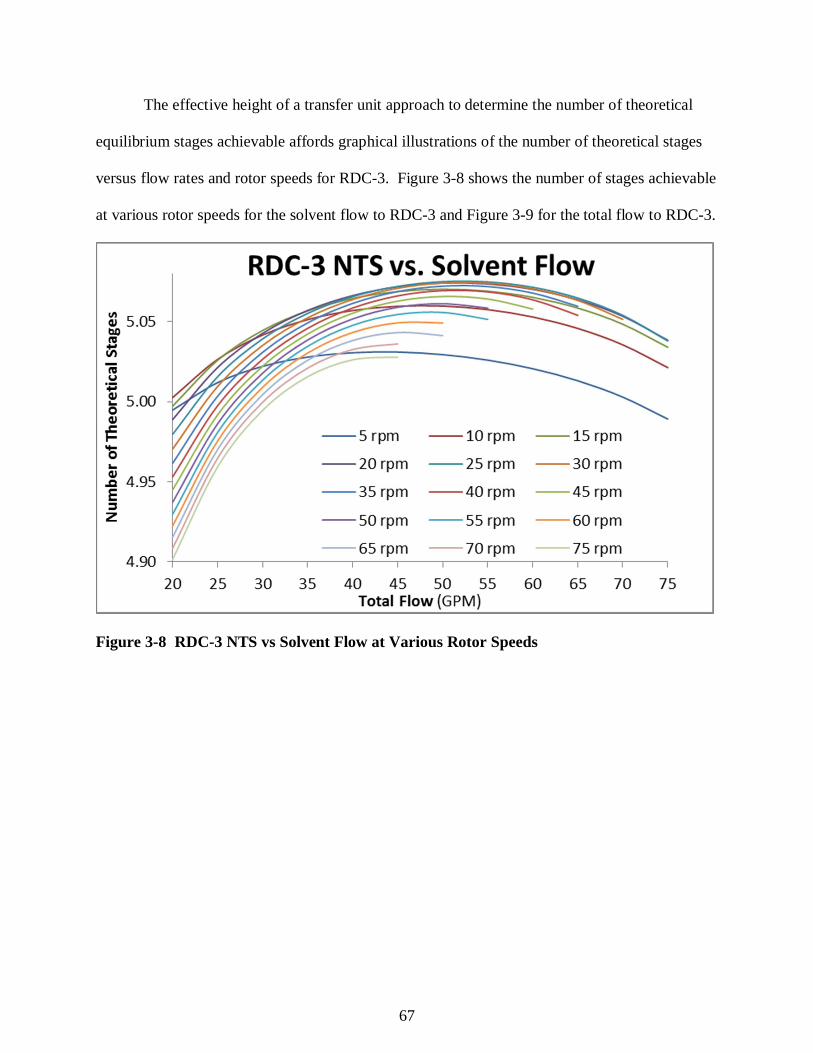
67
The effective height of a transfer unit approach to determine the number of theoretical
equilibrium stages achievable affords graphical illustrations of the number of theoretical stages
versus flow rates and rotor speeds for RDC-3. Figure 3-8 shows the number of stages achievable
at various rotor speeds for the solvent flow to RDC-3 and Figure 3-9 for the total flow to RDC-3.
Figure 3-8 RDC-3 NTS vs Solvent Flow at Various Rotor Speeds
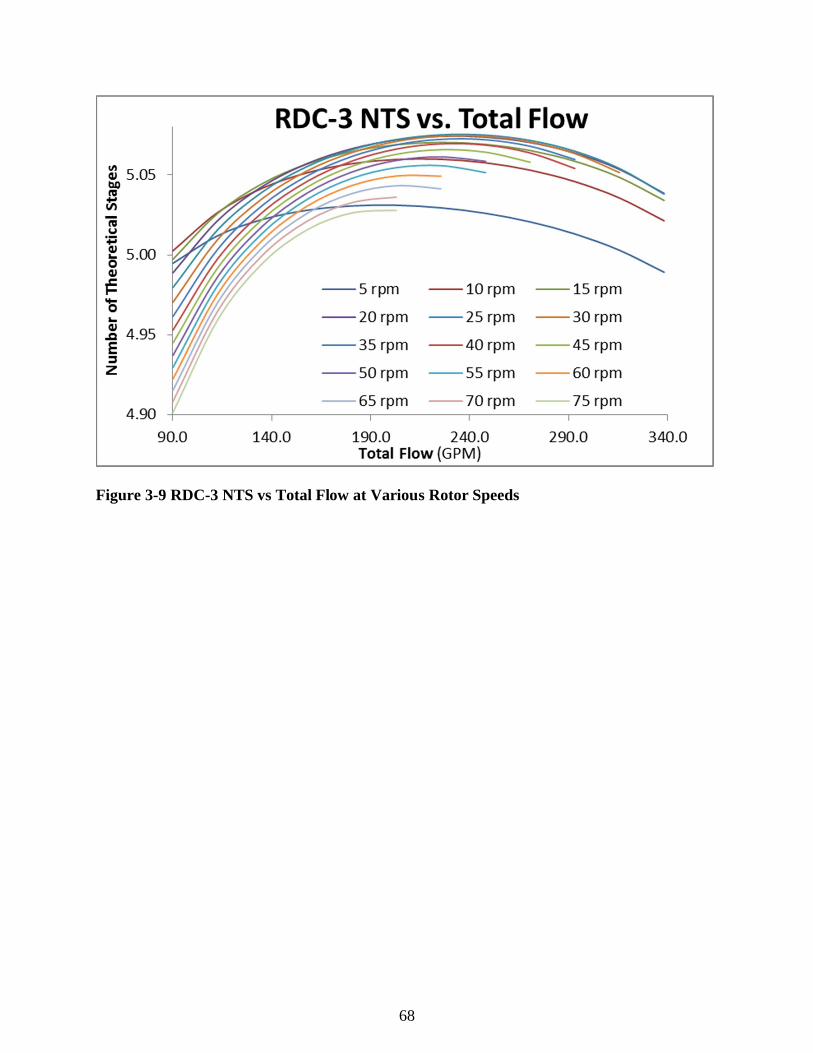
68
Figure 3-9 RDC-3 NTS vs Total Flow at Various Rotor Speeds
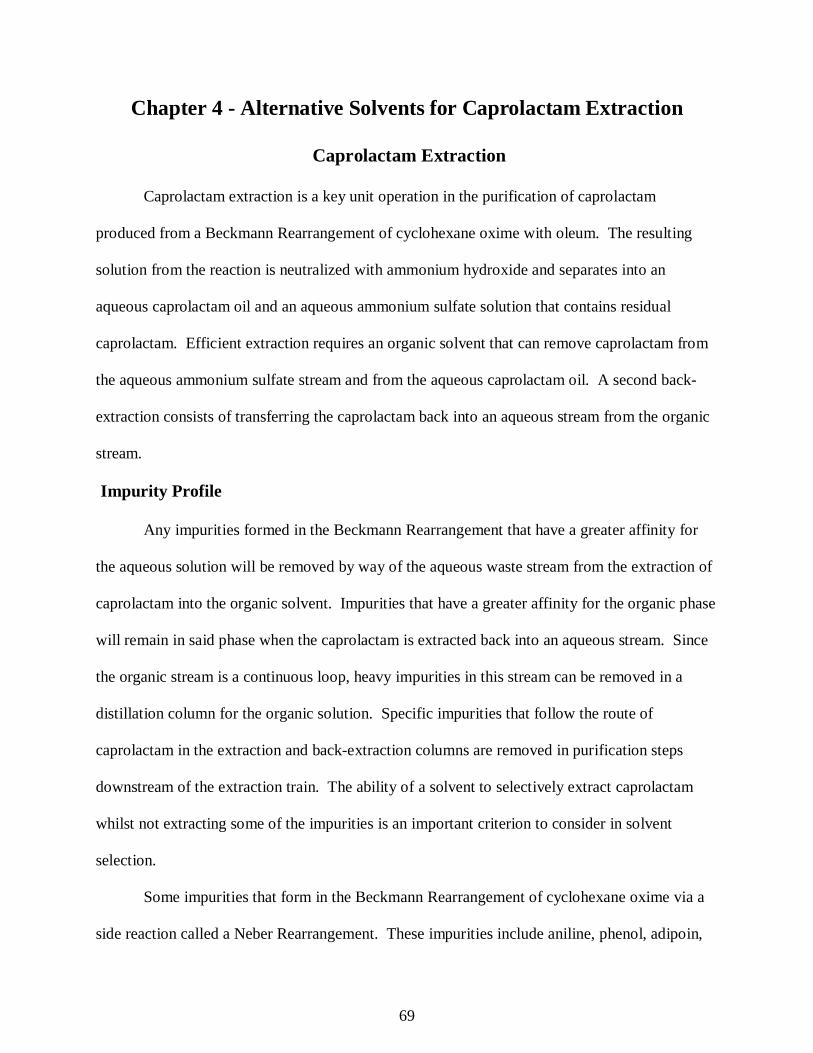
69
Chapter 4 - Alternative Solvents for Caprolactam Extraction
Caprolactam Extraction
Caprolactam extraction is a key unit operation in the purification of caprolactam
produced from a Beckmann Rearrangement of cyclohexane oxime with oleum. The resulting
solution from the reaction is neutralized with ammonium hydroxide and separates into an
aqueous caprolactam oil and an aqueous ammonium sulfate solution that contains residual
caprolactam. Efficient extraction requires an organic solvent that can remove caprolactam from
the aqueous ammonium sulfate stream and from the aqueous caprolactam oil. A second back-
extraction consists of transferring the caprolactam back into an aqueous stream from the organic
stream.
Impurity Profile
Any impurities formed in the Beckmann Rearrangement that have a greater affinity for
the aqueous solution will be removed by way of the aqueous waste stream from the extraction of
caprolactam into the organic solvent. Impurities that have a greater affinity for the organic phase
will remain in said phase when the caprolactam is extracted back into an aqueous stream. Since
the organic stream is a continuous loop, heavy impurities in this stream can be removed in a
distillation column for the organic solution. Specific impurities that follow the route of
caprolactam in the extraction and back-extraction columns are removed in purification steps
downstream of the extraction train. The ability of a solvent to selectively extract caprolactam
whilst not extracting some of the impurities is an important criterion to consider in solvent
selection.
Some impurities that form in the Beckmann Rearrangement of cyclohexane oxime via a
side reaction called a Neber Rearrangement. These impurities include aniline, phenol, adipoin,
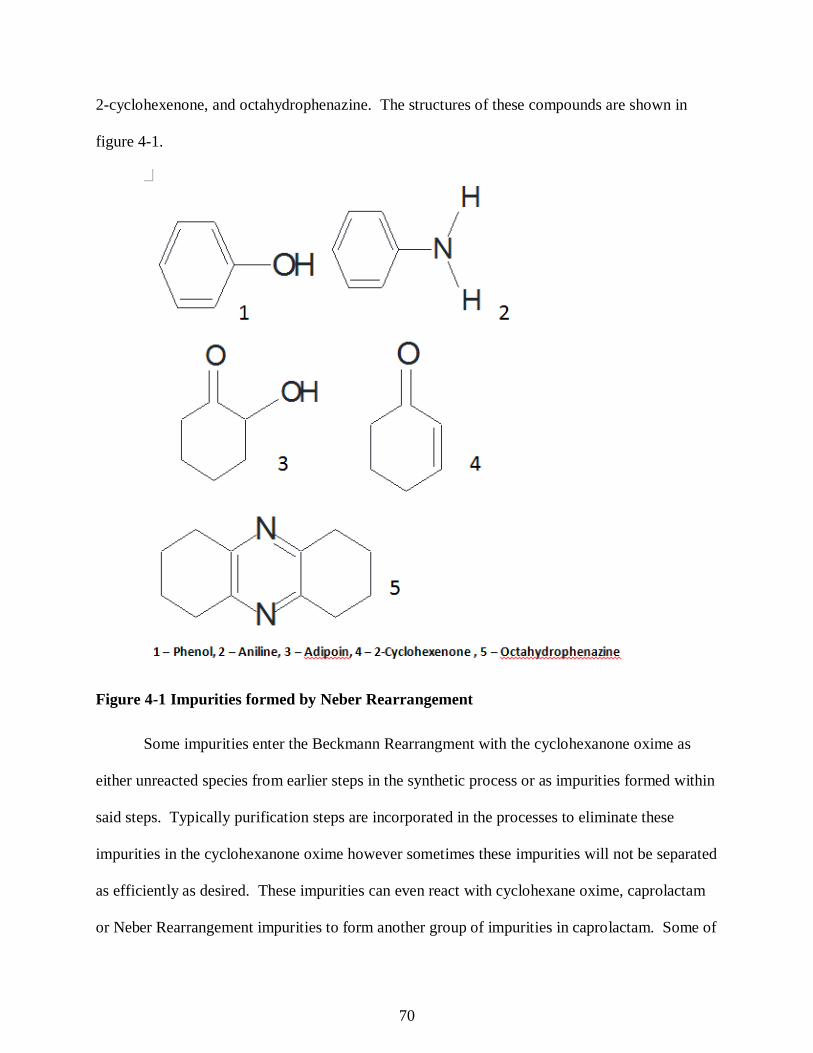
70
2-cyclohexenone, and octahydrophenazine. The structures of these compounds are shown in
figure 4-1.
Figure 4-1 Impurities formed by Neber Rearrangement
Some impurities enter the Beckmann Rearrangment with the cyclohexanone oxime as
either unreacted species from earlier steps in the synthetic process or as impurities formed within
said steps. Typically purification steps are incorporated in the processes to eliminate these
impurities in the cyclohexanone oxime however sometimes these impurities will not be separated
as efficiently as desired. These impurities can even react with cyclohexane oxime, caprolactam
or Neber Rearrangement impurities to form another group of impurities in caprolactam. Some of
71
the impurities that enter the Beckmann Rearrangment or that are generated by impurities entering
this reaction include toluene, cyclohexaonone, aminocaproic acid, OHCO, DODO, and
cyclohexenyl cyclohexanone. The latter four of these impurities are shown in figure 4-2.
Figure 4-2 Impurities in Caprolactam due to Purity of Cyclohexanone Oxime
Other impurities that have to be separated from caprolactam include ammonium sulfate,
residual ammonia, sulfur dioxide and oligomers formed by polymerization of caprolactam
molecules. These impurities have a significant affinity for water over organic solvents and tend
to remain in the aqueous raffinate of the extraction of caprolactam from the caprolactam rich oil.
Solvent Selection Requirements
The first fundamental measure for selecting an appropriate solvent is considering the
capacity for caprolactam solubility in the solvent. If a solvent has a low capacity then
unreasonably large extraction columns are required as well as significant volumes of solvent.
The partition coefficient is a ratio of caprolactam concentration in the raffinate and extract
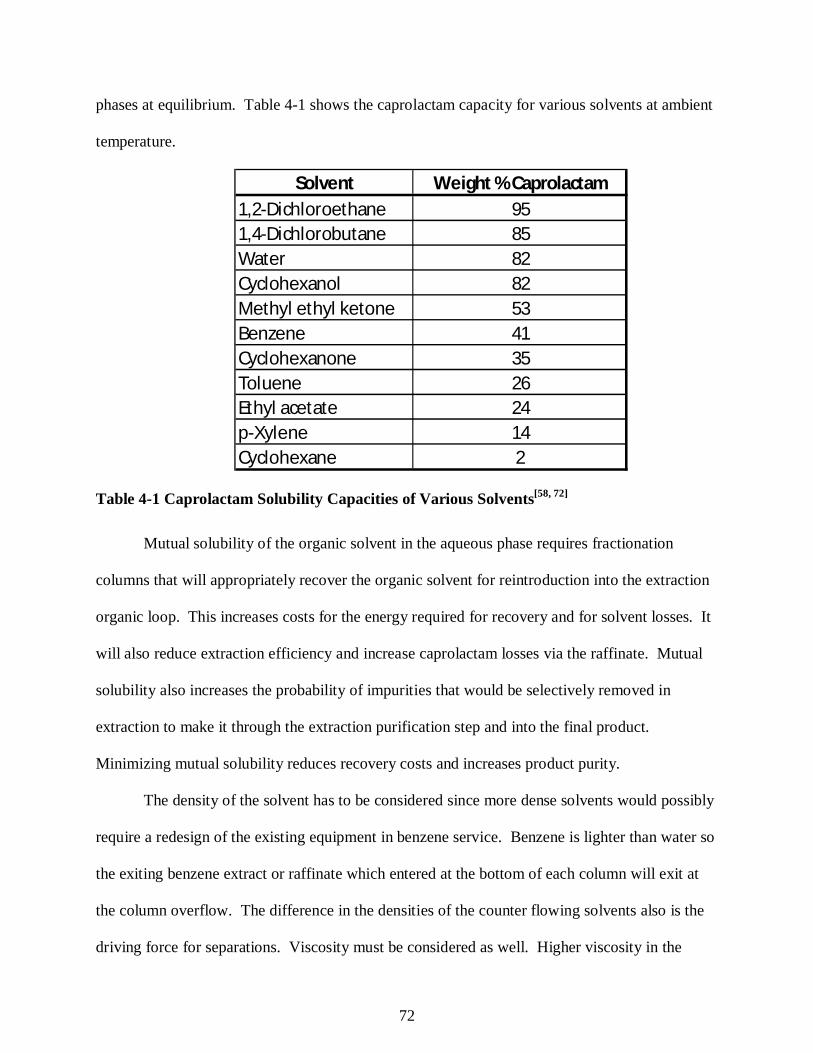
72
phases at equilibrium. Table 4-1 shows the caprolactam capacity for various solvents at ambient
temperature.
Table 4-1 Caprolactam Solubility Capacities of Various Solvents[58, 72]
Mutual solubility of the organic solvent in the aqueous phase requires fractionation
columns that will appropriately recover the organic solvent for reintroduction into the extraction
organic loop. This increases costs for the energy required for recovery and for solvent losses. It
will also reduce extraction efficiency and increase caprolactam losses via the raffinate. Mutual
solubility also increases the probability of impurities that would be selectively removed in
extraction to make it through the extraction purification step and into the final product.
Minimizing mutual solubility reduces recovery costs and increases product purity.
The density of the solvent has to be considered since more dense solvents would possibly
require a redesign of the existing equipment in benzene service. Benzene is lighter than water so
the exiting benzene extract or raffinate which entered at the bottom of each column will exit at
the column overflow. The difference in the densities of the counter flowing solvents also is the
driving force for separations. Viscosity must be considered as well. Higher viscosity in the
Solvent Weight % Caprolactam1,2-Dichloroethane 951,4-Dichlorobutane 85Water 82Cyclohexanol 82Methyl ethyl ketone 53Benzene 41Cyclohexanone 35Toluene 26Ethyl acetate 24p-Xylene 14Cyclohexane 2
73
continuous phase results in higher drag coefficients for drops, and higher viscosity in the
dispersed phase results in higher power requirements for drop breakage. Lower viscosity in the
continuous phase results in a reduced resistance for traveling of drops and is helpful for phase
separation.
Interfacial tension is of high importance in that this determines the amount of surface area
that can be achieved in a solvent system. Higher surface area results in more probable solute
transfer which increases extraction efficiency. If the surface area is at or close to minimum, then
poor extraction efficiency can be expected. Lower interfacial tension means there will be more
droplet breakage and smaller drop size which means more surface area for solute transfer.
However higher interfacial tension leads to quicker phase separation. Therefore it is important to
find a solvent system that has high enough surface tension to allow for phase separation but low
enough so that the droplets of the dispersed phase can be broken by the agitation to increase
surface area.
Chemical reactivity and stability should also be considered in selecting a solvent for
caprolactam extraction as well as the freezing point and vapor pressure of the solvent. Toxicity
and flammability are key characteristics that have to be considered as these two characteristics
are the reason for searching out an alternative solvent to benzene.
Solvents
Water
Water is a unique solvent that has a permanent dipole moment and has significant
hydrogen bonding between its molecules which leads to the high surface tension. Since water is
introduced in the neutralization step after the Beckmann Rearrangment, the caprolactam
(C6H11NO) oil that is separated from the aqueous ammonium sulfate contains 25-29% water.
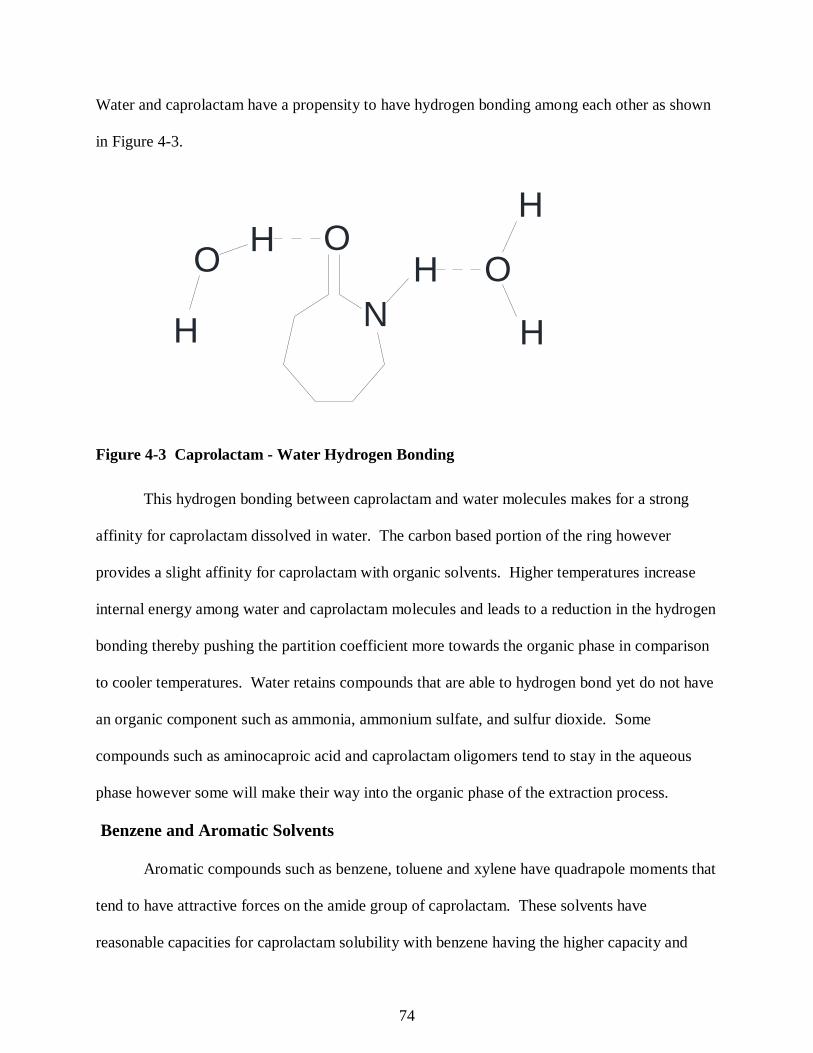
74
Water and caprolactam have a propensity to have hydrogen bonding among each other as shown
in Figure 4-3.
O
NHO H
H
O
H
H
Figure 4-3 Caprolactam - Water Hydrogen Bonding
This hydrogen bonding between caprolactam and water molecules makes for a strong
affinity for caprolactam dissolved in water. The carbon based portion of the ring however
provides a slight affinity for caprolactam with organic solvents. Higher temperatures increase
internal energy among water and caprolactam molecules and leads to a reduction in the hydrogen
bonding thereby pushing the partition coefficient more towards the organic phase in comparison
to cooler temperatures. Water retains compounds that are able to hydrogen bond yet do not have
an organic component such as ammonia, ammonium sulfate, and sulfur dioxide. Some
compounds such as aminocaproic acid and caprolactam oligomers tend to stay in the aqueous
phase however some will make their way into the organic phase of the extraction process.
Benzene and Aromatic Solvents
Aromatic compounds such as benzene, toluene and xylene have quadrapole moments that
tend to have attractive forces on the amide group of caprolactam. These solvents have
reasonable capacities for caprolactam solubility with benzene having the higher capacity and
75
xylene having the lower capacity. The methyl groups on the aromatic ring are activating electron
donating substituents that produce a permanent dipole moment in the molecule however these
groups reduce packing capabilities due to steric hindrance. Less ability for the molecules to pack
more closely reduces the intermolecular forces. The partition coefficient of caprolactam
dissolved in the aqueous phase versus caprolactam dissolved in the organic phase also follows
the same pattern with benzene having the largest partition coefficient and xylene having the
lowest. Nitrobenzene has an electron withdrawing group which is a zwitterion that has more
attractive forces with caprolactam in comparison to toluene and xylene, however the functional
group also reduces packing abilities; therefore toluene and xylene do not have the caprolactam
solubility capacity of benzene.
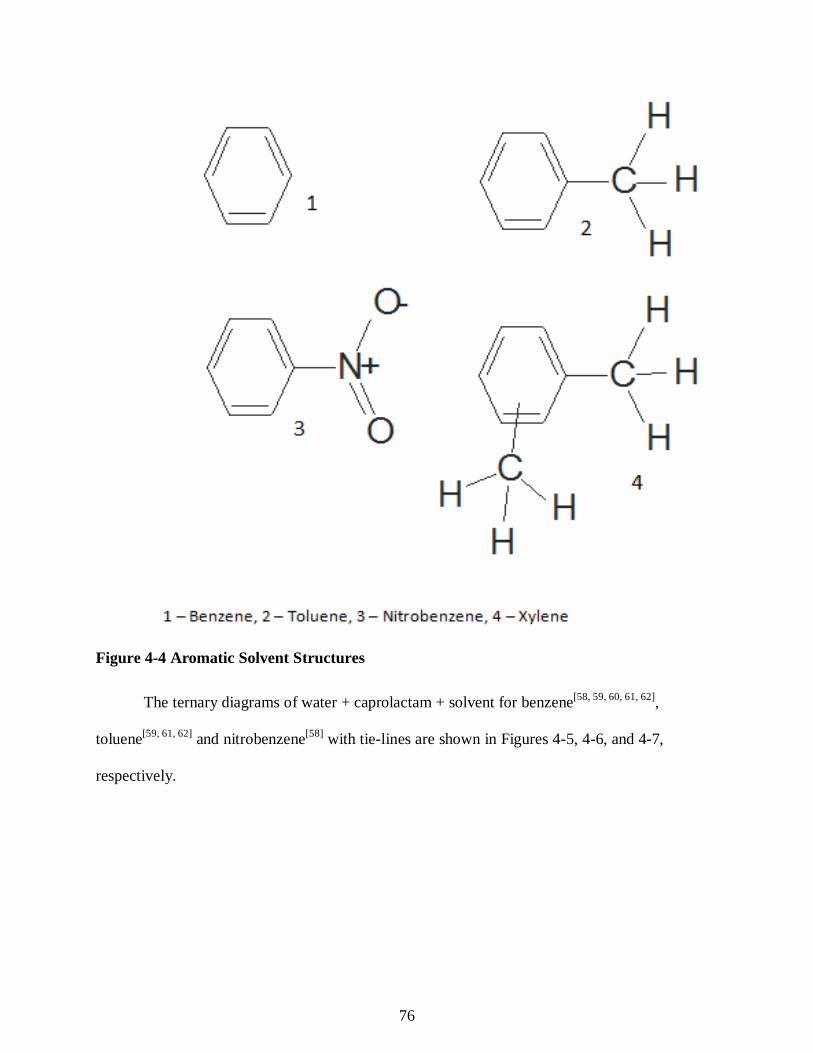
76
Figure 4-4 Aromatic Solvent Structures
The ternary diagrams of water + caprolactam + solvent for benzene[58, 59, 60, 61, 62],
toluene[59, 61, 62] and nitrobenzene[58] with tie-lines are shown in Figures 4-5, 4-6, and 4-7,
respectively.
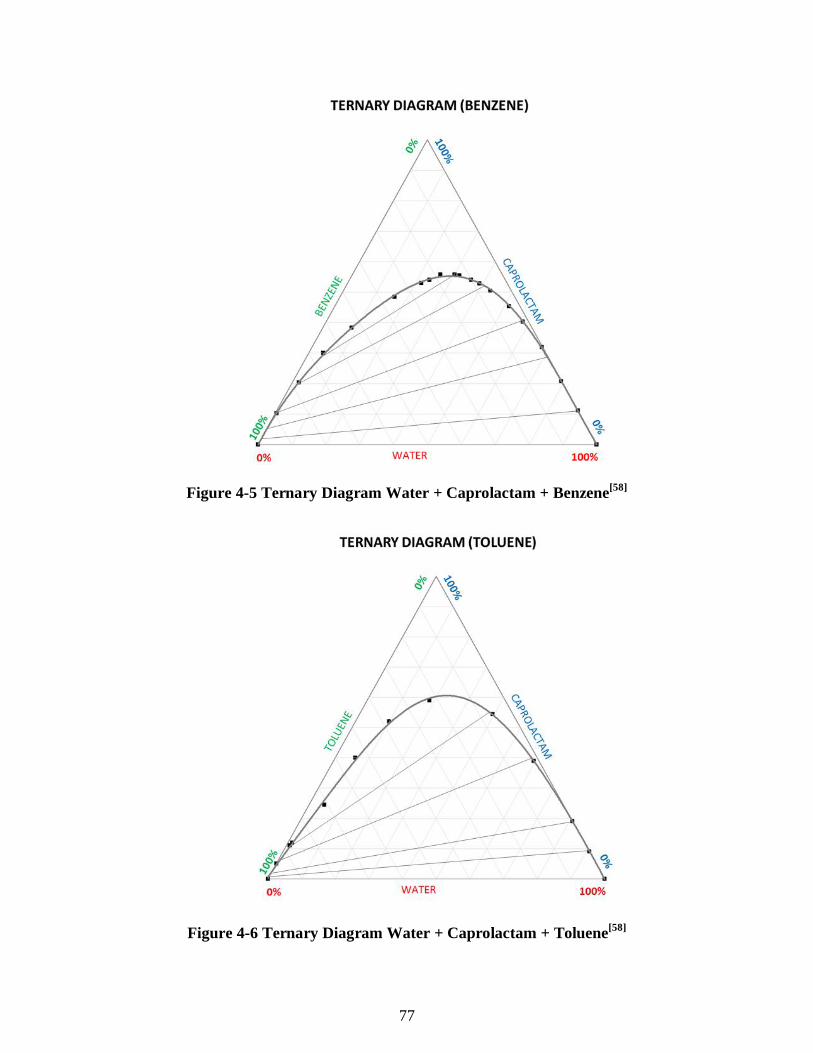
77
Figure 4-5 Ternary Diagram Water + Caprolactam + Benzene[58]
Figure 4-6 Ternary Diagram Water + Caprolactam + Toluene[58]
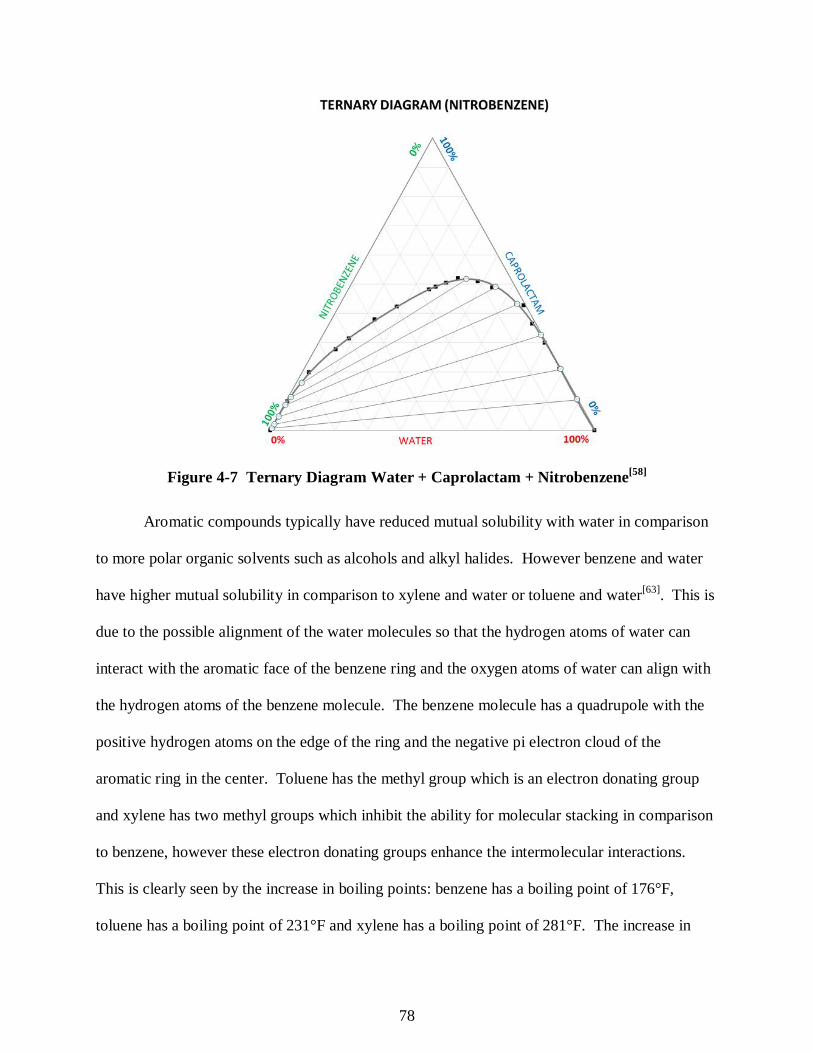
78
Figure 4-7 Ternary Diagram Water + Caprolactam + Nitrobenzene[58]
Aromatic compounds typically have reduced mutual solubility with water in comparison
to more polar organic solvents such as alcohols and alkyl halides. However benzene and water
have higher mutual solubility in comparison to xylene and water or toluene and water[63]. This is
due to the possible alignment of the water molecules so that the hydrogen atoms of water can
interact with the aromatic face of the benzene ring and the oxygen atoms of water can align with
the hydrogen atoms of the benzene molecule. The benzene molecule has a quadrupole with the
positive hydrogen atoms on the edge of the ring and the negative pi electron cloud of the
aromatic ring in the center. Toluene has the methyl group which is an electron donating group
and xylene has two methyl groups which inhibit the ability for molecular stacking in comparison
to benzene, however these electron donating groups enhance the intermolecular interactions.
This is clearly seen by the increase in boiling points: benzene has a boiling point of 176°F,
toluene has a boiling point of 231°F and xylene has a boiling point of 281°F. The increase in
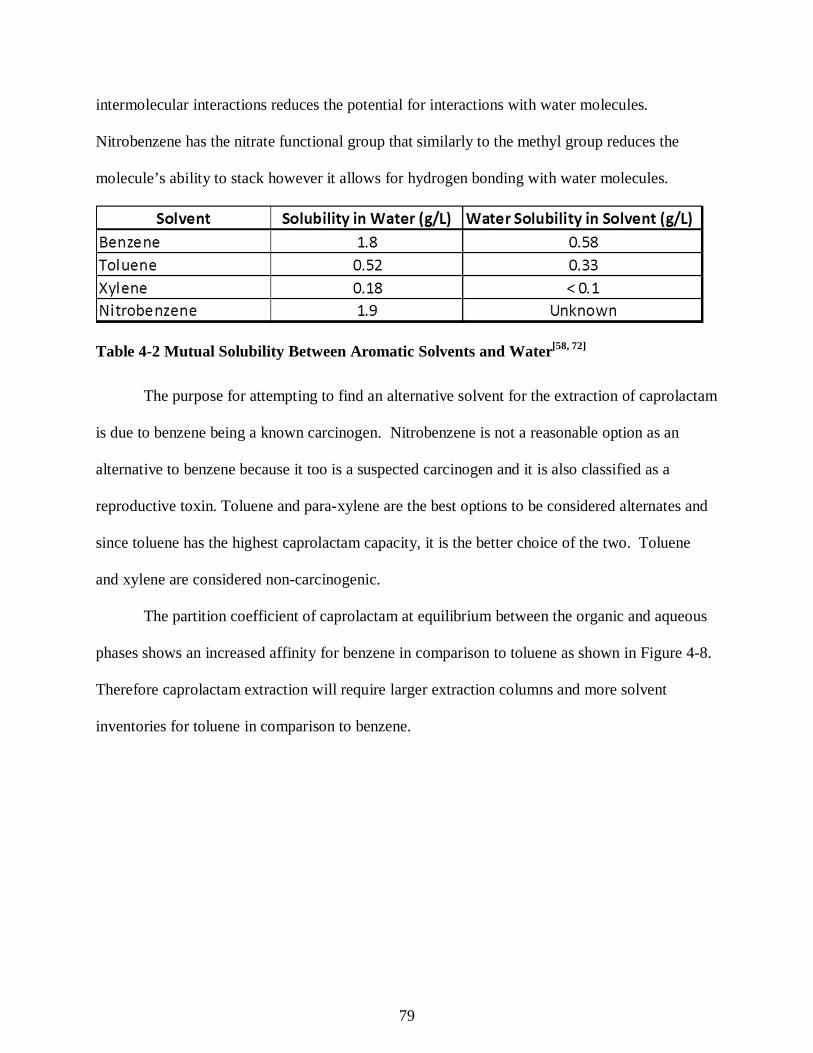
79
intermolecular interactions reduces the potential for interactions with water molecules.
Nitrobenzene has the nitrate functional group that similarly to the methyl group reduces the
molecule’s ability to stack however it allows for hydrogen bonding with water molecules.
Table 4-2 Mutual Solubility Between Aromatic Solvents and Water[58, 72]
The purpose for attempting to find an alternative solvent for the extraction of caprolactam
is due to benzene being a known carcinogen. Nitrobenzene is not a reasonable option as an
alternative to benzene because it too is a suspected carcinogen and it is also classified as a
reproductive toxin. Toluene and para-xylene are the best options to be considered alternates and
since toluene has the highest caprolactam capacity, it is the better choice of the two. Toluene
and xylene are considered non-carcinogenic.
The partition coefficient of caprolactam at equilibrium between the organic and aqueous
phases shows an increased affinity for benzene in comparison to toluene as shown in Figure 4-8.
Therefore caprolactam extraction will require larger extraction columns and more solvent
inventories for toluene in comparison to benzene.
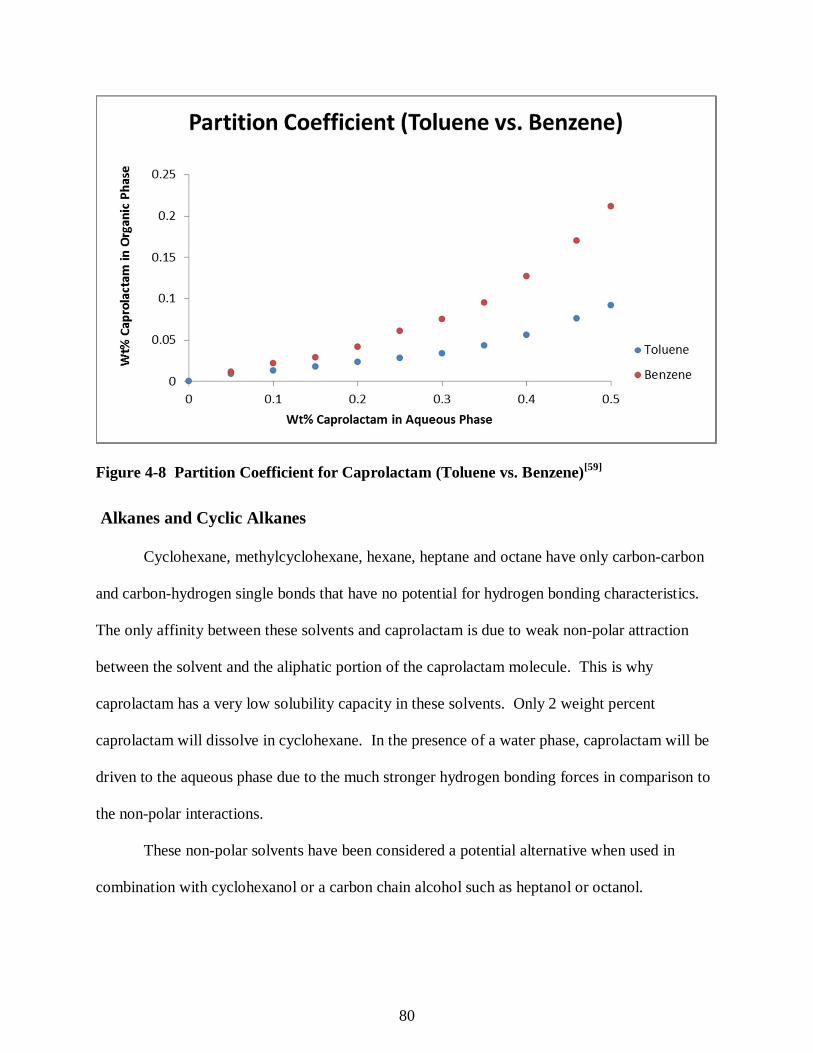
80
Figure 4-8 Partition Coefficient for Caprolactam (Toluene vs. Benzene)[59]
Alkanes and Cyclic Alkanes
Cyclohexane, methylcyclohexane, hexane, heptane and octane have only carbon-carbon
and carbon-hydrogen single bonds that have no potential for hydrogen bonding characteristics.
The only affinity between these solvents and caprolactam is due to weak non-polar attraction
between the solvent and the aliphatic portion of the caprolactam molecule. This is why
caprolactam has a very low solubility capacity in these solvents. Only 2 weight percent
caprolactam will dissolve in cyclohexane. In the presence of a water phase, caprolactam will be
driven to the aqueous phase due to the much stronger hydrogen bonding forces in comparison to
the non-polar interactions.
These non-polar solvents have been considered a potential alternative when used in
combination with cyclohexanol or a carbon chain alcohol such as heptanol or octanol.
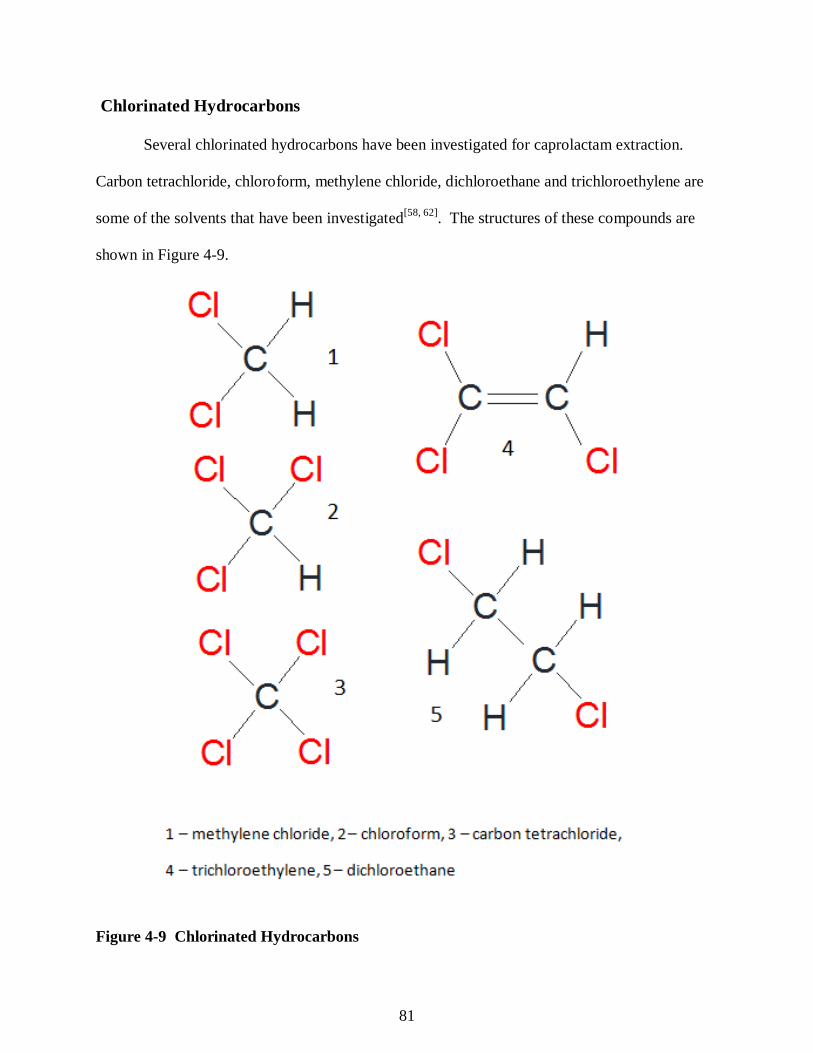
81
Chlorinated Hydrocarbons
Several chlorinated hydrocarbons have been investigated for caprolactam extraction.
Carbon tetrachloride, chloroform, methylene chloride, dichloroethane and trichloroethylene are
some of the solvents that have been investigated[58, 62]. The structures of these compounds are
shown in Figure 4-9.
Figure 4-9 Chlorinated Hydrocarbons
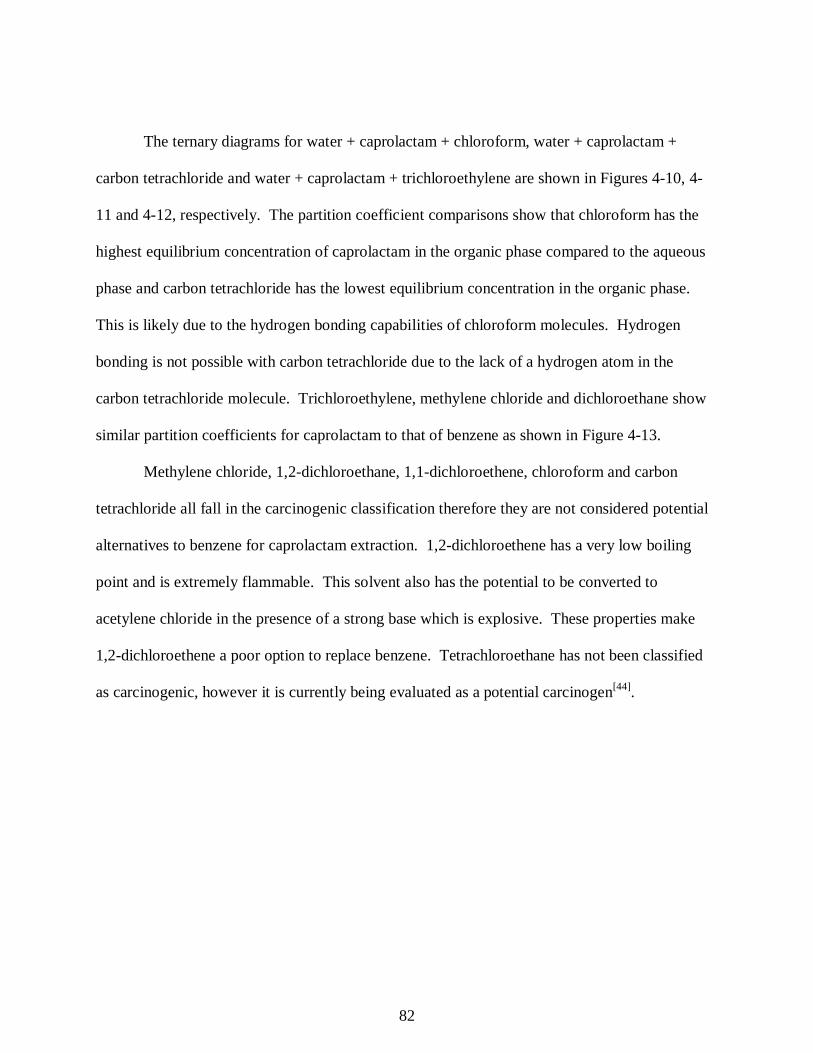
82
The ternary diagrams for water + caprolactam + chloroform, water + caprolactam +
carbon tetrachloride and water + caprolactam + trichloroethylene are shown in Figures 4-10, 4-
11 and 4-12, respectively. The partition coefficient comparisons show that chloroform has the
highest equilibrium concentration of caprolactam in the organic phase compared to the aqueous
phase and carbon tetrachloride has the lowest equilibrium concentration in the organic phase.
This is likely due to the hydrogen bonding capabilities of chloroform molecules. Hydrogen
bonding is not possible with carbon tetrachloride due to the lack of a hydrogen atom in the
carbon tetrachloride molecule. Trichloroethylene, methylene chloride and dichloroethane show
similar partition coefficients for caprolactam to that of benzene as shown in Figure 4-13.
Methylene chloride, 1,2-dichloroethane, 1,1-dichloroethene, chloroform and carbon
tetrachloride all fall in the carcinogenic classification therefore they are not considered potential
alternatives to benzene for caprolactam extraction. 1,2-dichloroethene has a very low boiling
point and is extremely flammable. This solvent also has the potential to be converted to
acetylene chloride in the presence of a strong base which is explosive. These properties make
1,2-dichloroethene a poor option to replace benzene. Tetrachloroethane has not been classified
as carcinogenic, however it is currently being evaluated as a potential carcinogen[44].
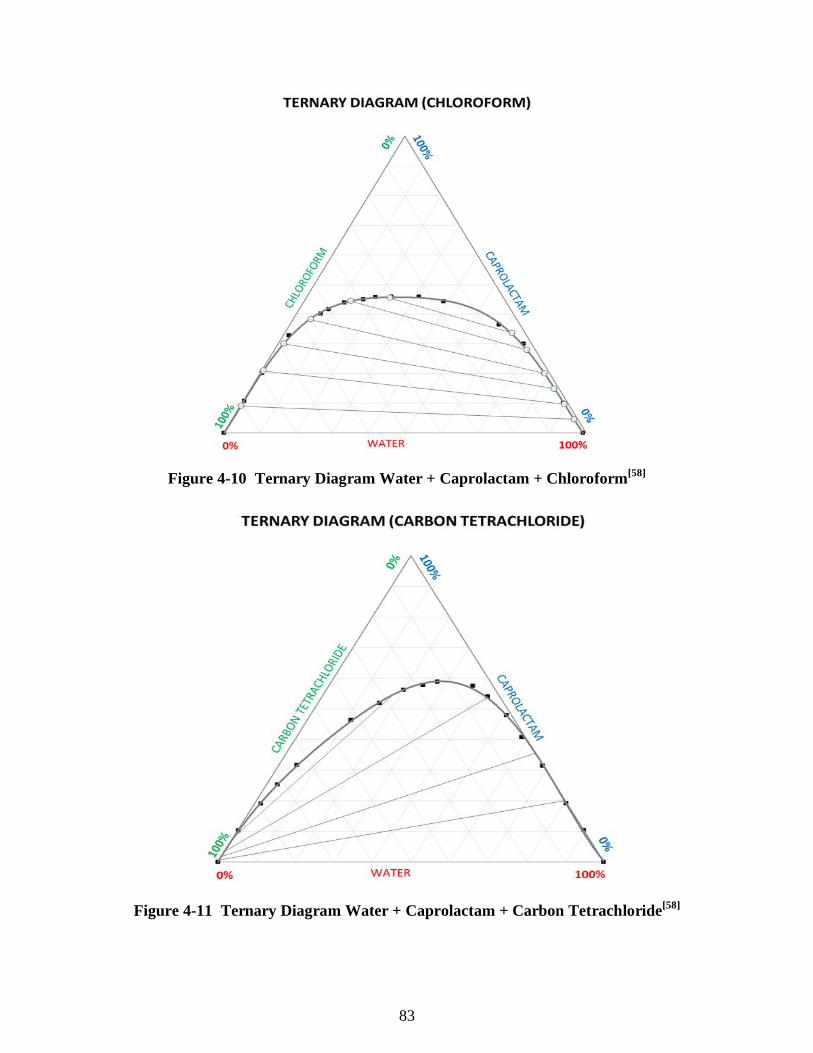
83
Figure 4-10 Ternary Diagram Water + Caprolactam + Chloroform[58]
Figure 4-11 Ternary Diagram Water + Caprolactam + Carbon Tetrachloride[58]
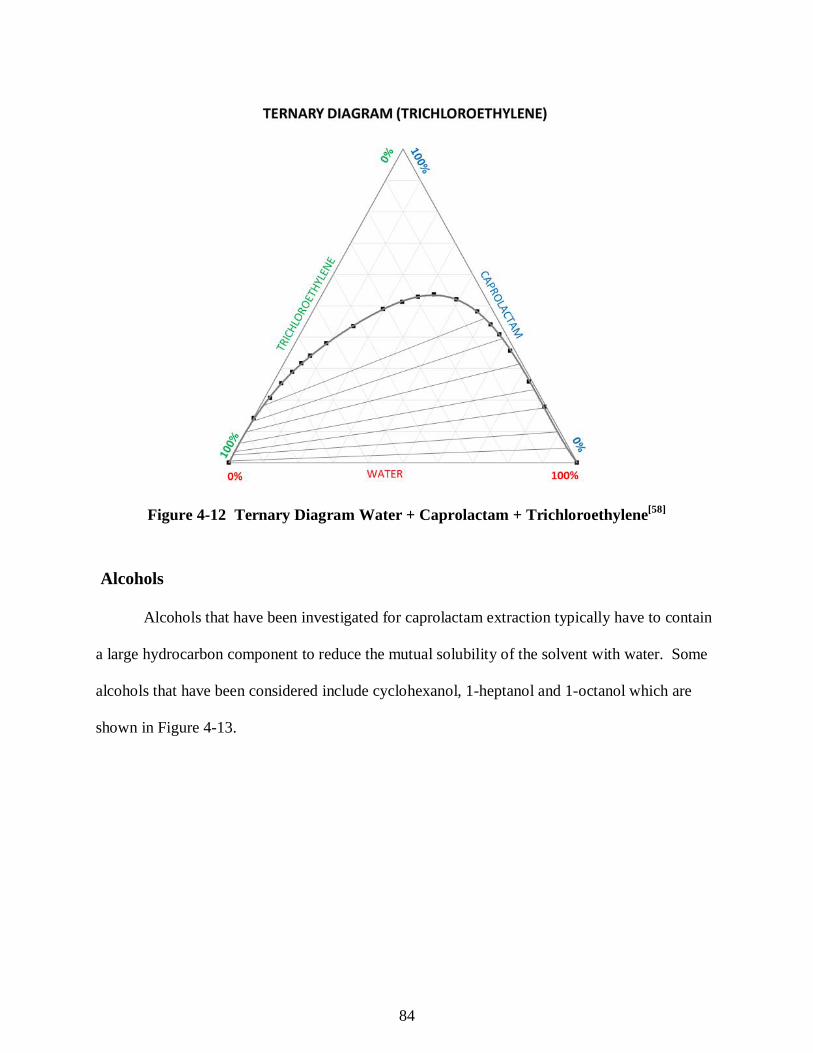
84
Figure 4-12 Ternary Diagram Water + Caprolactam + Trichloroethylene[58]
Alcohols
Alcohols that have been investigated for caprolactam extraction typically have to contain
a large hydrocarbon component to reduce the mutual solubility of the solvent with water. Some
alcohols that have been considered include cyclohexanol, 1-heptanol and 1-octanol which are
shown in Figure 4-13.
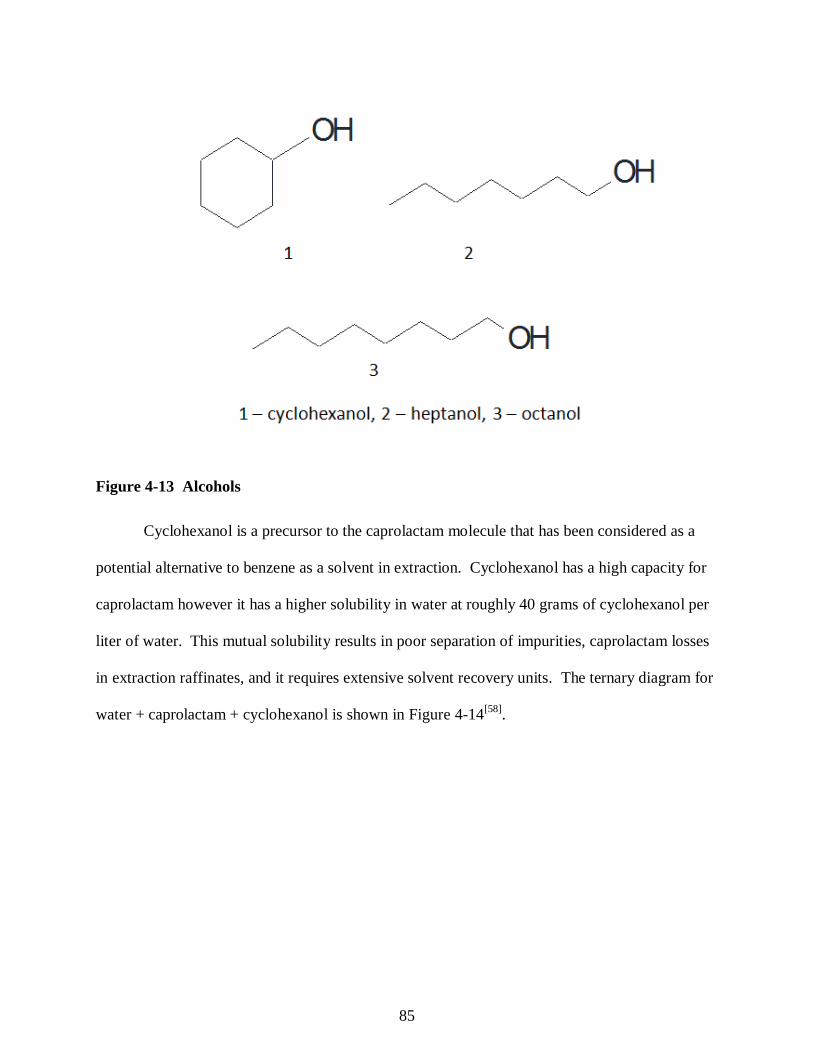
85
Figure 4-13 Alcohols
Cyclohexanol is a precursor to the caprolactam molecule that has been considered as a
potential alternative to benzene as a solvent in extraction. Cyclohexanol has a high capacity for
caprolactam however it has a higher solubility in water at roughly 40 grams of cyclohexanol per
liter of water. This mutual solubility results in poor separation of impurities, caprolactam losses
in extraction raffinates, and it requires extensive solvent recovery units. The ternary diagram for
water + caprolactam + cyclohexanol is shown in Figure 4-14[58].
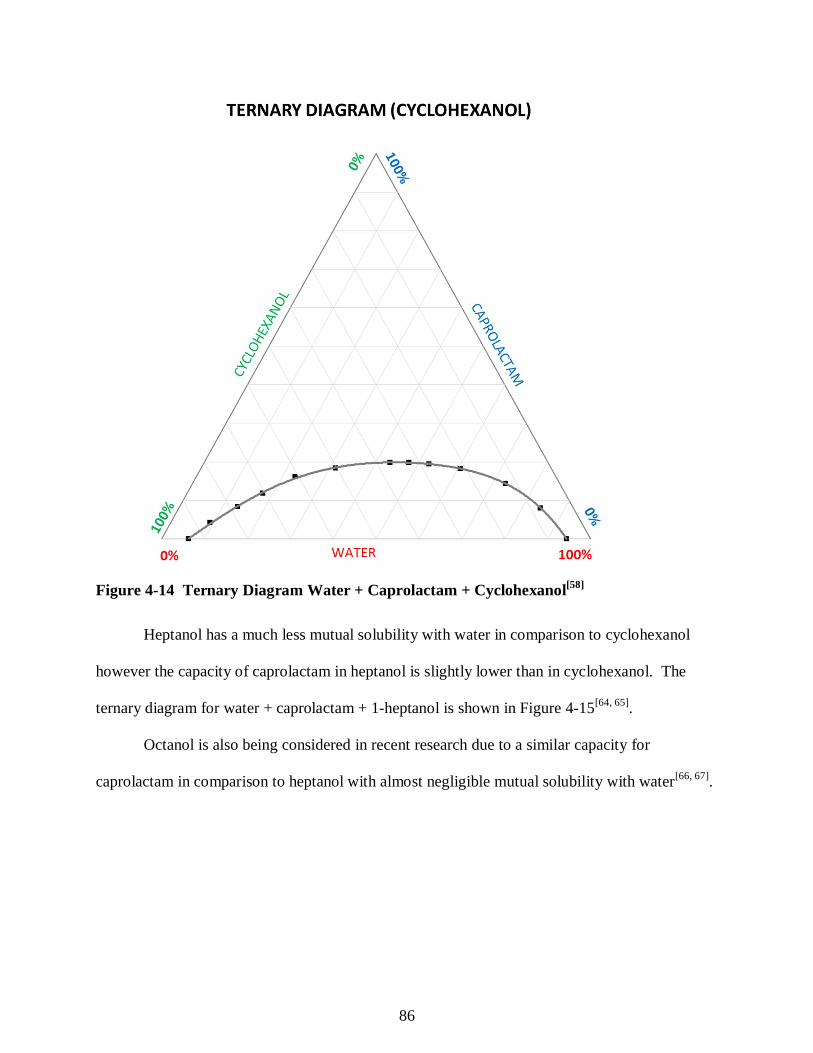
86
Figure 4-14 Ternary Diagram Water + Caprolactam + Cyclohexanol[58]
Heptanol has a much less mutual solubility with water in comparison to cyclohexanol
however the capacity of caprolactam in heptanol is slightly lower than in cyclohexanol. The
ternary diagram for water + caprolactam + 1-heptanol is shown in Figure 4-15[64, 65].
Octanol is also being considered in recent research due to a similar capacity for
caprolactam in comparison to heptanol with almost negligible mutual solubility with water[66, 67].
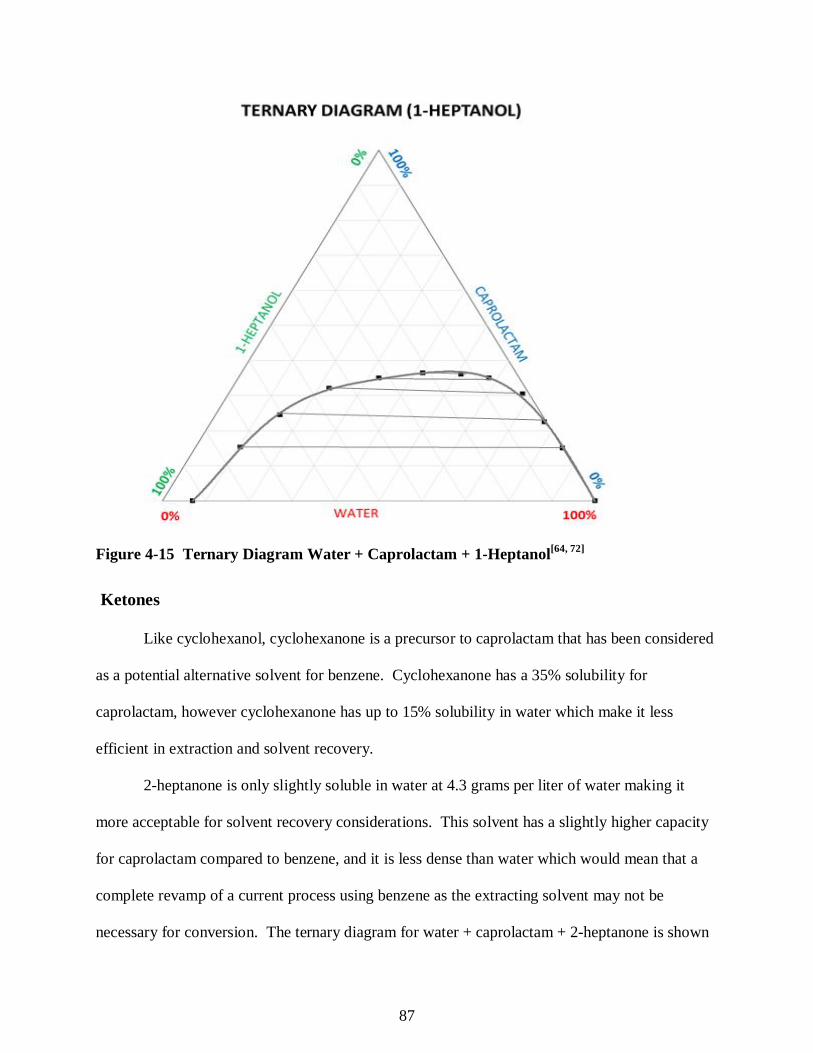
87
Figure 4-15 Ternary Diagram Water + Caprolactam + 1-Heptanol[64, 72]
Ketones
Like cyclohexanol, cyclohexanone is a precursor to caprolactam that has been considered
as a potential alternative solvent for benzene. Cyclohexanone has a 35% solubility for
caprolactam, however cyclohexanone has up to 15% solubility in water which make it less
efficient in extraction and solvent recovery.
2-heptanone is only slightly soluble in water at 4.3 grams per liter of water making it
more acceptable for solvent recovery considerations. This solvent has a slightly higher capacity
for caprolactam compared to benzene, and it is less dense than water which would mean that a
complete revamp of a current process using benzene as the extracting solvent may not be
necessary for conversion. The ternary diagram for water + caprolactam + 2-heptanone is shown
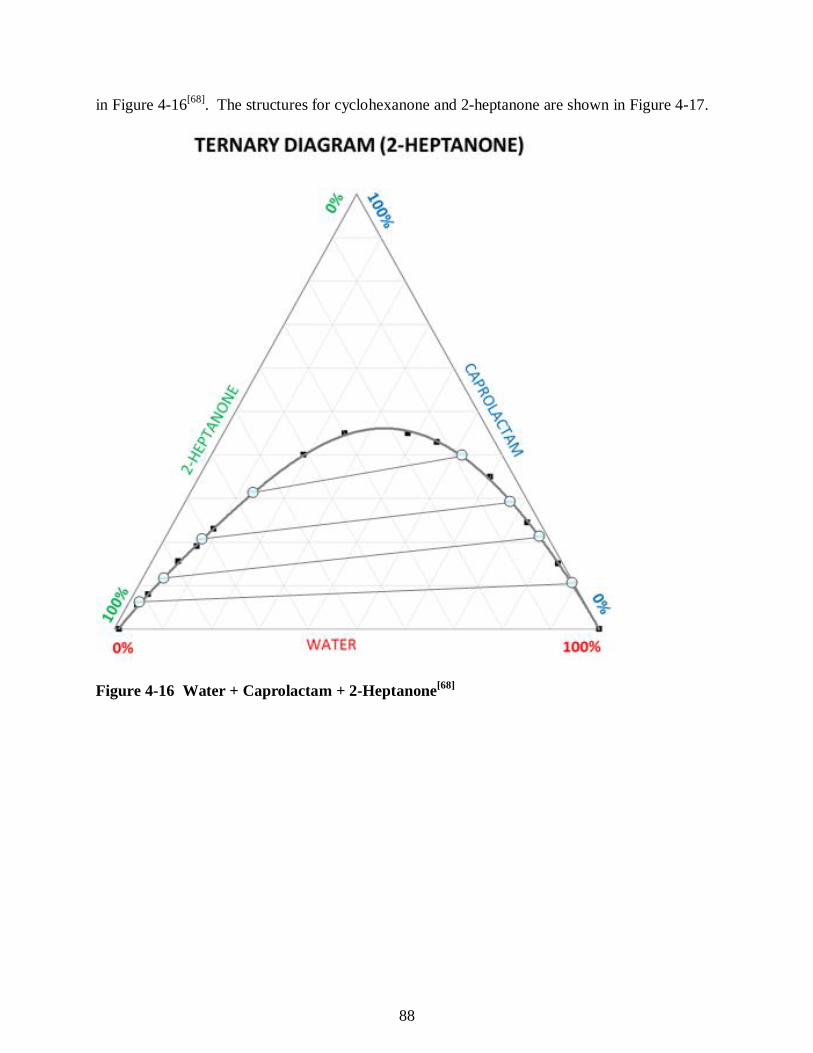
88
in Figure 4-16[68]. The structures for cyclohexanone and 2-heptanone are shown in Figure 4-17.
Figure 4-16 Water + Caprolactam + 2-Heptanone[68]
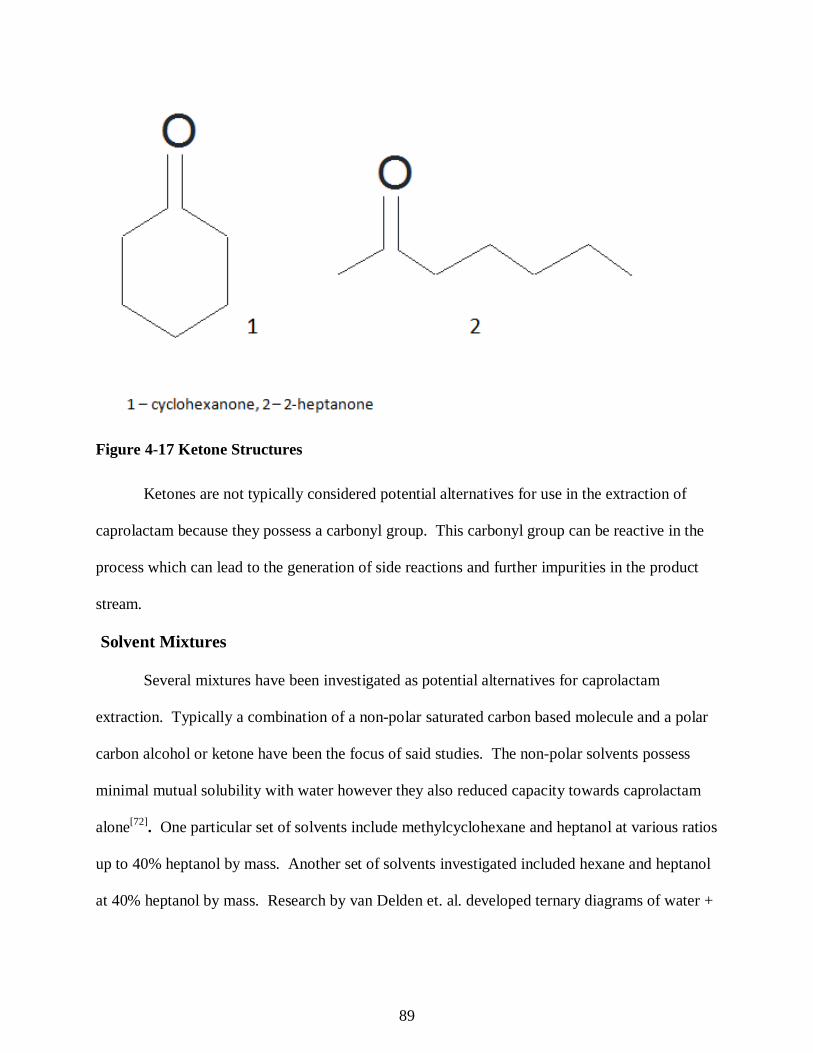
89
Figure 4-17 Ketone Structures
Ketones are not typically considered potential alternatives for use in the extraction of
caprolactam because they possess a carbonyl group. This carbonyl group can be reactive in the
process which can lead to the generation of side reactions and further impurities in the product
stream.
Solvent Mixtures
Several mixtures have been investigated as potential alternatives for caprolactam
extraction. Typically a combination of a non-polar saturated carbon based molecule and a polar
carbon alcohol or ketone have been the focus of said studies. The non-polar solvents possess
minimal mutual solubility with water however they also reduced capacity towards caprolactam
alone[72]. One particular set of solvents include methylcyclohexane and heptanol at various ratios
up to 40% heptanol by mass. Another set of solvents investigated included hexane and heptanol
at 40% heptanol by mass. Research by van Delden et. al. developed ternary diagrams of water +
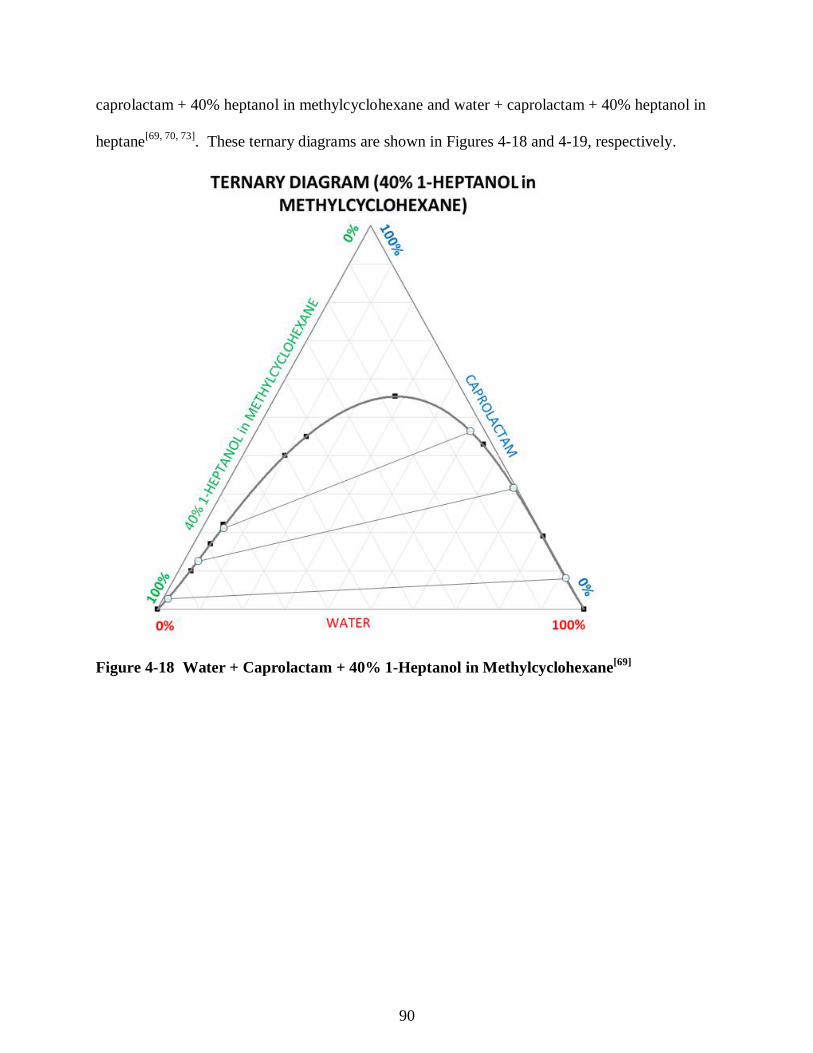
90
caprolactam + 40% heptanol in methylcyclohexane and water + caprolactam + 40% heptanol in
heptane[69, 70, 73]. These ternary diagrams are shown in Figures 4-18 and 4-19, respectively.
Figure 4-18 Water + Caprolactam + 40% 1-Heptanol in Methylcyclohexane[69]
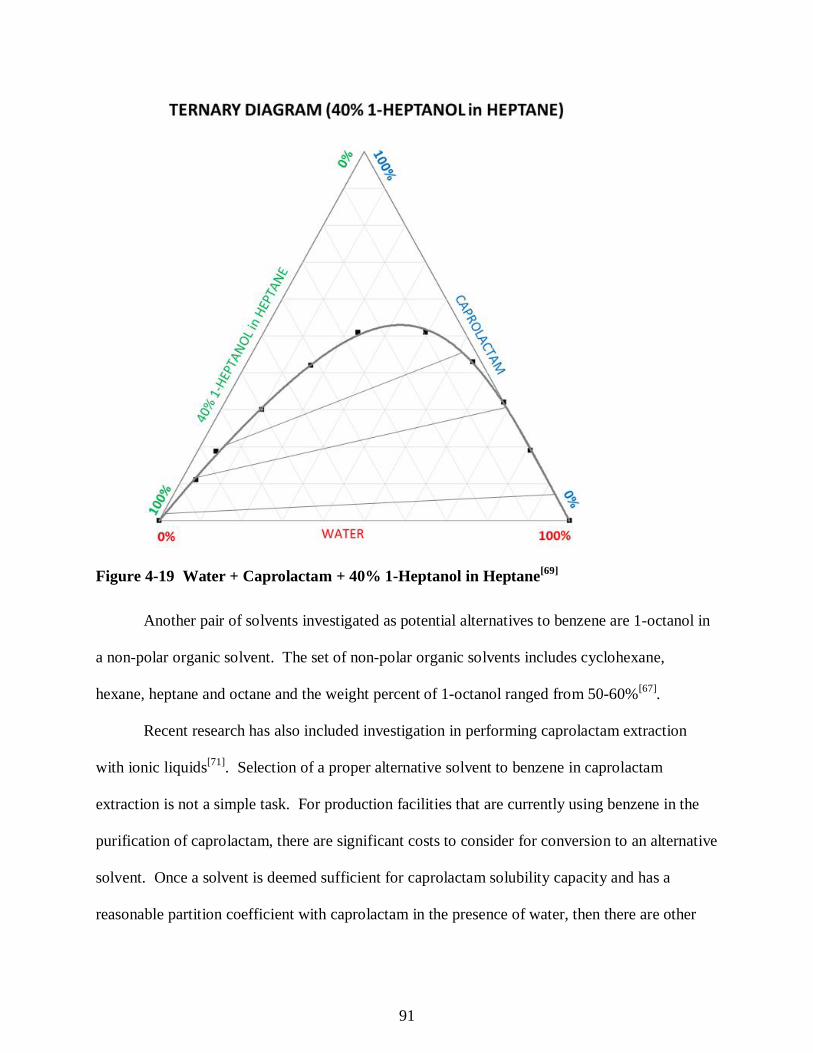
91
Figure 4-19 Water + Caprolactam + 40% 1-Heptanol in Heptane[69]
Another pair of solvents investigated as potential alternatives to benzene are 1-octanol in
a non-polar organic solvent. The set of non-polar organic solvents includes cyclohexane,
hexane, heptane and octane and the weight percent of 1-octanol ranged from 50-60%[67].
Recent research has also included investigation in performing caprolactam extraction
with ionic liquids[71]. Selection of a proper alternative solvent to benzene in caprolactam
extraction is not a simple task. For production facilities that are currently using benzene in the
purification of caprolactam, there are significant costs to consider for conversion to an alternative
solvent. Once a solvent is deemed sufficient for caprolactam solubility capacity and has a
reasonable partition coefficient with caprolactam in the presence of water, then there are other
92
parameters such as surface tension in the presence of the solute, density of the solvent, amount of
solvent required to perform the extraction, flammability of the solvent, and recoverability of the
solvent among many others. The thought process in swapping solvents has to include whether or
not the current extraction columns are sized appropriately, will the raffinate and extract end up
on opposite locations due to variation in density of the alternative compared to benzene, or if the
current solvent recovery system has sufficient heating capacity to recover a solvent with a higher
boiling point than benzene. Extensive modifications may come with expensive price tags for
plants hoping to convert from benzene to a more benign solvent for the extraction of
caprolactam, however new caprolactam plants currently in the design phase should have
sufficient literature and background on the investigation into alternative solvents or solvent
systems that they can go another route from the selection of benzene for their processes.
Toluene seems to be the better alternative for caprolactam extraction as it does not pose
the same health risks as benzene. Even though toluene does not have the same capacity for
caprolactam, it does provide similar impurity separation and can be readily recovered via a
solvent recovery system comparable to applications in benzene recovery.
93
Chapter 5 - Conclusions
Caprolactam Extraction
Caprolactam extraction is a key unit operation in the purification of caprolactam. The
forward and back extraction of caprolactam from the aqueous caprolactam oil is essential for
effective removal of both organic and aqueous soluble impurities that are formed in the
Beckmann Rearrangement, the neutralization step or enter into the process with one of the raw
materials. The entrainment of said impurities into the caprolactam final product stream leads to
poor quality Nylon 6 polymer products. Efficient extraction in all three columns is essential to
minimize caprolactam losses in the waste streams. The loss of caprolactam in the waste stream
results in an increase in the variable cost per unit of production.
RDC Extraction Columns
Caprolactam extraction can be achieved by way of a variety of extraction column options.
Pulsed-packed columns, rotating disk and doughnut columns, and rotating disk contactor
extraction columns are the most widely employed technologies for the extraction of caprolactam.
However the propensity to form emulsions or have phase carryover in the forward extraction of
caprolactam lends a preference for the RDC extractor because the high shear mixing can be
readily reduced by slowing the rotation of the rotor. The RDC is also more suitable for fouling
materials, and it is the better option for liquid-liquid systems with low interfacial tension. The
RDC extraction column is the preferred choice due to its high throughput, low cost, low driving
power, high efficiency per unit height and high operational flexibility[57].
Rotor Speed Curves
The speed at which the rotor and disks are rotated within the RDC extraction column is
an important factor in achieving the most efficient solute transfer as the energy input into the
94
system is proportional to the interfacial area between the solvents in the system. Increased rotor
speed at higher flows can lead to increased dispersed phase hold-up in the column and increases
in axial mixing which reduces the driving force of the concentration differential. Reduced rotor
speeds lead to channeling of the dispersed phase and minimal droplet breakage which reduces
interfacial area for solute transfer thereby decreasing extraction efficiency.
The rotor speed curves clearly show that at reduced flow rates, higher rotor speeds are
necessary to attain proper droplet breakage. The curves for RDC-1 and the bottom of RDC-2
show a higher required rotor speed which is understandable as these two have the liquid systems
with the higher interfacial tension. The rotor speeds for the top section of RDC-2 are
significantly lower than those required in the bottom section of RDC-2. To minimize holdup and
carryover in the top section of RDC-2, the rotor speed curves developed for the top section have
to be the target rotor speeds for the column rather than the ones generated for the bottom section.
Unfortunately this means the bottom section of RDC-2 may not receive the energy input
necessary to have proper droplet breakage and this could result in reduced extraction efficiency
in the latter stages of forward extraction. The rotor speed curves for RDC-1 and RDC-3 are very
similar with RDC-1 having slightly higher speed requirements due to the higher interfacial
tension of the aqueous ammonium sulfate + benzene + caprolactam system.
Theoretical Extraction Stages
Calculation of the theoretical stages for each extraction column based on flow rates and
rotor speeds provided insight on how to achieve higher efficiency for extraction based on the
process conditions. In each case, the higher rotor speed curves have much larger slopes at the
lower flow rates whereas the lower rotor speeds have flatter slopes. As the flow rates increase in
each case, the lowest rotor speeds tend to fall below the middle range rotor speeds in achievable
95
extraction stages. Comparison of the number of theoretical stages achievable with the rotor
speeds in the 75-85% dispersed phase holdup range from the rotor speed curves affords the most
efficient rotor speed to target based on feed and solvent flow rates to each extraction column.
Alternative Solvents for Caprolactam Extraction
Benzene has been the preferred choice for extraction of caprolactam for a majority of the
industrial processes due to its capacity for caprolactam and high efficiency in solvent recovery,
however benzene poses undesired health risks as it is a known carcinogen. There has been
considerable investigation in determining possible alternative solvents for the caprolactam
extraction process. A number of halogenated solvents have been studied and seem to work well,
however many pose their own health and environmental concerns. Alcohols and ketones have
shown a high capacity for caprolactam though these solvent have too high mutual solubility with
water which results in product losses and impurity issues as well as the requirement for a robust
solvent recovery system. Non-polar hydrocarbons alone do not have the capacity for
caprolactam, but mixtures of a non-polar hydrocarbon with alcohols or ketones have shown
promise. Ensuring the appropriate component ratio in a solvent mixture for a continuous process
can require significant process control schemes that could be costly. Toluene does not have the
same capacity for caprolactam as benzene yet it is comparable. Toluene shows very similar
impurity separation and can be readily recovered in a similar solvent recovery system as that
used for benzene. Since toluene does not pose the health risks associated with benzene, toluene
seems to be the best choice as an alternative solvent for caprolactam extraction.
96
Nomenclature
English
97
=
=24
0.53
= 1.59
= +1 + 4.56 .
, = 1.0 ,
= 1.29
=. . .
,
=
=
98
=%%
,
, ,
=
=
99
,
,
,
Greek Letters
,
100
References
1. Dutta, B. K. (2007). Principles of Mass Transfer and Separation Processes. PHI Learning Pvt. Ltd., 8.3 Solvent Selection (pp. 434-436). New Delhi.
2. Butt, H-J.,Graf, K., Kappl, M. (2013). Physics and Chemistry of Interfaces. Wiley-VCH Verlag GmbH & Co. KGaA, 3.3.5 Interfacial Excess Energies (pp. 44-46). Weinheim, Germany.
3. Ghosh, P. NPTEL – Chemical Engineering – Interfacial Tension [pdf module]. Retrieved from E-Learning Course Website: http://nptel.ac.in/courses/103103033/8
4. Antonoff, G. On the Validity of Antonoff’s Rule. J. Phys. Chem. 46 (1942) pp. 497-499
5. Butt, H-J.,Graf, K., Kappl, M. (2013). Physics and Chemistry of Interfaces. Wiley-VCH Verlag GmbH & Co. KGaA, 3.5.2 Interfacial Excess Energies (pp. 49-53). Weinheim, Germany.
6. Dukhin, S., Kretzschmar, G., Miller, R. Dynamics of Adsorption at Liquid Interfaces: Theory, Experiment, Application. Elsevier Science B.V. (1995) 2.5 Treatment of the Langmuir Adsorption Isotherm as Introduction to Adsorption Dynamics (pp. 47-48). Amsterdam, The Netherlands
7. Jasper, J. The Surface Tension of Pure Liquid Compounds. J. Phys. Chem. Ref. Data. 1 (1972) pp. 841-1009
8. Wu, H. Chung, T. (2011) Effect of Surface Tension on Mass Transfer Devices, Mass Transfer in Multiphase Systems and its Applications, Prof. Mohamed El-Amin (Ed.), ISBN: 978-953-307- 215-9, InTech, Available from: http://www.intechopen.com/books/mass-transfer-in-multiphase-systems-and-itsapplications/effect-of-surface-tension-on-mass-transfer-devices
9. Bakker, C., van Buytenen, P., Beek, W. Interfacial Phenomena and Mass Transfer. Chem. Eng. Sci. 20 (1966) pp. 1039-1046
10. Haydon, D. Oscillation Droplets and Spontaneous Emulsification. Nature 176 (1955) pp. 839
11. Davies, T. Mass-Transfer and Interfacial Phenomena Proc. Roy. Soc. (London) A243 (1958) pp. 483
101
12. Sternling, C., Scriven, L. Interfacial Turbulence: Hydrodynamic Instability and the Marangoni Effect. AIChE J. 5 (1959) pp. 514-523
13. Treybal, R. Liquid Extraction, 2nd Edit., McGraw-Hill, New York (1963)
14. McFerrin, A., Davison, R. The Effect of Surface Phenomena on a Solvent Extraction Process. AIChE Journal. 17 (1971) pp. 1021-1027
15. Stevens, G. Interfacial Phenomena in Solvent Extraction and its Influence on Process Performance. Tsinghua Sci. & Tech. 11 (2006) pp.165-170
16. Groothius, H., Zuiderweg, F. Influence of Mass Transfer on Coalescence of Drops. Chem. Eng. Sci. 12 (1960) pp. 288
17. MacKay, G., Mason, S. Some Effects of Interfacial Diffusion on the Gravity Coalescence of Liquid Drops. J. Colloid Sci. 18 (1963) pp. 674
18. Hanson, C. Recent Advances in Liquid-Liquid Extraction. Pergamon Press Ltd. (1971)
6.6 Coalescence and Break-up of Drops in Extraction Equipment (pp. 579-584). Oxford, England.
19. Drew, T. Advances in Chemical Engineering Volume 4. Academic Press, Inc. (1963) 1. Mass-Transfer and Interfacial Phenomena (pp. 1-49). London, England.
20. Jeffreys, G., Davies, G. Recent Advances in Liquid-Liquid Extraction. Elsevier Ltd. (1971) Chapter 14 – Coalescence of Liquid Droplets and Liquid Dispersion. pp. 495-584
21. Lee, J., Hodgson, T. Film Flow and Coalescence – Basic Relationships, Film Shape and Criteria for Interfacial Mobility. Chem. Eng. Sci. 23 (1968) pp. 1375-1397
22. Ramaswamy, S., Huang, H-J., Ramarao, B. (2013) Separation and Purification Technologies in Biorefineries. John Wiley & Sons Ltd. 3.4.2 Types of Extractors (pp. 67-70). Chinchester, West Sussex, United Kingdom.
23. Moris, M., Diez, F., Coca, J. Hydrodynamics of a Rotating Disc Contactor. Separation and Purification Tech. 11 (1997) pp. 79-92
24. Lo, T., Baird, M., Hanson, C. Handbook of Solvent Extraction. John Wiley & Sons Ltd. (1983) 13.3 Scheibel Columns (pp. 419-429). New York, United States of America.
102
25. Rousseau, R. Handbook of Separation Process Technology. John Wiley & Sons, Inc. (1987) 7.7 Performance and Efficiency of Selected Contactors (pp. 441-446). New York, United States of America.
26. Lo, T., Karr, A. Development of a Laboratory-Scale Reciprocating Plate Extraction Column. Ind. Eng. Chem. Process Des. Dev. 11 (1972) pp. 495-501
27. Dongaonkar, K., Clive Pratt, H., Stevens, G. Mass Transfer and Axial Dispersion in a Kuhni Extraction Column. AIChE Journal 37 (1991) pp. 694-704
28. Yang, Y., Fei, W., Sun, J., Wan, Y. Hydrodynamics and Mass Transfer Performance of a Modified Rotating Disc Contactor (MRDC). Trans IChemE, Vol 80, Part A, (2002) pp. 392-400
29. Rozkos, B., Mizek, T., United States Patent C 3,495,947 Asymmetric Rotating Disc Contactor. Prague, Czechoslovakia.
30. Torab-Mostaedi, M., Azadollahzadeh, M. Mass Transfer Performance in an Asymmetric Rotating Disc Contactor. Chem. Eng. Res. and Des. 94 (2015) pp. 90-97
31. Speegle, M. (2011). Process Technology Systems. Delmar Cengage Learning., 13 Extraction Systems (pp. 179-189). Clifton Park, New York, United States of America.
32. Reman, G., Olney, R. The rotating disk contactor – a new tool for liquid-liquid extraction. Chem. Eng. Prog. 51 (1955) pp. 141.
33. Garthe, D. Fluid Dynamics and Mass Transfer of Single Particles and Swarms of Particles in Extraction Columns. Ph.D. Thesis (2006) Technische Universitat Munchen, Munchen
34. Cauwenberg, V., Degreve, J., Slater, M. The Interaction of Solute Transfer, Contamininants and Drop Break-Up in Rotating Disc Contactors: Part II. The Coupling of Mass Transfer and Breakage Process via Interfacial Tension. Can. J. Chem. Eng. 75 (1997) pp. 1056-1066
35. Schmidt, S., Simon, M., Attarakih, M., Lagar, L., Bart, H. Droplet Population Balance
Modeling – Hydrodynamics and Mass Transfer. Chem Eng.Sci. 61 (2006) pp. 246-256
103
36. Haderer, T., Marr, R., Martens, S., Siebenhofer, M. Design of Rotating Disc Contactors; Implementation of CFD Tools. Presentation at the 2004 Annual Meeting, Austin, TX, Nov. 7-12
37. Godfrey, J., Houlton, D., Ramlochan, K., Slater, M. Single Phase Axial Mixing in Rotating Disc Contactors, Trans. IChemE, 79 (2001) pp.156-162
38. Laddha, G., Degaleesan, T., Kannapan, R. Hydrodynamics and Mass Transport in Rotary Disc Contactors. Can. J. of Chem. Eng. 56 (1978) pp.137-150
39. Khadivparsi, P. Simulation of Rotary Disc Contactors for Industrial and Semi-Industrial Processes. M.Sc. Thesis, University of Tehran, (1993)
40. Molavi, H., Hosseinpoor, S. Bahmanyar, H. An Investigation on the Effect of Continuous Phase Height on the First and Second Critical Rotor Speeds in a Rotary Disc Contactor, International Journal of Chemical, Molecular, Nuclear, Materials and Metallurgical Engineering. 4 (2010) pp. 37-42
41. Kumar, A., Hartland, S. Prediction of Drop Size in Rotating Disc Extractors. Can. J. of Chem. Eng. 64 (1986) pp. 915-924
42. Kamath, M., Subba Rau, M. Prediction of Operating Range of Rotor Speeds for Rotating Disc Contactors. Can. J. of Chem. Eng. 63 (1985) pp. 578-584
43. Alessi, V., Penzo, R., Slater, M., Tessari, R. Caprolactam Production: a Comparison of Different Layouts of the Liquid-Liquid Extraction Section. Chem. Eng. Technol. 20 (1997) pp. 445-454
44. Schmidt, M. Analysis of Alternatives (Public Version) Industrial Use as an Extraction Solvent for the Purification of Caprolactam from Caprolactam Oil. DOMO Caproleuna GmbH (2014)
45. Lo, T., Baird, M., Hanson, C. Handbook of Solvent Extraction. John Wiley & Sons Ltd. (1983) 18.4 Extraction of Caprolactam (pp. 557-567). New York, United States of America.
46. Alessi, V., Penzo, R., Slater, M., Tessari, R., Caprolactam Production: A Comparison of Different Layouts of the Liquid-Liquid Extraction Section. Chem. Eng. Technol. 20 (1997) pp. 445-454
104
47. Kumar, A., Hartland, S. Unified Correlation for the Prediction of Drop Size in Liquid-Liquid Extraction Columns. Ind. Eng. Chem. Res. 35 (1996) pp. 2682-2695
48. Kumar, A., Hartland, S. A Unified Correlation for the Prediction of Dispersed-Phase Hold-Up in Liquid-Liquid Extraction Columns. Ind. Eng. Chem. Res. 34 (1995) pp. 3925-3940
49. Strand, C., Olney, R., Ackerman, G. Fundamental Aspects of Rotating Disk Contactor Performance. AIChE J. 8 (1962) pp. 252-261
50. Kumar, A., Hartland, S. Empirical Prediction of Operating Variables in Liquid-Liquid Extraction Equipment, Godfrey, J., Slater, M. Eds., Wiley, Chichester, U.K., pp 625-735
51. Kumar, A., Hartland, S., Design of Liquid-Liquid Extractors. Min. Pro. Ext. Met. Rev. 17 (1997) pp. 43-79
52. Molavi, H., Hosseinpour, S., Bahmanyar, H., Mojtaba, S. Modified Correlations for the First and Second Critical Rotor Speeds, as well as Break Up Probability in a Rotary Disc Contactor. Can. J. Chem. Eng. 89 (2011) pp. 1236-1246
53. Vogel, H., Todaro, C. Fermentation and Biochemical Engineering Handbook (Second Edition); Todd, D. Solvent Extraction. Ch. 8 pp.348-381
54. Laitinen, A., Kaunisto, J. Hydrodynamics and Mass Transfer in a Rotating Disk Supercritical Extraction Column. Ind. Eng. Chem. Res. 37 (1998) pp. 2529-2534
55. Lo, T., Baird, M., Hanson, C. Handbook of Solvent Extraction. John Wiley & Sons Ltd. (1983) 13.1 Rotating-Disk Contactor (pp. 391-404). New York, United States of America.
56. Kumar, A., Hartland, S. Prediction of Axial Mixing Coefficients in Rotating Disc and Asymmetric Rotating Disc Extraction Columns. Can. J. Chem. Eng. 70 (1992) pp.77-87
57. Molavi, H., Hosseinpour, S., Bahmanyar, H., Mojtaba, S. Investigations on Local and Average Static Hold-Ups in Liquid-Liquid Systems in a Rotary Disc Contactor. Can. J. Chem. Eng. 89 (2011) pp.1464-1472
105
58. Tettamanti, K., Nogradi, M., Sawinsky, J. Equilibria of the Ternary System Caprolactam / Water / Organic Solvent, in the Liquid State. Periodica Polytechnica. 4 (1960) pp. 201-217
59. van Delden, M., Kuipers, N., de Haan, A. Liquid-Liquid Equilibria and Physical Properties of the Quaternary Systems Water + Caprolactam + Ammonium Sulfate + Benzene and Toluene. J. Chem. Eng. Data 49 (2004) pp. 1760-1770
60. Tuinier, R., Krooshof, G. Interfacial Tension Between Benzene and Water in the Presence of Caprolactam. J. Colloid Int. Sci. 382 (2012) pp.105-109
61. van Delden, M. Caprolactam Extraction in a Pulsed Disc and Doughnut Column with a Benign Mixed Solvent. Ph.D. Thesis, University of Twente, The Netherlands, 2005
62. Glazko, I., Yu, A., Levanova, S. Performance and Selectivity of Organic Solvents in Extraction of Caprolactam from Lactam Oil. Russian J. Appl. Chem. 80 (2007) pp. 941-944
63. Kirchnerova, J., Cave, G. The Solubility of Water in Low-Dielectric Solvents. Can. J. Chem. 54 (1976) pp. 3909-3916
64. Wijtkamp, M., van Bochove, G., de Loos, Th., Niemann, S., Fluid Phase Equilib. 158-160 (1999) pp. 939-947
65. Poraicu, M., Davidescu, C., Pacurariu, C. Hydroquinone Extraction from Acid Solutions. Chem. Bull. Politechnica. 42 (1997) pp 139-143
66. Gong, X, Lu, Y., Li, M., Ma, X., Ni, Q., Luo, G. Liquid-Liquid Equilibria of the Quaternary System Water + Caprolactam + 1-Octanol + Ammonium Sulfate. J. Chem. Eng. Data. 52 (2007) pp. 851-855
67. Gong, X, Lu, Y., Li, M., Ma, X., Ni, Q., Luo, G. Selection and Evaluation of a New Extractant for Caprolactam Extraction. Chin. J. Chem. Eng. 16 (2008) pp. 876-880
68. van Bochove, G., Krooshof, G., de Loos, Th. Fluid Phase Equilib. 194-197 (2002) pp. 1029-1044
106
69. van Delden, M., Kuipers, N., de Haan, A. Selection and Evaluation of Alternative Solvents for Caprolactam Extraction. Separation and Purification Tech. 51 (2006) pp. 219-231
70. van Delden, M., Vos, G., Kuipers, N. Extraction of Caprolactam with an Alternative Benign Solvent in a Pulsed Disc and Doughnut Column. Solvent Extraction and Ion Exchange 25 (2007) pp. 639-664
71. Chen, D., OuYang, X., Wang, Y., Yang, L., He, C. Liquid-Liquid Extraction of Caprolactam from Water Using Room Temperature Ionic Liquids. Separation and Purification Tech. 104 (2013) pp. 263-267
72. van Bochove, G. Two- and Three-Liquid phase Equilibria in Industrial Mixed-Solvent Electrolyte Solutions. Ph.D. Thesis, DUP Science, Delft, 2003
73. Gong, X., Lu, Y., Luo, G. Phase Equilibrium Calculations in Mixtures Containing Caprolactam with a UNIFAC Model. Chin. J. Chem. Eng. 18 (2010) pp. 286-291
74. Lo, T., Baird, M., Hanson, C. Handbook of Solvent Extraction. John Wiley & Sons Ltd. (1983) 13.4 Oldshue-Rushton Column (pp. 431-439). New York, United States of America.