Extracting value from Bengaluru's Dry Waste Chain
102
‘EXTRACTING VALUE FROM BENGALURU’S DRY WASTE CHAIN’ NOVEMBER 2014 A REPORT FOR BRUHAT BENGALURU MAHANAGARE PALIKE (BBMP) BY SOCIAL VENTURE PARTNERS, BENGALURU PARTNERS
-
Upload
cpps-bengaluru -
Category
Documents
-
view
248 -
download
2
description
Â
Transcript of Extracting value from Bengaluru's Dry Waste Chain

1
‘EXTRACTING VALUE FROM BENGALURU’S DRY WASTE CHAIN’NOVEMBER 2014
A REPORT FOR
BRUHAT BENGALURU MAHANAGARE PALIKE (BBMP)
BY
SOCIAL VENTURE PARTNERS, BENGALURU
PARTNERS

2
‘EXTRACTING VALUE FROM BENGALURU’S DRY WASTE CHAIN’NOVEMBER 2014
A REPORT FOR
BRUHAT BENGALURU MAHANAGARE PALIKE (BBMP)
BY
SOCIAL VENTURE PARTNERS, BENGALURU
PARTNERS
WAKE UP CLEAN UP BENGALURU
HAND IN HAND CHENNAI
BENGALURU CITY CONNECT FOUNDATION

Extracting value from Bengaluru’s Dry Waste ChainTable of Contents
1A collaborative effort of SVP, WUCU and BCCF
EXECUTIVE SUMMARY: A CALL TO ACTION ....................................................................
1. BACKGROUND .......................................................................................................
1.1. Bengaluru then and now: Its expansion and subsequent increase in Solid Waste .......
1.2. Bengaluru’s struggle: A struggling Solid Waste Management system .......................
1.3. Need for this report: Quantification and assessment ...............................................
1.4. Our Partners: Catalyst, Funders and Support ...........................................................
1.4.1. Catalyst ...................................................................................................
Wake Up Clean Up Bengaluru!
1.4.2. Funders ...................................................................................................
Social Venture Partners Bengaluru
Bengaluru City Connect Foundation
1.4.3. Research and Analysis ..............................................................................
Hand in Hand
Others
2. THE DRY WASTE CHAIN .........................................................................................
2.1. Background: Evolution of the dry waste chain .........................................................
2.2. Current Scenario: Bengaluru’s existing dry waste chain ...........................................
2.3. Dry Waste Streams: Mapping the flow for each stream ...........................................
2.3.1. Metals .....................................................................................................
Tin and Iron Scrap
Aluminium Scrap
Copper wiring Scrap
2.3.2. Paper .....................................................................................................
Carton/Corrugated Boxes
Newspaper
Paper Scrap
2.3.3. Plastics ...................................................................................................
High-value Plastics
Low-value Plastics
2.3.4. Milk Covers .............................................................................................
04
08
08
11
13
14
14
15
15
16
16
17
18
20
24
28
33
TABLE OF CONTENTS

Extracting value from Bengaluru’s Dry Waste Chain Table of Contents
2 A collaborative effort of SVP, WUCU and BCCF
2.3.5. PET Bottles .............................................................................................
2.3.6. Glass Bottles ...........................................................................................
Full glass scrap
Broken glass scrap
2.3.7. Tetrapak ..................................................................................................
2.3.8. Rubber Products ......................................................................................
2.3.9. Mattressess/ Cushions/ Fabrics .................................................................
2.3.10. Gunny Bags .............................................................................................
2.3.11. Foam Products (Termocole/Styrofoam) ....................................................
3. COLLECTION AND AGGREGATION OF DRY WASTE .................................................
3.1. The Informal Sector: Prevalent practices and players ...............................................
3.1.1. Prevalent Practices ..................................................................................
3.1.2. Players ....................................................................................................
3.1.2.1. Collectors ..................................................................................
Pourakarmikas
Rag-pickers/ Waste pickers
Auto Tippers and Luggage auto Drivers
3.1.2.2. Small-scale Aggregators ............................................................
Kabadiwallahs
Scrap-dealers
3.1.2.3. Medium-scale Aggregators ........................................................
3.1.2.4. Large-scale Aggregators ............................................................
3.1.2.5. Very large-scale Aggregators ......................................................
3.1.2.6. Other relevant players ...............................................................
Traders
Jolly Mohalla
3.2. The Formal Sector: BBMP’s Solid Waste Management System .................................
3.3. The Dry Waste COllection Centres: A bridge between the formal and informal ..........
4. PROCESSING DRY WASTE: THE UPCYCLING MARKET IN BENGALURU ...................
4.1. The Output: Primary and secondary processing .......................................................
35
37
41
42
42
43
44
46
46
46
46
47
51
53
54
54
54
55
57
60
60

Extracting value from Bengaluru’s Dry Waste ChainTable of Contents
3A collaborative effort of SVP, WUCU and BCCF
62
62
65
65
65
67
67
69
69
70
72
76
76
76
77
78
81
81
84
92
96
98
4.2. The Location: Processing centres with respect to Categories of Waste .....................
4.3. The Capacity: Bengaluru’s processing capacity ........................................................
5. ANALYSIS AND RECOMMENDATIONS ....................................................................
5.1. Segregation at Source: Citizen participation in the SWM system of the city ...............
5.1.1. Current Scenario ......................................................................................
5.1.2. Analysis ...................................................................................................
5.1.3. Recommendations ...................................................................................
5.2. DWCCs: Re-assessment of an inplemented strategy ................................................
5.2.1. Current Scenario ......................................................................................
5.2.2. Analysis ..................................................................................................
5.2.3. Recommendations ...................................................................................
5.3. Processing Capacities: Closing the Dry Waste Chain ................................................
5.2.1. Current Scenario ......................................................................................
5.2.2. Analysis ..................................................................................................
5.2.3. Recommendations ...................................................................................
6. CONCLUSION .......................................................................................................
ANNEXURES ..............................................................................................................
Annexure I: Memorandum of Understanding for studying Dry Waste in Bengaluru ............
Annexure II: WUCU study fow Ward 151 (Koramangala) ...................................................
Annexure III: List of Processors ......................................................................................
Annexure IV: Case studies to support value creation through sorting ...............................
Annexure V: Case studies of DWCCs ...............................................................................

Extracting value from Bengaluru’s Dry Waste Chain Executive Summary
4 A collaborative effort of SVP, WUCU and BCCF
EXECUTIVE SUMMARYA CALL TO ACTION
The closure of the Mavallipura landfill by the Karnataka State Pollution Control Board in 2012, the protest by the villagers of Mandur, the directives by the Hon’ble High Court of Karnataka and the growing unrest in the City about the need to have a sustainable system to handle solid waste has led to much introspection by the system, and diverse engagement by varied groups to look at the garbage issue through a fresh lens.
The MOU signed between BBMP, Social Venture Partners (SVP) and Wake Up Clean Up (WUCU) in 2013 (Annexure I) sets out a focus on understanding the dry waste chain in Bengaluru and the ways to extract value from it. SVP came forward to conduct a study to fill gaps about the dry waste value flow and information about existing infrastructure for processing / recycling dry waste streams by category. The study consisted of extensive field research, interviews and interaction with over 200 stakeholders. The exercise involved tracking the dry waste cycle from generation to disposal. The focus was on extracting maximum value through an inclusive strategy starting with segregation at source, understanding market forces, expanding investments in processing resulting in maximum resource recovery and hence minimizing waste to the landfill.
The quantification of waste is a contested number. It varies from 3300-3700 tons/day (WUCU 2012 estimate excluding market, street sweeping and leaf waste – Annexure II) to 4300-4500 tons /day (other estimates). Dry waste would be around 46% of the total waste – about 1700 to 2200 tons / day. This dry waste is made up of several streams, most of which already have an existing market value and the remaining 15-20% consists of rejects.
Only 36.6% of the dry waste recovered in Bengaluru is processed within the city, the majority is sent to other cities all over the country. As there is going to be an inevitable increase in quantity of Dry waste due to consumerism, it is therefore an opportunity to create a capacity for it, within our city limits. Hence, the more we create a capacity to process within our city limits, more value is created, and hence lesser waste will end up at the landfill.
SVP and WUCU would like to thank BBMP for the support and opportunity to partner in creating a Swachha Bengaluru. The report has analyzed the players in the dry waste chain, the value addition in the different waste streams, looked at the sorting, aggregating and processing infrastructure and the challenges and opportunities. The Call to action arising from this report is set out below – they have been classified under Administrative / Policy aspects, Market opportunities, integrating existing practices for maximum impact and enabling the shift to a new SWM regime.
STRENGTHENING THE POLICY FRAMEWORK AND ADMINISTRATIVE SYSTEM
1. Educate and enforce segregation at source. All SWM contracts to be reworked to mandate collection and transportation of segregated waste. Bins in high traffic public spaces. Visible commitment of the system to segregation of all waste streams.The foundation of any SWM policy is rooted in segregating waste at source. The State government has passed a law to this effect and we need effective BBMP rules and ground presence that can enforce it. All BBMP waste contracts must mandate collection and transportation of waste in segregated form. At this point of time, the city is struggling in getting waste streams into two buckets of wet and dry waste. Going forward it will be necessary to consider a set of dry waste sub-categories (paper, glass, metal etc.) as done in some Indian cities and internationally. Bins
Extracting value from Bengaluru’s Dry Waste ChainExecutive Summary
5A collaborative effort of SVP, WUCU and BCCF
for these sub-categories could be considered in high-traffic public spaces to build citizen awareness and keeping public spaces clean.
2. Bulk generators to manage their own waste. Remove any SWM cess for bulk generators. Introduce certification systemBulk generators to be persuaded to manage their waste in-situ, or through shared services or have empaneled vendors pick up their waste. There are successful of examples of Bulk generators monetising their waste through this route and reducing the load on the BBMP SWM system. These need to be scaled up across the city and BBMP needs to remove any SWM cess laid on such bulk entities. Getting bulk generators to manage their own waste will significantly reduce the burden on the BBMP solid waste management system, allowing for successful decentralization. In due course, an SWM compliance certification system for bulk generators should be introduced.
3. Move towards a decentralised waste management & disposal system. Plan processing infrastructure through arrangements for every 8-10 contiguous assembly segmentsThe current system of transporting and disposing waste at a distant village is both morally wrong and unsustainable. All BBMP policy and processes must work towards a decentralized waste disposal arrangement, with a near ‘Zero-waste’ to landfill approach. We believe such disposal arrangements in clusters of 8-10 assembly constituencies may be economically viable and manageable.
4. Need to gravitate towards dealing with sub-categories of dry waste for storage and transportationWe need a hub and spoke mechanism for sub-streams of dry waste. Sort at the ward level and accumulate specific streams of waste (eg. glass, paper, plastic, etc.) at select centres for storage and transport logistics efficiency. This will allow for maximum value addition by ensuring the sub-category is ready to be received as raw material for the processing and upcycling.
5. Have third party audits. Act against non-performersThe need for ongoing review mechanisms cannot be overstressed. Since the city is growing and evolving its strategies, adjustments and corrections must be enabled at short notice. These can be done only if there is a Third Party review mechanism that is recognized and whose performance review recommendations are acted upon to reflect in penal actions and cancellation of contracts.
RECOGNISE INVESTMENT OPPORTUNITIES FOR ALL DRY WASTE STREAMS
1. License Dry Waste Collection Centres (DWCCs) - BBMP built - as well as private premises as licensed DWCCs. Offer subsidy for handling low value waste. Currently multiple models exists in operating DWCCs, where the base infrastructure (land and building) is provided by BBMP and run by NGOs, Contractors, RWAs, etc. In our view, BBMP should also encourage private Enterprises (with their own premises) to be designated DWCCs (outside BBMP built sheds). It should lay down the responsibilities of

Extracting value from Bengaluru’s Dry Waste Chain Executive Summary
6 A collaborative effort of SVP, WUCU and BCCF
DWCC operators and BBMP built DWCC should have a mandatory clause for the DWCC operator to accept all Dry Waste brought to the premises (including low value waste). BBMP could consider an additional subsidy for accepting low value waste and commit to a regular waste collection cycle for such waste.
2. Enforce Extended Producer Responsibility (EPR). Non-recyclable packaging materials need to go. In due course, the city will need to move towards an EPR regime, where the manufacturer’s responsibility extends to post purchase and consumption of the product. They have to be obligated to set up disposal chains and processes to deal with their packaging material. In cases where the packaging material cannot be processed (ex. certain materials like soiled take-out Styrofoam containers, aerosol cans, non-recyclable plastics, etc.) the BBMP should levy a cess to discourage their usage. Currently the bulk of the recycling/processing capacity is centered in and around 3 or 4 clusters such as Nayandahalli and Kengeri. There is a case for BBMP to consider encouraging more distributed recycling yards across the city, to minimize transportation costs. The Kasturirangan report of the Government of India also stresses on EPR being encouraged by ULB’s.
3. Think ‘SEZ’ approach to ‘Recycling parks’Akin to the licensed DWCCs, BBMP should license recycling/processing yards. As we are already aware of the waste streams that can be extracted, it is logical to extend dry waste segregation to the up cycling opportunities in processing. There is a need for the State to encourage and define a framework to enable this. An SEZ like incentivized approach for ‘Recycling parks’ needs to be considered
PROVIDING SUPPORT THROUGH INTEGRATION WITH EXISTING MARKET SYSTEMS
1. Align Solid waste management (SWM) policy with market dynamics. Destination bound waste processing by categories way to go. As BBMP is still in the policy formulation stage, the key question is how can this policy effectively engage with the existing market? In order to do so, it is important to understand the market dynamics, which are based on the break-up of quantification by category (waste streams), generator (household, bulk) and geography (location). Any policy initiative that is planned in isolation of the ecosystem player’s economics, motivations is bound to fail.
2. Need for a comprehensive vendor empanelment system. Recognize waste ownership. Set out roles and responsibilities.It is commendable that BBMP has embarked on a Vendor/Contractor empanelment program encompassing all players in the chain – collectors, transporters, aggregators, recyclers, processors, etc. At source, the waste is owned by the generator. With the transfer of the waste from generator to empanelled vendor/contractor, the ownership of the waste transfers to the collector – this clarification should make for lower tender costs since the contractors can sell the waste collected as part of their income recovery. The empanelled collector has to account for the receipt and subsequent disposal of the waste as per BBMP prescribed procedures – in steady state, all subsequent transfers in the waste chain should be to empanelled vendors. This will result in the informal workers being included in the formal system with attendant benefits.

Extracting value from Bengaluru’s Dry Waste ChainExecutive Summary
7A collaborative effort of SVP, WUCU and BCCF
ENABLING THE SHIFT
1. Respect data. Build a data repository for SWM, particularly through the empanelled vendor information system Lack of reliable data seems to be the biggest, if not the most important issue in resolving the SWM problem. Even the basic figure on the quantity of waste generated in the city remains contested. Hence there needs to be a set methodology for data collection that various organisations can align with and in turn contribute towards a master data base. The empanelled vendor information system will improve the quality of data sets in the future.
2. Invest significantly in citizen and community awareness building measures. Ward level contests / prizes could galvanize actionAwareness building, communication and continuous education are necessary to change existing mindsets. It might be worthwhile instituting prizes for the cleanest set of wards, to encourage a positive competitive behavior. The local elected representatives and Ward Committee members and RWAs, enhancing neighborhood engagement and accountability, could drive these.
3. Don’t forget the long term sustainable solution while addressing the immediate crisis requirementsBengaluru is a city in transition with respect to SWM. Consequently while addressing short-term crisis measures, a road map for a transition to a long-term sustainable low waste regime must be worked on, including measures to reduce waste and incentivise recycling and reuse.
The report points to a huge potential in the market for recycling of dry waste and if this opportunity is captured and investments encouraged, Bangalore can convert the present deficit in the SWM infrastructure to seeding a robust industry and create livelihood by maximizing resource recovery in an inclusive and transparent way.

Extracting value from Bengaluru’s Dry Waste Chain Background
8 A collaborative effort of SVP, WUCU and BCCF
1. BACKGROUND
The City of Bengaluru, currently the 3rd largest city in India, is spread over an area of around 800 square kilometres and estimated to have an urban population of 10,178,146 (2014). In the last decade, with the development of the IT industry, the city has witnessed a huge transformation. An influx of population from all across the country is reflected in the unprecedented growth rate of 47.18% in the population of 2011 as compared to population in 2001 (Census, 2011).
Moreover in January 2007, the government of the state issued a notification to merge the Bangalore Mahanagara Palike (BMP) wards with the City Municipal Council (CMC), Town Municipal Council (TMC) and 111 villages around the city. They then formed a single administrative area, governed by the newly-renamed Bruhat Bengaluru Mahanagare Palike (BBMP). Effectively, the area of the city was increased from 226 square kilometres to 800 square kilometres (Figure 01), which were divided into 8 administrative zones (Figure 02).
BMPBBMP
BEFORE JANUARY 2007 POST JANUARY 2007
CMCs + 111 Villages
Yelahanka
Bommanahalli
Mahadevapura
K R Puram
Dasarahalli
Rajarajeshwarinagar
Kengeri
Byatarayanapura
Figure 01: Bengaluru’s merger - an increase in area from 226 sq.m. to 800 sq.km.(Source: Times of India)
1.1. BENGALURU THEN AND NOWITS EXPANSION AND SUBSEQUENT INCREASE IN SOLID WASTE
The rapid expansion of the city’s scale has created a gap in terms of infrastructure as development has not kept pace with the growing requirements of its rapidly increasing population. These gaps had developed in several areas, including developmental infrastructure, town planning and most critically, Solid Waste Management (SWM). The quantum of waste is estimated to have increased form 2500 TPD in 2002 to the current contested (not an official figure, but is based on estimates from several organisations) number of over 4500 TPD.
A majority of the growth in the city is taking place along its outskirts, in zones such as Bomanahalli, Mahadevapura, Dasarahalli, Rajarajeshwari Nagar and Yelahanka. The boundaries of the city are expanding and these areas are witnessing intense development of real estate and private investment, as well as influx of population. Unlike the Central Business District (CBD), a lot of the growth is vertical, since several high-rises and apartment complexes are being constructed in these zones. Besides this, there has also been development of

Extracting value from Bengaluru’s Dry Waste ChainBackground
9A collaborative effort of SVP, WUCU and BCCF
Figure 02: Bengaluru’s Zone and Ward map(Source: Bengaluru Mahanagare Palike [BBMP])
Mahadevapura
Byatarayanapura
ADMINISTRATIVE ZONES OF BENGALURU
East
West
South
Bommanahalli
R R Nagara
Dasarahalli

Extracting value from Bengaluru’s Dry Waste Chain Background
10 A collaborative effort of SVP, WUCU and BCCF
large office complexes and IT tech-parks, such as ITPL and Bagmane Tech Park.
In addition to the real estate growth, the predominant lifestyle in these areas also set them apart from the CBD. With a high concentration of IT firms and the prevalence of the “BPO culture”, offices tend to operate on 24-hour shifts and have a much larger number of employees. Hence, the quantum of waste generated is not only large but also disposed of in a continuous stream, requiring more frequent collection.
Growth on the fringes of the city has not only been vast, but also diverse. Apartment complexes of various sizes, gated colonies, tech-parks, office blocks, shopping malls, hotels and restaurants are all developing in close proximity to each other. Consequently, waste collection mechanisms have to be equally adaptable, since each of these generators produces different categories of waste, in different quantities. For example, a Wet vs Dry Waste study done in Ward 151 (Koramangala), showed a considerable variation in ratio for bulk generators (51:49%) and independent homes (38:62%) (Box 1).
BOX 01: WET VS DRY WASTE COMPOSITIONCase study -Koramangala (Ward 151)
A study conducted by Wake Up Clean Up (WUCU) Bangalore has thrown up some interesting findings. The study was conducted in Ward 151 (Koramangala), which is a fairly well-developed area and has a diverse demographic profile in terms of residential and commercial establishments. It focussed on quantifying waste generation keeping in mind category and generator-profile. The findings from this ward were then extrapolated to come to a conclusion regarding quantification of waste in Bengaluru. The following results highlighted wet vs dry generation:
As depicted, the study revealed that the total ratio of wet waste to dry waste generated in the city is at 46:54 %, with more wet waste being discarded. However, this ratio is inversed for Bulk Generators including offices, malls etc. where the quantum of dry waste is significantly higher than at door to door or household levels.
The ward findings were extrapolated for the city, and the estimated SWM quantity was between 3300-3700 TPD (Ward 151 was estimated at 6 TPD). The study is appended as Annexure II.

Extracting value from Bengaluru’s Dry Waste ChainBackground
11A collaborative effort of SVP, WUCU and BCCF
1.2. BENGALURU’S STRUGGLEA STRUGGLING SOLID WASTE MANAGEMENT SYSTEM
As a city, there have been many phases in Bengaluru characterized by different approaches towards SWM. By and large, the municipal corporation has followed a transport-and-dump methodology. However, the city also has an active civil society community that has been engaged in the waste dilemma for years now.
Prior to 2000, Bengaluru was generating an estimated 2200 TPD. However, the available infrastructure for disposal of this waste was limited. Not only was there insufficient information on the potential hazards of handling waste components – which had consequences to both waste workers and citizens – but there were also no guidelines for waste handling, norms and standards or adequate monitoring.
Then, in January 2000, a citizen poll was held in the city to identify those areas for urban development that citizens felt were a priority; garbage topped the list of their concerns. Subsequently, in March 2000, the BMP, supported by the Bangalore Agenda Task Force (BATF) launched an innovative cleanliness drive called ‘Swachha Bangalore’. At that time, the city had 100 administrative wards, which were divided into 273 Health Wards for administrative convenience. Of these, 147 Health Wards (including two large markets) were under a private contract system. The remaining 126 were managed by the BMP.
The program was launched first as a pilot, and primarily aimed at creating an impact of visible difference by analysing the SWM chain of collection, transportation, processing and disposal, and identifying areas that were weak and could be rectified. The pilot was conceived as a Public Private Partnership (PPP), where corporate bodies donated collection infrastructure such as pushcarts, buckets and auto tippers. The thrust was largely at the citizen-facing end of the project, with a lot of field work and research being conducted to recommend better waste management practices. To an extent, the program was also flavoured with best practices from other Indian cities.
The concept of launching ‘Swachha Bangalore’ on a larger scale (from 25% of the city to 50%) allowed the BATF and BMP to actually rethink and tweak the approach before scaling it to the entire city. Many of the field observations (Figure 03) and other issues that were noted while the program was being implemented also provided the basis for a revised tender.
Three years after the program was first launched, the BMP felt confident enough to extend the program to wards that were under contracts as well. The principles of the program were incorporated into the tenders for private contracts, and these new contracts were launched in June 2003.
Another major thrust of the program was towards segregation at source, which was achieved during that time. However, due to the several institutional changes that took place in Bengaluru post 2002 (fusion of the BMP, CMC, TMC and the 111 villages to form the BBMP and the shifting of responsibilities within the BBMP) lead to dissolution of the BATF, one of the lead partners, and hence the program ended in 2005. Unfortunately, post this, wide-scale initiatives to promote segregation at source also faltered.
Prior to the fusion and formation of the BBMP, departmental work was largely handled by the Health Department because waste was considered to be more of a sanitation and health issue. However, as a better understanding of waste characteristics and methods of disposal began to come about, it was realized that aspects such as

Extracting value from Bengaluru’s Dry Waste Chain Background
12 A collaborative effort of SVP, WUCU and BCCF
Figure 03: Local dumping ground in Kodihalli, Bengaluru. The presence of a sign “Don’t put garbage here” has no effect on this local dumping ground. There is a build up of garbage immediately after clearance, i.e. 8am (Top) which consistently builds up. The image below shows the build-up at 3pm. (Source: WUCU,2012)
scientific landfills, construction of transfer stations, deployment of specific vehicles and understanding chemical components of waste would also need to be addressed. Thus, the responsibility of SWM was shifted to the Engineering Department.
After the formation of the BBMP, the corporation followed a PPP model and supported various vendors in the setting up of processing facilities in the city. The predominant vendors who were involved were Ramky, SGRRL and Terra Firma, which had capacities to process 600, 1000 and 1000 tonnes of waste per day respectively. However, the SWM system was plagued with a few persistent problems – there were barely any efforts to continue promoting segregation at source or provide standardised training for BBMP staff, hence mixed waste continued to be collected and there was no check on the dumping of waste at Mandur and Mavallipura landfills.

Extracting value from Bengaluru’s Dry Waste ChainBackground
13A collaborative effort of SVP, WUCU and BCCF
Following these problems, three key events occurring around the same time, in 2012 led to a state of crisis in the city’s SWM system.
1. Closure of the Mavallipura landfill, ordered by the Karnataka State Pollution Control Board (KSPCB) Chairperson due to non-compliance with the Municipal Solid Waste Management Rules (2000), by its operator Ramky. This closure was upheld by the High Court of Karnataka.
2. Protest by the villagers of Mandur (Bengaluru’s other major landfill), against continued dumping and poor sanitary conditions at the site, and
3. The unrest created by the waste collection contractors during the same time
Due to all three factors, around 10,000 tons of waste was dumped on the streets of the city and the BBMP came under a barrage of criticism.
After the dissolution of BAFT, the year 2008 saw the formation of a civil society platform called the Solid Waste Management Round Table (SWMRT). In the heat of these events, this group comprising NGOs, activists and practitioners in the field of SWM came to the fore-front. In July 2012 a PIL was filed by Kavitha Shankar (SWMRT member) against the Government and the respective departments for failure to comply with the laws under the Environment Protection Act, therefore the case of SWM for the city was moved from the Lok Adalat to the High Court.
Since then, there has been a shift in the policy of the BBMP towards SWM. Acknowledging that the practice of transporting and dumping waste was neither sustainable nor responsible, the BBMP adopted the approach of segregation at source and began encouraging decentralised waste processing facilities within the city. In addition to this, there was also a need to bring about consensus between various opinion-makers on principle, this led to the formation of the BBMP-SWM Expert Committee. WUCU, a week long event held at Freedom Park in February 2013, intended to be a space which introduced different technologies and solutions that can be easily adopted for waste management, and to educate citizens on the problem and possible solutions.
1.3. NEED FOR THIS REPORTQUANTIFICATION AND ASSESSMENT
While the basis for the way forward has been outlined, the fact remains that Bengaluru still does not have a comprehensive city policy with regard to SWM- that includes aspects of collection, transportation, aggregation and processing. This brought various practitioners and experts to the realisation that there is a need to understand the waste generation patterns of the city, without which it would be impossible to frame a policy. In February 2013, ‘Wake Up Clean Up’ (WUCU), an expo that showcased solutions and products offered by vendors for SWM, was conducted at Freedom Park.
The PIL by the High court bend directed the SWM committee to enunciate the principle driving the policy, programmes and principles. The Expert Committee responded with a report titled ‘A Future Without Landfills’, that outlined its take on the basic principles that would need to be adopted for a sustainable SWM system. At the behest of the high court,this report was put out for public consultation.

Extracting value from Bengaluru’s Dry Waste Chain Background
14 A collaborative effort of SVP, WUCU and BCCF
1.4. OUR PARTNERSCATALYST, FUNDERS AND SUPPORT
The report was done in collaboration with multiple organisations, each taking on a different role, that of catalysing, funding and funding the effort. Each partner has contributed in a unique way to lend accuracy to this study and convert it into implantable recommendations. A core team has studied the data that has been received from the ground and after careful analysis, converted these into specific recommendations that aim to strengthen the current solid waste management system in Bengaluru. The collaborative nature of the study has also helped lend a high degree of accuracy to the report, since a lot of support was taken from BBMP officials, self-help groups and NGOs to get a comprehensive picture of current SWM practices in the city.
1.4.1. CATALYST
One of the other realisations that are now being addressed was the understanding that different waste streams require different norms and processes for handling. Dry waste has become a point of focus, because of the potential of recycling and the informal market around the same.
However, the fact remains that there is very little we understand about the flow of dry waste in the city and the sector that transports, aggregates and processes it. There is huge potential and capacity in this sector – however, it largely operates separately from the BBMP and without sufficient data and hence there is little scope for a positive intervention. This report, therefore, seeks to fill that gap. With extensive field research and analysis of data, it focuses on:
• Establishing a the ratio between wet and dry waste, hence indicating the increase in dry waste due to an increasingly consumerist society (Common types of wet and dry waste are listed in Table 01)
• Outlining the working of the informal sector , the dry waste chain and the entities within it
• Understanding the kind of market that currently exists for different streams of dry waste, and in turn pointing out the streams that currently do not have an existing market value
• Assessing the various systems already existent and framing recommendations for intervention, based on observations on the field – Segregation at source, Transportation and Collection, Dry Waste Collection Centres and Processing Capacities
BIO-DEGRADABLE / WET WASTE NON BIO-DEGRADABLE / DRY WASTE
Vegetables and fruitsFood wasteFlowers and leaves from gardens
Paper: Newspapers, print-outs, diaries, text and note-books, tissue paper, carton boxes etc.Plastics: PET and other bottles, utensils, plastic covers and packaging, milk covers etc.Glass and ceramics: ketchup, maggi, beer, whisky bottles etc.Metals: soft-drink cans, aerosol cans, aluminium foils, etc.Old clothesTetrapkas: juice, milk and whisky tetrapaksLaminates: kurkure and biscuit packets, flour packets.
Table 01: Common Types of Wet Waste and Dry Waste(Source: Hand in Hand, 2014)

Extracting value from Bengaluru’s Dry Waste ChainBackground
15A collaborative effort of SVP, WUCU and BCCF
WAKE UP CLEAN UP BENGALURU!
Wake Up Clean Up Bengaluru (WUCU) was conceptualised as an expo in 2013, as a collaboration of industry players with BBMP, supported by the Bengaluru City Connect Foundation (BCCF). Post the event, WUCU continued as an inter-stakeholder platform, that represented the interests and opinions of the various entities that exist in the waste space in Bengaluru – the municipal corporation, practitioners, NGOs, self-help groups and consultants among others. Its scope was hence further extended to seek a consensus on strategic direction through an inclusive city-wide dialogue between government agencies, experts, service and technology providers, organized bulk generators of waste and civil society. Today, it is a movement that looks to convert waste management solutions into a reality.
1.4.2. FUNDERS
SOCIAL VENTURE PARTNERS BENGALURU (www.socialventurepartners.org/bangalore/)
Social Venture Partners (SVP) is the world’s largest network of engaged donors, with partners who come from diverse professional backgrounds. The partners of SVP cultivate effective philanthropists, support non-profits and invest in collaborative solutions which have large social impact across a variety of fields. SVP Bengaluru is part of SVP India and has over 70 partners subscribing to the core principle of philanthropy in action. Apart from grant giving and mentoring NGOs, SVP Bengaluru decided to be involved on one city based issue, this was the garbage crisis that the city faced. While the subject is a complex one, it was decided to focus on the Dry Waste component of MSW to showcase the value potential that can be extracted from the Dry Waste chain.
BENGALURU CITY CONNECT FOUNDATION (www.cityconnect.in)
The Bengaluru City Connect Foundation (BCCF) is a registered non-profit trust. City Connect is a collaborative platform catalysed by Business for Civil Society and Government to work together to make cities more liveable. Our cities face similar problems across the country - traffic, water shortage, pollution, garbage etc. The solution set is reasonably well known. What is needed is local initiative to make it happen. City Connect aims to enable this collective effort.
1.4.3. SUPPORT
HAND IN HAND (www.hihindia.org)
Hand in Hand (HiH) is a public charitable trust serving 8 states in India and 7 countries across 3 continents. The vision of the organisation is ‘to alleviate poverty through job creation and integrated community development’. Their five pillar programme focuses on Shelf Help Groups (SHGs), Child labour elimination, Environment, Health and Citizens’ Centre Enterprises. For this report HiH, Chennai supported the study through extensive fieldwork over 6 months during 2013-14.
OTHERS
We would also like to acknowledge the support provided by PwC India and Centre for Public Problem Solving (CPPS) Bengaluru, who assisted in ideating, methodology and compilation of different parts of the report.
Extracting value from Bengaluru’s Dry Waste Chain The Dry Waste Chain
16 A collaborative effort of SVP, WUCU and BCCF
2. THE DRY WASTE CHAIN
2.1. BACKGROUNDEVOLUTION OF THE DRY WASTE CHAIN
Today , with the concern of mounting landfills threatening Bengaluru, terms such as ‘recycling’ and ‘re-use’ have become buzzwords that are being used frequently. However, in the Indian context, these are not new concepts. It must be kept in mind that most Indian cities and towns have had networks of local Kabadiwallahs that have been operating for decades now. Items like newspapers, glass bottles etc. are often sold directly by households to Kabadiwallahs; old metal utensils are sometimes sold for melting down and reuse. These networks generally collected items directly from households often in exchange for other new products or items, therefore ensuring that they perpetuate recycled goods. Many communities would donate items to temples and orphanages, ensuring that a large proportion of waste material was not thrown away, but passed on to someone else. The habit of ‘re-use’ and ‘recycle’, as relevant in those times, seems to have been an integral part of “Indian culture”!!
As a result of this ethic, a certain degree of segregation was intrinsic and hence introduced to the market very early. This was purely because the entities who collected various waste streams, such as newspapers, scrap metal and fabric, were separate individuals and represented different material streams. Each of these entities propagated the culture of reuse by ensuring that waste material that wasn’t passed down as hand-me-downs and shared with the larger community; was passed into the recycling stream. The end result was that a much a smaller quantum of dry waste was left to discard. Wet waste or kitchen waste was anyway composted individually or at the village level.
Today, however, the rise of consumerism has brought with it both an increase in the overall quantum of waste and in specific enhanced the dry waste stream of packaging which are essentially non-usable elements of waste. There has also been an influx of new and hybrid materials which as yet don’t have proven technologies that are commercially viable. Hence there is no way to utilise some of these materials and convert them to an end product with commercial market value. This waste stream that cannot yet be upcycled or processed, is in common parlance referred to as ‘low-value waste’. The introduction of so many complex waste streams has brought society to a point where we have to view the handling of waste in a more professional way and treat distinct waste streams differently.
The change in habits of a consumerist society, advancements in packaging and the overall increase in population have given rise to a situation where large quanta of mixed waste are being thrown out by households and bulk generators, which is entering the waste stream. On the one hand, we now have a lot more waste than we can deal with; on the other, much of it comprises new hybrid materials with no upstream market to utilise them for further processing. Since they are not easily incorporated into the waste chain, they stand out as eye sores, contributing heavily to visible litter on the streets and landfills. These include items that no waste-picker wants to trade in. The other challenge of huge quantities needs to be addressed by creating sufficient skill and capacity to channelise it into the recycling market. In this context, it has become even more crucial to understand:
• The components of the waste chain,
• The varying scale and type of generators, and
• How effective collection of dry waste can be enabled at source, thereby addressing the challenges faced with respect to collection, storage and sorting.

Extracting value from Bengaluru’s Dry Waste ChainThe Dry Waste Chain
17A collaborative effort of SVP, WUCU and BCCF
2.2. CURRENT SCENARIOBENGALURU’S EXISTING DRY WASTE CHAIN
The dry waste chain in Bengaluru constitutes both the formal and informal sector (Figure 04), both of which are highly intertwined with each other. In addition to this, there has been the introduction of the DWCCs by the BBMP, which is an attempt at integrating the formal and the informal. This chain is primarily composed of Collectors (Pourakarmikas, Waste-pickers and Auto-tippers), Aggregators (Dry Waste Collection Centres, Kabadiwallahs, Scrap-dealers, etc.) and Processors.
Figure 04: Bengaluru’s Dry Waste Chain(Source: WUCU, 2014; Illustrations - Girish T.S., 2011)
Extracting value from Bengaluru’s Dry Waste Chain The Dry Waste Chain
18 A collaborative effort of SVP, WUCU and BCCF
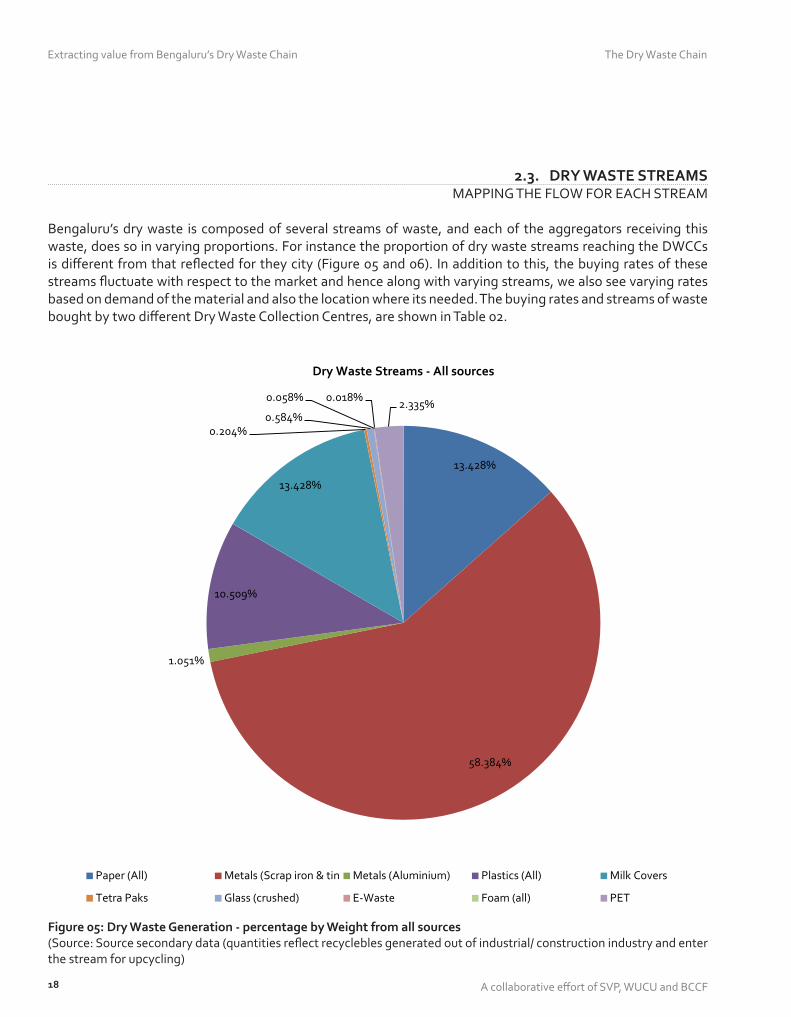
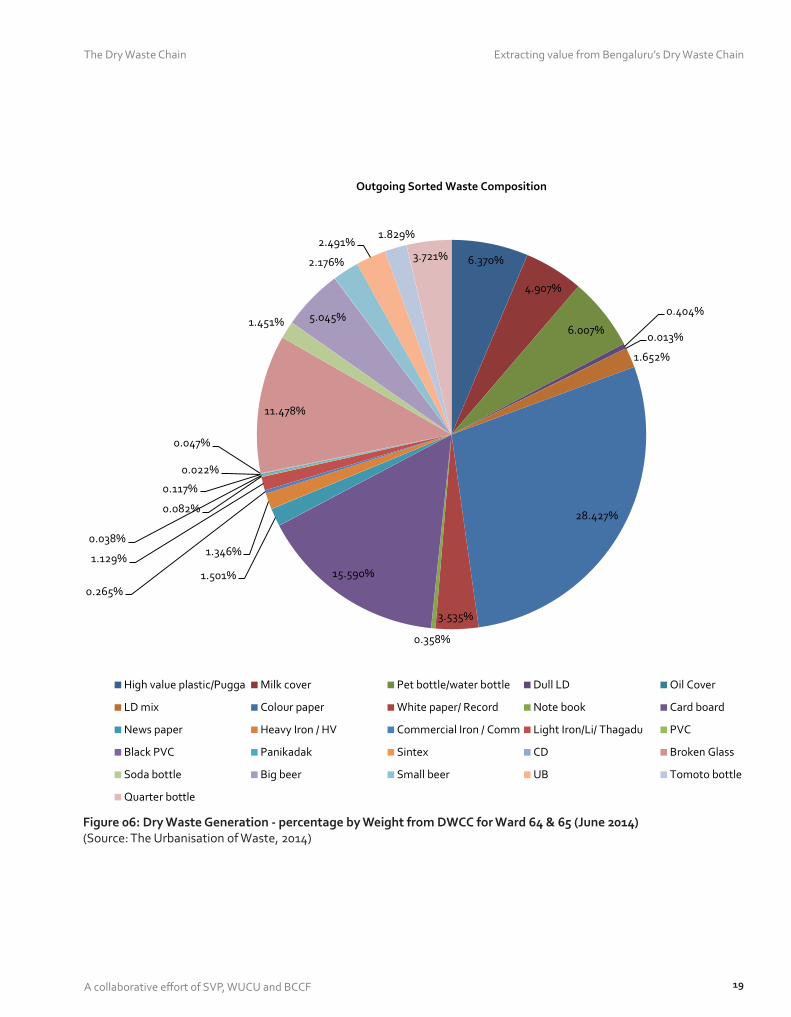
2.3. DRY WASTE STREAMSMAPPING THE FLOW FOR EACH STREAM
Bengaluru’s dry waste is composed of several streams of waste, and each of the aggregators receiving this waste, does so in varying proportions. For instance the proportion of dry waste streams reaching the DWCCs is different from that reflected for they city (Figure 05 and 06). In addition to this, the buying rates of these streams fluctuate with respect to the market and hence along with varying streams, we also see varying rates based on demand of the material and also the location where its needed. The buying rates and streams of waste bought by two different Dry Waste Collection Centres, are shown in Table 02.
Figure 05: Dry Waste Generation - percentage by Weight from all sources(Source: Source secondary data (quantities reflect recyclebles generated out of industrial/ construction industry and enter the stream for upcycling)
13.428%
58.384%
1.051%
10.509%
13.428%
0.204%0.584%
0.058% 0.018% 2.335%
Dry Waste Streams - All sources
Paper (All) Metals (Scrap iron & tin Metals (Aluminium) Plastics (All) Milk Covers
Tetra Paks Glass (crushed) E-Waste Foam (all) PET
Extracting value from Bengaluru’s Dry Waste ChainThe Dry Waste Chain
19A collaborative effort of SVP, WUCU and BCCF
Figure 06: Dry Waste Generation - percentage by Weight from DWCC for Ward 64 & 65 (June 2014)(Source: The Urbanisation of Waste, 2014)
6.370%
4.907%
6.007%
0.404%
0.013%
1.652%
28.427%
3.535%
0.358%
15.590%1.501%
1.346%
0.265%
1.129%
0.082%
0.038%
0.117%
0.022%
0.047%
11.478%
1.451% 5.045%
2.176%
2.491%1.829%
3.721%
Outgoing Sorted Waste Composition
High value plastic/Pugga Milk cover Pet bottle/water bottle Dull LD Oil Cover
LD mix Colour paper White paper/ Record Note book Card board
News paper Heavy Iron / HV Commercial Iron / Comm Light Iron/Li/ Thagadu PVC
Black PVC Panikadak Sintex CD Broken Glass
Soda bottle Big beer Small beer UB Tomoto bottle
Quarter bottle

Extracting value from Bengaluru’s Dry Waste Chain The Dry Waste Chain
20 A collaborative effort of SVP, WUCU and BCCF
Based on field study, 11 streams have been identified in all. Hence keeping in mind that the proportions vary, the focus has then been to map the flow of different categories generated through various agencies before they reach processing centres. Through this flow, the buying rates at every step have also been mentioned.
2.3.1. METALS
The metal waste generated in Bengaluru can be broadly categorized into scrap iron, tin, aluminium, copper, brass and bronze. Almost 95% of metal scrap is made up of iron and tin from construction sites, metal forming industries and households. Copper wires, brass, bronze and aluminium (cans, foils, automobile components, household articles, etc.) make up rest of this category. Each category of waste is handled exclusively by different agencies that then process (primary – cutting/bailing) it before sending it to processing industries in Bengaluru as well as across the country. Scrap iron and tin are sent for melting into billets to industries in Hindupur in Andhra Pradesh and Hosur in Tamil Nadu. Brass and bronze scrap is sent to Salem, Pondicherry, Ahmedabad and Jamshedpur for recycling, while almost 85% of copper waste is sent to Delhi for recycling. 50% of the
Waste Category Cost per kg
Kasa Rasa 2 Koramangala (17-9-2013)
Mixed waste 2
Carton Box 5
News paper 7
White paper 6
PET bottle 15
Milk covers 11
Tetra Pak
Plastic 15
Super 2
Glass 1
Thagadu/iron 7
Tin 40
DWCC Jayanagar (17-9-2013)
Mixed plastic 12
Card board 5
News paper 8
White paper 6
PET bottle 15
Milk covers 10
Tetra Pak 3
Table 02: Price Lists of two different DWCCs taken on the 17th of September, 2013

Extracting value from Bengaluru’s Dry Waste ChainThe Dry Waste Chain
21A collaborative effort of SVP, WUCU and BCCF
Figure 07: Flow of Tin & Iron scrap(Source: Hand in Hand, 2014)
Aluminium waste generated in Bengaluru is recycled in Bengaluru at Nayandahalli, Kumbalgodu and Horahalli, while the rest is sent to Delhi and Hyderabad.
Flowcharts depicting the waste chain of Iron and Tin, Aluminium and Copper wiring scrap is shown in Figures 07, 08 and 09 respectively.

Extracting value from Bengaluru’s Dry Waste Chain The Dry Waste Chain
22 A collaborative effort of SVP, WUCU and BCCF
Figure 08: Flow of Aluminium scrap (Beverage cans, Foil, etc.)(Source: Hand in Hand, 2014)

Extracting value from Bengaluru’s Dry Waste ChainThe Dry Waste Chain
23A collaborative effort of SVP, WUCU and BCCF
Figure 09: Flow of Copper wiring scrap(Source: Hand in Hand, 2014)

Extracting value from Bengaluru’s Dry Waste Chain The Dry Waste Chain
24 A collaborative effort of SVP, WUCU and BCCF
2.3.2. PAPER
Newspaper, carton/corrugated boxes, notebooks and textbooks, white paper, tissue paper, magazines and glossy paper, coloured paper and directories constitute the paper waste generated in Bengaluru. A large number of paper mills in Karnataka (Bengaluru and Mysore) and in neighbouring states of Tamil Nadu (Hosur, Coimbatore, Sathymanagalam and Palani), Andhra Pradesh (Hyderabad) as well as in Orissa ensure paper waste is high in demand amongst the various dealers/agencies involved in its collection. The break-up of the various categories of paper waste generated in Bengaluru is given in Table 03.
Various categories of paper waste generated from households, office complexes, industries, school and college campuses and hospitality industry is collected by and moved from Kabadiwallahs and waste contractors to larger dealers/agencies, which then send the accumulated waste to the respective mills. Traders, who do not handle the waste directly, but facilitate sales of paper waste between aggregation agencies and paper mills are also present in the market. However, proliferation of agencies involved in collection and accumulation in Bengaluru has reduced the margins involved in sales between the layers involved in handling this category of waste.
Paper cups are a sub-category which is not collected by too many agencies in the market. The main reason stated by agencies spoken to is the presence of fine plastic film on the insides of the cup. However, after a discussion with a paper cup manufacturer, it is understood that ITC is a recycler for this category of waste.
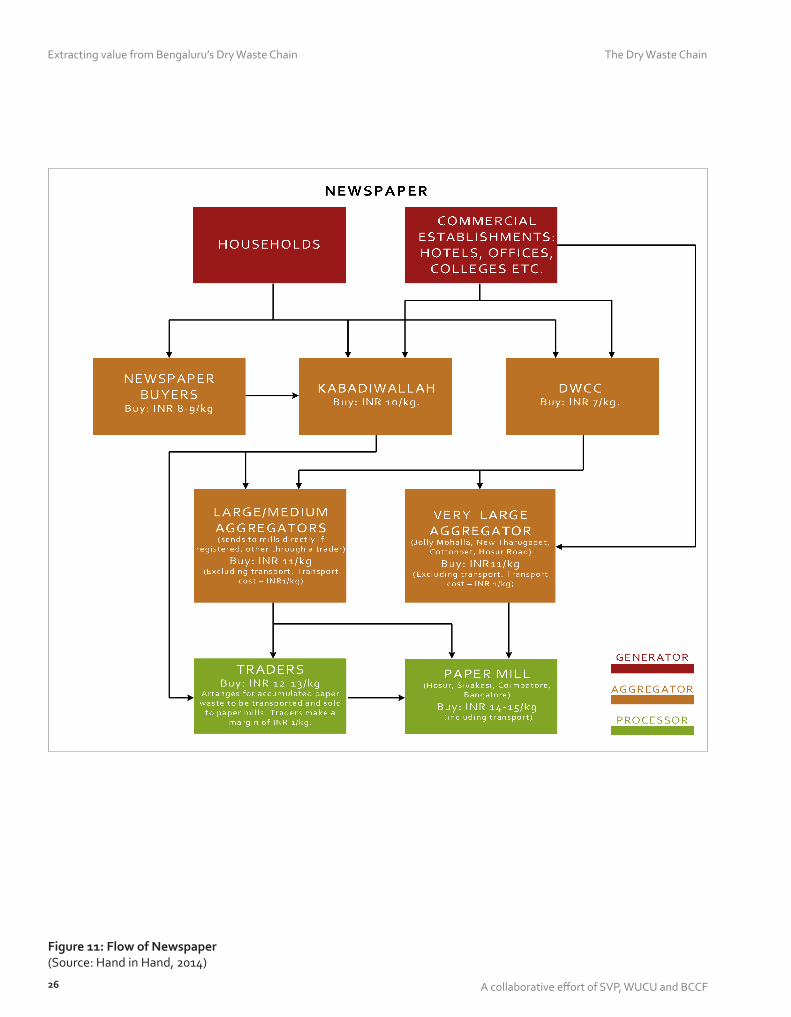
Flowcharts depicting the waste chain of Carton Boxes, Newspaper and Paper scrap is shown in Figure 10, 11 and 12 respectively.
SL. NO. PAPER WASTE CATEGORY VOLUME/MONTH
1 Carton/Corrugated Boxes 5000 – 6000 tonnes
2 Newspaper 8000 – 9000 tonnes
3 Notebooks/Textbooks Approximately 2000 tonnes
4 White Paper Approximately 3000 tonnes
5 Magazines/Glossy paper Approximately 2500 tonnes
6 Colored Paper Approximately 1500 tonnes
Table 03: Categories of Paper waste an their quanta(Source: Hand in Hand, 2014)

Extracting value from Bengaluru’s Dry Waste ChainThe Dry Waste Chain
25A collaborative effort of SVP, WUCU and BCCF
Figure 10: Flow of Carton/Corrugated boxed(Source: Hand in Hand, 2014)
Extracting value from Bengaluru’s Dry Waste Chain The Dry Waste Chain
26 A collaborative effort of SVP, WUCU and BCCF
Figure 11: Flow of Newspaper(Source: Hand in Hand, 2014)

Extracting value from Bengaluru’s Dry Waste ChainThe Dry Waste Chain
27A collaborative effort of SVP, WUCU and BCCF
Figure 12: Flow of Paper scrap(Source: Hand in Hand, 2014)

Extracting value from Bengaluru’s Dry Waste Chain The Dry Waste Chain
28 A collaborative effort of SVP, WUCU and BCCF
2.3.3. PLASTICS
The plastic waste generated in Bengaluru range from a wide variety of products from LDPE carry bags to households products to TV casings to automobile parts (Table 04). On a broader scale, plastic wastes can be categorised into low-value and high-value plastics. Low-value plastics include LDPE covers (<40 microns), biscuit, flour, oil, kurkure, maggi noodles covers. High-value plastics include LDPE (>40 microns) and HDPE covers, PVC products (bottles, pipes, covers, files, plastic sheaths on cables etc.), Polypropylene (hard white
S. NO LOCAL NAME TYPE OF ITEMS
1 PP (white)Hard white plastic. Typically used to pack shirts; Food Containers, gunny bags,
2 PP (colour)Hard coloured plastic. Typically seen in cloth stores where printed plastic covers are given with the items purchased; car and bike bumpers
3 LD (white)Smooth white plastic. Typically used to wrap electronic items like TV, car body parts etc.
4 LD (colour)Smooth coloured plastic. Packaging material used for electronic components, mechanical body parts, generators, auto parts.
5 HM (white) Typical white plastic cover given in grocery stores
6 HM (colour) Usually blue in colour – the kind they give in hardware stores
7 Phugga (white) Food parcel containers, buckets, mugs, etc. Which are white in colour.
8 Phugga (colour) Coloured phugga items
9 PVCPVC pipes, covers used to pack blankets, soft transparent files, plastic sheaths on cables
10Super (a term used by DWCCs)
Soiled low quality plastic items
11 Coating PPThese are the low value plastic items, such as labels of PET bottles, chips packet, biscuit packet, etc.
12 LLDPE Milk Covers
13 ABS Automotive bumper parts, TV casings
Table 04: Categories of Plastic waste(Source: Hand in Hand, 2014)

Extracting value from Bengaluru’s Dry Waste ChainThe Dry Waste Chain
29A collaborative effort of SVP, WUCU and BCCF
plastics – food containers from hotels, gunny bags, car and bike bumpers etc.), ‘phugga’ (plastic mugs, buckets, containers etc.), HM (plastic covers from super markets, transparent covers for vegetables etc.).
HIGH-VALUE PLASTICS
High-value plastic wastes are generally bought to the local Kabadiwallah or Dry Waste Collection Centres (DWCCs) as mix plastic. These are sorted into a basic 5-6 categories before they are sent to larger aggregators, where it is further sorted into another 20-25 categories. Jolly Mohalla and Nayandahalli are the two major centres in Bengaluru for plastics aggregation and sorting. While a majority of the waste plastics are reprocessed in Bengaluru itself (Figure 13), certain categories of plastics (pens, PVC pipes etc.) are sent to other locations in India.
Kabadiwallahs, DWCCs, aggregators cum traders, aggregators cum sorters and processors are the most common layers found in the flow chain of plastic wastes in Bengaluru.
The total volume of plastic waste generated in Bengaluru is around 550-600 TPD. Large traders stock plastic waste during the monsoon and winter seasons to trade during the summer months as the rates for the different kinds of plastics also increase during these months. During this period, the volume of plastic waste that is handled by collectors, aggregators and processors goes up to nearly 800 TPD.
A flowchart depicting the waste chain of High-value plastics is show in Figure 14.
Figure 13: LDPE & HM Plastics Processing Center established at JC Road by BVG India(Source: Hand in Hand, 2014)

Extracting value from Bengaluru’s Dry Waste Chain The Dry Waste Chain
30 A collaborative effort of SVP, WUCU and BCCF
Figure 14: Flow of High-value Plastic(Source: Hand in Hand, 2014)

Extracting value from Bengaluru’s Dry Waste ChainThe Dry Waste Chain
31A collaborative effort of SVP, WUCU and BCCF
LOW-VALUE PLASTICS
These are categorized as low-value plastics and rejected by Kabadiwallahs, DWCCs and other aggregators as recycling options for this category of waste is either not known or not available in the city. Further, due to their low weight to volume ratio, aggregators do not find it viable to store this scrap. As a result, they are rejected by most aggregators and either burnt or sent to landfills.
However, there are recyclers in Bengaluru who purchase these plastics to melt into blocks (Figure 15). These blocks are then extruded to make irrigation pipes.
A flowchart depicting the waste chain of Low-value plastics is shown in Figure 16.
Figure 15: Low value plastics (dry waste) accumulated at the BVG Processing centre(Source: Hand in Hand, 2014)

Extracting value from Bengaluru’s Dry Waste Chain The Dry Waste Chain
32 A collaborative effort of SVP, WUCU and BCCF
Figure 16: Flow of Low-value Plastic(Source: Hand in Hand, 2014)

Extracting value from Bengaluru’s Dry Waste ChainThe Dry Waste Chain
33A collaborative effort of SVP, WUCU and BCCF
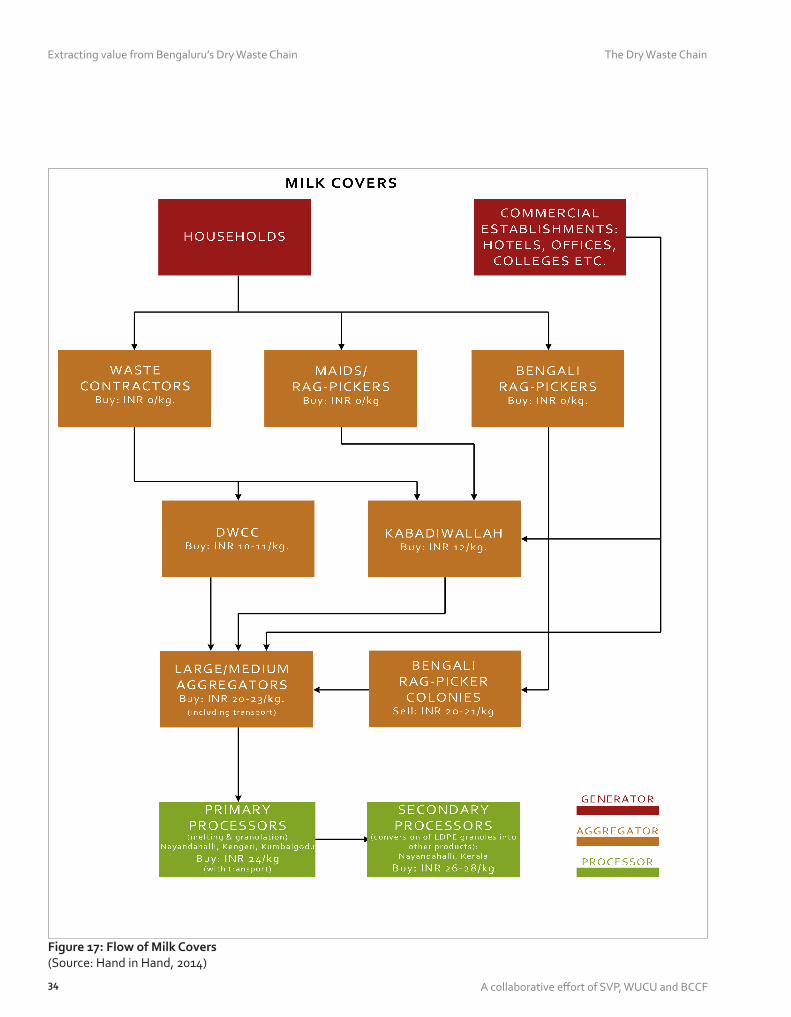
2.3.4. MILK COVERS
Milk covers made of Low-density polyethylene (LDPE) is a high-value plastic waste and in high demand in the recycling market as they can be processed into granules which are then used for producing other products like LDPE bags and tarpaulin sheets.
The flow of milk covers is similar to other plastic scraps – from households and hotels to Kabadiwallahs to large aggregators – before they are sent to recyclers in Bengaluru. Approximately 30 tonnes of milk covers are generated and recycled in Bengaluru every month.
A flowchart depicting the waste chain of Milk Covers is shown in Figure 17.
Extracting value from Bengaluru’s Dry Waste Chain The Dry Waste Chain
34 A collaborative effort of SVP, WUCU and BCCF
Figure 17: Flow of Milk Covers(Source: Hand in Hand, 2014)

Extracting value from Bengaluru’s Dry Waste ChainThe Dry Waste Chain
35A collaborative effort of SVP, WUCU and BCCF
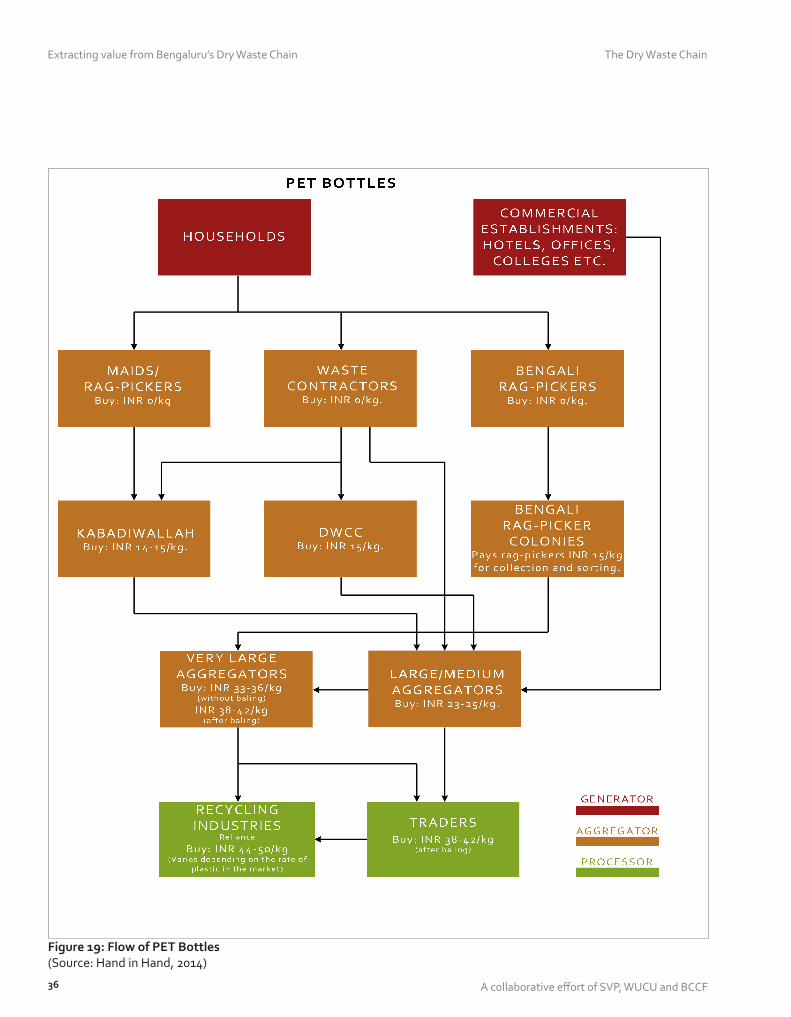
2.3.5. PET BOTTLES
PET (Polyethylene Terephthalate) is a category of plastic most commonly found in the form of water bottles (Bisleri, Aquafina, Soft Drink Bottles, etc.), medicine and chemical bottles, and containers (food containers, oil containers etc.).
PET waste is in high demand amongst the dealers/agencies supplying the same to the recycling industries in Gujarat and Mumbai. As a result, its value ranges from INR 15-18/kg at the local Kabadiwallah to INR 45-50/kg at the aggregation centre despatching to the recyclers.
Water and soft drink bottles are not mixed with other PET containers and have a separate recycling stream. The labels and caps of water and soft drink bottles are not removed before bailing, while the metal caps and rings on medicine and chemical bottles are removed.
There are approximately around 10 large dealers in Bengaluru who regularly supply around 3500-4000 tonnes of PET scrap per month to recycling units (Figure 18). A few traders (who do not handle the material directly, but act as intermediaries between aggregator and recycler) are also present in the market. Contracts with end customers are also common in this sector.
A flowchart depicting the waste chain of PET bottles is shown in Figure 19.
Figure 18: PET bottles and Rubber shoes accumulated at a Bengali Colony, Marathahalli(Source: Hand in Hand, 2014)
Extracting value from Bengaluru’s Dry Waste Chain The Dry Waste Chain
36 A collaborative effort of SVP, WUCU and BCCF
Figure 19: Flow of PET Bottles(Source: Hand in Hand, 2014)
Extracting value from Bengaluru’s Dry Waste ChainThe Dry Waste Chain
37A collaborative effort of SVP, WUCU and BCCF
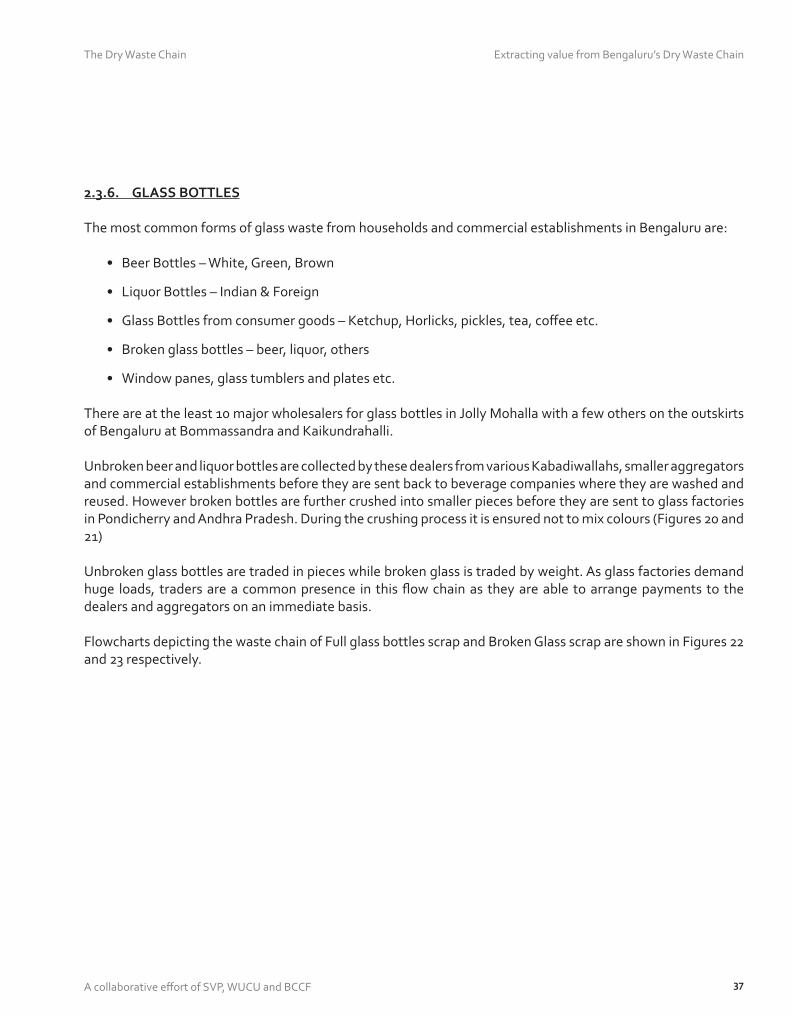
2.3.6. GLASS BOTTLES
The most common forms of glass waste from households and commercial establishments in Bengaluru are:
• Beer Bottles – White, Green, Brown
• Liquor Bottles – Indian & Foreign
• Glass Bottles from consumer goods – Ketchup, Horlicks, pickles, tea, coffee etc.
• Broken glass bottles – beer, liquor, others
• Window panes, glass tumblers and plates etc.
There are at the least 10 major wholesalers for glass bottles in Jolly Mohalla with a few others on the outskirts of Bengaluru at Bommassandra and Kaikundrahalli.
Unbroken beer and liquor bottles are collected by these dealers from various Kabadiwallahs, smaller aggregators and commercial establishments before they are sent back to beverage companies where they are washed and reused. However broken bottles are further crushed into smaller pieces before they are sent to glass factories in Pondicherry and Andhra Pradesh. During the crushing process it is ensured not to mix colours (Figures 20 and 21)
Unbroken glass bottles are traded in pieces while broken glass is traded by weight. As glass factories demand huge loads, traders are a common presence in this flow chain as they are able to arrange payments to the dealers and aggregators on an immediate basis.
Flowcharts depicting the waste chain of Full glass bottles scrap and Broken Glass scrap are shown in Figures 22 and 23 respectively.

Extracting value from Bengaluru’s Dry Waste Chain The Dry Waste Chain
38 A collaborative effort of SVP, WUCU and BCCF
Figure 21: Primary processing of glass bottles at Manganampalya(Source: Hand in Hand, 2014)
Figure 20: Glass bottles sorted by color at a primary processing center – Manganampalya(Source: Hand in Hand, 2014)

Extracting value from Bengaluru’s Dry Waste ChainThe Dry Waste Chain
39A collaborative effort of SVP, WUCU and BCCF
Figure 22: Flow of Full glass bottles scrap(Source: Hand in Hand, 2014)

Extracting value from Bengaluru’s Dry Waste Chain The Dry Waste Chain
40 A collaborative effort of SVP, WUCU and BCCF
Figure 23: Flow of Broken glass scrap(Source: Hand in Hand, 2014)

Extracting value from Bengaluru’s Dry Waste ChainThe Dry Waste Chain
41A collaborative effort of SVP, WUCU and BCCF
2.3.7. TETRAPAK
Kabadiwallahs and other small and medium aggregators in Jolly Mohalla and other locations of Bengaluru do not collect tetrapaks as they do not have awareness on how to process tetrapak or the final destination for the same. However, NGOs such as Saahas, Hasirudala, Waste Wise Trust and Samarthanam have a dedicated collection program for tetrapaks before they are despatched to recyclers in Gujarat and Maharashtra.
Bengali colonies also play a major role in collection of tetrapaks from bars, office complexes, commercial establishment and local dumping points. The tetrapaks are then sorted and sent to ALH Enterprises, one of the largest aggregators for tetrapak in Bengaluru. A flowchart depicting the waste chain of Tetrapaks is shown in Figure 24.
Figure 24: Flow of Tetrapaks(Source: Hand in Hand, 2014)

Extracting value from Bengaluru’s Dry Waste Chain The Dry Waste Chain
42 A collaborative effort of SVP, WUCU and BCCF
2.3.8. RUBBER PRODUCTS
Rubber products are mainly of two types – tyres and other rubber products like shoe soles, rubber sheets etc.Tyres are bought by large aggregators for INR 4-5 per kg and then sold to pyrolysis industries who extract furnace oil and steel from the tyres.
Other rubber products are aggregated and sent to Delhi for recycling.
2.3.9. MATTRESSES/CUSHIONS/FABRICS
The flow of these waste products differs from other scrap in Bengaluru as they are not dealt with by Kabadiwallahs or other aggregators.
However, mattresses and cushions thrown out by households are taken away by rag-pickers from Bengali colonies (Figure 25) for the following:
• Re-use• Foam or cotton removed from the mattresses and cushions and sold to recyclers• The fabric left behind is discarded or burnt.
Cloth and other fabric waste from cloth mills and garment factories are collected by contractors and sold to various small retailers in the secondary market, Ramachandrapuram, also known as Chindi Bazaar. The fabric pieces are then sorted into similar colours, types etc. and then sold to local tailoring units. Certain fabrics are also exported to other states.
Figure 25: Accumulated mattresses and cushions at a Bengali Colony, Marathahalli(Source: Hand in Hand, 2014)

Extracting value from Bengaluru’s Dry Waste ChainThe Dry Waste Chain
43A collaborative effort of SVP, WUCU and BCCF
Figure 27: A plastic woven gunny bag (PP) processing center at Nayandahalli(Source: Hand in Hand, 2014)
Figure 26: PP Gunny bags recycled into PP ropes(Source: Hand in Hand, 2014)
2.3.10. GUNNY BAGS
Gunny bags can be categorised into the following types:
• Jute gunny bags• Plastic woven gunny
bags
There are atleast 50 shops/traders involved in the collection and aggregation of jute and gunny bags at Jolly Mohalla alone.
Damaged jute gunny bags are rethreaded and reused along with the good ones. Plastic gunny bags are made of PP (polypropylene) and can be recycled into granules. However, undamaged plastic woven bags are re-used. (Figure 26 and 27)

Extracting value from Bengaluru’s Dry Waste Chain The Dry Waste Chain
44 A collaborative effort of SVP, WUCU and BCCF
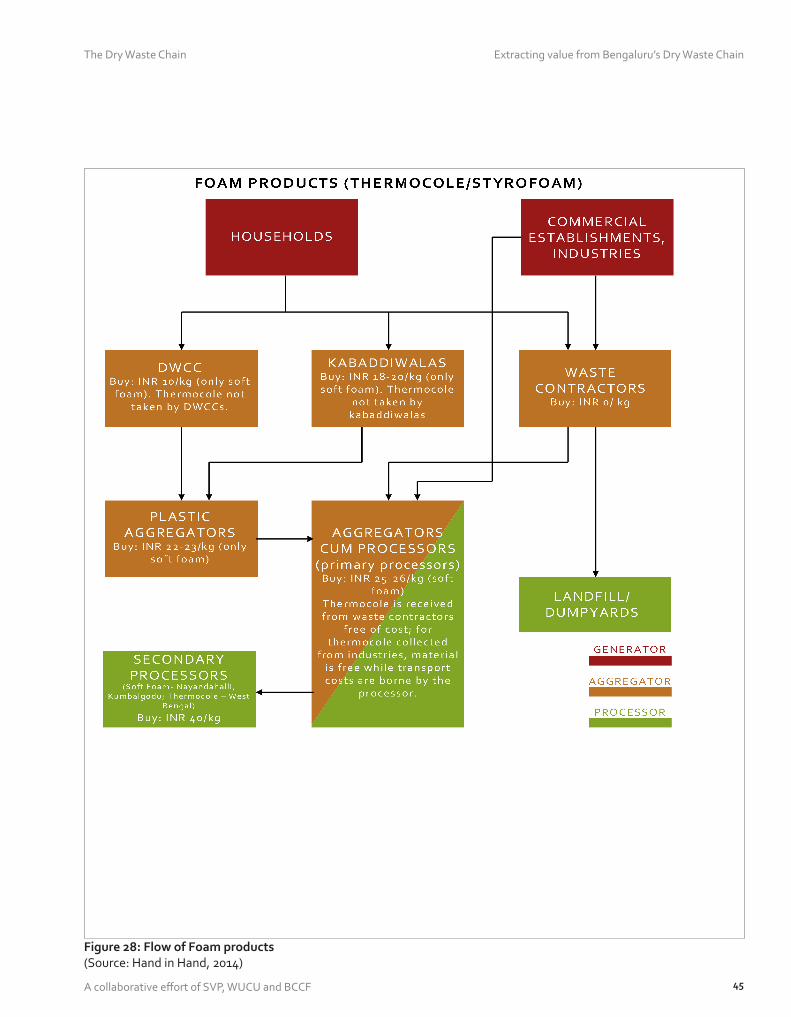
2.3.11. FOAM PRODUCTS (THERMOCOLE/STYROFOAM)
Thermocole (Expanded Polystyrene – EPS) is a commonly used packing material while Styrofoam is used by the food industry for packing beverages as well as cooked and uncooked food. Due to various reasons, thermocole and Styrofoam waste is generated very quickly and most often simply landfilled or incinerated. A few of the reasons are listed below:
• Most of the waste contractors in Bengaluru are also not aware about the proper disposal mechanism for foam products and therefore send these to landfills. A majority of Kabadiwallahs as well as DWCCs also refuse to take thermocole and foam as they are unaware of the buyers further up the chain.
• Aggregators and DWCCs do not find it viable to store thermocole due to their low weight and large space consumed for storage.
EPS recycling industries exist in Bengaluru (Peenya, Hoskote) and source their raw materials from industries. Thermocole is bought by recyclers for INR 3-4 per kg while and only a small stream of EPS waste is recycled.
A flowchart depicting the waste chain of Foam Products is shown in Figure 28.
Extracting value from Bengaluru’s Dry Waste ChainThe Dry Waste Chain
45A collaborative effort of SVP, WUCU and BCCF
Figure 28: Flow of Foam products(Source: Hand in Hand, 2014)

Extracting value from Bengaluru’s Dry Waste Chain Collection and Aggregation of Dry Waste
46 A collaborative effort of SVP, WUCU and BCCF
3. COLLECTION AND AGGREGATION OF DRY WASTE
3.1. THE INFORMAL SECTORPREVALENT PRACTICES AND PLAYERS
Given that the recycling ethic is not new in India and there are systems and networks dedicated to the reuse and recycling of dry waste. As the entities within this system have evolved, so has the system itself. For instance, there is a robust informal sector in waste that is active in Bengaluru, comprising a system of rag pickers/waste-pickers, scrap-dealers and aggregators of varying levels. This system has been working largely separate from the Municipal body (BBMP), although there are some levels of interaction during the initial stages of the collection process. Around 80-85% of dry waste in Bengaluru is handled by this informal sector.
3.1.1. PREVALENT PRACTICES
The existing Waste-picker, Kabadiwallah and Scrap-dealer network – what we’re now calling the informal sector – has for years been operating in clusters of communities, which have grown to form the bottom of the pyramid of our urban society. All cities, towns and villages in India are familiar with this recycling network that exists at neighbourhood level. In larger towns, due to a lack of space, the system is not as simple – there are larger players within the system, who source dry waste from groups of Kabadiwallahs. These players add value to the chain by sorting dry waste into specific categories and aggregating it for the benefit of the recycler. These can vary from small to very large aggregators.
The informal network in Bengaluru handles not just the MSW that is generated on a daily basis, which includes that collected by the BBMP’s door-to-door (D2D) collection system, for which the Pourakarmikas are employed, and that produced by Bulk generators (hotels, corporate offices), but also industrial waste (included by metal scrap) generated by large factories and the like. The collection of this waste lies outside the scope of the BBMP.
3.1.2. PLAYERS
As we see, there are two main activities that are taking place, that of collection and transportation, and the other of aggregation. Under both these, there are several players involved. Each of these handles different quantities of waste. An estimate based on primary interviews and field research of the quantum of waste handled by the Informal sector is shown in Box 02.
BOX 02: QUANTUM OF WASTE HANDLES BY THE INFORMAL SECTOR
Quantum of waste handled by rag-pickers: 1800-2000 kg/dayQuantum of waste handled by the average scrap-dealer: 250-300 kg/dayQuantum of waste handled by the average trader: 250 kg/dayQuantum of waste handled by the average medium aggregator: 1-5 TPDQuantum of waste handled by the average large aggregator: 10-20 TPDQuantum of waste handled by the average very large aggregator: 25-30 TPD
It must be noted, that through all primary interviews and sources of data collection the complete lack of uniformity of norms and standards stood out. We have tried to reflect the information provided by each player in the chain in its entirety and refer to the norms used by them to add to the richness of the study. The need for quantitative in-depth research cannot be over-emphasised.

Extracting value from Bengaluru’s Dry Waste ChainCollection and Aggregation of Dry Waste
47A collaborative effort of SVP, WUCU and BCCF
3.1.2.1. COLLECTORS
The general method of collection for independent residences and apartments is D2D collection 6 days a week, which was started by the BBMP back in 2003. Apart from this, community bin collection in recognised dump spots also gets cleared by the Pourakarmikas (PKs). In the newer zones, the collection is given to SHGs or RWAs. The PKs informally picks out valuable dry waste which he/she can sell informally to the Kabadiwallah or Scrap-dealer, the rest is then is given to Auto-tippers. The drivers of these vehicles also pick out remaining valuable dry waste to be sold informally, before they send the remaining waste to the formal sector.
Unofficially households and informal settlements tend to throw out their waste in ‘Black Spots’ which can emerge anywhere. It is in these mounds of mixed garbage that the rag-pickers/waste-pickers pick out valuable dry waste.
Pourakarmikas:
Pourakarmikas (PKs) are the waste collectors employed by the BBMP to render door-to-door (D2D) collection services. The PKs collect waste, sweep streets and clean shoulder drains (Figure 29). They are also responsible for the conservancy cleaning. Most PKs work as contract labour, though some are also direct employees of the BBMP. With the introduction of the D2D collection system in 2001 through the ‘Swaccha Bangalore’ initiative, a number of PKs were allocated pushcarts and buckets for collection of wet and dry waste. The cement bin system was removed which was the old prevailing system for garbage clearance in Bengaluru. The PKs started collecting and transacting in dry waste and soon found the potential of monetising this by selling clean hi-value dry waste to the local Kabadiwallah. The system is now acknowledges this value of dry waste and adds it to their perks!! Hence the introduction of the DWCCs, where rest of the waste is then brought independently or through Auto-tippers. Figure 30 demonstrates the flow of dry waste through the PKs.
Figure 29: Pourakarmikas at work in BengaluruPKs going about doing Door-to-door collection (Left) and street sweeping (right) in localities in Bengaluru(Source: left - unknown, right - Yashwanth, 2012)

Extracting value from Bengaluru’s Dry Waste Chain Collection and Aggregation of Dry Waste
48 A collaborative effort of SVP, WUCU and BCCF
A number of PKs commented on not receiving their salaries on time and how the income from selling to local Kabadiwallahs helps them get through their daily expenses.
A substantial number of them also belong to the rag-picker community and all the waste they are able to separate and retrieve is routed into the informal sector and traded. It seems as though the PKs belong to the same community, and if amalgamated they could all yield better results for the City.
Figure 30: Flow of waste through the Pourakarmikas(Source: WUCU, 2014)
Rag-pickers/Waste pickers:
Rag pickers form the rock-bottom base of the waste chain and comprise a body of independent individuals and families, often from displaced communities. They operate at the earliest stage of waste collection, and gather almost all categories of dry waste. They recover waste from community bins, dump sites, individual households and other commercial categories of generators, which they then sell to scrap-dealers (Figure 31). It is estimated that the volume of waste handled per day by rag pickers in the city ranges between 1800 – 2000 kgs.
Figure 31: Waste-picker picking out waste from a black spot in Hanumathanagar, Bengaluru(Source: Nagaraja Gadekal, 2012)

Extracting value from Bengaluru’s Dry Waste ChainCollection and Aggregation of Dry Waste
49A collaborative effort of SVP, WUCU and BCCF
There is of late, a large influx of Bengali rag pickers in Bengaluru who have begun to play a critical role in the flow of dry waste, thereby helping to increase the valuable scrap extracted from MSW and sent for recycling. Areas such as Marthahalli, Bellandur, Sarjapura Road, Bommanahalli, Bommassandra have a high concentration of Bengali rag-picker colonies. During the research they were initially hesitant to share the data for fear of being evacuated, but over time opened up and led us to many other congregations and sites of informal activity. It is, however, difficult to get verifiable data from them, as due to continuous harassment from the establishment they are suspicious and withdrawn.
Currently, there are between 50,000 to 60,000 Bengali rag-pickers who pick up waste from the informal neighborhood transfer points where PKs transfer from pushcarts/ tippers to a larger truck or compactor. They also gather a lot of waste from community dumping grounds and street corners with accumulated waste in what Bengaluru calls “black-spots” as well as some commercial establishments and apartments. They then sell this waste to larger aggregators along the waste chain. Over time some rag pickers have also invested in basic infrastructure such as tricycles to ease the collection and transportation cycle. They have developed large ‘One-Tonne’ gunny bags, which fit tight onto their tricycles and enable them to have a larger reach and cover more territory. It is estimated that the volume of waste handled by Bengali rag pickers per day ranges between 100-150 kgs. These are estimates given by the community.
In fact, low value and soiled scrap, ignored by BBMP conservancy workers and other rag-pickers are picked up from the waste collection vehicles by these Bengali rag-pickers and transported to their colonies where they are sorted and stored till they reach a quantum which can be sold to a large processor or at Jolly Mohalla. The outlying areas in which these colonies lie hidden have the space to provide for this sort of storage, since the areas are not yet fully developed.
There are many changes and developments that we noticed through the data collection cycle, and we are amazed at the pace of response. BBMP contractors for waste collection have employed some rag pickers from Bengali colonies as daily wage earners. Other rag pickers who have a well-entrenched system are willing to pay the BBMP contractor to be allowed to operate in the specific neighborhood and keep the dry waste they collect from households. Dry waste collected during this time is taken away to their respective colonies. Certain colonies also offer their waste collection services directly to apartment complexes for a nominal fee every month. Dry waste collected is sorted, accumulated and then sent to larger aggregators in the city, largely Jolly Mohalla for wholesale, if transport costs can be justified. The waste contractors and other rag pickers ignore certain categories of waste like mattresses, foam, etc. However, these are picked up by those living in these colonies and sent to appropriate recyclers.
It must be noticed in this context that the rag-pickers, who are involved in the collection of newspaper and old fabric, are vastly different from the community of scavengers, who are involved in the clearing out of pits and toilet facilities. Even within the community of rag pickers we met some who only sort, others who only collect and some where the tasks are divided clearly between those done by men and others by women. The hierarchy of these roles we found repeating themselves in the conversations with DWCC operators who expressed concern about these divisions as they make it very difficult to train and get the required output consistently.
A strong push in inclusion of waste-pickers and rag-pickers into the city’s SWM system has been through certain NGOs in the city, like Hasirudala and Mythri Sarva Seva Samithi (MSSS). Through the formation of a co-operative with Waste-pickers, they not only seek to improve their conditions of work but also ensure a continued access

Extracting value from Bengaluru’s Dry Waste Chain Collection and Aggregation of Dry Waste
50 A collaborative effort of SVP, WUCU and BCCF
Figure 32: Flow of waste through the Rag-pickers/Waste-pickers(Source: WUCU, 2014)
to recyclables in the city. They work towards accessing the benefits of various government programs to which waste-pickers are entitled, enhancing educational opportunities for their children and advancing the quality of their lives.
As we understand, flow of dry waste through rag-pickers varies and is flexible based on if it is an independent rag-picker or a community of rag-pickers. A basic flow of waste through them is shown in Figure 32.
Figure 33: A Tipping-Auto transferring waste into a Compactor(Source: Daily Dump, 2013)
Auto-tippers and Luggage Auto Drivers:
Auto-tippers and luggage autos (Figure 33) are the transfer vehicles of waste, i.e. secondary collection. They collect waste from PKs and then go to informal spots, popularly referred to as ‘Tipping Points’ or DWCCs within the ward. At these ‘Tipping Points’ waste is transferred into large trucks or compactors, to be taken to the landfill.
These autos fall under the contractor in that area, responsible for D2D collection. Usually the autos have two people employed – a driver and a loader/unloader. In this process of transfer, the auto-drivers and loader/unloader pick out valuable dry waste which they then sell independently to a local Kabadiwallah or Scrap-dealer (Figure 34).

Extracting value from Bengaluru’s Dry Waste ChainCollection and Aggregation of Dry Waste
51A collaborative effort of SVP, WUCU and BCCF
Figure 34: Flow of waste through the Auto-tipper and Luggage Auto(Source: WUCU, 2014)
3.1.2.2. SMALL-SCALE AGGREGATORS
These include Kabadiwallahs and Scrap-dealers, who are the first level aggregators and also the first point of waste buyers in the system. The types and amount of waste they aggregate varies and is highly dependant on the space availability. These informal shops are present in almost every locality.
Figure 35: A Kabbaddiwalla shop that aggregates predominantly paper(Source: Daily Dump, 2013)
Kabadiwallahs
Kabadiwallahs are present in all localities of the city and have connections with the formal recycling and re-use sector as well as wholesale traders. Undoubtedly the ‘recycle gurus’ of the city, they function as a bridge that aggregates and sends ‘high-value’ dry waste to traders. Kabadiwallahs, usually small in size (Figure 35), tend to accumulate only one or two specific streams of dry waste, like paper, glass bottles, plastics etc.
They buy ‘high-value’ dry waste from both formal (PKs, Auto tipper drivers, sweepers) and informal (itinerant buyers, rag-pickers) workers (Figure 36). Sometimes they tend to collect waste from offices, homes and institutions too.
This set of businessmen, possess immense knowledge of materials and processes.

Extracting value from Bengaluru’s Dry Waste Chain Collection and Aggregation of Dry Waste
52 A collaborative effort of SVP, WUCU and BCCF
Figure 36: Flow of waste through the Kabadiwallah(Source: WUCU, 2014)
BOX 03: SCRAP-DEALERSCase study -Munnuswamy, Bommasandra Industrial layout and Balaji, Panathur
For example, Munnuswamy, a scrap-dealer who operates within the Bommasandra Industrial Layout, deals only with carton boxes, of which he receives 4 to 5 tonnes each month. This waste is transported to Jigani by two of his relatives who own vehicles, where it is then purchased by agencies such as Sudhir Papers and RS Protus Paper Pvt Ltd. These are agencies that deal in paper re-sale to paper manufacturing units in Tamil nadu. Relatives who transport his waste to Jigani also collect carton scrap from other entities in the area, and in total acquire an amount of 5 and 10 tonnes per day respectively. They make a margin of 2 INR/kg, including the cost of transport and labour. The aggregated revenues are high though there is no real accounting or systems to corrobarate it.
Again, Balaji, a scrap-dealer based in Panathur, owns a shop that deals exclusively in old newspapers. Kabadiwallas and rag pickers who procure these newspapers from households and residential areas bring these to him. Balaji estimates that he collects around 1 tonne of newspaper on a monthly basis. This is then transported to a larger aggregator in Bommanahalli, with whom he has a tie-up.
Scrap-dealers:
Scrap-dealers serve as local community recyclers and purchase dry waste from rag-pickers, PKs and Kabadiwallahs. He has the space as well as the ability to employ a couple of rag-pickers who exclusively collect waste for him. He is the first point of contact that sets the value of the waste depending on the demand of in the market on that day. Unlike other categories of waste collectors, scrap-dealers usually do not face the predicament of space availability. They can spread the waste collected, sort as well as store, and above all, ensure that the quanta of waste collected procures a better price than small random quantities of waste allow.
In terms of infrastructure, most scrap-dealers also own small vehicles for the transportation of waste. Research in the field indicates that those that have manual balers ensure that their products get the best sale price from the middleman or aggregator they sell to.

Extracting value from Bengaluru’s Dry Waste ChainCollection and Aggregation of Dry Waste
53A collaborative effort of SVP, WUCU and BCCF
3.1.2.3. MEDIUM-SCALE AGGREGATORS
These aggregators purchase waste either from small-scale aggregators or directly from commercial establishments. They also sort dry waste into smaller categories based on the requirements of processors. The estimated volume of waste handled per day by medium aggregators ranges between 1-5 tonnes.
Like many waste collectors, a recurring challenge faced by medium aggregators is the lack of space (Box 04).
Some categories of waste are also purchased directly by these scrap-dealers from households and commercial establishments. They serve as first-level aggregators by accumulating waste before selling it in bulk to larger traders. Today, they have a well-evolved system of paying advances to rag-pickers, who then bring them a guaranteed supply of waste in the categories agreed to. Similarly, they have pre-determined arrangements with larger aggregators. They avoid waste that has a limited market example thermocol, LDPE bags and rubber products. The estimated volume of waste handled per day by medium sized Scrap-dealer ranges between 250-300 kgs.
While some scrap-dealers deal in several categories of waste, others are more specific in terms of operations (Box 03). The flow of waste through the scrap dealer is shown in Figure 37.
Figure 37: Flow of waste through Scrap-dealers(Source: WUCU, 2014)
BOX 04: MEDIUM-SCALE AGGREGATORCase study -Shivam, Munnekolala
For instance, Shivam, a medium-scale aggregator based in Munnekolala, operates out of a rented store with a bare minimum of storage space. On a monthly basis, he accumulates around 200 kgs of paper, 100 glass bottles and 500 kgs of scrap metal. This waste, due to lack of storage, is then transported on a weekly basis, either to aggregators in Jolly Mohalla or to larger aggregators in Whitefield.

Extracting value from Bengaluru’s Dry Waste Chain Collection and Aggregation of Dry Waste
54 A collaborative effort of SVP, WUCU and BCCF
3.1.2.4. LARGE-SCALE AGGREGATORS
They collect waste from medium aggregators, DWCCs and in some cases, commercial establishments. Large aggregators tend to specialise in specific categories of waste. They sometimes have direct tie-ups with processors. In other cases, they sell the waste to very large aggregators or traders (Box 05). Baling of waste sometimes happens at this stage and they are often dependent on immediate cash payments. The estimated volume of waste handled per day ranged between 10-20 tonnes.
3.1.2.5. VERY LARGE-SCALE AGGREGATORS:
The primary activities at this level in the chain include superficial sorting, aggregation and baling of waste (Box 06). Although a bulk of their waste is purchased from smaller-scale aggregators, waste is sometimes also collected from commercial bulk generators. They generally have direct tie-ups with processors. The estimated volume of waste handled per day ranges from 25 to 30 tonnes.
BOX 05: LARGE-SCALE AGGREGATORCase study -Om Shakti Scrap-dealers, Harlur Road
For example, Om Shakti Scrap Dealers, located on Harlur Road in the city, is one of the largest aggregators in this area. It is owned by Vijay, who hires 14 people – four to collect waste from local aggregators based on pre-fixed tie-ups, and 10 to further segregate waste into specific categories (including PVC, PET, milk covers and foam) based on recycler demands. Sorted waste is then transported to Nayandahalli for processing. Vijay also has an agreement with the BBMP contractor, who picks up the rejects materials.
BOX 06: VERY LARGE-SCALE AGGREGATORCase study -Moin, Jolly Mohalla
Along with aggregating waste, aggregators also perform basic services such as baling to add to the value of the finished output. For instance, Moin, who is located at Jolly Mohalla, aggregates between 4.5 to 6 tonnes of copper wire every month, which he purchases at 20 INR/kg. He has employed staff to strip the PVC sheet from this wiring (one person can strip around 100 kgs. of wire per day). Both the plastic and copper scrap are then sold to wholesalers within Jolly Mohalla itself, with the copper going for 400-450 INR/kg. He estimates that his labour charges are actually equal to the cost of raw material at 20 INR/kg.
3.1.2.6. OTHER RELEVANT PLAYERS:
Traders:
Traders exist as intermediaries at various stages along the waste chain. There is a large community of Marwari

Extracting value from Bengaluru’s Dry Waste ChainCollection and Aggregation of Dry Waste
55A collaborative effort of SVP, WUCU and BCCF
traders in Bengaluru’s informal waste sector and they generally have direct tie-ups with processors. They operate on the basis of immediate payment to the entity they are purchasing waste from; however, they do wait for delayed payments from processors and make the highest profit margin along the waste chain. The estimated volume of waste handled per day by traders is less than 250 kgs.
Jolly Mohalla:
Jolly Mohalla is a waste market in Bengaluru located near Cottonpet, which comprises of waste traders as well as aggregators of different levels. While some of them deal in specific categories of waste (for example, only metals), others purchase and sell a broad range, including categories of paper, plastic, glass, etc. They either have tie-ups with larger aggregators or directly with processors (Box 07).
The market comprises a series of shops and establishments spread out across a street near the BGS Flyover. The shopkeepers here deal in very specialized categories, such as white paper or newspaper, colored glass and specific metals. They too are wary of outsiders, since many of them are operating without any kind of recognition or license from the BBMP.
BOX 07: JOLLY MOHALLACase study - Ahmed and Mohsin, Wholesaler
Ahmed, a wholesaler who practices at Jolly Mohalla, deals exclusively with scrap metal. His receives copper wire, aluminium caps and tins from an aggregator in Shanthi Nagar. He also receives bulk supplies of scrap metal from Kengeri and Bommanahalli, which is from industrial complexes.
On an average, he accumulates about a ton of iron and two tons of aluminium each month. However, he claims that the figure varies wildly and it is difficult to actually quantify his input. The aluminium and iron is shipped to recyclers in Tamil Nadu on a monthly basis. The copper is stored at a godown until he can find demand for it.
Mohsin, also a wholesaler at Jolly Mohalla, collects glass from three aggregators in Bengaluru, two of whom operate in Electronic City. He receives glass beer bottles, which are sold for Re 1 per bottle, as well as ground glass. This glass is ground by an aggregator in Electronic City and shipped to him on a weekly basis. He does not have a clear idea of quantification, but claims to receive around 200 kg of ground glass every month.
3.2. THE FORMAL SECTORBBMP’S SOLID WASTE MANAGEMENT SYSTEM
Within the formal sector in Bengaluru, the BBMP like other city municipal corporations carries out the obligatory function of waste collection from 198 wards spread across eight administrative zones, covering a population of over 10 million people. Between 2000 and 2014, there have been many attempts, largely through NGO and citizen initiatives on collection of waste and citizen awareness drives. The Bengaluru civic community is

Extracting value from Bengaluru’s Dry Waste Chain Collection and Aggregation of Dry Waste
56 A collaborative effort of SVP, WUCU and BCCF
fairly robust and amongst the most active in the country. The activities and engagements are focussed mainly on promoting the practice of segregation at the source as well as managing the partial outsourcing of waste collection, transportation and processing responsibilities. It must be kept in mind that during this time, the jurisdiction of the BBMP was also expanded from 226 to 800 square kilometres adding the lesser developed and outlying part of the outskirts of the City with little or no infrastructure including roads etc.
The BBMP initially managed MSW departmentally; then, in the late 90s, it shifted to a contract system on an L1 basis. The contract was divided into collection of waste, (at first from cement rings and then D2D), street sweeping and transporting of waste. Sometimes the destination is defined, and at other times it is the discretion and innovation of the team of driver and cleaner who find appropriate locations closest to their ward to minimise the spend on fuel. The contract was assigned to a contractor, who was allowed to bid for a maximum of 5 packages. An integral part of the Formal system, it is the contractor who then allots, supervises and pays for the work done. His team consists of PKs, Auto-tipper drivers, sweepers, etc. Though most PKs are part of the existing packages under a contractor, some are still managed departmentally and are employed directly by BBMP.
The D2D collection system that was instituted in 2001, worked to establish timely and daily collection at the door step and consequently made Bengaluru a bin-less city. The effort was aimed towards bringing a focus on segregation at source. This heralded the advent of the smaller auto tipper vehicle, which could go into smaller roads, bye-lanes and streets, and be able to collect more waste at one time than the pushcarts handled by the PKs. This led to the creation of ‘transfer points’ for the transfer of waste from the small to the large vehicle. The waste that then touched the ground became the starting point of many black spots and informal dumping areas in neighbourhoods.
Post the 2012, with the creation of DWCCs in every ward, the contractor system was pushed to actually recognise the them as a destination and consider the elimination of dry waste from the transportation process. This is taking time to settle and a lot of permutations and combinations are being noticed on the ground (Box 08).
Currently, there is a dire need to differentiate between the BBMP’s accountability through the contract system, as well as the contractor’s own accountability as a private player. This need was emphasised in 2013, when the Karnataka High Court mandated a policy of ‘Polluter Pay’ within the city. Essentially, this meant that the BBMP will only provide waste collection and transportation services to individual households and petty shops. On the other hand, Bulk generators (defined in the BBMP notification issued in July 2013. It is broadly defined as any generator producing more than 10 kgs. of waste on a daily basis) were obliged to manage their own waste.
Post this mandate; most Bulk generators in the city are seeking private service providers for waste management.
BOX 08: CURRENT MSW PRACTICES BY THE BBMP (2012)
Transportation: Tippers, compactors, auto dippers and pushcarts
Door-to-door collection efficiency: 40%
70% of the 198 wards are under contracts with private operators, and in other wards PKs of BBMP are involved.
There are around 89 packages and around 21,000 PKs

Extracting value from Bengaluru’s Dry Waste ChainCollection and Aggregation of Dry Waste
57A collaborative effort of SVP, WUCU and BCCF
This again has given rise to a slew of challenges. Private contractors charge exorbitant fees with random quotes to collect and transport waste, and often do not dispose it properly, choosing to dump or burn the mixed waste in vacant plots, rather than carrying it to appropriate destinations for the segregated waste.
Because of the lack of enlisted private contractors, there is a huge overlap in responsibilities with the BBMP contractors who are employed to service households. Moreover, it has also been observed that BBMP contractors across several wards of the city are utilising municipal funds and infrastructure to service bulk generators, thereby defaulting on their service to households and at the same time collecting a double income. While a large part of the waste collection process has been out sourced to private contractors by the BBMP, in many cases due to the burgeoning informal sector within the waste value chain, these contractors have also joined hands with this sector, especially rag pickers from Bengali colonies, for collecting waste from certain wards. Contractors, who were spoken to, pointed out that private parties paid them directly as opposed to long-pending bills raised with the BBMP.
Clearly, the contract system employed by the BBMP has been failing on the household front, with insufficient coverage and inappropriate handling of waste. The agreement that the BBMP had signed with waste contractors were structured in such a way that they were paid to merely transport waste, rather than manage it. As we see, there exist several weaknesses and missing links in our formal system of SWM, but through integrating with the informal system, it could strengthen the city’s SWM system significantly.
3.3. THE DRY WASTE COLLECTION CENTRESA BRIDGE BETWEEN THE FORMAL & INFORMAL
DWCCKARTAVYA
CENTRES (High Value and
Low value Dry Watse)
SOURCE OF LIVELIHOOD
AND INCOME
ENCOURAGESEGREGATION
REDUCE TRANSPORTATION
COSTS
RECYCLEALL STREAMS
OF DRY WASTE
PROMOTE EXTENDED PRODUCER
RESPONSIBILITY
COMMUNITYINVOLVEMENT
Figure 37: DWCC Centre’s Vision diagram(Source: WUCU, 2012)
As we already know, a large fraction of the dry waste generated in the city is handled by the informal sector. However, some categories of waste – including those that have no direct market and hence low value – don’t justify the cost of transporting and aggregating them and are hence excluded from the informal waste chain. This waste contributes greatly to litter on the streets as well as in the landfill.
Waste practitioners in the city led by SWMRT came to the conclusion that the way to remedy this would be to create a ward-level interface between front-end and back-end dry waste systems. It was concluded that if dry waste from households could be stored temporarily in the vicinity, it would be a great fillip to segregation and aggregation of dry waste. This led to the concept of DWCCs, which served not only the above purpose but aimed at giving the informal sector a certain degree of credibility by incorporating them into the institutional mechanism of the BBMP (Figure 37).
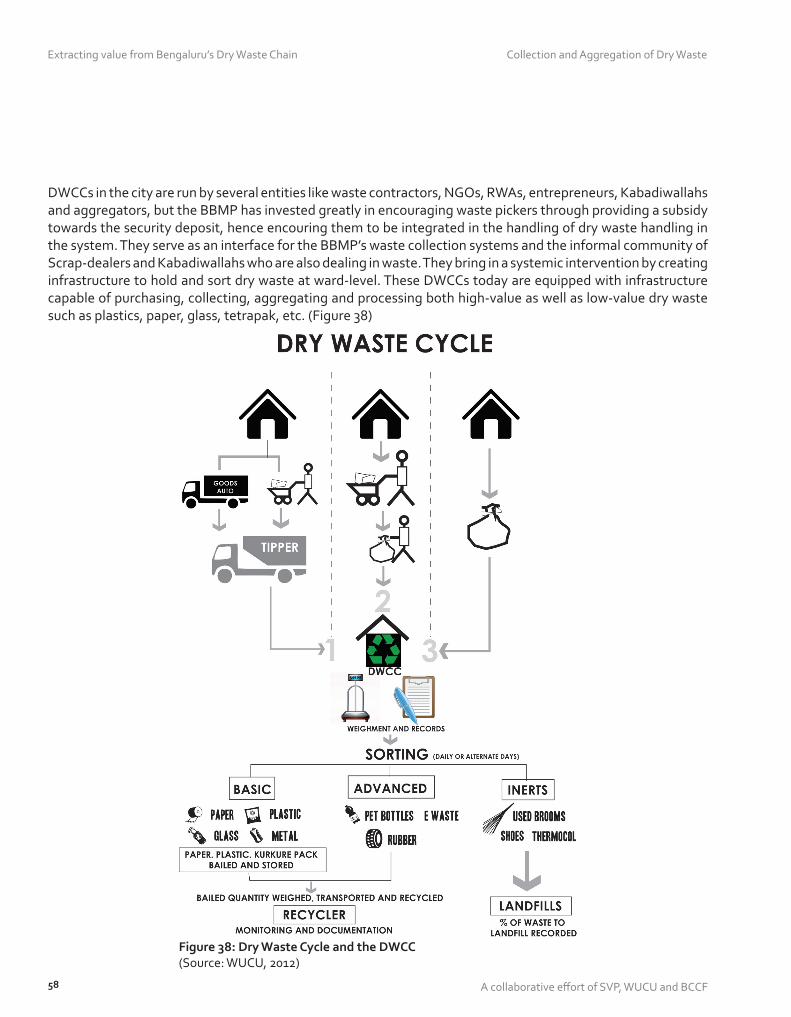
Extracting value from Bengaluru’s Dry Waste Chain Collection and Aggregation of Dry Waste
58 A collaborative effort of SVP, WUCU and BCCF
DWCCs in the city are run by several entities like waste contractors, NGOs, RWAs, entrepreneurs, Kabadiwallahs and aggregators, but the BBMP has invested greatly in encouraging waste pickers through providing a subsidy towards the security deposit, hence encouring them to be integrated in the handling of dry waste handling in the system. They serve as an interface for the BBMP’s waste collection systems and the informal community of Scrap-dealers and Kabadiwallahs who are also dealing in waste. They bring in a systemic intervention by creating infrastructure to hold and sort dry waste at ward-level. These DWCCs today are equipped with infrastructure capable of purchasing, collecting, aggregating and processing both high-value as well as low-value dry waste such as plastics, paper, glass, tetrapak, etc. (Figure 38)
Figure 38: Dry Waste Cycle and the DWCC(Source: WUCU, 2012)

Extracting value from Bengaluru’s Dry Waste ChainCollection and Aggregation of Dry Waste
59A collaborative effort of SVP, WUCU and BCCF
Figure 39: Overall system of DWCCs(Source: WUCU, 2012)
DRY WASTE
Collected Daily/Weekly
DWCCStores, SortsAggregates
Creating a Value chain
• Resource Recovery• Aggregated Volumes• Reduced transportation
costs
In its attempt of being an enabler for segregation at source, the centre’s recovery and aggregation process is done towards creating a value chain for the different streams of waste (Figure 39). The BBMP has also made an effort to create a common identity – ‘Kartavya’ – around these DWCCs, in order to create visibility and familiarity among citizens.
Since the dry waste that is brought to the DWCC has value, the operator of the centre according to a fixed rate card purchases it. For instance, a milk packet or glass bottle may cost INR 1. In this manner, new waste streams are slowly being added to the traditional newspaper and plastic categories that were previously recycled. The modus operandi for the DWCCs has been depicted in Figure 40.
Figure 40: Modus Operandi for DWCC (Source: DWCC Standard Operation Procedure - WUCU, 2012)

Extracting value from Bengaluru’s Dry Waste Chain Processing Dry Waste
60 A collaborative effort of SVP, WUCU and BCCF
4. PROCESSING DRY WASTE THE UPCYCLING MARKET IN BENGALURU
4.1. THE OUTPUTPRIMARY AND SECONDARY PROCESSING
Primary processing is the immediate step following sorting in the value-addition chain of dry waste. It is dependent on the category of waste and can include baling, grinding of plastic products, removal of plastic from aerosol cans, removal of metals caps and rings from PET bottles etc. Primary processing breaks down dry waste material into a simpler, more usable form.
Secondary processing constitutes the steps following primary processing. This process further converts the products from primary processing into usable raw materials for further processing. Secondary processing steps include melting and granulation of plastic blocks, melting of aluminium cans and iron and tin products, pulping of paper etc. Primary and secondary processing steps for the various categories of dry waste found in Bengaluru are given in Table 05:
S. NO
DRY WASTE CATEGORIESPRIMARY
PROCESSING STEPS
OUTPUTSECONDARY PROCESSING
STEPSOUTPUT
1. Metals
Iron & TinArc – cutting to reduce size
Iron rods and sheets, tin containers
Melting Billets
Aluminium cans and others BalingBaled bundles weighing 180-200 kgs.
Brass No processing in Bengaluru
Bronze No processing in Bengaluru
Copper No processing in Bengaluru
2. Paper
Carton Boxes Baling120 – 150 kg bundles/bales
PulpingPulp of fibre and water
News papersChemical wash & Pulping
PulpScreening and moisture removal
Un-contaminated pulp
White Paper
Colored Paper
3. Plastics
High Value plastics – Milk Covers, PVC – bottles, pipes & hose, LDPE - carry bags (>40 microns), wrapping plastic, Water packets, household utensils and other products, food and packing containers.
Cleaning and Grinding
Plastic Chips & Powders
Granulation Granules
Low Value plastics – LDPE carry bags (<40 microns), oil covers, HM plastics, kurkure, biscuit, flour covers.
Cleaning and Melting
Blocks Granulation Granules

Extracting value from Bengaluru’s Dry Waste ChainProcessing Dry Waste
61A collaborative effort of SVP, WUCU and BCCF
4. Milk Covers WashingDry covers without trace of moisture
Melting LDPE Blocks
5. PET BalingBaled bundles of 120-150 kgs
Grinding PET chips
6. Glass
Unbroken Beer & Indian Liquor
Washing Clear bottles without labels.
Refilling
Broken glass, Foreign Liquor bottles
CrushingCrushed and sorted glass of different colors
7. Tetrapak BalingBaled bundles of 120-150 kgs
PulpingTetra Pak pulp
8. Rubber
Tubes & Tyres PyrolisisFurnace Oil, Carbon and Steel
Other productsRubber removed manually from products.
Rubber strips RecyclingRubber sheets
9. Mattresses & CushionsRemoval of cotton and foam
Cotton and foam
Foam recycled along with EPS. Cotton washed and reused.
1. Washed cotton
2. EPS blocks
10.Gunny Bags
Plastic woven
1. Baling (bundles sent to Gujrat);
2. Melting (processing in Bengaluru)
1. Baled bun-dles of 120-140 kgs;
2. Polypropyl-ene Blocks.
1. Melting 2. Grinding/
Granulation
1. PP blocks2. PP chips,
Granules
Jute Reused
11. Thermocole & Foam AgglomerationGranules of EPS and Foam
Granulation and melting
EPS granules and blocks
12. Batteries - Vehicles Dismantling PVC casing, Metal sheets
Pulverization of PVC casings, melting of metal sheets
1. PVC powder
2. Metal billets
Table 05: Primary and Secondary Processing for dry waste categories (Source: Hand in Hand, 2014)

Extracting value from Bengaluru’s Dry Waste Chain Processing Dry Waste
62 A collaborative effort of SVP, WUCU and BCCF
4.3. THE CAPACITYBENGALURU’S PROCESSING CAPACITY
Unfortunately, Bengaluru does not have adequate processing facilities for all categories of waste, for example aluminium. These categories are generally sent to other towns and cities which have a more extensive capacity for treatment.
The current capacity in Bengaluru for processing each category of waste has been listed in Table 07. It was observed that although there is a fairly well-developed industry for waste processing in Bengaluru, it is currently fragmented and operating without any norms and standards. Centres for processing that have developed in areas like Nayandahalli, Kengeri and Kumbalgodu, comprise groups of small-scale agencies. These agencies are
4.2. THE LOCATIONPROCESSING CENTRES WITH RESPECT TO CATEGORIES OF WASTE
The major processing centres for different categories of waste are spread all over Bengaluru, with a few even outside of it. Table 06, lists down the different locations of processors, with respect to the categories of waste. Further details of individual processors, there location and contacts have been included in Annexure III)
S. NO DRY WASTE CATEGORY LOCATION
1. MetalsNayandahalli, Kumbalgodu Industrial Area, Horahalli Industrial Area (Kanakapura Road), Hosur (TN)
2. PaperJigani, Peenya Industrial Estate, Doddaballapur, Kumbalgodu, Hosur (TN)
3. Plastics
Nayandahalli, Kumbalgodu Industrial Estate, Peenya Industrial Estate, Bommassandra Industrial Estate, Hoskote Industrial Estate, Bheemanakuppe (Behind Rajarajeshwari Engg College), Kengeri, JC Road.
4. Milk Covers Kengeri, Nayandahalli
5. PETKengeri, Nayandahalli, Jolly Mohalla, Hegde Nagar, Nagavara, Marathahalli
6. Glass Bommanahalli
7. Tetra Pak Mahadevpura, Bommassandra
8. Rubber Tyres and Tubes JC Road, Horahalli Industrial Area (Kanakapura Road)
9. Mattresses and Cushions Marathahalli
10.Gunny Bags – plastic woven
Hoskote Industrial Estate, Nayandahalli, Bheemanakuppe (behind Rajarajeshwari Engineering College)
Gunny Bags – jute Jolly Mohalla
11. Thermocole & Foam Hoskote Industrial Estate, Nayandahalli, Kumbalgodu Industrial Estate
12. Batteries Jolly Mohalla, Horahalli Industrial Area (Kanakapura Road)
Table 06: Processing Centres location for dry waste categories (Source: Hand in Hand, 2014)

Extracting value from Bengaluru’s Dry Waste ChainProcessing Dry Waste
63A collaborative effort of SVP, WUCU and BCCF
S. NO
DRY WASTE CATEGORYWASTE
GENERATION (per month)
TOTAL NO OF PROCESSORS
IN BENGALURU
TOTAL PROCESSING
CAPACITY(per month)
COMMENTS
1. Metals
Iron & Tin
100,000 tonnes (including Industrial & Construction)
9-10 (Hosur, TN)
30,000-35,000 tonnes
Major processing centres in Indupur (AP) and Hosur (TN)
Aluminium 1800 tonnes 5-6 500-600 tonnes
Almost 50% of Alumium scrap generated here is sent to Hyderabad (AP) and Delhi for recycling.
Brass & Bronze
-unknown- - -
No processing of Brass & Bronze scrap in Bengaluru. Salem (TN), Pondicherry, Ahmedabad (Guj) and Jamshedpur (Jhar) are major recycling centers.
Copper -unknown- - -Copper waste is not recycled in Bengaluru. Sent to Delhi.
2. Paper
Carton Boxes5000-6000 tonnes
3-44000-5000 tonnes
85-90% of carton box waste processed in Jigani, Doddaballapur and Hosur. Rest in other states.
News Papers8000-9000 tonnes
- -
Newspapers sent to Coimbatore, Tirunelveli, Palani, Mysore, Hyderabad, and Orissa.
White Paper 3000 tonnes 3-41000-1500 tonnes
White scrap paper also sent to mills in TN
Colored Paper 1500 tonnes - - Processed at ITC, Coimbatore
often inter-dependent by specialising in different stages of processing. In the case of Nayandahalli, for instance, some of the agencies receive plastic scrap and convert it into pellets, with others purchase these pellets and further treat them to manufacture low-quality mugs, tubs and other plastic items, which are then shipped to retailers.
At present, there is a gap between the quantum generated and available processing infrastructure for several categories of waste, for instance metals. However, in the case of those categories that presently do have a robust processing industry, waste is actually brought in from other parts of the state, such as Hubli and Dharwad.
As the increase in segregation and push towards recovering dry waste continues in the years to come, the quantum and variety will see a natural increase. Unable to process these within our city boundaries, if not our Zonal boundaries, will lead to huge transportation costs and an opportunity lost. This large gap in processing capacities is most definitely a key aspect where the BBMP has to take into consideration in order to complete and optimise the SWM chain of the city.

Extracting value from Bengaluru’s Dry Waste Chain Processing Dry Waste
64 A collaborative effort of SVP, WUCU and BCCF
3. Plastics
High Value plastics (LDPE, HDPE, PVC)
18,000 tonnes 250-30015,000-16,000 tonnes
Primary and secondary processing to produce blocks (‘ghatta’) and granules (‘daana’) in Bengaluru
4. Milk Covers 30 tonnes 5 30-35 tonnes
5. PET3300-3500 tonnes
10-15 3500 tonnesOnly Primary processing (baling) carried out in Bengaluru
6. Glass
Unbroken Beer & Indian Liquor
All aggregated bottles are reused by beverage companies
Broken glass, Foreign Liquor bottles
1000 tonnes 5-6 300 tonnes
Only primary processing. in Bengaluru, output sent to Pondicherry and Hyderabad (AP) for further processing.
7. Tetra Pak 350 3 90-100 tonnesOnly Primary Processing (baling) in Bengaluru
8. Rubber
Tyres and Tubes
Unitary pyrolysis plant at Harohalli Indl Estate
Other products
5-6 4-5 tonnes
Only Primary Processing wherein rubber parts are removed from shoes, bags etc. mainly carried out by Bengali Colonies in Bengaluru
9. Mattresses and Cushions
As they are not actively collected, difficult to quantify
2-3 3-4 tonnesPrimary processing carried out by Bengali colonies in Bengaluru
10.Gunny Bags –
plastic woven 4-5 3.5 – 4 tonnes
Two types of processing in Bengaluru: 1. Baling (2-3 processors in
the city)2. Melting gunny bags into
PP blocks and granules. (2 processors)
jute 50-60 All reused.
11. Thermocole & Foam
As they are not actively collected, difficult to quantify
2-3 10-15 tonnes
12. Batteries 8-10
Table 07: Number of Processors in Bengaluru and their capacities (Source: Hand in Hand, 2014)

Extracting value from Bengaluru’s Dry Waste ChainAnalysis and Recommendations
65A collaborative effort of SVP, WUCU and BCCF
5. ANALYSIS AND RECOMMENDATIONS
Based on the data and information collected from field research, the team has analysed the information and identified the lacunae that currently exist in various spheres of Bengaluru’s SWM systems, this core team has created a list of recommendations to address some of the key issues that the city is facing today.
Various other studies that have been conducted in Bengaluru by different entities have also put forward suggestions to better the functioning of the BBMP (Box 08). These include a Bengaluru-based NGO called The Forward Foundation, WUCU Bengaluru, who based on their market study addressed various laws in the city’s waste collection and transportation systems and another study entitled ‘Primary Collection of Solid Waste Management in Bengaluru’, by the Centre for Sustainable Development and IIM-B. However, the recommendations based on this study are targeted towards three main categories – Segregation at Source, DWCCs and Processing Capacities.
5.1. SEGREGATION AT SOURCECITIZEN PARTICIPATION IN THE SWM SYSTEM OF THE CITY
5.1.1. CURRENT SCENARIO
Citizen participation is an integral part of, and has a direct effect on the success of the SWM system of a city. However, the BBMP has failed to mobilise and educate citizens on the handling and proper practices of storing waste in their own bins at the household, shop or complex level. Due to the D2D collection systems not covering all households, citizens tend to dump garbage on ground (GoG), resulting in “black spots”. The assumption that it would be picked up by the BBMP through street sweeping, leaves most spots accumulating waste for several days. A majority of the waste that is being collected through the system still continues to mixed waste, making it nearly impossible to sort and retrieve a value. Hence the only end point it can reach is the landfill. As this option is also currently restricted, Contractors tend to burn the waste in garbage dumps, open sewers, rain water drains, etc. (Figure 41).
Figure 41: Kormangala’s storm water drain choked with Garbage, Bengaluru(Source: WUCU, 2013)

Extracting value from Bengaluru’s Dry Waste Chain Analysis and Recommendations
66 A collaborative effort of SVP, WUCU and BCCF
BOX 08: RECOMMENDATIONS TO THE BBMP (2012)
Forward Foundation (2014)
• In terms of collection, the costing department should assess the quantum of work involved and accordingly assign resources. Mechanisation of street sweeping and clearing spots during night, as well as assigning DWCCs and NGOs to provide vehicles for separate collection of dry waste would also be beneficial.
• In terms of waste transport, setting up zonal transfer stations and introducing stationary compaction instead of mobile compactors would improve the process.
• Allocating 500 to 1,000 acres of land for end disposal and setting up a sanitary landfill, C&D processing unit and a site for incinerating dead animals will be required. The disposal of medical waste (from clinics, hospitals and labs) would have to be checked with the licensing authority and tests conducted on the compost and RDF produced by large-scale plants on a regular basis. The existing dump yard to be capped.
WUCU Bangalore (2013)
• Intensive IEC outreach by generator category and continuous ongoing training programs for the collectors, be they private or BBMP employed, to ensure that both the generators and collectors understand segregation and the need for it.
• The need for a detailed quantification study or self-assessment format, and investment in systems to understand waste by stream and generator
• Focus to be on decentralisation, as a result of processing facilities, as a direct result of understanding waste generation at the ward and zone level. This needs to be linked with destination-bound processing.
• Generator-specific collection systems and processes to be set up for categories such as bulk generators, door-to-door collection, large market places, slums etc.
• Bulk generator notification to be implemented by offering service delivery options through a registered vendor system, with BBMP ensuring that they meet the stipulations of the MSW Rules (2000).
• Professionalising the collection and storage of different dry waste streams to be able to engage meaningfully with producers in order to justify investment in processing infrastructure to upcycle the waste streams.
• Standardised set of rules and guidelines to maximise the potential of the DWCC infrastructure and integrate the informal Kabadiwallahs/scrap-dealer network in order to create better service delivery and accountability and in the process, professionalise the informal sector as one of the benefits.
The Centre for Sustainable Development and IIM-B
• Provisions for incentivising segregation and introducing monitoring mechanisms need to be made at a policy level.
• Allocation of more responsibilities to the BBMP health inspectors rather than BBMP engineers, who have multiple responsibilities.
• Normative standards for D2D collection, street sweeping, secondary storage and infrastructure for collecting and transporting segregated waste need to be cross-checked.
• Synchronisation of primary as well as secondary transportation processes.

Extracting value from Bengaluru’s Dry Waste ChainAnalysis and Recommendations
67A collaborative effort of SVP, WUCU and BCCF
5.1.2. ANALYSIS
It is evident from the findings on the field that levels of segregation at source are still very low in Bengaluru. This can be attributed to both, negligence on the part of the households as well as the contractors who are collecting and transporting the waste. The reasons for the same are listed below:
1. Lack of incentives for contractors:
Private contractors find that appropriating high-value dry waste and transporting the rest of the mixed waste to the landfill is financially more viable than transporting segregated waste to decentralised processing facilities. As a result, segregated waste is sometimes mixed post collection.
2. Lack of penal provisions:
BBMP Inspectors rarely levy fines against households that are not segregating their waste. Since the fines are rare and infrequent, many households do not consider it a huge burden.
3. Lack of infrastructure:
Not all wards are equipped with enough vehicles and bins to transport segregated waste efficiently.
4. Poor organisation:
Dry waste collection is essentially flawed since it is collected in the same vehicles as the wet waste. Moreover, the waste collection timings seem to contribute towards loss of dry waste resources due to non-segregation. Households discard waste at local dumping points even after handing over their wastes to collection vehicles in the morning. There is no one to monitor people dumping at these points.
5. Lack of awareness:
Some citizens are not segregating their waste because there is not enough education on the benefits of segregation. Case studies supporting segregation are detailed in Annexure IV. Besides this, several are not sure on what constitutes wet and dry waste. Moreover, not all the PKs have been educated on collecting and transporting segregated waste separately.
5.1.3. RECOMMENDATIONS
Based on the above findings, the following recommendations have been made to improve overall segregation at source:
1. Creating awareness:
• More intensive awareness campaigns should be initiated at the apartment and individual household level, with better promotional material that clearly explains what is wet and dry waste

Extracting value from Bengaluru’s Dry Waste Chain Analysis and Recommendations
68 A collaborative effort of SVP, WUCU and BCCF
• Campaigns can also be held at schools and colleges to involve students in the programs
• Involving NGOs and civil society associations for spreading awareness will be more beneficial than only relying on the waste contractors
• It will help to involve the government/public offices in the campaign for segregation, with emphasis on the two-bin system
• Public awareness display boards can be put up at prominent locations
• Home-composting and message of waste reduction to be promoted among all domestic waste generators, which will indirectly lead to segregation
2. Infrastructure changes:
• Have separate bins for organic and recyclable wastes in public places
• Distribute separate bins/bora bags to help households segregate and store dry wastes
• Incorporate better facilities in waste collection vehicle to ensure wet/mixed waste and dry waste are transported separately
3. Logistical changes:
• Dry waste collection can be done on a weekly basis with payment made to the households immediately
4. Citizen engagement:
• Ensuring Resident Welfare Association (RWA) participation in apartment complexes and the household level will increase willingness to segregate
5. Intensive training:
• Waste contractors and the staff of the collection autos and PKs should be trained on segregation and not mixing waste during transportation. The field staff should also continuously reinforce the segregation message to households.
6. Creating accountability:
• Pressurise waste contractors to deliver a certain quantum of organic/dry waste per day. Include a clause in their contracts which link payments to the quantum of organic/dry waste delivered to the responsible agencies (eg DWCCs for dry waste and KCDC for wet waste).
• A carrot and stick approach to be followed to bring effectiveness through policy and induce a behavioural change in the city’s approach to SWM

Extracting value from Bengaluru’s Dry Waste ChainAnalysis and Recommendations
69A collaborative effort of SVP, WUCU and BCCF
5.2. DWCCsRE-ASSESSMENT OF AN IMPLEMENTED STRATEGY
5.2.1. CURRENT SCENARIO
The DWCCs in Bengaluru were conceptualised as an integral component of the city’s dry waste processing mechanism. The BBMP has identified ward-wise sites to construct DWCCs and have partially done so, depending on space available and willingness of neighbourhood communities. However, this has been done not really bearing in mind some necessary attributes such as access and sufficient space to meet the ward’s requirements. It appears that the program is aimed at incentivising segregation by creating a hub at ward level for citizens and bulk generators to drop off their waste.
However, it comes with its own challenges (Box 09) including garnering acceptability in certain neighbourhoods, the availability of space, running professionally to break even and the disposal of categories of waste for which there exists no market. Several of them are not functioning as operated and are facing a series of problems related to quality and quantity of waste, as well as back-end tie-ups.
BOX 09: CHALLENGES FACED BY DWCCs
• Many of them receive very small quantities per day since a majority is handled by the informal sector
• Only low-grade waste is being sent to the DWCCs as all dry waste with high value is routed to the informal sector from the collection point/ or the PK, which makes it difficult to break even
• Space is an issue for the DWCCs that receive a steady flow of waste
• Not all DWCCs have adequate infrastructure such as balers and other material required for primary processing.
• Not all DWCCs have facilities such as toilets and safety provisions such as fire extinguishers.
• Contractors are not handing over the waste at no cost as earlier they were earning.
• Waste is not always sorted immediately and is often allowed to accumulate and create a mess (Figure 42).
• There is very little supervision and monitoring over the functioning of several of the DWCCs, leading to non-standard operations
• There is a lack of awareness about the program at ward level, among citizens
• There are no bins or citizen interfacing activity
198 DWCCs were planned to built, 140 of which have already been constructed and are functional (April 2014). Based on data collected between November 2013 and April 2014, it is evident that several DWCCs in the city are already facing a combination of problems. The BBMP also faces a lot of local resistance to the setting up of DWCCs within neighbourhoods. Although most citizens do not have any issues with local scrap-dealers and

Extracting value from Bengaluru’s Dry Waste Chain Analysis and Recommendations
70 A collaborative effort of SVP, WUCU and BCCF
Figure 42: Waste is being allowed to accumulate at DWCCs in RT Nagar (left) and HSR Layout in November 2013(Source: WUCU, 2012)
Kabadiwallahs, the fact that some contractors still bring mixed waste (and therefore smell) to the DWCCs is a cause for concern. A brief on findings through interviews conducted with a few DWCC operators is listed in Annexure V.
5.2.2 ANALYSIS:
1. Quantity of waste:
• Quantity of dry waste received from domestic as well as bulk waste generators is only around 20-30% of the dry waste collected from the ward. Eg, in Malleshwaram (ward 64), the estimated dry waste generated per day is approximately 2200-2300 kgs. However, the waste which is actually handed over to the DWCC is only around 500-600kgs. Similarly, in ward 168 (Pattabiraman Nagar) the estimated dry waste collected from domestic generators is around 1500 kgs. However, the actual quantum of dry waste handed over to the DWCC is only around 300-350 kgs.
• A few DWCCs – Domlur, Ejipura – receive no dry waste from the BBMP waste collection vehicles.
2. Quality of waste:
• The quality of waste received varies across DWCCs. High value dry waste (PET, Plastics – PVC, PP, HM, LLDP; Metals – Aluminium cans, foils) ranges from 30-40% of the total waste received at DWCCs.

Extracting value from Bengaluru’s Dry Waste ChainAnalysis and Recommendations
71A collaborative effort of SVP, WUCU and BCCF
• Of the rest, 50% is made up of paper (mix, coloured, carton boxes, hard paper), glass, tetrapaks, rubber, low value (LDPE, laminates) plastics.
• 10-15% are reject material.
• Certain DWCCs – Ward 94,109 – the percentage of low value dry waste received is very high – almost 70-80%.
3. Infrastructure, equipment and staff:
• Space constraint is seen at DWCCs receiving around 500-600 kgs of waste per day.
• Facilities for staff – sorting tables, chairs – not available at most DWCCs. Staff sit on the floor and sift through dry waste material. Due to this, their efficiency is also compromised.
• There is no organised system of storing the segregated dry waste in the observed DWCCs. Segregated dry waste is stored in gunny bags and dumped along the walls. This also effects the efficiency of the sorter. Hence we find a wide variation in rate of sorting/day in different DWCCs (Table 08)
S.No Location Size (S.Ft.)No of people
(Waste Pickers)Waste/ Month
(Tonne)Waste sorted/
Day (Kg)
1 HSR 200 2 7 233
2 Domlur 2400 9 16 533
3 Allasandra 2400 3 13 433
4 Gottigere 400 3 10 333
5 Marapanallya 2400 11 10 333
6 Jayanagar 100 3 4 133
7 Freedom Park 1200 5 5 167
8 Rajagopal 25 41 1367
9 RMV 1800 8 12 400
10 High Tension Wire 3500 12 60 2000
Table 08: Waste Handled at different DWCC in Bengaluru (September 2013 Data)(Source: WUCU, 2013)
• Crude equipment used for removing plastics from aerosol cans.
• Drying equipment to remove moisture from dry waste – milk, oil and plastic covers – would beneficial. The waste received at the DWCC is moist as they have been discarded along with organic waste or not dried by households before disposal.
* When DWCCs send the accumulated material to larger aggregators, 10-15% of the weight is deducted (due to moisture content) before payments are made to the DWCC operator.
* DWCC do not spend time to wash and dry these covers as they feel washing will only increase the moisture content. Also takes labour and time to wash and dry the covers.

Extracting value from Bengaluru’s Dry Waste Chain Analysis and Recommendations
72 A collaborative effort of SVP, WUCU and BCCF
• Waste material like thermocole, kurkure packets are voluminous to store inside the DWCC. As a result thermocole is not collected DWCCs as they feel space can be better utilised to for sorting and storing other dry waste material, which are also fast moving in the market. Kurkure packets and laminates are collected in gunny bags and stored outside the DWCC.
• Being visible pieces of infrastructure in the city fabric, these centres have failed to interact with the local citizens, both visually and functionally.
5.2.3. RECOMMENDATIONS:
Based on the above observations and analysis, the following recommendations have been suggested:
1. Improving waste input:
• Household waste: It should be ensured that all household dry waste collected from the ward is routed to the DWCC. This can be done by:* Including clauses in the contract with the waste contractor to ensure that dry waste
from the ward is handed over to the respective DWCC and confirm compliance through penalty measures
* Increasing the rates paid for dry waste by the DWCC so it is at par with the market rates.
• Bulk generator waste: It should be made compulsory for commercial establishments to hand over the dry waste generated by them to the DWCCs. Commercial establishments should ensure the dry waste is not taken away by their house-keeping staff or other employees. A door-to-door campaign or awareness through print material could be carried out indicating the rates for all dry waste. Bulk waste generators like gated communities, large apartment complexes through their RWA or Maintenance departments should ensure dry waste generated within their complexes is stored separately and handed over to DWCCs.
• Increasing the role of DWCC operator: DWCC operators can be authorised (by issue of ID cards, letters etc) to be engaged as collection agencies for dry waste from commercial establishments and bulk generators (apartment complexes, gated communities). The DWCC operator should also pay the respective waste generator on the spot with necessary bills/vouchers etc. Provide collection vehicles can be given to the operators to facilitate the collection process from bulk and commercial generators. The DWCC will then not be dependent only on dry waste received from BBMP waste contractors.
2. Improving operations:
• Involving the PKs: The PKs involved in waste collection can also be engaged at the DWCC to sort the waste they bring in. They can also then be paid the value for sorted dry waste, which is much higher than mixed dry waste as well as being compensated for the labour/time spend sorting.
• Training for employees and increasing efficiency: DWCC staff and supervisors need to be trained

Extracting value from Bengaluru’s Dry Waste ChainAnalysis and Recommendations
73A collaborative effort of SVP, WUCU and BCCF
on safe working practices to avoid injuries and other accidents, such as fire, at the workplace. Efficiency of a sorter currently is at 70 kgs/day, but with more comfortable and organised working conditions, this can increase to a whooping 200 kg/day. Table 08 shows this fluctuation in efficiency among 10 different DWCCs.
• Compensation structure: Payment to staff can be made according to the quantum of waste sorted rather than the current practice of a per day basis. At present, workers are paid a flat Rs 250/day. Instead, they could be paid Rs 3-4 for every kilogram of dry waste sorted. This will incentivise them to sort more material.
• Maintaining records: A common platform could be set-up where DWCCs are able to log-in the amount of dry waste accumulated at their locations. A common transportation facility then arranged by the successor in the chain will ensure minimisation of transportation costs.
• Incorporation of simple mechanised processes: Introduce manual bailing machines to help DWCCs compact low-weight high-volume wastes such as tetrapaks, plastic covers, paper etc. This will help in the process of storage and space utilisation.
• Wash and dry system: DWCC could also be provided with a wash and dry system to clean milk and food packets, aluminium foils, LDPE bags which will then help them fetch a better price from larger aggregators.
• Space efficiency study: A detailed volumetric space study needs to be done of the existing centres to assess their capacity. Based on the quantum of waste generated in the ward, division of space can be made for activities like unsorted waste, sorting, storage, etc. in order to make the flow of waste through the centre efficient.
3. Back-end tie-ups:
• Education and awareness: Back-end linkages for all dry waste materials need to be set-up and DWCC operators need to be made aware of buyers for all categories of waste. For eg, E-waste is not taken at DWCCs as the operators are unaware of the back-end linkages. Tie-ups with e-waste recyclers in the city such as E-parisara and Ash Recycling will help the collection and movement of e-waste from households to the authorised recyclers.
• Standardised sorting system: To educate all DWCCs on sorting their waste into categories preferred by final recycler. For eg, currently plastics are sorted into 8-10 categories at the DWCC level before sending to a larger aggregator where it is further sub-divided into another 25-30 categories. The larger aggregator then sends the segregated plastics to primary processors. Awareness amongst DWCC operators on the 30 categories of plastics will help them sort the incoming waste into the necessary input material for the primary processors. This will also help the DWCCs earn better income.
Box 10 demonstrates the value chain that can be generated through 1 tonne of dry waste reaching a centre, only through sorting it into specific streams that are required by the Processors.
• Vendor empanelment: standardisation of operations and deliverables can be brought about through Vendor empanelment. This will give sufficient support for all DWCCs, as it would ensure that all the streams of waste can be sent out. These vendors should include both informal
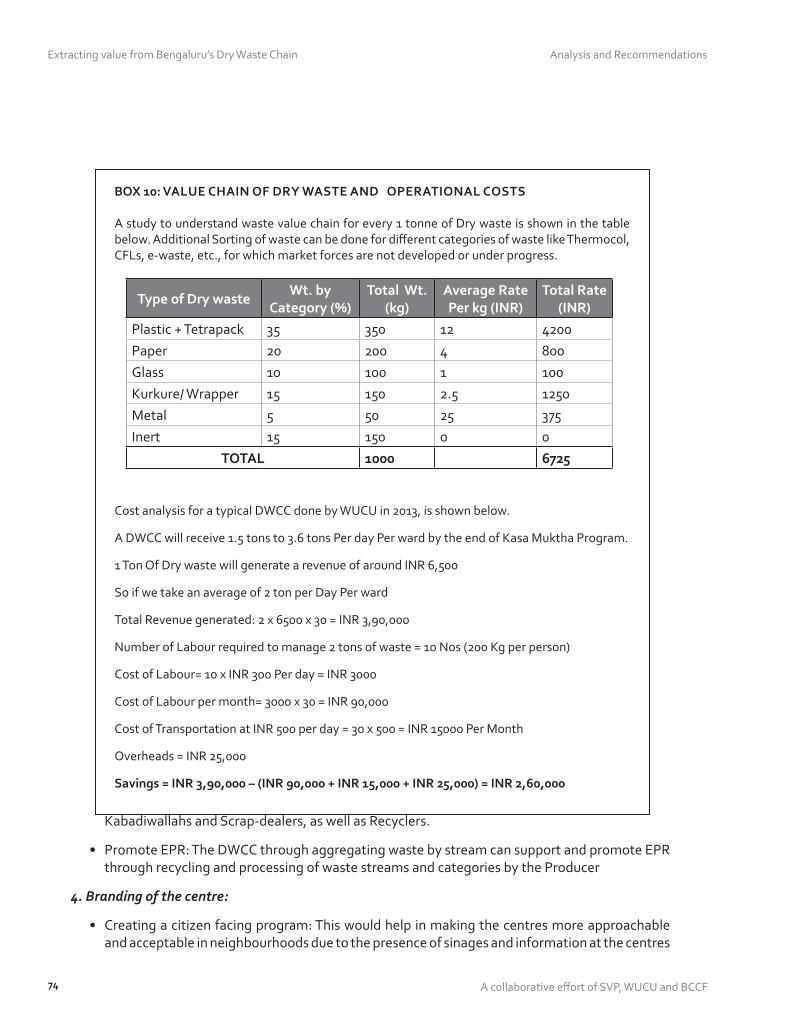
Extracting value from Bengaluru’s Dry Waste Chain Analysis and Recommendations
74 A collaborative effort of SVP, WUCU and BCCF
BOX 10: VALUE CHAIN OF DRY WASTE AND OPERATIONAL COSTS
A study to understand waste value chain for every 1 tonne of Dry waste is shown in the table below. Additional Sorting of waste can be done for different categories of waste like Thermocol, CFLs, e-waste, etc., for which market forces are not developed or under progress.
Cost analysis for a typical DWCC done by WUCU in 2013, is shown below.
A DWCC will receive 1.5 tons to 3.6 tons Per day Per ward by the end of Kasa Muktha Program.
1 Ton Of Dry waste will generate a revenue of around INR 6,500
So if we take an average of 2 ton per Day Per ward
Total Revenue generated: 2 x 6500 x 30 = INR 3,90,000
Number of Labour required to manage 2 tons of waste = 10 Nos (200 Kg per person)
Cost of Labour= 10 x INR 300 Per day = INR 3000
Cost of Labour per month= 3000 x 30 = INR 90,000
Cost of Transportation at INR 500 per day = 30 x 500 = INR 15000 Per Month
Overheads = INR 25,000
Savings = INR 3,90,000 – (INR 90,000 + INR 15,000 + INR 25,000) = INR 2,60,000
Kabadiwallahs and Scrap-dealers, as well as Recyclers.
• Promote EPR: The DWCC through aggregating waste by stream can support and promote EPR through recycling and processing of waste streams and categories by the Producer
4. Branding of the centre:
• Creating a citizen facing program: This would help in making the centres more approachable and acceptable in neighbourhoods due to the presence of sinages and information at the centres
Type of Dry wasteWt. by
Category (%)Total Wt.
(kg)Average Rate Per kg (INR)
Total Rate (INR)
Plastic + Tetrapack 35 350 12 4200Paper 20 200 4 800Glass 10 100 1 100Kurkure/ Wrapper 15 150 2.5 1250Metal 5 50 25 375Inert 15 150 0 0
TOTAL 1000 6725

Extracting value from Bengaluru’s Dry Waste ChainAnalysis and Recommendations
75A collaborative effort of SVP, WUCU and BCCF
• Waste drop-off: placing colour coded bins, for ease of understanding would be the basis of encouraging waste drop-off by the citizens, at the centre
A sample of branding was conceptualised under the name of Kartavya, but has failed to be enforced or adopted by all centres (Figure 43).
Figure 43: Branding and signage - A Citizen facing program is essential for acceptance at neighborhood level(Source: Developed by Micheal Foley for SWMRT, 2012)

Extracting value from Bengaluru’s Dry Waste Chain Analysis and Recommendations
76 A collaborative effort of SVP, WUCU and BCCF
5.3. PROCESSING CAPACITIESCLOSING THE DRY WASTE CHAIN
5.3.1. CURRENT SCENARIO
As seen in chapter 4, the processing capacity for all streams of waste within the city is clearly lacking. Bengaluru doesn’t have adequate facilities, nor is the government investing in any solutions. The current processing units are located in select areas like Nayandahalli, Kumbalgodu and Jolly Mohalla, which adds heavily to transportation costs. In addition to this, we have several streams (mattresses and cushions, Kurkure packets, etc.) of dry waste that we call ‘rejects’, this currently has no market value and hence ends up accumulating in DWCCs or the landfill or burnt within city limits.
As there is a strong push towards segregation at source, recovery of Dry Waste will become more efficient and hence result in an increase in supply. Hence if there is no increase on the demand side, creating a value for this surplus waste would be very difficult.
5.3.2. ANALYSIS
Some of the major issues which affect the recycling and reprocessing of dry waste generated in Bengaluru:
1. Lack of recyclers in the city:
Dry waste categories such as PET, ferrous and non-ferrous metals, glass, certain types of plastic products, rubber products and Tetra Pak are sent to other parts of the country for recycling due to the lack of recycling companies in Bengaluru. For example, while PET scrap accumulated by various agencies across Bengaluru is sent to units of Reliance Industries in Gujarat, Mumbai and Delhi, glass products are crushed by primary processor and dispatched to recycling units in Tamil Nadu, Pondicherry and Hyderabad.
2. Shortage of processing capacity:
Certain categories of dry waste are not entirely recycled in Bengaluru and are sent to other states due to a shortage of processing capacity in Bengaluru.
3. Technology gap:
The ideal recycling process for certain categories of low value plastic – kurkure packets, biscuit and flour covers, ‘maggi’ noodles covers – are still unknown amongst the various agencies involved in collection, sorting and aggregation. While a small percentage of these products are used along with recycling of regular plastic products, a majority is rejected and either sent to landfills or burnt at open sites.
4. Dependency on manual labour:
Almost all the plastic scrap recycling industries located at Nayandahalli, Kengeri and Kumbalgodu are heavily dependent on human labour for sorting and processing.

Extracting value from Bengaluru’s Dry Waste ChainAnalysis and Recommendations
77A collaborative effort of SVP, WUCU and BCCF
5. Poor segregation:
Due to poor segregation standards within Bengaluru, a lot of reusable dry waste is lost with mixed waste. As a result, the volumes accumulated are not viable for setting up recycling centres. Eg. Tetra Pak
6. Poor network of collection centres:
Dry waste, especially e-waste is not routed back to un-authorised e-waste recyclers due to a lack of collection centres for the same.
5.3.3. RECOMMENDATIONS
1. Provision of Institutional support, through regulations and standards:
It is evident from the above analysis that the waste processing industry in Bengaluru requires a certain level of institutional support to perform in a more efficient manner. Currently, agencies are operating individually and without any regulations; there are no mechanisms for monitoring their performance and ensuring that they operate in a safe and secure manner.
What is required, therefore, is to create a system wherein producers of mass-manufactured products can become involved in the processing of the waste that they dispose of. An institutional framework within which this will be possible needs to be set up and monitored.
2. Setting up monitoring systems:
A system needs to be developed for vetting and monitoring independent agencies that process waste. A regulatory framework within which these processors are enlisted and supervised needs to be set up.
3. Enforcing Extended producer responsibility (EPR):
As we know there are several streams of dry waste that end up accumulating within the city as they are non-recyclable. Since EPR requires total producer responsibility, physical and financial, for products and packaging supplied into the marketplace; it would shift responsibility upstream, away from the BBMP to the companies that put the products (along with their packaging and marketing material) into the marketplace.
4. Setting up State recycling units:
A lot of the waste generated in Bengaluru, ends up being transported to other states like Andhra Pradesh, Tamil Nadu, Jharkand and even Delhi, to be processed. Instead of this, the state government should aim at setting up relevant processing plants approved by the KSPCB, within the state boundaries. This will not only have a significant reduction in transportation costs, but also help in dealing with the generated waste more efficiently.

Extracting value from Bengaluru’s Dry Waste Chain Conclusion
78 A collaborative effort of SVP, WUCU and BCCF
6. CONCLUSION
Efficient solid waste management within the city has proved to be an Achilles’ heel for the BBMP. In fact, a well-organised waste management system has been a challenge for numerous municipal corporations across India. Like Bengaluru, most of the cities follow the landfill-model of waste management. In many of them, segregation as a practice is yet to garner enough steam. Research conducted by WUCU Bengaluru, while bringing out the best practices in waste management also elucidates the problem areas faced by city corporations across various Indian cities (Box 11).
BOX 11: CITY CORPORATIONS AND WASTE MANAGEMENT
• Mumbai - It mentions that, on a daily basis, the city of Mumbai witnesses a total waste generation of 6,500 TPD. The Municipal Corporation of Greater Mumbai operates a huge fleet of 983 municipal and private vehicles for collection of waste, making 1396 number of trips each day. These include small and large compactors, tippers and dumper placers. Problem areas for the city include little segregation of waste at the source and huge transportation costs due to the size of the city.
• Kolkata - The city of Kolkata sees a total waste generation of 4,000 TPD. Waste that is generated by domestic as well as bulk generators in the city is rarely segregated at the source. Mixed waste is stored in common bins, and this collection, as well as waste from street sweepings, is transported from the source to one of the city’s 664 collection points.
• Delhi - In Delhi, where 7,500 tonnes of waste is generated every day, there is no emphasis on segregation at source or processing of different categories of waste. The model is based on transport and is centered on the landfill model.
• Chennai - The city of Chennai, which sees a total waste generation of 4,500 TPD, is perhaps one of the few cities where segregation has been promoted as a practice, though not made mandatory.
The garbage crisis in Bengaluru germinated from BBMP’s archaic model of merely transporting waste from the point of generation to its final destination. Since the emphasis is on transporting waste on a per tonne basis, this has also led to highly inflated figures regarding the actual quantum of waste generated in Bengaluru on a daily basis. The BBMP has laid down an estimate of this waste generated, the problem, however, lies in the fact that there are several other such estimates that have been suggested by different studies. Thus, a lot of details regarding the quantities and categories of waste generated in the city, as well as the source of generation, are based on extrapolation. Box 12 compares data given by BBMP and the WUCU study, they show a variation of nearly 2000 tonnes.
As is evident from field data, there are currently various loopholes and problem areas in the city’s waste collection systems. The predominant one, it would seem, is insufficient segregation. Over the last few years, Indian cities such have Bengaluru have been setting up systems to encourage segregation. Segregation is an essential component of recycling any waste – this is because segregated waste can be separately processed as dry and wet categories, whereas mixed waste is essentially worthless, piles up at landfills and presents health and environmental risks. Segregation is the first step towards any form of resource recovery, and also adds value to the waste. Now, with the mandate of the Hon’ble High Court, Bengaluru has the legal mechanism and infrastructure to implement 100 percent segregation. In this context, the need of the hour is to bring back the traditional recycling ethic.

Extracting value from Bengaluru’s Dry Waste ChainConclusion
79A collaborative effort of SVP, WUCU and BCCF
BOX 12: CONFLICTING ESTIMATES ON WASTE GENERATION
1. BBMP Estimates on Waste generation (2012)According to the BBMP’s official data, the total quantity of waste generated in Bengaluru is 5,033 tonnes per day. The break-up of this has been detailed below:
Residential – independent households 2,733 TPD
Bulk Waste generators 1,905 TPD
Street sweeping 395 TPD
TOTAL 5,033 TPD
Per capita waste 750 GmPD
Collection from households 54%
Markets and social functions 20%
Commercial establishments or institutions 17%
Others 9%
2. WUCU’s study Estimates on Waste generation (2012)An extensive waste quantification study conducted in ward 151 (Koramangala) collected data, which was then extrapolated to arrive at a figure for the rest of the city. This excluded market and garden waste. The likely range was estimated at 3300-3700 TPD.
Residential – independent households 1,431 TPD
Bulk Waste generators 1,899 TPD
TOTAL 3,330 TPD
At the same time, the Contract system has still not been modified to support and incentivise segregation at source at house-hold level. The need of the hour, therefore, is a widespread program to sensitize citizens and faith-building activities to emphasize the BBMP’s commitment to segregation.
In certain areas, collection systems falter because of specific circumstances – these include generators that produce significantly larger quantities of waste, special waste categories (like bio-medical and electronic waste) and areas like slums where space is a constraint. The requirement is for outbound skips or storage bins for citizens to dispose of special categories such as E-waste, old medicines, aluminum cans and the like. If the city can do this at public spaces such as shopping complexes, railway stations, bus stands and large parks; then the habit of recycling that we already possess will only have to change form. This would reinforce the recycling ethos by incorporating and incentivizing the informal sector, thereby integrating them into the waste management cycle.
This contract system now has to be linked with the existing DWCC to pick up only wet waste, leaving the dry waste to be handled through local channels. It is evident that the scrap-dealer and aggregator communities have the ability to handle dry waste; however, at present, they are only dealing with high-value waste because

Extracting value from Bengaluru’s Dry Waste Chain Conclusion
80 A collaborative effort of SVP, WUCU and BCCF
they don’t have the ability to financially justify transporting, sorting and aggregating low-value dry waste. Conversations with DWCC operators across the city indicate that the BBMP has committed to collecting reject streams not only for DWCCs but also informal Kabadiwallahs.
With the BBMP notification mandating self-management of waste for large generators (such as apartments and hotels), there is a need to outline operational procedures for this sector as well. This would include identifying and registering separate collection agencies, with emphasis on defined destinations for management and processing of waste. It would also be beneficial for Bengaluru to identify and adopt a common system for waste management. This would provide a huge push-and-thrust to dry waste collection and accordingly, segregation at source.
A complete end to end system, well assessed, can help close the loop with several dry waste streams and this inturn can further push towards creating a ‘Zero-Waste’ Bengaluru.

Extracting value from Bengaluru’s Dry Waste ChainAnnexures
81A collaborative effort of SVP, WUCU and BCCF
ANNEXURES
ANNEXURE IMEMORANDUM OF UNDERSTANDING FOR STUDYING DRY WASTE IN BENGALURU
Extracting value from Bengaluru’s Dry Waste Chain Annexures
82 A collaborative effort of SVP, WUCU and BCCF

Extracting value from Bengaluru’s Dry Waste ChainAnnexures
83A collaborative effort of SVP, WUCU and BCCF

Extracting value from Bengaluru’s Dry Waste Chain Annexures
84 A collaborative effort of SVP, WUCU and BCCF
ANNEXURE IIWUCU STUDY FOR WARD 151 (KORAMANGALA)
REPORT ON A SOLID WASTE MANAGEMENT (SWM) SIZING EXERCISE FOR WARD 151 AND EXTRAPOLATION TO BANGALORE CITY (BBMP AREA)
April 2013
1. REPORT CONTEXT
1.1. The garbage crisis in Bangalore, circa Aug 2012
Bangalore’s solid waste management problems got out of hand due to a series of developments end Aug 2012. The Mavalipura land fill was closed by the State pollution control board due to unhygienic conditions. The villagers of Mandur, the other major land fill protested further waste being sent there due to the rapidly deteriorating groundwater, health and sanitation conditions around the landfill. Around the same time, the city’s garbage contractors went on a 3 day sympathy strike with the BBMP engineers protesting the BMTF’s actions. The end result – over 10,000 tons of visible waste within the city and shrinking landfill areas where waste could be sent on a regular basis. It’s an issue that still plagues the city and the authorities have realised that they need to find a long term, sustainable solution for SWM.
Waste practitioners and civil society members engaged with BBMP and the State Government to find solutions to the garbage crisis. The contours of the long term solution involves mandating segregation at source, local recycling and processing (through Dry Waste Collection Centres and Integrated processing yards), reducing waste to land fill over a few years by over 85% (mainly ‘inerts’), managing bulk waste ‘in situ’ thereby reducing load on the public system, revised garbage tenders, waste processors certification, integrating rag pickers, working towards an Extended Producers Responsibility (EPR) law, etc.
In Dec 2012, Ms. Kalpana Kar, WUCU, felt we needed to get a handle on the waste generated in a ward and extrapolate the data to Bangalore to get a sense of the magnitude of the problem with relevant SWM handled data. Consequently with the assistance of Feedback Consulting and supported by Bangalore City Connect Foundation (BCCF), the group embarked on a waste quantification exercise through a primary survey in ward 151 using field professionals and volunteers. This report sets out the findings of the exercise. An important point to note about this exercise was that it was way more rigorous than a typical market survey among consumers since the waste at each respondent level was actually measured using a weighing scale as against questionnaire based methodology that is traditionally followed.
1.2. Objective of the Solid Waste Quantification Study
The objective of the present study is:
• To quantify the waste generated at a ward level through a scientific survey.
• Norms obtained through this exercise has been used to estimate the all Bangalore waste at an aggregate level
Independent Households (Door to Door - D2D) and Bulk (Apartments, Hotels & Restaurants, Hospitals/Nursing homes/ Diagnostic centres, Campuses/Industries and Trade establishments/Shops) forms the part of the universe at a ward level. Ward 151 (Koramangala) of Bangalore city was chosen for the study because of presence of SWM practioners in the ward, availability of resources to conduct the survey and also because good practices like waste segregation (in parts) has been adopted in Ward 151 before rest of the city.
While it is known that a separate sample methodology is required if the objective is to measure all Bangalore waste

Extracting value from Bengaluru’s Dry Waste ChainAnnexures
85A collaborative effort of SVP, WUCU and BCCF
generation, using norms from Ward 151 on universe estimates of waste categories will provide an order of magnitude estimate for the city. This is expected to be a useful input for policy planners and implementation agencies. Wet and Dry waste in D2D and Bulk constitute over 90% of the Municipal solid waste that is generated in Bangalore. Hence the study concentrates on measuring the wet and dry waste across these two generator categories (individual and bulk).
1.3. Exclusions from the study
The following categories of waste are excluded from the study – they were not measured and does not form a part of the quantification exercise. These are Leaves / garden waste, Medical Waste, Hazardous Waste & Debris.
It is also realised that some high value waste do not land up in the waste streams of the city. Examples of these are the papers, glass bottles handed over to the ‘raddiwala / kabadiwala’ or milk pouches, tetrapacks that might be directly sold to waste procurers by household staff, etc. The waste that goes directly to the wholesale buyers (particularly from households) will consequently not be captured in this waste quantification exercise since it is based on measuring waste sent into the public system.
The in-situ waste handling by apartments or office campuses are part of this quantification exercise. In these cases the waste quantum has been measured / estimated and included in the analysis though a part of it might be ‘treated’ within the premises.
2. METHODOLOGY OF WASTE QUANTIFICATION STUDY FOR D2D (INDEPENDENT HOUSEHOLDS)
2.1. Selection of Location: Ward 151 (Koramangala)
Ward 151 (Koramangala) was chosen for the survey because it is one of the areas where organised waste picking activity has been in vogue for a few years. Koramangala is also a typical city ward with a mix of residences, restaurants, trade establishment and offices. Ward 151 consists of 8,054 property tax paying households (individual and in apartments) located in 19 blocks of the Koramangala area of Bangalore. The D2D survey was restricted to independent units with a maximum of 3 units on a plot of land. As per property tax records there are 6,667 such units in ward 151 2.2. Deciding Sample Size
A survey was designed and administered to a randomly selected sample of ~195 households. At the ward level, this level of sampling gives a 95% confidence level with an error proportion of 7%
2.3. Survey Design
The household questionnaire (Exhibit 1) aimed at collecting information about residents’ socio-economic (SEC) characteristics, house hold size related information, current waste disposal method (segregated or not) and waste levels. The actual waste per household was measured using a weighing scale with a least count of 50 grams. The surveyors / volunteers who administered the survey also weighed the waste on two days at the randomly selected households. This exercise was done during Dec 2012-Feb 2013.
The objective of collecting SEC information is multi-fold:
• Income and Socio economic levels determine the waste generated per household. SEC classification is also a proxy for income levels
• Given the availability of Bangalore’s SEC split up in the National Readership Survey (NRS), it forms a basis for

Extracting value from Bengaluru’s Dry Waste Chain Annexures
86 A collaborative effort of SVP, WUCU and BCCF
extrapolation to the ward and city ‘universe’
• The SEC classification in the questionnaire with the waste generated information acts as a cross check on data collected through the field survey
2.4. Administering the Survey
A communication session was held with the surveyors / volunteers to administer the survey. The Left hand Rule was used for administering the survey. This was done as under:
• Selecting the starting points: Ward 151 has 19 blocks and 30 starting points were randomly selected across these 19 blocks. There were more starting points in lower income blocks that had higher density of households. At each starting point, 6-8 houses were surveyed for ~195 responses.
• Left hand rule: At beginning of the randomly selected starting point, 1st house on the left was selected for administering the survey. The survey was to be administered to an adult in the household. If the house was locked / no response was obtained, the volunteer left the next two households and knocked on the 3rd household for administering the survey. When the volunteer reached end of the road, he / she took a left turn and continued the survey. After 4 turns, he / she would reach the starting point. At this stage, if 6-8 surveys are not yet done, the volunteer would cross the road and start on the left of the road using the same rule described above. During this, volunteers always followed the rules described below:
o In localities where Ground Plus 2 is the norm, and if the ground is given for commercial use, they went to the household in the first floor to conduct survey
o In residential areas where commercial usage is prevalent, they skipped all commercial establishments and conducted survey only among independent households.
2.5. Analysing the Survey Results
The results from the survey were analysed using SPSS. The sample size gives a confidence level of 95% at the aggregate level for Ward 151. At the individual levels (eg. By SEC group), the sample frames are smaller and consequently the confidence levels will be lower. Since the focus of the exercise is on estimating the waste levels at the ward level, this sampling is more than adequate.
2.6. Estimating the Universe numbers for Ward 151 and Bangalore City
The ‘universe’ estimate for ward 151 was done based on property tax information on number of independent house units. Ward 151 is a well-developed ward where the property tax compliance is at high levels (estimated over 90%). Consequently it is estimated that the overall D2D waste quantities estimated through the measurement survey could be within a range of +/- 10%.
At the Bangalore city level, property tax compliance is not to the extent of ward 151. Further, there are about 1.5 lakh property tax records for apartments. Unfortunately in this statistic some apartments are recorded as a single composite unit while others are at an apartment unit household level. Using this statistics for calculation of Universe would not have given the complete picture. Hence we have done the estimates of Universe based on the overall population of around 96 lakhs and an average household size of 5. This gives us about 19.2 lakh households (individual and in apartments). Applying the break up for ward 151 where the property tax for apartments is at a household unit level, we have estimated the no. of apartment dwellers in Bangalore around 3.3 lakhs.

Extracting value from Bengaluru’s Dry Waste ChainAnnexures
87A collaborative effort of SVP, WUCU and BCCF
3. METHODOLOGY OF WASTE QUANTIFICATION STUDY FOR BULK GENERATORS OF WASTE
3.1. Identification of bulk generators
At the outset we identified the varying categories of bulk generators (domestic as in apartments and commercial as in hotels, hospitals, companies, etc.). A first cut of bulk categories covered the following broad categories and sub categories:
CATEGORY SUB-CATEGORY
Apartments Large, Medium, Small
Shops / Trade In complexes, Independent
Offices Campus, In Complexes, Independent
Factories Large / MSME
Hotels Large, Others
Restaurants/Pubs Large, Medium, Small
Clubs
HealthcareHospitals, Nursing homes, Diag centres, Polyclinics
Schools Large, Medium, Small
Colleges Large, Medium, Small
Malls, Movie halls In malls, Independent
Wedding halls Includes convention halls
Religious places Regular, Roadside
3.2. Deciding the Sample Size
Within the category / sub category, the sampling was done at a micro category. Some examples of micro categories – For shops / trade covered apparels, shoes, furniture, jewellery, stationery, workshops, fabrication units, petrol bunks, etc; For the eating out category, covered bakeries, darshini outlets, juice outlets, chaat outlets, etc.
About 600 commercial bulk waste generators were covered in this exercise. Many were covered outside ward 151 too since the ward did not have a sufficient representation of all bulk generators..
3.3. Quantification Mechanism & Estimating the Universe
For quantification of bulk waste, quantification using a relevant metric is a good way. Accordingly, metric for each bulk category was identified . Examples: waste / footfall in trade establishments; waste / employee in offices, etc. The challenge was in getting universe data at the relevant metric level which is not available.
Hence the study followed the steps detailed below:
• Build universe estimates at the sub category level from property tax data, commercial taxes department, trade licensing and secondary published sources. There is no ready, usable data about number of units in Bangalore at the category level (eg. no of trade establishments, no of restaurants, etc.) let alone at a sub-category level. So these had to be built by triangulating data from various sources. It was realised that property tax / commercial tax data provided a ‘floor’ estimate for some of the categories but clearly were below the actual levels due to under reporting. Category and sub category estimates available in market

Extracting value from Bengaluru’s Dry Waste Chain Annexures
88 A collaborative effort of SVP, WUCU and BCCF
studies done by Feedback Consulting were used as a guide in arriving at the final numbers.
• Multiply the universe numbers with the consumption norms (median) for each category/sub category. While average waste per sub category was also available, we chose the median estimate since that is likely to be a more typical indicator of the waste generation of a typical unit. Also, since there are outliers at the sub category level, median conveys central tendency better. As a cross check, the contractors in ward 151 were covered to estimate the total bulk waste collected per day across these bulk categories. They were covered at their offices and well as accompanying their trucks on the daily rounds.
3.4. Administering the survey
A listing of potential establishments that can be surveyed was initially made. For this purpose, data from a location based services firm Latlong was used. Their database has a near universe listing of large and medium establishments across the bulk categories. This was used to short list the establishments in the sub category to conduct the survey. Representation of small units was limited in their database. Convenience sampling of medium and smaller establishments were done to make up for this.
A Survey similar to the D2D was conducted and Exhibit 2 sets out the questionnaire that was used. As a first step, quantum of waste generated was also measured on 2 occasions. In the next step, survey was used to collect the waste generated information. This information was used to validate the actual measurements.
Over a period of time, the team also developed norms of waste quantities per bag /drum of waste which was used to list the weights.
4. ESTIMATION OF WASTE QUANTITIES IN WARD 151
4.1. Results from the D2D Survey of Ward 151
• The D2D exercise in ward 151 gave us waste generation figures at a household level by SEC categories. The weighted by SEC categories gives us the Average waste generated per household. For the D2D segment, since there is an underrepresentation of the urban poor (estimated @ 20% of the population), the SWM practioners who are a part of this study used their experience to correct the results for ward 151. The Corrected Average, multiplied with the Universe Estimates for D2D (Refer 3.6) will give us Average waste generated in TPD (tons per day) in D2D category in ward 151
D2DAverage TPD (from Survey)
Corrected Average TPD
Universe #Total waste generated / day in Ward 151 (TPD)
Ward 151 0.992 0.9 6667 6
• Wet vs. Dry Ratio: Even at Ward 151 level, level of segregation is poor. However, the survey amongst the households with segregation gave the ratio of Dry to Wet in D2D to be 62%: 38%. As per this, Ward 151 generates 3.7 TPD of dry waste and 2.3 TPD of wet waste in the D2D category
4.2. Results from the Bulk Survey of Ward 151
• Median waste generated per day multiplied by the Universe estimates (Refer 4.3) for Ward 151 gives the waste generated in TPD. Exhibit 3 gives details of sub category level details which adds up to category level waste generated TPD.

Extracting value from Bengaluru’s Dry Waste ChainAnnexures
89A collaborative effort of SVP, WUCU and BCCF
Bulk Category Total Waste Generated per day (TPD) in Ward 151
Apartments 1.4
Shops/Trade 1.0
Offices 0.8
Factories/Campus 1.5
Hotels 0.8
Restaurant/pubs 3.0
Healthcare 2.1
Schools 0.3
Colleges 0.3
Clubs 0.5
Wedding halls 0.7
Religious places 0.2
Sub Total 12.3
• Wet vs. Dry Ratio: Primary survey and actual weighing gives the ratio of Wet and Dry at the sub category level. The same is attached as Exhibit 4
5. EXTRAPOLATION OF WARD 151 NUMBERS TO BANGALORE CITY
5.1. Total waste generated:
Based on the study at Ward 151 for D2D and Bulk, the study has extrapolated the same to the Bangalore universe estimations. Please refer 3.6 and 4.3 for note on estimation of Universe. Based on the extrapolation, the total waste generated in Bangalore is 3330 TPD. Given that market waste and smaller generators are normally missed out in universe estimates, this number is likely to be the lower limit – the actual could be around 3700 tons per day The breakup of the 3300 tons per day is as under:
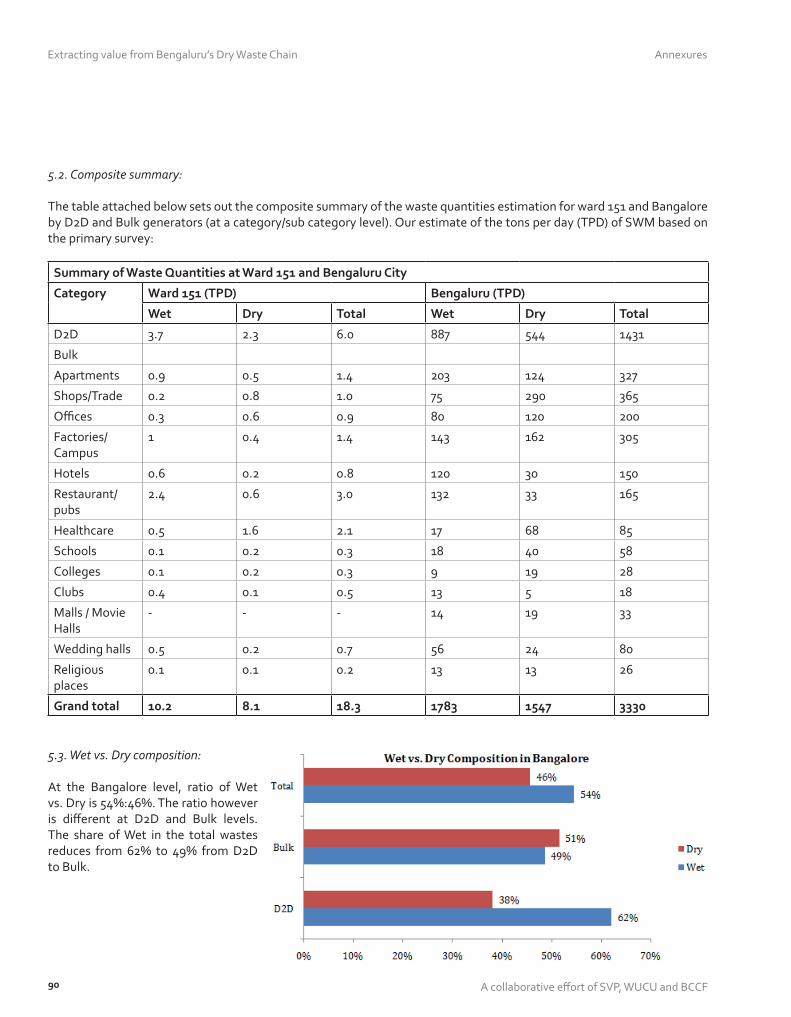
Extracting value from Bengaluru’s Dry Waste Chain Annexures
90 A collaborative effort of SVP, WUCU and BCCF
5.2. Composite summary:
The table attached below sets out the composite summary of the waste quantities estimation for ward 151 and Bangalore by D2D and Bulk generators (at a category/sub category level). Our estimate of the tons per day (TPD) of SWM based on the primary survey:
Summary of Waste Quantities at Ward 151 and Bengaluru City
Category Ward 151 (TPD) Bengaluru (TPD)
Wet Dry Total Wet Dry Total
D2D 3.7 2.3 6.0 887 544 1431
Bulk
Apartments 0.9 0.5 1.4 203 124 327
Shops/Trade 0.2 0.8 1.0 75 290 365
Offices 0.3 0.6 0.9 80 120 200
Factories/Campus
1 0.4 1.4 143 162 305
Hotels 0.6 0.2 0.8 120 30 150
Restaurant/pubs
2.4 0.6 3.0 132 33 165
Healthcare 0.5 1.6 2.1 17 68 85
Schools 0.1 0.2 0.3 18 40 58
Colleges 0.1 0.2 0.3 9 19 28
Clubs 0.4 0.1 0.5 13 5 18
Malls / Movie Halls
- - - 14 19 33
Wedding halls 0.5 0.2 0.7 56 24 80
Religious places
0.1 0.1 0.2 13 13 26
Grand total 10.2 8.1 18.3 1783 1547 3330
5.3. Wet vs. Dry composition:
At the Bangalore level, ratio of Wet vs. Dry is 54%:46%. The ratio however is different at D2D and Bulk levels. The share of Wet in the total wastes reduces from 62% to 49% from D2D to Bulk.

Extracting value from Bengaluru’s Dry Waste ChainAnnexures
91A collaborative effort of SVP, WUCU and BCCF
6. SOME KEY HIGHLIGHTS OF THE SURVEY IN BOTH D2D AND BULK
6.1. Waste Generated by different SECs in D2D
While it is obvious that households across the entire spectrum of population generates different quantum of waste, it is interesting to see the pattern. The salaried / lower middle / middle / upper middle / upper (SEC classification: A, B & C) generate higher amount of waste compared to SEC classification D & E. Pl refer Exhibit-1 for the details on SEC classification.
6.2. Segregation in D2D at Ward 151
Ward 151 shows greater amount of segregation.52% of the households surveyed in Ward 151 segregate their waste. It is possible that other areas of Bangalore may not show similar trends. Segregation is seen more in A,B & C SEC classification compared to D & E classification.

Extracting value from Bengaluru’s Dry Waste Chain Annexures
92 A collaborative effort of SVP, WUCU and BCCF
ANNEXURE IIILIST OF PROCESSORS
S. No
Dry Waste Type Processor Name Location Capacity Comments
1 Low Value plastics – LDPE carry bags (<40 microns), oil covers, HM plastics, kurkure, biscuit, flour covers.
Safa Plastics Hoskote Indl Estate
800-1000kgs/day Contact: Mustafa – 09341602744
BVG India JC Road 800-1000 kgs/day LDPE carry bags and
Sri Durga Polymers
Kumbalgodu 800-100 kgs/day LDPE, HM plasctics
KK Plastic Waste Management
JP Nagar Sourcing kurkure, biscuit and flour covers from DWCCs.
Vijay Jolly Mohalla 400-500 kgs/day All low value plastics
Ashok Kumbalgodu 400-500 kgs/day All low value plastics
2 High Value plastics – Milk Covers, PVC – bottles, pipes & hose, LDPE - carry bags (>40 microns), wrapping plastic, Water packets, household utensils and other products, food and packing containers.
1. Ess.Aay Plastics
Nayandahalli 1000-1500 kgs/day Grinding of plastics.
2. DMH Polymers Nayandahalli 800-1000 kgs/day Manufacturers of plastic granules. Contact: Md Dastagir - 09845093542
3. SI Plastics Nayandahalli 500-600 kgs/day
4. SM Plastics Nayandahalli 500-600 kgs/day
5. Santosh Plastics
Nayandahalli 800-1000 kgs/day Manufacturers of plastic granules.
6. Sailesh Polymers
Nayandahalli 400-500 kgs/day Manufacturers of LDPE, HM granules
7. Vijay Nayandahalli 400-500 kgs/day Manufacturers of LDPE blocks
8. Rohini Plastics Nayandahalli Manufacturers of reprocessed plastic granules.
9. Crystal Polyflex Nayandahalli
10. Sri Hari Polymers
Kengeri 800-1000 kgs/day Manufacturers of LDPE granules from milk covers.
11. Sri Durga Polymers
Kumbalgodu 700-800 kgs/day Manufacturers of PP, LDPE blocks and granules.
12. Moksh Polymers
Kumbalgodu 250-300 kgs/day Manufacturers of HM, LDPE bags
13. Ashok Kumbalgodu 500-600 kgs/day Manufacturers of blocks from LDPE, HM plastics
14. AN Plastics Kumbalgodu 15-20 tons/ month Manufacturers of HDPE pipes, PE agricultural pipes, lumps and granules. Contact: Nazim Shariff - +91-9845245185

Extracting value from Bengaluru’s Dry Waste ChainAnnexures
93A collaborative effort of SVP, WUCU and BCCF
15. Varun Industries
Kumbalgodu 20-25 tons/ month Manufacturers of HDPE, LDPE pipes from HM, LDPE, HDPE plastic scraps. Contact: M Nandish – 09448747338
16. Mahaveer Plastics
Bommasandra Indl Estate
Grinding ≈ 1000kgs/day; Granules: 600-700 kgs/day
Recyclers of LDPE/HDPE plastic components.
17. Kemplast Bommasandra Indl Estate
Manufacturers of HDPE, LDPE, PVC components
18. Sri Balaji Pipes Bommasandra Indl Estate
Manufacturers and Recycling of PVC pipes.
19. Geethanjali Polymers
Bommasandra Indl Estate
Recyclers of LDPE/HDPE plastic components.
20. Prashanthi Polymers
Peenya Indl Estate
Manufacturers of PE/PP blow/injection moulded components.
3 Carton Boxes 1. Venkraft Paper Mills Pvt Ltd
Hosur ≈ 60 TPD
2. Sudhir Papers Ltd
Jigani ≈ 40 TPD
3. ANS Paper Mills
Jigani ≈ 40 TPD
4. Jodhani Papers Limited
Doddaballapur ≈ 100 TPD
5. SF Enterprises Bommanahalli ≈ 3 to 4 tons/day Primary Processing (baling)
4 News papers 1. ITC TN, AP
2. Emami Paper Mills
Orissa
3. South India Paper Mills
Nanjangud, Mysore
5 White Paper 1. Bhadra Packaids/Sri Lakhsman Traders
Cottonpet Contact: Mr Madesh Lakshman - +91-9448284340
2. Supreme Paper Mills
Sivakasi, TN
6 Colored Paper ITC Coimbatore Coimbatore, TN
7 Metal – Aluminium cans and others
1. Padmavathi Metal & Profile
Kumbalgodu 90-100 tons/month
Also imports aluminium scrap from other states. Contact: Suresh – 08050798539
2. Leo Metal Craft Pvt Ltd
Harohalli Indl Estate
Recycling aluminium components into billets.
8 Metal – Srap Iron & Tin
1. Prime Gold Steel Mill (Pradeep Agarwal Group)
Thally Road, Hosur
Scrap Iron & Tin recycling. Contact: Tasleem Khan

Extracting value from Bengaluru’s Dry Waste Chain Annexures
94 A collaborative effort of SVP, WUCU and BCCF
2. Meenakshi Udyog (I) Pvt Ltd
Thally Road, Hosur
Scrap Iron & Tin recycling.
3. Apple Rolling Mills (P) Ltd
Thally Road, Hosur
Scrap Iron & Tin recycling.
4. Hari Alloys (P) Ltd
Thally Road, Hosur
Scrap Iron & Tin Recycling. Mr Parvez - 08220050023
5. Indus Steel & Alloys (P) Ltd
Thally Road, Hosur
Scrap Iron & Tin Recycling.
9 Metal – Brass Recyclers not available in Bangalore
10 Metal – Bronze Recyclers not available in Bangalore
11 Metal - Copper Recyclers not available in Bangalore
12 Glass – Unbroken Beer & Indian Liquor
1. Senthil Kumar Manganampalaya Contact: 9448218841
2. Chinnaswamy Ramamurthy Nagar
Contact: 9449742359
3. Mohammed & Brothers
Jolly Mohalla
13 Glass – Broken glass, Foreign Liquor bottles
Senthil Kumar Manganampalaya 45-50 tons/month Contact: 9448218841
14 Milk Covers 1. Sri Hari Polymers
Kengeri 700-800 kgs/day Contact: S Mahesh – 09448426976
2. DMH Polymers Nayandahalli 500-600 kgs/day Contact: Md Dastagir - 09845093542
15 PET 1. Flakebizz Peenya Indl Estate
Recycling of PET bottle – grinding, PET flakes etc. Mr Ronnie Zachariah – 09845174181.
2. BalePet India Kengeri Primary processing (baling) of PET bottles. Contact: Ishan
3. Sri Vinayaka Traders
Jolly Mohalla Primary Processing (baling) of PET bottles
4. PEAS Plastics Jolly Mohalla, Nayandahalli
Primary Processing (baling) of PET bottles. Contact: Saleem: 09845290600
5. Modern Plastics
Jolly Mohalla Primary Processing (baling) of PET bottles.
6. Ismail Hegde Nagar Primary Processing (baling) of PET bottles.

Extracting value from Bengaluru’s Dry Waste ChainAnnexures
95A collaborative effort of SVP, WUCU and BCCF
16 Tetra Pak 1. ALH Enterprises
Mahadevpura 60-70 tons/month Primary processing (baling) of tetra pack cartons and other products.
2. Saahas Jayanagar 15-20 tons/month Primary processing (baling) of tetra pack cartons.
3. Samarthanam JP Nagar 15-20 tons/month Primary processing (baling) of tetra pack cartons.
4. Hamsa International
Hegde Nagar 600-750 kgs/month
Reprocessing tetra pak into other paper products.
17 Gunny Bags – Plastic woven
1. SN Plastics Nayandahalli 700-800 kgs/day Gunny bags reprocessed into PP binding ropes. Contact: Shabbir - 07847804658
2. Safa Polymers Hoskote Indl Estate
1000-1500 kgs/day Primary processing (baling). Contact: Mustafa – 09341602744
3. ALH Enterprises
Mahadevpura 1000-1500 kgs/day Primary processing (baling). Contact: Ashmat Baig - 09342931136
18 Gunny Bags - Jute
Jolly Mohalla
19 Rubber – Tubes & Tyres
Harohalli Industrial Estate
20 Rubber – Other products
21 Thermocole & Foam
1. Enkay Industries
Hoskote Indl Estate
500-600 kgs/day Thermocole and Foam. Contact: Kamath - 9845075846
2. Sree Durga Polymers
Kumbalgodu 600-700 kgs/day Only soft foam recycling.
3. Varun Industries
Kumbalgodu 800-100 kgs/day Only soft foam recycling. Contact: M Nandish – 09448747338/09844977939
4. AN Plastics Kumbalgodu 800-100 kgs/day Only soft foam recycling. Contact: Nazim Shariff – 09845245185.
22 Batteries - Vehicles
1. Shiva Enterprises
Harohalli Indl Estate
2. India Metal Mart
Jolly Mohalla Dismantling of lead-acid batteries into plastics, metal and acid.
23 Mattresses & Cushions
1. Mohammed (Bengali Colony)
Marathahalli Cotton and foam removed and sent for further recycling. Fabric is burnt.

Extracting value from Bengaluru’s Dry Waste Chain Annexures
96 A collaborative effort of SVP, WUCU and BCCF
ANNEXURE IVCASE STUDIES TO SUPPORT VALUE CREATION THROUGH SORTING
TETRA PAK
Estimated Total Tetra Pak waste generation in Bengaluru per month = Approx. 330 tonnesTotal Tetra Pak waste collected and sent for recycling = Approximately 100 tonsRevenue loss to DWCCs/Aggregators per month = 230,000 kgs X INR 8 / kg = INR 18,40,000.00 (where INR 8/kg is the buying price of the end recycler, i.e., Deluxe Recycling India)
Reasons for loss of resource and revenue:
1. Poor segregation and collection system from households, commercial establishments, office complexes.
2. Lack of awareness among BBMP workers about the collection of tetra-paks leads to this category of waste being sent to landfills.
3. A majority of tetra pak waste collected is of alcoholic beverages, collected by rag-pickers and Bengali Colonies bars. NGOs such as Saahas, Waste Wise Trust and Samarthanam also have collection programs to collect this waste from corporate offices, residential complexes and other commercial establishments.
MULTI-LAYER FILM PACKAGING (INCLUDING KURKURE, BISCUIT COVERS, OIL COVERS)
Current Scenario:
1. Multi-layer film packaging disposed in households, commercial establishments and public dustbins, is rarely picked up by BBMP workers, rag-pickers or Bengali Colonies due the low value associated with these covers.
2. These covers are not accepted at DWCCs also. A few DWCCs, for eg, the ones at Jayanagar, JP Nagar have collected and stored them as they are not aware of the disposal procedure or down the line consumers.
3. Most of it ends up at landfills or are burnt at local dumping points.
4. The minimal quantity that is collected is unsegregated (mixed with other packaging material such as milk covers, LDPE bags etc) and sold either to aggregators or processors for INR 2-3/kg.
5. Processors (for eg, KK Plast, Safa Industries) convert these packaging materials into granules which are in turn used as raw materials in the plastics extrusion industries.
Effect of Segregation and Collection:
Multilayer film packaging has a demand in the recycling industries of Nayandahalli, Hoskote, Peenya etc if they have been segregated and stored during the disposal stage. Dry segregated multi-layer film packaging material can be sold to recycling industries for INR 5-6 per kg.
Mixing with organic material during disposal causes impurities such as water, oil and dirt to stick to the packaging which not only increases the labour for cleaning but also reduces the value of this recyclable dry waste.

Extracting value from Bengaluru’s Dry Waste ChainAnnexures
97A collaborative effort of SVP, WUCU and BCCF
MILK COVERS
The packaging used for milk consumed by households, hotels and coffee shops is a high value recyclable dry waste that can fetch up to INR 10-12/kg at the local kabadiwallah and up to INR 25/kg from a larger aggregator (bulk volume). The milk covers are made into granules which are then used as raw materials for tarpaulin sheets, plastic extrusion products etc.
However, the practice of disposal of these packets along with organic and other wastes drastically reduces their value to INR 3/kg at the local kabadiwallah. Further up the chain, when larger aggregators procure these packets from kabadiwallahs and DWCCs, their value reduces to INR 10-12/kg as the larger aggregators have to spend time and labour in washing and drying these covers.
ALUMINIUM FOOD FOILS
Commonly used by hotels and catering institutions for storage and delivery of food, aluminium food foils are a common sight in waste dumped by households as well as commercial establishments.
The aluminium waste dumped by households as well as commercial establishments is collected by PKs, BBMP workers or other rag-pickers who sell them to local kabadiwallahs or larger aggregators.
Segregated aluminium foils from the above sources can fetch up to INR 20/kg when sold to the local kabadiwallah. However, unsegregated aluminium foils which have been dirtied fetch less than half the value, INR7-8/kg, from the local kabadiwallah shop.

Extracting value from Bengaluru’s Dry Waste Chain Annexures
98 A collaborative effort of SVP, WUCU and BCCF
ANNEXURE VCASE STUDIES OF DWCCs VISITED
Details of the Dry Waste Collection Centres that were visited are listed in the table below:
S. No
DWCCWard No
Location Contact Operator Category
1 Kasa Rasa 2 Kormangala Nitesh Saahas NGO
2 170,171,177 JP Nagar – Jeyadeva Hospital Flyover
Entrepreneur
3 168 Near Nandi Theatre Mansoor Entrepreneur
4 112 Below Domlur Flyover Ambedkar Waste Wise Trust NGO
5 65,64,45 Malleshwaram (behind Chowdiah Hall)
Ambika BBMP BBMP
6 22 & 33 Dollar’s Colony 4th Cross Raju Venkatesh (Waste Contractor)
Contractor
7 23 Dollars Colony – 4th Cross NA Venkatesh Reddy Contractor
8 6 Hegde Nagar 4th Cross NA Not Functioning
9 61 Frazer Town, SK Nagar Andrews GRACE Entrepreneur
10 94 Gayathri Namana Foundation NGO
11 95 & 109 Naveen Namana Foundation NGO
12 23 Hennur Main Road Andrews GRACE Entrepreneur
13 24 Hennur Main Road Gajendran GRACE Entrepreneur
FIELD NOTES:
Ward No 168: Pattabiramana Nagar
The DWCC at Ward no 168 Pattabiraman Nagar is operated by Mansoor, who has been trained by Hazirudala and has been operating the DWCC for the past 8 months. He also received financial assistance from the Hazirudala in purchasing a small auto for waste collection and transportation.
• The DWCC receives around 300 – 350 kgs of dry waste from the BBMP waste collection vehicles every day.
• The estimated dry waste generation and collection in the ward is 1500-1600 kgs per day.
• Dry waste received is mixed with around 60-70% plastics (high+low value), 10% metals and glass, 10% papers. 10% is reject material. Does not take thermocole, e-waste.
• He has established contacts to sell the accumulated dry wastes. Plastics, Metals, Glass, Paper are sold to larger aggregators in Jolly Mohalla; Tetra Paks to Samarthanam Trust.
• Had accumulated and stored nearly 4 tons of kurkure covers and laminates since starting the DWCC as there was no buyer for this material. However, Hazirudala have linked him with KK Plastics as a buyer for this category of waste.
• Has engaged around 4 people for sorting and segregating. Workers are able to sort 60-70 kgs per day. Men

Extracting value from Bengaluru’s Dry Waste ChainAnnexures
99A collaborative effort of SVP, WUCU and BCCF
are paid INR 350 per day and women INR 250 per day.
• Mansoor also engages his vehicle to collect dry waste from commercial establishment and apartment complexes.
• Able to collect 150-200 kgs per day from bulk generators.
• However, apartment complexes do not segregate waste despite his numerous appeals.
Ward No 61: SK Garden
The DWCC in this ward is run by Andrews, a former kabaddiwala. The agreement with the BBMP was signed by the NGO, GRACE, who then appointed Andrews as the in-charge. The DWCC has been operational for nearly 6 months. GRACE and Andrews is also running the DWCC at Nagavara.
• Andrews has been in this business for nearly 10 years and has a good rapport for the rag-pickers and PKs in the locality.
• Around 500-600 kgs of dry waste from the BBMP waste contractors is received at the DWCC every day.
• The DWCC receives all quality and categories of waste unlike others where low value is more.
• Andrews gives ‘advance’ to the PKs and his rates are equal to Kabadiwallahs. Due to his familiarity with the PK’s, he often adjusts weight and rate of the dry waste material with them. This ensures the PKs bring the dry waste to him.
• Each waste collection auto (two PKs) brings around 40-50 kgs of dry waste to the DWCC every day. There are a total of 10 autos serving the ward. One PK is able to make INR 200-250 per day. (This is an observation and the figure could vary slightly).
• The PKs are paid between INR10-20/kg depending on the quality of the waste and level of sorting. The PKs are also engaged by Andrews for sorting.
• Space constrain was seen for the sorting and storing of the dry waste material.
• Andrews has also engaged his own vehicle for transportation of dry waste material to successors in the chain.
• He sells all the accumulated dry waste in Jolly Mohalla, except PET and Tetra Paks which are sent to Nagavara and Samarthanam respectively.
• Andrews has good ideas about the business due to his experience. He is willing to take a loss on certain dry waste material while offsetting the loss with higher margins on other categories of waste.
Ward No 22 & 33: Dollar’s Colony
The DWCC at Ward No 18 is run by ‘Pandal’ Venkatesh who is also a BBMP contracted domestic waste contractor.
• Dry waste received at the DWCC ranges from 350-400 kgs per day.
• Despite being operated by a domestic waste contractor, the quality of waste received at the DWCC is poor.
• High value and good quality dry waste is taken away by the waste collection auto staff.

Extracting value from Bengaluru’s Dry Waste Chain Annexures
100 A collaborative effort of SVP, WUCU and BCCF
• Long-term relationships with local kabadiwallahs in the area keep the PKs away from the DWCC.
• No house-hold in the area also drop off their dry-waste at the DWCC.
• The contractor has engaged an auto to collect dry waste from households and a few commercial establishments.
• However, segregation at the household level is poor and the DWCC staff have to sort through mixed waste. This is in spite of them requesting the households to segregate and store their dry waste separately. Has resulted in injuries to DWCC staff.
• The DWCC, though spacious, is poorly lit and ventilated. Infrastructure for staff to work is also not available.
• The sorted and segregated dry waste is sold to various agents in Jolly Mohalla.
• The DWCC is located very close to the DWCC serving ward no 21.
• However, no co-ordination between the two DWCCs in sharing transport for their accumulated dry waste.
Ward No 112: Domlur (below Domlur Flyover)
The DWCC at Ward No 112 is run by Waste Wise Trust and supervised by Ambedkar.
• Average of 300 – 400 kgs of dry waste received at the DWCC every day against the estimated 1600-1800 kgs of dry waste generated in the ward.
• The quality of dry waste received is around 30-40% of mid to high value waste with the remaining low value.
• The DWCC has also engaged a TATA ACE for waste collection from commercial establishments as well as households. Currently they cover around 3000 households in Domlur, Tippasandra and Indira Nagar.
• He has tried to collect waste from commercial establishments and bars, but has been unsuccessful due to a few reasons: (i) employees of commercial establishment sell dry waste to local kabadiwallahs. Even after being offered, equal or higher rates for the dry waste material, the employees refuse to handover the waste to WWT. (ii) bars have already established back-end linkages to take away glass bottles and are unwilling to hand-over the same to WWT.
• All his dry waste is sent to Andrews (SK Gardens), except tetra paks which is sent to Samarthanam Trust.
• 4 ladies (INR 250 per day) are engaged for sorting and each lady is able to sort through 70-80 kgs per day. However, the staff sort through only one type of waste per day with everyday waste not being sorted on a daily basis.
• Space utilisation in the DWCC is poor with a lack of infrastructure for sorting and storing.