
extracellular matrix-like structure Thixotropic silk ... · Fig. S2 The effect of adding NaCl into...
11
Supporting Information Thixotropic silk nanofibril-based hydrogel with extracellular matrix-like structure Yingxin Liu, Shengjie Ling, Suhang Wang, Xin Chen, Zhengzhong Shao, * State Key Laboratory of Molecular Engineering of Polymers, Department of Macromolecular Science, Laboratory of Advanced Materials, Fudan University, Shanghai, 200433, People’s Republic of China *Corresponding Author e-mail: [email protected] Electronic Supplementary Material (ESI) for Biomaterials Science. This journal is © The Royal Society of Chemistry 2014
Transcript of extracellular matrix-like structure Thixotropic silk ... · Fig. S2 The effect of adding NaCl into...

Supporting Information
Thixotropic silk nanofibril-based hydrogel with
extracellular matrix-like structure
Yingxin Liu, Shengjie Ling, Suhang Wang, Xin Chen, Zhengzhong Shao,*
State Key Laboratory of Molecular Engineering of Polymers, Department of
Macromolecular Science, Laboratory of Advanced Materials, Fudan University,
Shanghai, 200433, People’s Republic of China
*Corresponding Author e-mail: [email protected]
Electronic Supplementary Material (ESI) for Biomaterials Science.This journal is © The Royal Society of Chemistry 2014
PREPRATION OF SF NANOFIBRILS AND HYDROGEL
Production of silk fibroin aqueous solution. The raw silk cocoon was degummed by
boiling it twice in 0.5% (w/w) NaHCO3 aqueous solution for 30 minutes. The
degummed dry silk was then dissolved in 9.3 mol/L LiBr aqueous solution by heating
to 60 ºC for 1 h. Then the solution was dialyzed against deionized water for 72 h at
room temperature with a 14,000 molecular weight cut off dialysis membrane to
remove the salt and acquired the regenerated silk fibroin solution ( about 5% (w/w) ).
Production of SF nanofibrils. The silk fibroin solution was diluted to 0.75 wt%, and
adjusted pH to 9.5 with 0.5 mol/L NaOH aqueous solution. Then ethanol was added
(the final concentration 7 vol%). The mixture was incubated at room temperature for
the appearance of SF nanofibrils.
Production of SF nanofibril-based hydrogel. Before producing hydrogels, SF
nanofibril solution was dialyzed (3500 molecular weight cut off dialysis membrane)
against deionized water for 3 days to remove the ethanol. Then 0.6 ml NaCl was
added into 5.4 ml SF nanofibril solutions (final solutions with NaCl concentration of
25, 50, 75, 100 and 125 mmol/L). The solution was centrifuged for 10 min at 8000
r/min. Finally the upper water was removed.
CD CHARACTERIZATION
After removing salt and ethanol by dialyzing, SF nanofibril solution were analyzed
with Jasco-715 CD spectrophotometer. CD spectra were recorded from 190 to 250 nm
wavelengths with an accumulation of 5 scans at 25oC.
FTIR CHARACTERIZATION
Lyophilized SF nanofibril-based hydrogel was transferred to sample holders and
analyzed with FTIR Spectrometer (Nicolet 6700) for secondary configuration.
IN VITRO DEGRADATION OF SF NANOFIBRIL-BASED HYDROGELS
Degradation of the SF nanofibril-based hydrogel samples were tested in vitro.
Hydrogels were immersed in the PBS buffer solution (10 mmol/L) at 37±1 ºC, and
samples were taken out to measure the mass loss. Weight remaining (WR) was
calculated according as WR = W1/W0×100%, where W0 and W1 are the weights of the
hydrogel before and after soaking, respectively.

DYNAMIC OSCILLATORY RHEOLOGY
All rheological tests were carried out at 37±1ºC in strain controlled mode through a
Physica MCR 301 rheometer (Anton Paar GmbH, Austrilia) operating in 25 mm
parallel-plate configuration and 1 mm gap distance. 1 ml hydrogel was dispensed on
the bottom plate. To minimize the water evaporation, low density mineral oil was
around the hydrogel on the plate. Frequency sweeps were performed over a frequency
range from 0.1 to 10 Hz (strain 0.1%). As for the shear recovery test, the hydrogel
was firstly stimulated at a 0.1% strain which increased to 5000% for 6 seconds, and
finally returned to 0.1%. The cycle was repeated for 7 times at least.
LIGHT TRANSMISSION CHARACTERIZATION
The optical transmittance of the SF nanofibril-based hydrogel (NaCl 125mmol/L) was
measured in a custom-holder using UV-visible spectrophotometer (HITACHI U-2910)
operating in a spectral range of 350-700 nm.
AFM ,TEM AND SEM CHARACTERIZATION
Atomic force microscopy (AFM) was performed by using a Nanoscope VIII (Bruker,
USA) in an intermittent tapping mode at a scan rate of 1 Hz by using aluminum
silicon cantilevers with a typical tip radius below 10 nm (Bruker, USA). A 20 µL
aliquot of solutions was deposited onto freshly cleaved mica and incubated for 2.
Then the samples were rinsed with Milli-Q water and gently dried in air before
measurement.
Transmission electron microscopy (TEM) was performed by a Philips TEM (CM 20)
instrument operating at a voltage of 100 kV. A drop of the SF nanofibril solution was
casted onto a carbon support film on a copper grid. The excess solution was removed
after 30 s by blotting using a filter paper.
Scanning electron microscopy (SEM) measurements were performed on HITACHI S-
4800 operated at 1 kV. Images were collected on sections produced after freeze-
fracture.
ZETA POTENTIAL CHARACTERIZATION
After removing the ethanol and NaOH, 0.7 ml SF nanofibril solution was loaded to
Zetasizer (Malvern ZS90) for the zeta potential measurement at 25 ºC

CYTOTOXICITY TEST
Biocompatibility evaluation of SF nanofibril-based hydrogels was carried out by test
the extraction medium using L929 cells according to the ISO standard (ISO10993.12-
2004). The hydrogels were sterilized by soaking in ethanol aqueous solution ( 75%
(v/v) ) and washed to remove ethanol. Then the hydrogels were placed into a culture
plate with fresh culture medium (Dulbecco’s modified Eagle’s medium (DMEM,
Gibco), supplemented with 10% fetal bovine serum, 100 U/mL penicillin, and 100
μg/mL streptomycin) added at1.25 cm2/mL under sterilized conditions. The L929
cells were cultured at a density of 2.0 × 10⁴ cells/mL on 96-well plates (with 200 μL
per well) in a CO2 (5%) incubator at 37 °C. After incubation for 24 h, the extracts of
the hydrogels were added to replace the culture medium (with 200 μL per well) of the
cells. In the meantime, the fresh culture medium was added to the control group. After
incubation for 24 and 72 h, the culture medium was replaced with fresh serum-free
DMEM. Then, CCK-8 was added in the dark, and the absorbance of the solution at
450 nm was examined using an Elx 800 instrument (Biotek, U.S.A.) after incubation
for 2 h. The relative cell viability (%) was calculated as follows:
Cell viability (%) = [A]test/[A]control × 100%
where [A]test is the absorbance of the absorbance of the test sample, and [A]control
stands for the absorbance of the control sample.
CELL ENCAPSULATION IN SITU
The cell viability in the hydrogel was imaged by a confocal laser scanning microscope
(Zeiss Ism710, Germany) after use of a live/dead staining kit. 100 μL cell suspension
was added and mixed with the hydrogel to reach a final concentration of 1.0×10⁶/mL.
Then injected hydrogels with L929 cells were incubated in culture medium
(Dulbecco’s modified Eagle’s medium (DMEM, Gibco), supplemented with 10%
fetal bovine serum, 100 U/mL penicillin, and 100 μg/mL streptomycin) at 37 °C in an
incubator containing 5% CO2 for scheduled time, and live/dead imagining test was
followed.

Fig. S1 Structural characterization of SF nanofibrils. a, CD spectrum of SF nanofibril
solution. b, FTIR spectrum of lyophilized SF nanofibrils.

Fig. S2 The effect of adding NaCl into SF nanofibril solution. a, Vibrated SF
nanofibril solution before adding 25 mmol/L NaCl, which is transparent with
opalescent. b, Vibrated SF nanofibril solution after adding 25 mmol/L NaCl, which
has many white bubbles, indicating NaCl undermined the stability of SF nanofibrils.

Fig. S3 Optical transmittance of SF nanofibril-based hydrogel.
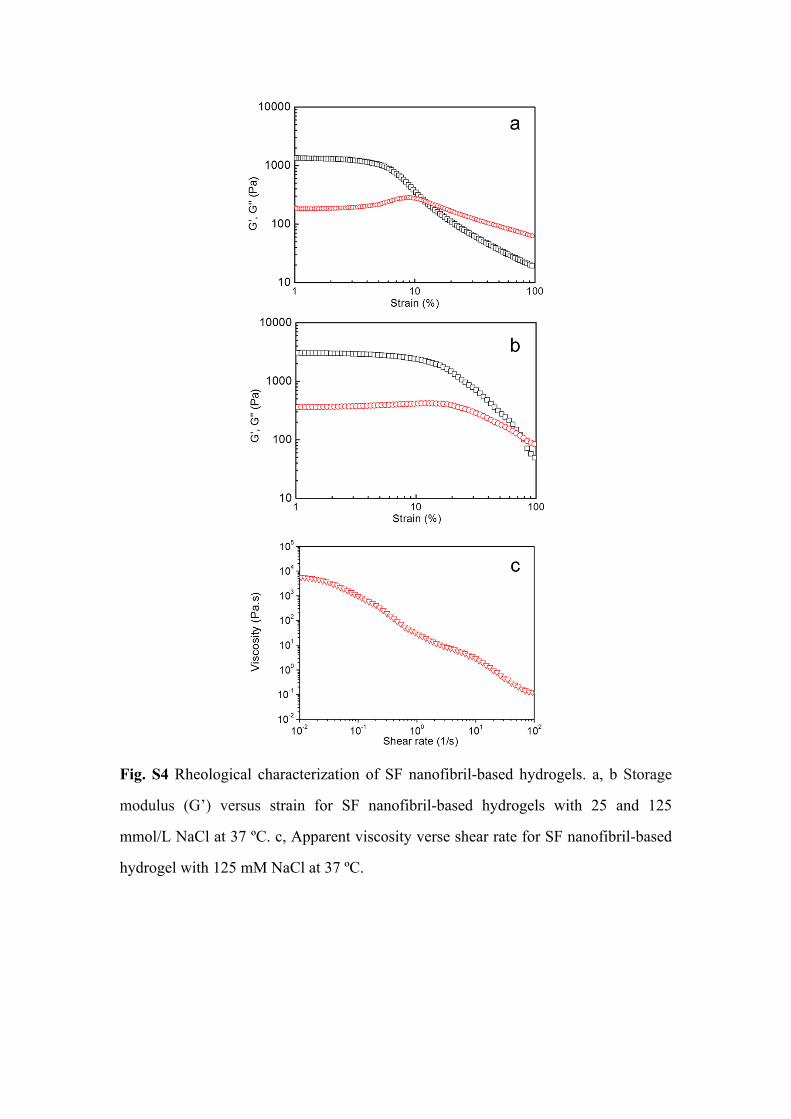
Fig. S4 Rheological characterization of SF nanofibril-based hydrogels. a, b Storage
modulus (G’) versus strain for SF nanofibril-based hydrogels with 25 and 125
mmol/L NaCl at 37 ºC. c, Apparent viscosity verse shear rate for SF nanofibril-based
hydrogel with 125 mM NaCl at 37 ºC.

Fig. S5 Variation of SF nanofibril-based hydrogels soaked in PBS (150 mM NaCl) for
24 hours at 37 ºC. a, Variation of solid content after being soaked in PBS. b, Variation
of G’ after being soaked in PBS.
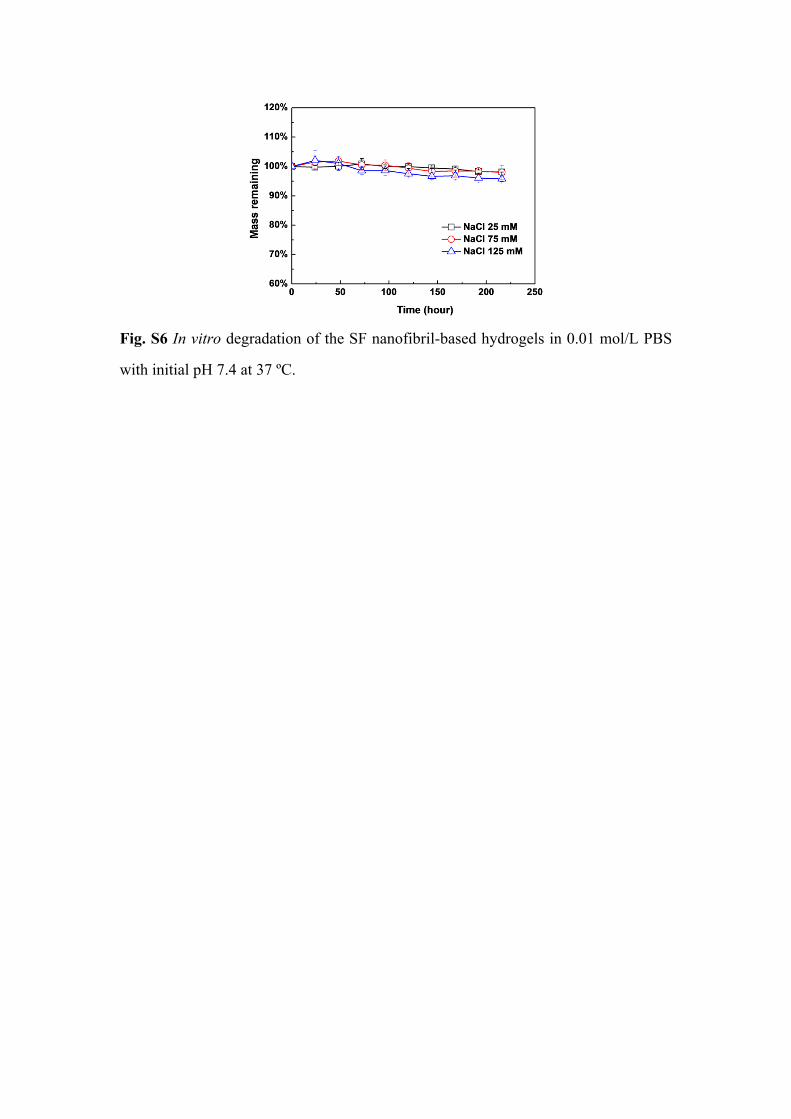
Fig. S6 In vitro degradation of the SF nanofibril-based hydrogels in 0.01 mol/L PBS
with initial pH 7.4 at 37 ºC.

Fig. S7 The microphotograph (a) and fluorescent image (b) of L929 cells
encapsulated within SF nanofibril-based hydrogel after 7 days culturing time.


![Cellulose Nanofibril Composite Substrates for Flexible ... · PDF fileCellulose Nanofibril Composite Substrates for Flexible Electronics ... electronic devices is ongoing [1]. ...](https://static.fdocuments.in/doc/165x107/5a87b1617f8b9a9f1b8df19a/cellulose-nanofibril-composite-substrates-for-flexible-nanofibril-composite.jpg)