
Extortion with Protection: Understanding the effect … Story...1 Extortion with Protection:...
52
1 Extortion with Protection: Understanding the effect of rebel taxation on civilian welfare in Burundi Rachel Sabates-Wheeler Centre for Social Protection, Institute of Development Studies, Brighton. email: [email protected] Philip Verwimp ECARES and Centre Emile Bernheim, Solvay Brussels School of Economics and Management, Université Libre de Bruxelles email: [email protected] Abstract Using a panel dataset from Burundi where information on protection payments during the 10 year civil war were collected, we test the relationship between payments, the nature of extraction by the rebels, and welfare outcomes. We ask, does payment to rebels insure against future welfare loss and does the nature of payment matter? Specifically, does the level of institutionalisation of extraction within the rebel governance structure provide a form of insurance for future welfare? No less than 30% of the interviewees made at least one payment. Rebels extract these taxes through one of two routes: an ‘institutionalised’ and regular cash-with-receipt method or an ad hoc and unpredictable labour extraction. Using matching methods we find that payment through the institutionalised route increases household welfare between 16 and 25%. Ad hoc extraction has no effect. We situate our findings in the empirical literatures on contributions to mafia-type organisations and rebel governance. Keywords: extortion, taxation, forced labour, welfare, rebellion, Africa Acknowledgement: the data used in this study are collected through funding from the MICROCON consortium (EU 6 th Framework), the University of Wageningen and the United States Institute of Peace. The authors would like to thank Georg Kirchensteiger and seminar participants at IDS, Brighton for insightful suggestions. All errors are the responsibility of the authors.
Transcript of Extortion with Protection: Understanding the effect … Story...1 Extortion with Protection:...

1
Extortion with Protection: Understanding the effect of rebel taxation
on civilian welfare in Burundi
Rachel Sabates-Wheeler
Centre for Social Protection, Institute of Development Studies, Brighton.
email: [email protected]
Philip Verwimp
ECARES and Centre Emile Bernheim, Solvay Brussels School of Economics and
Management, Université Libre de Bruxelles
email: [email protected]
Abstract
Using a panel dataset from Burundi where information on protection payments during
the 10 year civil war were collected, we test the relationship between payments, the
nature of extraction by the rebels, and welfare outcomes. We ask, does payment to
rebels insure against future welfare loss and does the nature of payment matter?
Specifically, does the level of institutionalisation of extraction within the rebel
governance structure provide a form of insurance for future welfare? No less than
30% of the interviewees made at least one payment. Rebels extract these taxes
through one of two routes: an ‘institutionalised’ and regular cash-with-receipt method
or an ad hoc and unpredictable labour extraction. Using matching methods we find
that payment through the institutionalised route increases household welfare between
16 and 25%. Ad hoc extraction has no effect. We situate our findings in the empirical
literatures on contributions to mafia-type organisations and rebel governance.
Keywords: extortion, taxation, forced labour, welfare, rebellion, Africa
Acknowledgement: the data used in this study are collected through funding from the MICROCON
consortium (EU 6th
Framework), the University of Wageningen and the United States Institute of
Peace. The authors would like to thank Georg Kirchensteiger and seminar participants at IDS, Brighton
for insightful suggestions. All errors are the responsibility of the authors.

2
Introduction
In the context of war, weak states and civil unrest, payments to powerful groups -
government forces, rebels, militia and mafia – can be extorted or given over
voluntarily in exchange for protection, or insurance, against a range of negative
outcomes, including death. Furthermore, the nature of extraction of payments reflects
structures and aspirations of territorial control of rebel governance, which can be ad
hoc or institutionalised and sometimes accepted by civilians (Arjona, 2008; Olson;
2000). Whether effective protection is provided is a matter of debate and a review of
the literature on the subject suggests that payments can help for protection but are not
a guarantee against negative livelihood outcomes.
Using a novel panel dataset from Burundi where data on protection payments during
the 12 year civil war (1993-2005) were collected, we test the relationship between
payments, the nature of extraction by the rebels, and welfare outcomes. In particular
we have two points of interest. First, does payment to rebels insure against future
welfare loss? Second, does the nature of payment matter? That is, we are interested to
see if the level of institutionalisation of extraction within the rebel governance
structure (proxied by predictability as opposed to unpredictability in extortion)
provides a form of insurance for future welfare. While payment to rebels does not
equate with the usual insurance market conditions, for an insurance market to function
smoothly payments and risks need to be predictable in advance. In the same way, if
rebels institutionalise a particular form of extraction, this is likely to have better
welfare outcomes for the civilians than if the extraction is ad hoc. We are interested to
test whether this relationship holds under conflict conditions. Olson’s (2000) work
speaks to the other side of this coin, that is, does ‘mobility’ of rebel governance

3
structure (or rebel aspirations for taxation of population) determine the welfare
outcomes for economies/societies at large. While intricately related, we are interested
in the household level welfare impacts. We provide a review of the rebel governance
structure in Burundi as a way of contextualising these outcomes. This is supplemented
by qualitative evidence collected by the authors from key informants who had first-
hand knowledge of the payment procedures during the civil war period. To the best of
our knowledge this is the first paper to investigate, empirically, the linkages between
the nature of rebel governance as reflected in type of extortion and household welfare
outcomes during civil war.
We use standard OLS models to investigate the relationship between extortion type
and welfare. As a way to control for variation in the observable features of the
households in our sample, we specify a model that predicts the determinants of
extortion and then use this as part of an econometric matching design in order to
establish the robustness of earlier findings. We find a strong and robust relationship
between extortion and welfare, however this relationship holds only for payments
made in cash to rebels and not as extraction for forced labour. The reasons for this are
likely to relate to several factors to do with (or absence of) rebel governance: (i) the
fact that cash payments were often given in advance, before an act of violence, such
as rebel attack, occurred; (ii) such payments were often made regularly, in a
predictable way whereby rebels would provide a receipt of payment; (iii) labour was
typically extracted in an ad hoc, unpredictable way, and usually at gunpoint, and; (iv)
the socio-economic characteristics of persons having cash extorted differs from those
having labour extorted. In particular, persons owning an enterprise are more likely to

4
make cash contributions to rebel groups. This means that rebels know whom to target,
or in alternative wording, persons with this profile know that they have to contribute.
In this way the institutionalised forms of tax extraction by rebels, in our case in the
specific form of regular cash payment, can be hypothesized to act as an insurance
mechanism against negative outcomes for persons with certain economic profiles.
Conversely, extortion in the form of irregular extraction (labour in this case) does not
provide insurance for future welfare. These findings indicate that the nature of
extortion and rebel governance within a conflict scenario is a critical determinant of
welfare.
Our results resonate with Arjona’s (2008) theory of local orders within the context of
civil war, highlighting that the greatest challenges and opportunities for peace,
reconciliation and reconstruction vary from place to place. Echoing the work of
Olson, our works illustrates the co-dependence of the civilian population and the rebel
movement, but fundamentally it shows how institutionalized forms of rebel
governance (approximating Olson’s ‘stationary’ bandits) have better outcomes for
victims of extortion in terms of security and welfare than simple ad hoc punitive
strategies (approximating Olson’s ‘roving’ bandits).
Protection and Extortion: literature review
The literature concerned with protection payments is largely limited to the Italian
(Sicilian) and Italian-American Mafias, Russian Mafiya, and the Japanese Yakuza.
There is also a small sub-literature that discusses protection payments in developing
countries. Noticeably, the effect that protection payments have on the welfare of the

5
victims has received almost no attention. Instead authors have concentrated on the
history of protection payment organizations, the conditions that create a supply and
demand for protection payments, and the operations of protection payment
organizations. For purposes of this paper we review what the literature has to offer on
(1) the nature of payment/extortion in terms of whether it is predictable or not and,
relatedly, rebel governance, and; (2) the effects of payment and the nature of payment
on welfare outcomes. Before this a brief note of the distinction between extortion and
protection payments is worth making.
A loose definition of how United States Federal Law and Russian legal authorities
define extortion is ‘the seizure of property with the knowledge and consent of the
owner through the use of violence or the threat of violence’ (Lotspeich 1997, 22).
Theoretically protection payments differ from pure extortion in two ways. First, the
definition for extortion omits the provision of protection to the owner. Second,
although not clearly defined above, there are cases in which payment is voluntary, for
instance in documented cases in West Darfur and Iraq (see Jaspars, et al. 2007, 14;
Williams 2009a, 160-161).
While the terms protection payment and extortion are often used to refer to the
voluntary and involuntary nature of payment extraction, respectively, studies show
that the two terms are often confused and ambiguous (see Gambetta 1993 for a case
study of the Sicilian Mafia). The confusion between these activities means that
distinction for purpose of analysis is difficult. For instance, Gambetta has shown that
extortionists may be forced to provide protection or, as in numerous other cases, the
6
group receiving the payment may not be able to guarantee their customer’s safety.
Here, we use the terms interchangeably.
The nature of extortion and rebel governanceWhile context-specificity is critical,
research shows that where institutions that exist to protect citizens (judicial system,
police, military, etc.) are weak, there is an increased need for protection. In the
context of war, protection often comes at a cost. The amount and the regularity with
which the money or goods is extracted depends on the group extracting and the victim
from whom they are withdrawing payment. Unlike many famous economists before
him who believed that voluntary, mutually advantageous exchange ruled market
relations, Olson (2000) recognises the role that power, coercion and force have in
exchange relationships. In his famous book Power and Prosperity: Outgrowing
Communist and Capitalist Dictatorships Olson considers the role of power and the
relation between governance and economic performance. Governance by a “stationary
bandit” is more likely to support productive economic activity than governance by
“roving bandits” because the former has an “encompassing interest” in maximizing
output so that he can maximize his take from that output.
For instance, some evidence suggests that ‘stationary’ bandits are able to institute
protection systems thereby cementing long-term regular revenue. In the case of
migrant Chinese businessmen in New York City, the gang member demanding
payment and the owner of a business negotiate the amount of money paid in order to
prevent damage by the demanding gang or rival gangs. After the amount is
negotiated, the business owner will pay regularly, whether it be on certain holidays,
weekly, or monthly (Kelly, et al. 1993, 259 and 261). In South Africa, members of
the Mapogo a Mathamaga pay annually and their payment is based upon their status

7
and the size of the business. (von Schnitzler, et al. 2001, 14). In Waro and Urdi in
West Darfur, villagers paid the Janjaweed 5SDG (1.5US$) per month for protection,
while an Iraqi said that he paid US$13 per month to the local Mahdi in order to avoid
violence or kidnapping (Jaspars and O’Callaghan 2008, 11; Williams 2009a, 236). In
Ottoman Gaza, protection payments to Bedouin tribes were legalized. The villagers
benefited from the legal and regular payments, as the rules that were erected
prevented contact with villagers, which could have resulted in the demand for further
payments (Etkes 2007, 10).
There are a few cases, where victims are forced to pay what can be characterized as
“user fees.” The military officers involved in coca trafficking require a US$5,000
protection payment for each planeload of Peruvian coca leaves or paste (Mason and
Campany 1995, 162). In Somalia, West Darfur, and Iraq, people pay for safe passage
on public roads (Vinci 2006, 9; Jaspars and O’Callaghan 2008, 14 and 11; Williams
2009a, 91; Williams 2009b, 332). In West Darfur, pastoralists pay taxes as well as
arbitrary payments of up to US$150 in order access markets, while a person may be
charged US$900 to take livestock to market with the protection provided by a military
escort. Villagers in Abata were forced to pay for the use of camels if they wished to
travel to Zalingei (Jaspars and O’Callaghan 2008, 14 and 11).
In some instances, businesses, rather than individuals or households, receive
protection. In the Democratic Republic of Congo, RCD-ML rebels “sold” insurances,
technical notes and discharge papers to businesses. In addition, by paying a fee to the
rebels, businesses reduced or eliminated their taxes (Raeymaekers, forthcoming, 9-
10). A farm owner and other members of a cooperative in Beni-Lubero in the

8
Democratic Republic of Congo pay the Mayi-Mayi one cow per month to pay for
their protection (Raeymaekers, forthcoming, 10). There are also cases where villagers
pay through a combination of food and money in return for protection (Jaspars and
O’Callaghan).
All of the examples above illustrate the various ways in which mafia or rebels
establish and maintain governance structures that increase the probability of
consistent and sustained extraction as well as citizen/civilian compliance. Sanin and
Baron (2005) raises some pertinent issues in his analysis of the evolution of the
Colombian, Puerto Boyaca’s paramilitary regime. Of relevance to this paper is the
question of how violence and repression constitute social order. Indeed, the
Colombian paramilitary appeared as a punitive force, basically of the cattle ranchers
and the narcotraffickers, but they soon discovered the need to govern, which entailed
establishing new mechanisms to control the population. Similarly, Olson (1993) asks
how criminality and the private provision of security are related? To Olson (1993)
criminality was centrally important to rent extraction and the formation of the modern
state whereby an elementary present value calculation shows that it is in the best
interest of the bandit to limit his rent extraction, so as to give economic agents the
opportunity to accumulate. Gradually, ad hoc extortions and rackets become taxes, the
need to inspire fear is replaced by the need to control, and big organisational
apparatuses appear. Stationary bandits were able to establish a monopoly on rackets
and extortion, and at the same time offer them the opportunity of legitimising through
the provision of security.

9
Furthermore, Ana Arjona (2008) argues that in most contemporary civil wars the fight
is about gaining territorial control rather than defeating a rival army in successive
battles. This affects the ways in which armed groups relate to civilian populations.
“When the survival and success of armed groups depend on territorial control, civilian
collaboration becomes crucial. Civilians can provide the armed groups with a wide
range of valuable resources and endowments, including information, food, shelter,
and labour force. Without these resources, armed groups can hardly survive, let alone
maintain territorial control. Because civilian collaboration is so essential for armed
groups, they have a clear incentive to behave in ways that render it. But collaboration
is a complex matter. It may involve only a few occasional actions, or a long list of
daily activities; and these behaviours can entail either mere obedience or
endorsement. Given this heterogeneity, the effectiveness of violence is limited. If
violence cannot bring about the different instances of collaboration that armed groups
need from civilians, what is the alternative? Creating a new social order offers great
advantages. By creating a new social order the group is able to influence civilians’
lives in ways that may, through different mechanisms, translate into obedience and
endorsement” (pp. 2-3).
So the nature of rebel governance, the degree in which it is institutionalized and the
collaboration between rebel and victim around the payment mechanism are all
important in determining welfare outcomes.
The welfare outcomes of payment/extortion
Non-compliance with the demands of the gang, rebels, militias, or mafia can lead to
financial loss, property loss, injury, or death. Some groups inflict harm on the

10
property owned by the person who is unwilling to comply ( see Lynn 1993 for a
review of welfare oucome associated with non-payment in France under Louis XIV;
Gragert (1997) for welfare outcomes in Japanese Yakuza protection racket; Williams
(2009a) for description of injuries inflicted on unwilling ‘payers’ in Iraq; and Mason
and Campany (1997) for punitive system of Sendero Luminoso in Peru).
In return for paying, businessmen, communities, and villages expect protection;
however only a few articles even mention the effectiveness of paying and the
evidence appears to be entirely context specific. A United States military officer,
referring to the effectiveness of the militias, stated that, “People count on the
militias…. It’s like the mob—they keep people safe” (qtd. in Williams 2009a, 236).
According to Reij Al Talata community leaders, who referenced the attack against the
Katilingei village, the payment of protection money in Darfur is crucial to a village’s
survival (Jaspars and O’Callaghan 2008, 14).
Even if protection is secured through payment, there are still consequences on the
livelihoods to the individual or community paying protection. Although all victims
experience a loss in money or goods, the impact on livelihoods is not widely
discussed. Jaspars, et al. (2007, 15) point to the short-term effects, such as loss of
income, that paying protection money may have on individuals and communities, but
they maintain that what is garnered in long-term benefits, such as retaining access to
land or mobility, may be beneficial. In the case of migrant Chinese businessmen in
New York City, the authors contend that money taken for protection was only mildly
parasitic, while the cost for not paying was far greater (Kelly, et al. 1993, 263).

11
Moreover, paying a group money to protect against an attack, does not necessarily
ensure that other forms of violence will not be committed by the group against
community members. Williams (2009a, 157) summarizes this predicament well in
stating “protection and predation are two sides of the same coin”. In his discussion of
protection in the Democratic Republic of Congo, Raeymaekers (forthcoming, 10)
notes that rebels proceeded in a reign of terror on the same villages they were being
paid to protect. During the 2002 massacre in Kariobangi, people of the local
community stated that although the Kenyan Taliban was charged with protecting
them, they were “terrorising residents instead of protecting them” (qtd. in Anderson
2002, 532). In other words, payment does not guarantee protection, however in many
documented cases it does increase the likelihood that you will be spared from negative
outcomes.
From the available literature, reviewed above, we see that there is much description
on the nature of protection as set up through mafia and rebel governance structures,
with references to predictability and regularity of payments and; some description on
the linkages between extortion and protection. Absent is any analysis, in particular
empirical work or evidence of how extortion, or the nature of rebel extortion, relates
to outcomes for the victims. In the following analysis we attempt to provide an
empirical analysis of how institutionalised systems of extortion are able to insure
against negative outcomes and even provide the basis for positive welfare returns, as
compared to non-payment or ad hoc extortion. We develop some testable hypotheses
for protection/extortion and welfare. We first discuss the case of Burundi and identify
the relevance of the literature to this case.

12
Conflict and Extortion in Burundi
A short political history of the conflict
Burundi has, until recently, been involved in long and a brutal civil war that left
hundreds of thousands of people dead, maimed or displaced. Massive bloodshed took
place in 1972, where the armed forces slaughtered between 80,000 and 200,000
(mostly wealthy and intellectual) Hutu. In 1988, responding to a similar uprising in
the Ngozi and Kirundo provinces where several thousand Tutsi were killed, ‘peace’
was restored by the government forces killing 20,000 Hutu (HRW, 1998). Although
no formal investigation into the 1988 massacres was allowed, president Buyoya
sought for means to reconcile Hutu and Tutsi rather than controlling the Hutu majority
by repression. Several Hutu were appointed to government positions.
Many Tutsi, however, viewed loss of ruling power and the resulting massacres in
neighbouring Rwanda as a warning sign for what would happen if they started sharing
power with the Hutu. They therefore resisted Buyoya’s reforms with unsuccessful
coups in 1989 and 1992. Despite internal opposition, elections were held in 1993 and
on July 1, Melchior Ndadaye became Burundi’s first Hutu president. The newly
installed president made important changes in the local administration and planned to
reform the almost exclusively Tutsi army to increase ethnic and regional diversity
(HRW, 1998).
The attempts to reform, however, ended brutally with the killing of Ndadaye in
October 1993. The eruption of Hutu-led violence following the killing of the
president was retaliated by massive indiscriminate violence by the government forces.
HRW reports: “The army responded with clashes on Hutu making no distinction

13
between communities involved in violence against Tutsi and those that were not. In a
period of only a few weeks anywhere from 30,000 to 50,000 people were slain,
roughly an equal number from each ethnic group.” Uvin (1999) elaborates: “On
October 21, 1993, low-level soldiers killed President Ndadaye and other dignitaries
after only three months in office, with at least passive support from the highest levels
of the army.”
In subsequent days and weeks thousands of Tutsi were brutally killed, especially in
the north and centre in a campaign led by local Hutu politicians. The army moved in
to restore order, killing thousands of Hutu in the process. In total, it is estimated that
50,000 to 100,000 persons were murdered in the three months after the coup; one
million fled the country; and hundreds of thousands were internally displaced. ‘The
scope and intensity of the violence was unprecedented and resulted in a gruesome
civil war that lasted sixteen years, leaving the country and its citizens in ruins.’
Rebel governance: extortion without service provision
The civil war in Burundi was a low-tech war in which physical strength, rifles and
machetes were the most important assets of the warring parties. Civilians paid heavily
for the war: many people were killed, kidnapped or displaced. Women were raped,
houses destroyed, cattle stolen, trees burned. Importantly for the topic of this paper,
civilians were forced to contribute to the war effort, either by paying contributions,
‘cotisations’, in cash or by having support extracted in kind.
The cycle of violence followed a typical pattern: a warring faction would attack an
army post or a symbol of government power in a specific locality after which the

14
army would use disproportionate force to retaliate against the population of that
locality. The army considered the population as supporters of the rebels wherever an
attack was launched and the rebels considered the population as the base from which
to operate. Army and rebels shunned open large scale battles and preferred to rob and
punish the civilian population instead.
Burundi’s hilly terrain and dispersed population makes it almost impossible for the
army to control the entire territory. It was relatively easy for the rebels to hide in, or
retreat to, the forest or to move at night through the fields and swamps. Warring
factions had their local support bases among the population, most fighters were the
sons of Hutu peasants who joined the ranks of a rebel faction whereas young Tutsi
men would join the army. This does not mean however that all peasant families were
ready to give even more support in terms of labour and cash. They had already ‘given’
their sons and in some cases their daughters to the rebel group and were too poor to
contribute more. The remaining male and female labour was needed on the farm as
well as in the household together with the few livestock owned and the meagre cash
resources.
Since rebels have to eat, need money to buy weapons and need labour to carry food
and weapons they would ‘extract’ labour and demand cash contributions from
civilians who did not volunteer this kind of support or did not want to give any kind of
support at all. Our paper focuses on this kind of forced contributions, in cash as well
as in kind. Different types of contributions were required. One typical pattern took
the form of small groups of rebels that would stop buses passing through their
territory, ask all passengers to get out of the vehicle and steal their valuables such as

15
watches, earrings, rings, shoes and money. From the point of view of the victim, this
type of ‘extortion’, while always a possibility, was irregular and unpredictable in
terms of timing and the actual resources extorted. Male able-bodied men and women
were not only robbed of their belongings, depending on the needs of the day they
were forced to follow the rebel group and carry food, clothes, luggage and
ammunition. These men could be held in captivity to perform labour tasks as long as
the rebels deemed necessary. In extreme cases, when tensions ran high, for example
because of recent political events, bus passengers could be executed on the spot.i
Another form of extortion was in the form of ‘home’ visits where the resident was
asked to contribute money. This was a regular occurrence. One of the authors held in-
depth discussions with well-informed persons upon several research visits to Burundi
between 2011-2013 on rebel taxation and rebel governance during the civil war. It
became clear from these discussions that the rebel movements systematically
collected contributions from the population in the area under their control. Every
month, each adult in the area was visited by a representative of the rebel movement to
collect a tax. The level of the tax depended on the occupation and the perceived
income of the resident. Persons with a salaried job had to pay more than ordinary
farmers. Upon paying the contribution/tax one received a receipt that proved that you
paid your contribution. Next to the monetary payment, rebels would also ask for food,
for example a small animal like a goat or even a cow. They did not take all of your
assets or belongings. If you had four goats for example, they would request one. And
a few months later they would come back to ask another one. Asked by the researcher
if the population received something in return for these contributions, the answer was
always negative: the rebel movement did not provide any services. When they would

16
intervene in conflicts between neighbours, for example on land issues, it could hardly
be called justice, it was more about settling scores and denouncing other people. The
researcher then asked if the ‘service’ the rebels offered may have consisted of the
absence of pillaging, in the sense that once you paid your contribution, you were left
alone. This was confirmed by the all interviewees. One interviewee told the story of a
large cement company in the capital whose owner approached the rebel leader to
make a payment per truck of cement in a large road building project. After agreeing
on the payment the two sat together and shared a glass of beer, a sign of collaboration
and friendly relations in Burundi.
The receipt which counted as proof of one’s contribution was particularly useful in the
case of traders or entrepreneurs who have to transport goods across municipalities or
provinces. When stopped at roadblocks by rebels, the trader was asked to show this
receipt upon which he or she could carry on with their business. This was also the
case for a passenger who was able to show such receipt when his/her bus was
ambushed: (s)he was left alone. The practice of writing receipts for contributions to
the coffers of a rebel faction was also implemented on trucks transporting goods. A
driver passing through a rebel held territory had to show his receipt before being
allowed to pass through. When he did not have it, he was asked to pay on the spot,
receive a receipt and was then allowed to continue the journey.
This practice of collection of contributions shows the extent to which rebel factions
implemented, and institutionalised, a tax administration in their territory. One could
then ask, what kind of protection (or services) were provided by a rebel faction in
return for such tax collection? And did these payments really provide some insurance

17
to civilians against future negative outcomes? Civilians may indeed be ready to
contribute if they know that social or other services are provided by the collector. This
is particularly the case for collective goods such as security, schools, hospitals or
roads. Rarely, however, did the rebel factions have complete control over an extended
area for a prolonged time-period, say several years.ii As we described above, these
armed groups were mobile and moved the war theatre from province to province. As a
result, they did not invest much in taking over the role of the state in the provision of
collective goods such as health centres and schools. One obvious exception, however,
was the collection of taxes. In the areas where armed rebels were operating the
government of Burundi was unable to provide security to the civilians as the rebel
faction had broken the monopoly of violence. The ability to extort or tax civilians was
therefore in the hands of the rebel faction. As described in the work of Arjona
(reviewed earlier), while services were not provided, the rebels relied on the civilians
for medium term provision of funds, food and supplies. In return, the civilians were
not robbed from all of their belongings and were not attacked until the next round of
tax collection.
Before we develop our model, it is worth repeating our main research question: do
contributions of civilians to the rebel faction provide protection/insurance against
negative outcomes? In other words, when a civilian contributes in cash or in kind,
does that mean that he and his family will not fall victim to attacks, assaults, property
destruction, rape, torture or theft? We can broaden this question to welfare effects in
general: do civilian payments protect civilians from experiencing negative shocks on
household welfare? Moreover, does the institutional arrangement of the extortion
affect the outcome?

18
We end our description of the (absence of) rebel governance and taxation in Burundi
with the formulation of several hypotheses that will be directly tested with the data we
were able to collect.
Hypothesis 1: Extortion , on average, insures against negative downturns in
consumption welfare
Hypothesis 2: Extortion enables an improvement of welfare over time due to
the protection/insurance function.
Hypothesis 3: Regular, institutionalised payments lead to different outcomes
that irregular, ad hoc payments.
Hypothesis 4: Rebel groups target citizens for extortion depending on a range
of socio-economic factors.
Given the Burundi war context of high levels of violence, civil war and extortion we
would expect people to pay the extortion money (a tax) and for these people to have
better outcomes. In the Appendix we develop a simple model of extortion from the
viewpoint of a typical citizen confronted with a rebel faction. The model is based on
the perception of the citizen with regard to the efficiency of the rebel movement. If
the citizen believes his non-payment is unlikely to be detected, he will not pay the
tax.iii
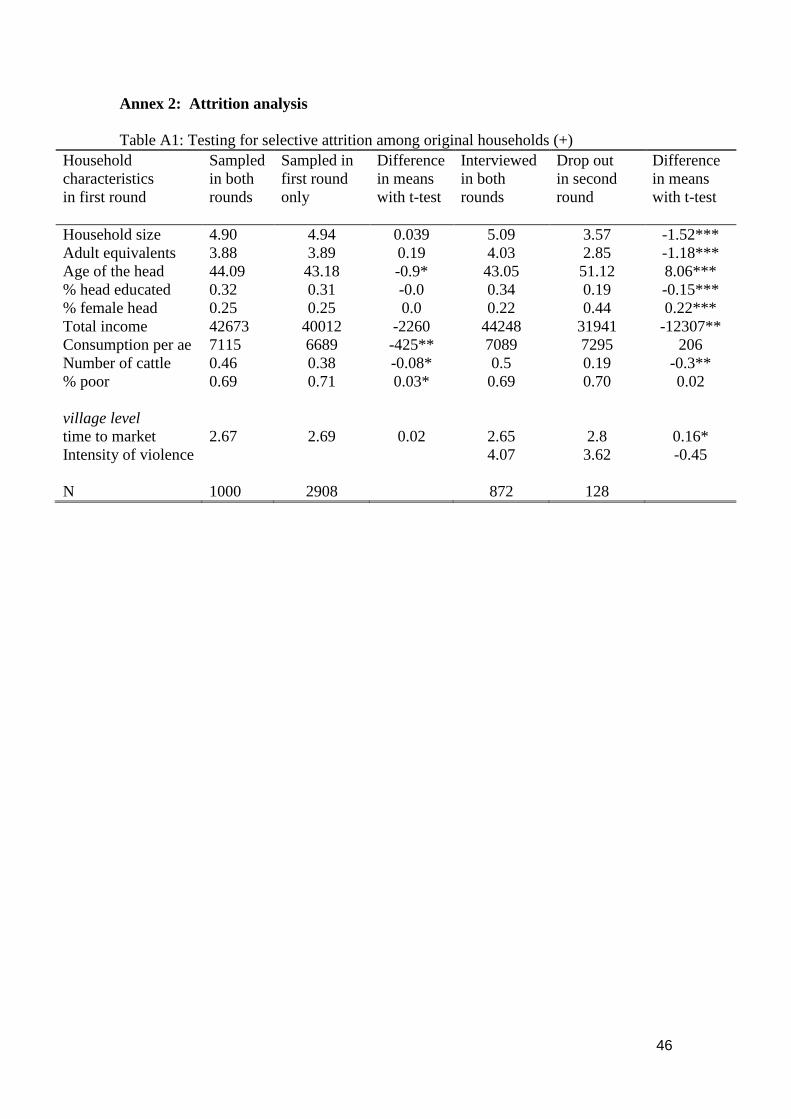
We face a selection problem if many people who didn’t pay the bribe were

19
killed in response to non-payment. The attrition analysis in the appendix show that
this is not a significant problem for our data analysis.
The Burundi Household Priority Survey 1998-2007
The data we use in this paper consist of a panel with two data points over nine years,
1998 and 2007.iv
In 1998, the World Bank and the Burundi Institute of Statistics and
Economic Studies (BISES) conducted a nationally representative general-purpose
household survey to analyse living standards. For this survey, 3908 rural households
were interviewed (Republic of Burundi, 1998). We designed the 2007 Priority Survey
(henceforth PS07) as a follow-up to the 1998 Priority Survey (henceforth PS98). Due
to budget limitations, it was impossible to try to track and re-survey all 3908 rural
households (391 survey sites) included in the PS98. Therefore, we decided to
randomly draw 100 of the 391 baseline sites with the purpose to track and re-survey
all 1000 original (1998) rural households in these sites.v We trained 65 interviewers
during a one-week training during which we improved the questionnaire. The
questionnaire was pilot tested in an out of sample village and final corrections were
made. The interviewers were instructed to track and re-interview, within each hill, the
10 original households. Overall we managed to locate and re-interview 874 of the
1000 selected households. The supervisor of each team of interviewers undertook a
community-level survey in which (s)he asked questions on infrastructure, history,
population, attacks and war-related violence.
In a module in the questionnaire on violence-related shocks and their consequences
for households and individuals we asked our interviewees if they had to perform
forced labour for the rebel movement and if they were asked to pay contributions to

20
the rebel movement. The latter are known in Burundi as ‘cotisation’ and can either be
in cash, in kind or by providing physical labour. If an interviewee told as that (s)he
had to perform physical labour we also asked him/her the number of times this
occurred between the first round of the survey (1998) and the second round (2007). If
the interviewee contributed in cash or in kind we asked for the total value (in
Burundese Franc) of his/her contributions over the 9 year period.vi
One limitation of
the data set is that we only have the number of times the person was extorted (as well
as the amount in the case of cash) but we do not have the exact timing of each act of
extortion.
Descriptive results
In this section we provide some data to illustrate the patterns of payment. As shown
in table 1 below, 70 per cent of the sample did not incur any type of extortion over the
9 year period (1998-2007). From the 30 percent who report having been extorted by
paying contributions in cash or through forced labour, 23 per cent of the sample had
made regular payment of cash to the rebel groups and 14 per cent had to provide
labour. 6.6 per cent had provided labour alone and around 16 per cent had provided
contributions in cash only. A substantially higher proportion of females reported no
extortion (81 per cent as opposed to 67 per cent of males).
< TABLE 1 ABOUT HERE >
For purposes of exposition and analysis we are interested in understanding the
insurance function of extortion, and in particular cash payments as opposed to non-
payment and forced labour extraction. We use cash payments to proxy for regular and

21
institutionalised ‘insurance’ extortion and forced labour to proxy for irregular and
unpredictable extortion. First we analyse whether extortion of any kind has a
significant and positive effect on welfare, as compared to non-payment. We then
disaggregate this analysis by the nature of payment. Table 2 below provides statistics
that allow us to compare the different characteristics of the groups that are extorted in
different ways.
< TABLE 2 ABOUT HERE>
The data provided in table 2 above give insight into the profiles of households that
paid some kind of extortion. In terms of the change in income/expenditures over the
ten year period (income_07- income_98), the unconditional mean shows that the
change has been positive for all categories except the labour only payment (col 7).
However, the change has been significantly larger for those being extorted (col 2),
versus those not being extorted (col 1). This may point to evidence of an insurance
function related to extortion. Disaggregated by extortion type we see that the positive
change is dominated by those households who have paid cash, not labour. In fact for
those household who have had labour forcibly extracted we see a negative change in
welfare (col 7). This also suggests that our hypotheses on regular and
‘institutionalised’ payments (hypothesis #3) are more likely to perform an insurance
function than random and unknown extraction of labour.
The data also suggest, as expected, that observable characteristics are likely to predict
extortion type. For instance, elderly people are less likely to be extorted on both
counts (cash and labour). Female headed households are less likely to have extortion

22
(81 per cent versus 67 per cent of male headed households). Education is not
obviously related to extortion. Higher levels of land, assets and enterprise ownership
are also correlated with extortion, providing support for the link between socio-
economic profile and extortion (Hypothesis #4).
Welfare results
In this section we use econometric methods to test whether extortion has
‘welfare’/protection effects as opposed to no extortion. We also test whether the type
of extortion matters for welfare outcomes (measured in terms of current consumption
and changes in consumption over the 9 year period). We first use a simple OLS linear
specification
ijjijijijij ZELnCLnC 98307_982981007 (1)
where C is the consumption in year 2007 or 1998 measured in adult equivalents for
person i residing on province j, E is a dummy variable capturing whether or not the
individual was extorted in the period between the two survey rounds (with different
dummy variables for each type of extortion), α2 our coefficient of interest, Z a vector
of individual, household and community level characteristics (age, sex and education
of the head of the household; three types of assets as well as the number of death and
wounded from violence), δ the province fixed effect and ε a random, idiosyncratic
error term.
The results are presented on table 3 below. We use changes in consumption per adult
equivalent between 1998 and 2007 as our dependent variable. We include

23
consumption at baseline, our extortion dummy variable and a set of characteristics as
in equation (1). Province level fixed effects are included in the specification. We
performed the same regression (results not shown) with consumption in 2007 as
dependent variable and reached the same results (apart from the coefficient on
consumption at baseline).
<TABLE 3: ABOUT HERE>
Three results from this regression, while not surprising by themselves, nevertheless
buttress the confidence we have in the quality of the data exactly because they
confirm what other researchers have found: (i) the coefficient of consumption at
baseline is negative and statistically significant at the 1% level, echoing the well-
know convergence result in other panel data studies; (ii) the effect of violence on a
consumption growth is negative and statistically significant at the 5% level and (iii)
the effect of education is positive and statistically significant at the 1 or 5% level
depending on specification. These established results may give some confidence to
the other results obtained in table, most notable the coefficient of interest, α2 , on the
variable extortion, which is positive and statistically significant in three of the
regressions, always involving cash payments. Also notice the positive effects of age at
baseline and of having a female head of the household at baseline on changes in
consumption over the conflict period. Higher initial asset holdings also predicts
positive and significant changes in welfare.
The welfare results derived from an OLS estimation only make sense in absence of
selection bias. It is, however, unlikely that the latter is absent. More specifically, the

24
rebel groups may know whom they have to extort/tax because there may be some
observable indicators of wealth, such as doing business of asset holdings. This means
that it is necessary to deal with potential selection effects in our welfare estimation.
We do that by first performing a probit analysis to explain the determinants of forced
contributions, for cash as well as for labour and subsequently employ matching
methods to estimate the effect on welfare.
The matching approach originated from the statistical literature and shows a close link
to the experimental context. Its basic idea is to find in a large enough group of non-
participants who are similar to the participants in all relevant pre-treatment
characteristics X. That being done, differences in outcomes between this control group
and those of the participants can be attributed to the ‘treatment’, in our case the
extortion (we refer to Caliendo and Kopeinig, 2005 for full treatment of this method).
Since conditioning on all relevant covariates is limited in the case of a high
dimensional vector X, Rosenbaum and Rubin (1983) suggest the use of balancing
scores b(X), i.e. functions of the relevant observed covariates X such that the
conditional distribution of X given b(X) is independent of assignment into treatment.
One possible balancing score is the propensity score, i.e. the probability of
participating in a programme given observed characteristics X, which we will use.
In our particular case, propensity score matching (PSM) involves estimating a binary
treatment model (in out case a probit model) that predicts the probability of each
household being targeted for one of five types of extortion as a function of observed
characteristics. The variables included in the analysis are those that influence
simultaneously whether a household in involved in extortion and the outcome of

25
interest which is increased income. We use Stata command pscore to identify the
matching in the results below.
The results of a probit extortion model are shown in table 4 (province fixed effects
were used but for presentational purposes are not reported here). Younger people are
significantly more likely to be extorted under any form older people. Males are
significantly more likely to be extorted under all categories except for cash only than
females. Education does not predict probability of extortion. In this way, observable
characteristics of individuals and households predict extortion. This makes sense, as
it is often a series of observable characteristics that rebels use as a means of targeting
people for purposes of extortion. Looking at the enterprise variable we see that those
households owning an enterprise in 1998, they were significantly likely to be targeted
for cash extortion than those with no business enterprise. Enterprise ownership does
not predict labour extortion (again supporting hypothesis #4).
<TABLE 4 ABOUT HERE >
The negative effect of consumption on the probability of being extorted is surprising,
even after controlling for enterprise ownership and other characteristics. We expected
a positive sign here. It may be an indication that the rebels operate in a similar way as
the Chicago mafia in taxing the production of pasta, to wit taxation not based on the
consumption of the factory owner but on his production, production capacity or his
assets. It could also mean that poor people are targeted because they are easier to
extort, with low levels of consumption signalling powerlessness.

26
The effect of violence varies depending on the type of extortion: households residing
in areas of high violence are significantly more likely to have cash extortion than
households in less violent areas. Labour extortion is not related to the level of
violence in the area, implying that households in any area is equally likely to have
labour extorted.. We are not able to distinguish the chronology of taxation and
violence as we do not know which came first. Note however that most of the violence
in our dataset occurred in the first few years (1999, 2000, 2001) of the period under
study, making it unlikely that taxation preceded or indeed explains the occurrence of
violence. Violence and taxation are consistently and positively correlated across the
five regressions.
Moving to the results of the matching methods we first need to test the probit model
specification for equality of the mean and standard deviation of the observed
characteristics across extorted and non-extorted households. The test is called the
balancing propensity tests (Rosenbaum and Rubin 1983; Heckman et al. 1997;
Dehejia and Wahba, 2002). The next step in the PSM involves testing the ‘match’.
This means using the propensity scores estimated in the first instance to identify the
non-extorted that compares to the extorted (ie, with the closest propensity score
values) using the ‘nearest neighbour’ algorithm. If a matched sample can be obtained
then it is possible to estimate the impact of extortion/taxation on the household’s
income (welfare).
Our results indicate that the balancing property is satisfied for all five model
specifications for the extorted versus non-extorted. The number of households in each
of the 6 blocks of the propensity score is shown in the Appendix. So, for instance, for

27
the first model – any extortion versus non extortion—we see that for the lower bound
of the propensity score (0 probability of being selected into extortion) we have
households that are comparable and whose characteristics satisfy the balancing
property – 207 non-extorted directly comparable to 21 extorted -- and so on. This
comparability is confirmed by looking at the distribution of the propensity score
according to extorted and non-extorted households (see figures in annex). Again, for
the first model, for households who are extorted we can see that the propensity score
distribution is more of a normal curve than for the non-extorted, however there is
substantial overlap implying that there is an adequate common support to enable us to
predict the effect of extortion on welfare using matching methods.
< TABLE 5 ABOUT HERE >
Using matching methods, Table 5 presents the effect of extortion in the 1998-2007
period on welfare in 2007, taking account of the selection effect considered above. As
in the case of the OLS estimation we find that extortion has a positive and statistically
significant effect on welfare, suggesting an insurance or even welfare improving role
of cash payments (supporting hypotheses #1 and #2). Having cash extorted by the
rebel group is associated with an increase of between 16 and 25% in adult equivalent
consumption depending on specification. On the other hand, extortion under the form
of forced labour contributions does not have any effect on future welfare.
Robustness Analysis
Unobservables

28
One may be concerned that selection into extortion is driven by unobservables. In
that case the extortion variable in the welfare analysis partly captures such effect.
In order to address this concern we apply a method proposed by E.Oyster (2013,
NBER and University of Chicago). She writes that we can learn something about
the effect of unobservables on the coefficients of interest when looking at the
inclusion of additional observables combined with the movement of the R2. This
is the case under the assumption that selection on observables is proportional to
selection on unobservables.
Oyster (2013) wrote a STATA command ‘psacalc’ (proportional selection
assumption) to calculate delta (δ), the degree of proportionality between the observed
and the unobserved variables. If delta=1 this means that the observed and the
unobserved have an equally important effect on the coefficient of interest. We
compare the coefficient of our extortion variable in a model with and without
observables and calculate the delta. With one more more assumption to make, on the
maximum value of R, we can compute B*, which is the value of our coefficient of
interest corrected for bias attributable to the unobervables.
In a regression without observables, B=0.13 and R2=0.003
In a regression with observables, B=0.16 and R2=0.32
The psacalc command allows us to calculate delta in this instance, and we find δ=0.4.
This already indicates hat the unobservables have less effect on our coefficient of
interest than the observables. From this we can calculate B* using the formula in
Oyster(2013, p.9)
RR
RR
~
~~~
* max

29
Whereby B’ and R’ stand for the coefficient and the R2 from the regression without
observables and β~ and R~ for those of the regression with observables.
Implementing this formula for our data yields a B*=0.175 with Rmax=0.7 and
B*=0.185 with Rmax=1. These are both very reasonable coefficients whose magnitude
is not far from our base result (0.16) and which is a bit lower (but certainly in the
reasonable ranch) of our matching result. Even with delta=1 and Rmax=1, B* would be
0.22, still in the reasonable ranch.
Growth at the province level
One could be concerned that province level growth trajectories may be responsible
for the observed effect, rather than the extortion mechanism. We test this possibility
by including province level growth rather than province fixed effects in our analysis.
We first remark that over our entire sample, growth of household level consumption is
negative, from 8.63 (in logarithms) to 8.52. This is a first indication that there has not
been post-conflict growth in Burundi at the time of the survey (2007). In effect,
growth is negative in 6 out of the 12 provinces in our sample.
When we include province level growth as a regressor in stead of province fixed
effects, the coefficient of the extortion variable increases from 0.16 to 0.18 (for any
extortion) and from 0.25 to 0.26 (any cash). The coefficient of household
consumption at baseline increases from -0.75 to -0.63. This means that province level
growth trajectories cannot account for the effect we observe on extortion. Since they
are much more specific in the effect they capture compared to the province fixed
effect, these growth trajectories reduce the effect of household consumption at
baseline somewhat, which is entirely plausible.

30
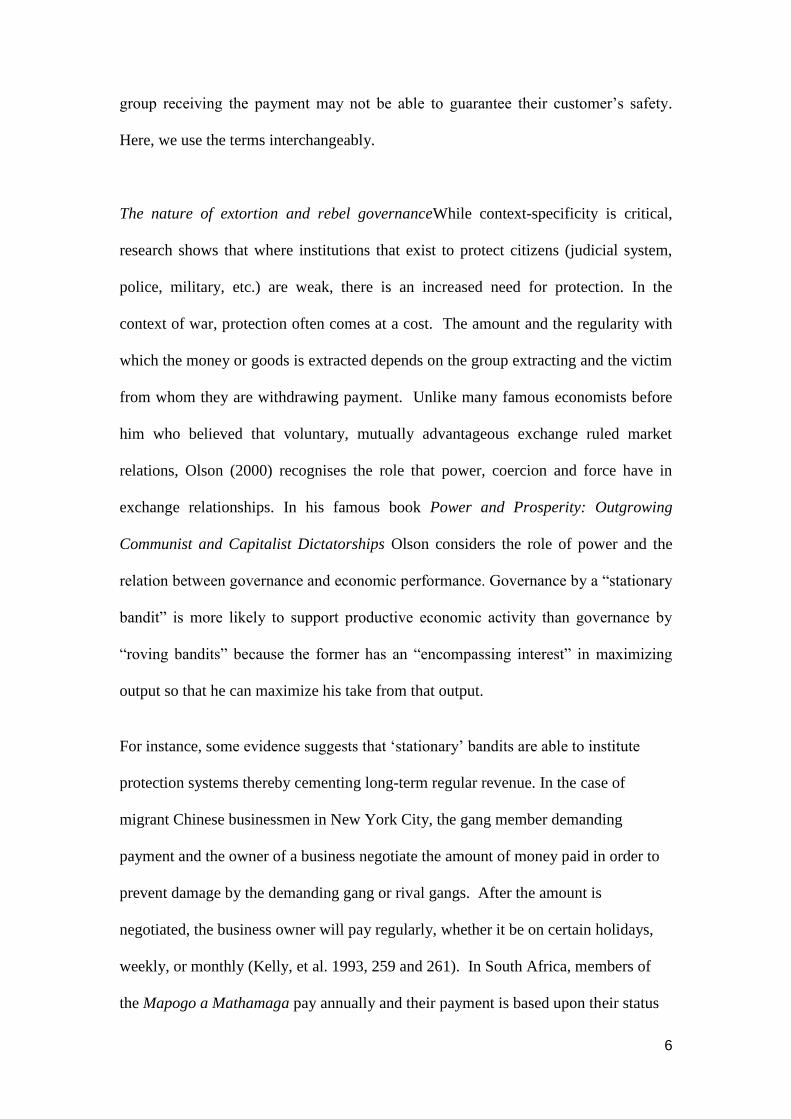
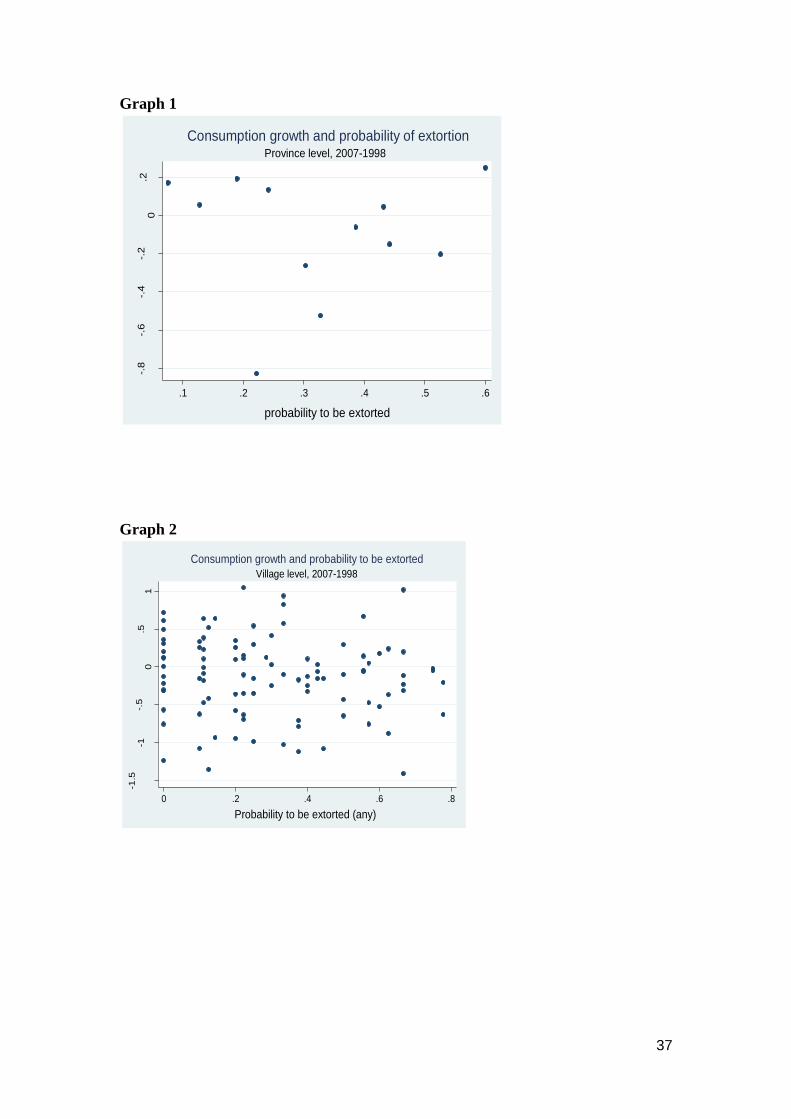
An additional concern may be that the extortion variable is picking up effects of
economic recovery if regions with higher recovery concide with regions with more
extortion. Below we present a graph that plots the province level growth 2007-1998
against the probability to be extorted (any extortion). It can be seen visually that there
is no relationship. We also computed the Pearson correlation coefficient, which is
0.01 and which is not statistically significant using the usual thresholds. For
completeness we have performed the same analysis at the village level and we found a
correlation of -0.09 whih was not statistically significant either at the usual thresholds.
Graphs 1 and 2 show the scatterplot and one can visually observe the absence of a
relationship.
<Graph 1 and Graph 2 about here>
Pre-1998 violence and convergence
Households affected by pre-1998 violence (captured by the number of death and
wounded in their village from 1993 to 1998) have lower consumption at baseline
(1998) than non-affected households. See table 6. This could indicate that this lower
consumption is the result of pre-survey violence, after which a recovery to pre-war
levels could follow (convergence) that is not related with extortion. We notice that
consumption at endline (2007) is also lower in the areas affected by pre-1998
violence. The reduction in consumption in 2007 in the pre-1998 affected areas is less
than in the non-affected areas, hence the effect is less negative, but the difference
between the two (Difference in Differences) is not statistically significant at the usual

31
thresholds. Hence this cannot account for the positive effects we observe from the
extortion variable.
<Table 6 about here>
In order to verify if the result can be explained by post-war growth or convergence,
we show an additional table with four groups of households: (1) those not affected by
extortion (household level), nor by civil war (village level death and wounded 1993-
1998); (2) affected by extortion (any type), but not by civil war violence; (3) not
extorted but affected by village level violence and (4) affected by both. Table 2 below
shows the welfare change in the four groups. Only group (2), the extorted group, has
seen its welfare increase, while the three other groups saw their welfare decrease.
<Table 7 about here>
Stability
One may be concerned that is it stability rahter than extortion in rebel held areas that
explains our result. If we proxy stability by the absence of deaths and wounded from
civil war (which is the violence variable in our paper) than we already control for the
effect of stability in our analysis. Stability indeed has a positive effect on consumption
growth, but it does not capture or diminish the effect of extortion.
Conclusions
This is an empirical paper that allows us to test for the linkage between taxation in the
form of extortion payments in a war context and household welfare outcomes, as well

32
as the nature of the payments in relation to outcomes. We show that a person’s socio-
economic profile determines his/her likelihood to fall victim to one or another type of
rebel taxation. We also find that payments in the form of cash (a regular,
institutionalised form of payment which we use as a proxy for ‘stationary rebels’)
increase household welfare by between 16 and 25 %. Extortion in the form of labour
(a proxy for ad hoc payments and ‘roving rebels’) does not have a welfare enhancing
effect. These findings tell a story about rebel governance in times of conflict,
suggesting that where rebels have some legitimacy and rebel taxation is
institutionalised within the governance structures, civilian populations may be
provided with extra-legal security that can ultimately enhance their welfare. Whether
their welfare would have improved in the absence of conflict is not something that we
can test here. Conflict is not an RCT ! Group 1 in table 7 however shows that
conditions in Burundi deteriorated over time, even for those not affected by conflict or
extortionIt is clear that relationships between extra-legal actors and civilians in times
of war may actually be mutually beneficial: a results that supports Arjona’s
conclusions. Our results suggest that the extent of institutionalisation of the extortion
appears to be critical in obtaining a positive result. Regular and predictable extortion
are more likely to insure positive outcomes than unpredictable extortion, which, on
average, has a welfare reducing outcome.
The work by Sanin and Baron, and Olson (reviewed in the introduction) resonates
with what we see in the Burundi case above, where rebels use cash-and-receipt
taxation to securitize welfare of the citizens, however, ad hoc labour extraction
remains punitive and coercive, with no welfare or security outcomes. The findings
presented here also speak to Arjona’s (2008) theory of local orders within the context

33
of civil war. She highlights the multiple strategies that armed groups can opt in
establishing social order during and after civil war. These are coercion (corresponding
the exclusive use of violence and lack of rule), minimal (regulates violence and secure
basic resources but stays out of civilian affairs), indirect (rules civilian affairs by
proxy) and comprehensive (overtly regulates civilian affairs, such as public goods,
religion). The cash-and-receipt security payment system used in Burundi corresponds
largely to the minimal rebel strategy to promote social order, whereas the labour
extraction corresponds to that of coercion. Within the Burundi civil war context , due
to the fragmented and geographically dislocated nature of war, disparate rebel
movements found it difficult to use indirect and comprehensive strategies to establish
order. Our works illustrates the co-dependence of the civilian population and the
rebel movement, but fundamentally it shows how institutionalized forms of
criminality have better outcomes for victims of extortion in terms of security and
welfare than simple punitive, ad hoc, strategies.
34
Bibliography
Arjona, A. (2008) One National War, Multiple Local Orders:An Inquiry Into The Unit
Of Analysis Of War And Post-War Interventions, FICJC Publications No. 2
Anderson, D.M. (2002) Vigilantes, Violence and the Politics of Public Order in
Kenya. African Affairs 101. pp. 531-555
Beneduce, R.; Jourdan, L.; Raeymaekers, T.; Vlassenroot, K. (2006) Violence with a
purpose: exploring the functions and meaning of violence in the Democratic
Republic of Congo. Intervention, the International Journal of Mental Health,
Psychosocial Work and Counseling in Areas of Armed Conflict, Vol. 4(1). pp.
32-46
Ellis, S. (1995) Liberia 1989-1994: A Study of Ethnic and Spiritual Violence.
African Affairs, Vol. 94. pp. 165-197.
Etkes, H. (2007) Legalizing Extortion: An Economic Analysis of State Regulated
“Protection Payments” made to Tribes in Ottoman Gaza (1519-1582).
Frye, T. (2002) Private Protection in Russia and Poland. American Journal of
Political Science, Vol. 46(3). pp. 572-584.
Gambetta, D. (1993) The Sicilian Mafia: The Business of Private Protection.
London: Harvard University Press.
Jaspars, S.; O’Callaghan, S.; and Stites, E. (2007) Linking Livelihoods and
Protection: A Preliminary Analysis Based on a Review of the Literature and
Agency Practice. Humanitarian Policy Group Working Paper.
Jaspars, S. and O’Callaghan, S. (2008) Challenging Choices: Protection and
Livelihoods in Darfur: A Review of the Danish Refugee Council’s Programme
in West Darfur. Humanitarian Policy Group Working Paper.

35
Kahn, C. (2008) Conflict, Arms, and Militarization: The Dynamics of Darfur’s IDP
Camps. Small Arms Survey, Graduate Institution of International and
Development Studies: Geneva.
Kelly, R.J.; Chin, K-L.; and Fagan, J. (1993) The dragon breathes fires: Chinese
organization crime in New York City. Crime, Law and Social Change, Vol
19. pp. 245-269.
Konrad, K.A. and Skaperdas, S. (1997) Credible Threats in Extortion. Journal of
Economic Behavior and Organization, Vol. 33. pp. 23-39.
Konrad, K. and Skaperdas, S. (1998) Extortion. Economica, New Series, Vol.
65(26). pp. 21-53.
Lotspeich, R. (1997) Extortion and Market Development: An Economic Analysis of
Extortion in Russia. MOCT-MOST: Economic Policy in Transitional
Economies, Vol. 7(4). pp. 21-53.
Lynn, J.A. (1993) How War Fed War: The Tax of Violence and Contributions during
the Grand Siècle. The Journal of Modern History, Vol. 65(2). pp. 286-310.
Mason, T.D. and Campany, C. (1995) Guerrillas, drugs and peasants: The rational
peasant and the war on drugs in Peru. Terrorism and Political Violence, Vol.
7(4). pp. 140-170.
Mehlum, H.; Moene, K.O.; Torvik, R. (2002) Plunder & Protection Inc. Journal of
Peace Research, Vol. 39(4), Special Issue on Civil War in Developing
Countries. Pp. 447-459.
Olson, Mancur, (1993) ‘Dictatorship, Democracy, and Development’, The American
Political Science Review, 87:3 (1993), pp.567-576

36
Oster, Emily. (2013) "Unobservable Selection and Coefficient Stability: Theory and
Validation." NBER Working Paper, No. 19054.
Raeymaekers, T. (2010 forthcoming) Protection for Sale? War and the
Transformation of Regulation on the Congo‐Ugandan Border. Development
and Change.
Sanín, F.G., and M. Barón (2005) Re-Stating The State: Paramilitary Territorial
Control And Political Order In Colombia, (1978-2004), Working Paper No.
66, Crisis States Programme, LSE
Smith, A. and Varese, F. (2001) Payment, Protection and Punishment: The Role of
Information and Reputation in the Mafia. Rationality and Society, Vol. 13(3).
pp. 349-393.
Tilly, C. (1985) War Making and State Making as Organized Crime. In Evans, P.B.;
Rueschemeyer, D.; and Skocpol, T. (Eds.), Bring the State Back In. pp. 169-
191. Cambridge: Cambridge University Press.
Vinci, A. (2006) An Analysis and Comparison of Armed Groups in Somalia.
Institute for Security Studies, African Security Review, Vol. 15(1)
von Schnitzler, A; Ditlhage, G.; Kgalema, L.; Maepa, T.; Mofokeng, T.; and Pigous,
P. (2001) Guardian or Gangster? Mapogo a Mathamaga: A case study.
Violence and Transition Series, Vol 3.
Williams, P. (2009a) Criminals, Militias, and Insurgents: Organized Crime in Iraq.
Strategic Studies Institute.
Williams, P. (2009b) Illicit markets, weak states and violence: Iraq and Mexico.
Crime Law soc Change, Vol. 52. pp. 323-336.
37
Graph 1
-.8
-.6
-.4
-.2
0.2
pro
vin
ce
le
ve
l g
row
th o
f co
nsu
mp
tio
n
.1 .2 .3 .4 .5 .6
probability to be extorted
Province level, 2007-1998
Consumption growth and probability of extortion
Graph 2
-1.5
-1-.
50
.51
villa
ge
le
ve
l co
nsu
mp
tio
n g
row
th
0 .2 .4 .6 .8
Probability to be extorted (any)
Village level, 2007-1998
Consumption growth and probability to be extorted

38
Table 1: Type of extortion by gender of household head (sample size and mean)
Nature of extortion Male Female Total
1 No extortion 450 157 607
66.57 81.35 70.07
2 Any Extortion
(cash or labour) 226 36 260
33.43 18.65 29.93
Total 676 193 869
3 Any Cashvii
173 29 202
27.77 15.29 24.97
4 Any Labour 114 11 125
20.21 6.55 17.08
5 Only Cash 112 25 137
19.93 13.74 18.41
6 Only Labour 53 7 60
10.46 4.27 9.0

39
Table 2: Characteristics of different groups
1 2 4 5 6 7
(no
extort)
(any
extort)
(any
Cash)
(any
Lab)
(only_
cash)
(only_
lab)
Income 98 7284 6618 6538 6241 6962 6887
Income 07 8019 8066 8714 7547 8539 5883
HH_size_98 5.05 5.22 5.21 5.36 5.09 5.12
HH_size_07 5.45 5.93 5.83 6.29 5.60 6.19
Age 98 44.47 39.24 40.07 37.7 40.61 36.16
Female head 81.3 18.65 15.03 6.05 12.95 3.03
Male head 66.57 33.43 25.59 20.1 16.57 7.84
Educ_98 0.34 0.34 0.34 0.37 0.32 0.37
Enterprise98 0.14 0.20 0.23 0.18 0.23 0.16
Livestock98 0.66 0.58 0.65 0.55 0.70 0.67
Asset_98 0.57 0.70 0.65 0.69 0.71 0.45
Land _98 0.49 0.54 0.53 0.59 0.51 0.61
Land _07 0.46 0.59 0.51 0.60 0.47 0.63
Deaths/w_98 67.12 66.91 60.81 68.12 57.96 56.96
Deaths/w 07 1.94 6.17 4.73 6.19 4.06 5.67
Torture 0.07 0.48 0.32 0.51 0.24 0.30
Prison 0.09 0.15 0.15 0.19 0.12 0.16
handicapped 0.08 0.09 0.08 0.10 0.07 0.09

40
Table 3: OLS estimation results for the effects of different extortion types on
changes in welfare 2007-1998
Extortion
type
1
(any)
2
(any cash)
3
(any lab)
4
(only_cash)
5
(only_lab)
ln98 -0.75*** -0.76*** -0.76*** -0.74*** -0.74***
(0.05) (0.06) (0.06) (0.06) (0.06)
Extortion 0.16** 0.25*** 0.09 0.25*** -0.11
(0.07) (0.08) (0.09) (0.087) (0.11)
sex98 0.22** 0.21** 0.27** 0.19* 0.24**
(0.09) (0.09) (0.10) (0.09) (0.10)
age98 0.005** 0.005** 0.005** 0.006*** 0.005**
(0.002) (0.002) (0.002) (0.002) (0.002)
Educ Head 0.18*** 0.19*** 0.16** 0.20*** 0.16**
(0.06) (0.07) (0.07) (0.08) (0.08)
Enterpr98 -0.04 -0.09 -0.02 -0.16 -0.11
(0.09) (0.09) (0.10) (0.10) (0.10)
ln_livestock98 0.014* 0.013* 0.015* 0.014 0.015*
(0.007) (0.008) (0.008) (0.008) (0.008)
asset1998 0.14*** 0.16*** 0.15*** 0.14*** 0.13***
(0.03) (0.028) (0.032) (0.03) (0.03)
violence98_07 -0.005** -0.005** -0.006** -0.007** -0.009***
(0.002) (0.002) (0.003) (0.003) (0.003)
Constant 6.30*** 6.39*** 6.41*** 6.20*** 6.23***
(0.52) (0.54) (0.55) (0.57) (0.59)
Province FE Yes Yes Yes Yes Yes
N 867 807 730 742 665
R-squared 0.32 0.32 0.31 0.32 0.31
Robust standard errors in parentheses: *** p<0.01, ** p<0.05, * p<0.1

41
Table 4: Probit estimation of the determinants of extortion
(1) (2) (3) (4) (5)
Variable (any) (and cash) (any lab) (only cash) (only lab)
ln98 -0.058** -0.055*** -0.040** -0.018** -0.007
(0.023) (0.021) (0.018) (0.009) (0.013)
sex98 -0.108*** -0.082** -0.103*** -0.010 -0.038**
(0.039) (0.037) (0.026) (0.020) (0.017)
age98 -0.005*** -0.003*** -0.004*** -0.001*** -0.003***
(0.001) (0.001) (0.001) (0.000) (0.001)
Educchef -0.013 -0.018 0.009 -0.015 0.008
(0.034) (0.031) (0.027) (0.016) (0.018)
enterpr98 0.064 0.080** 0.010 0.045* -0.013
(0.041) (0.041) (0.031) (0.025) (0.020)
ln_live 0.004 0.004 -0.000 0.003* -0.000
(0.003) (0.003) (0.002) (0.002) (0.002)
asset1998 0.012 0.010 0.006 0.005 0.001
(0.014) (0.013) (0.012) (0.006) (0.008)
dw98_07 0.003** 0.004** 0.001 0.003** 0.001
(0.001) (0.002) (0.001) (0.001) (0.001)
Obs 867 807 730 742 638
Robust standard errors in parentheses: *** p<0.01, ** p<0.05, * p<0.1

42
Table 5: ATT results from matching methods
Extortion
type
(1)
(any)
(2)
(any cash)
(3)
(any lab)
(4)
(only cash)
(5)
(only lab)
OLS 0.16** 0.25*** 0.09 0.25*** -0.11
(0.07) (0.08) (0.08) (0.09) (0.10)
Matching 0.14* 0.23*** 0.004 0.25*** -0.14
(0.08) (0.08) (0.09) (0.11) (0.13)
Robust standard errors in parentheses: *** p<0.01, ** p<0.05, * p<0.1

43
Table 6: pre-1998 violence and consumption growth
Pre-1998 violence Consumption 1998 Consumption 2007 Diff
Yes 8.53 8.44 -0.09
No 8.76 8.62 -0.14
0.23*** 0.18*** 0.05
Table 7: Extortion, Violence and consumption growth: 4 groups
Group Consumption 1998 Consumption 2007 Diff
No extortion, no violence 8.68 8.55 -0.13
Extorted, no violence 8.57 8.60 +0.03
No extortion, violence 8.51 8.24 -0.27
Extortion, violence 8.58 8.44 -0.14
44
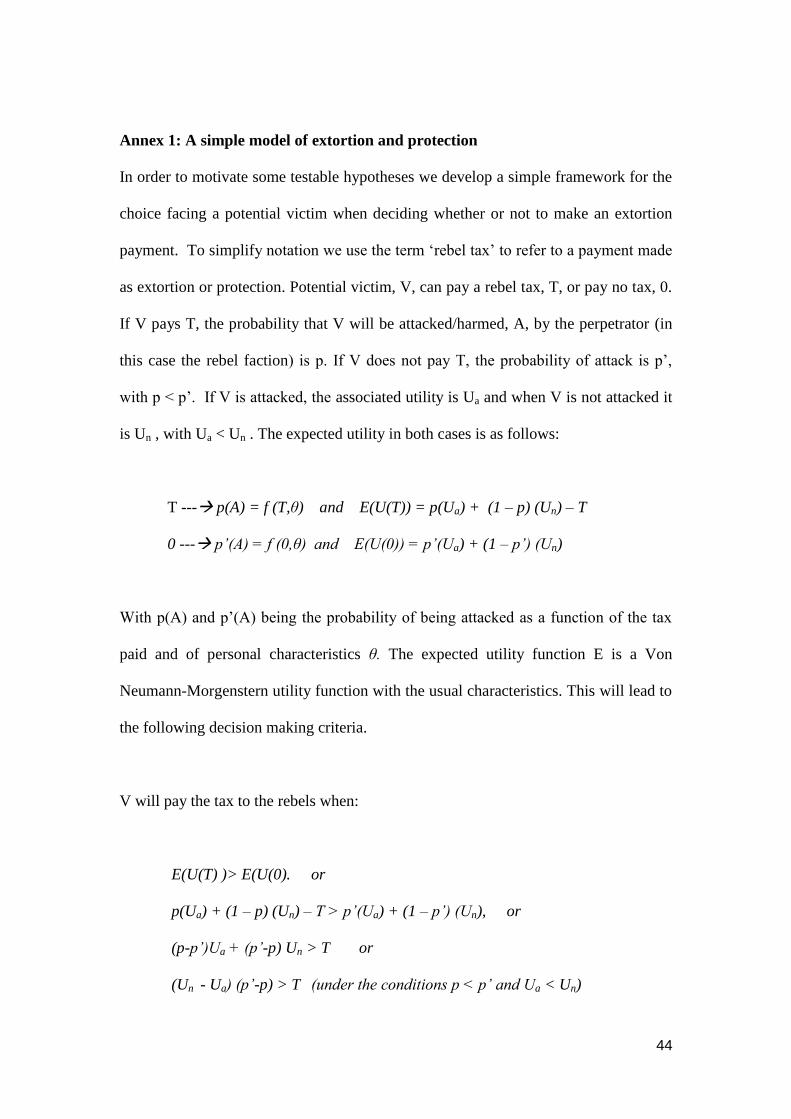
Annex 1: A simple model of extortion and protection
In order to motivate some testable hypotheses we develop a simple framework for the
choice facing a potential victim when deciding whether or not to make an extortion
payment. To simplify notation we use the term ‘rebel tax’ to refer to a payment made
as extortion or protection. Potential victim, V, can pay a rebel tax, T, or pay no tax, 0.
If V pays T, the probability that V will be attacked/harmed, A, by the perpetrator (in
this case the rebel faction) is p. If V does not pay T, the probability of attack is p’,
with p < p’. If V is attacked, the associated utility is Ua and when V is not attacked it
is Un , with Ua < Un . The expected utility in both cases is as follows:
T --- p(A) = f (T,θ) and E(U(T)) = p(Ua) + (1 – p) (Un) – T
0 --- p’(A) = f (0,θ) and E(U(0)) = p’(Ua) + (1 – p’) (Un)
With p(A) and p’(A) being the probability of being attacked as a function of the tax
paid and of personal characteristics θ. The expected utility function E is a Von
Neumann-Morgenstern utility function with the usual characteristics. This will lead to
the following decision making criteria.
V will pay the tax to the rebels when:
E(U(T) )> E(U(0). or
p(Ua) + (1 – p) (Un) – T > p’(Ua) + (1 – p’) (Un), or
(p-p’)Ua + (p’-p) Un > T or
(Un - Ua) (p’-p) > T (under the conditions p < p’ and Ua < Un)

45
Implying that V will pay the tax when the utility loss in the event of an attack is high
(Ua is small) and when the probability of being attacked in the case of not paying is
high. When the probability of being attacked, given no payment (p’) approaches
certainty and the utility after an attack is close to zero (V may even be killed) then V
will pay the tax as long as it is smaller than Un.viii
The hypotheses that fall out from
this model are:
Hypothesis 1: the higher the loss of utility from an attack, the higher the
probability that I will pay the tax
Hypothesis 2: the higher the probability of being attacked in the event of not
paying, the more likely I will pay
Both of these hypotheses have to do with perceptions, the first has mainly to do with
the perception a victim has of their own potential loss, probably linked to their asset
and income level; the second is mainly linked to the victim’s perception of the
efficiency of the rebel movement to detect non-contributors. We cannot test these
hypotheses directly, as we have no data on these perceptions. With the above model in
mind as well as the context of Burundi outlined in the preceding section we can
develop some testable hypotheses below. While these testable hypotheses are not
mathematically derived from the theoretical model, they demonstrate the same
reasoning as the one exhibited in the model.
46
Annex 2: Attrition analysis
Table A1: Testing for selective attrition among original households (+)
Household
characteristics
in first round
Sampled
in both
rounds
Sampled in
first round
only
Difference
in means
with t-test
Interviewed
in both
rounds
Drop out
in second
round
Difference
in means
with t-test
Household size
Adult equivalents
Age of the head
% head educated
% female head
Total income
Consumption per ae
Number of cattle
% poor
village level
time to market
Intensity of violence
N
4.90
3.88
44.09
0.32
0.25
42673
7115
0.46
0.69
2.67
1000
4.94
3.89
43.18
0.31
0.25
40012
6689
0.38
0.71
2.69
2908
0.039
0.19
-0.9*
-0.0
0.0
-2260
-425**
-0.08*
0.03*
0.02
5.09
4.03
43.05
0.34
0.22
44248
7089
0.5
0.69
2.65
4.07
872
3.57
2.85
51.12
0.19
0.44
31941
7295
0.19
0.70
2.8
3.62
128
-1.52***
-1.18***
8.06***
-0.15***
0.22***
-12307**
206
-0.3**
0.02
0.16*
-0.45

47
Table A2: Probit models testing for selective attrition, using FGM method (+)
Household
characteristics
in first round
Sampled in
both rounds
(1)
Sampled in
both rounds
(2)
Interviewed in
both rounds
(3)
Interviewed in
both rounds
(4)
Household size
Age of the head
head educated
female head
Log total income
Number of cattle
Village level
time to market
Intensity of violence
constant
Province FE
N
-0.01
0.002
0.016
-0.001
0.036
0.018
-0.012
-1.05***
No
3908
-0.013
0.002*
0.007
-0.008
0.054*
0.025
-0.011
-6.59
Yes
3908
0.129***
-0.01***
0.167
-0.287**
0.036
0.09
-0.054
0.001
0.56
No
1000
0.126***
-0.01***
0.177
-0.346**
0.069
0.08*
-0.054
-0.001
0.68
Yes
1000
(+) Source : Burundi Priority Household Survey 1998 and 2007. The consumption data of two
tracked households were found to be unusable. Probit specifications where the selection variable is 1
for selection into the sample or the interview and 0 otherwise. All models are clustered around
survey cites to obtain robust standard errors; Fitzgerald, Gottschalk and Moffitt (1998).
Analysis of attrition in the sample
In the 2007 survey, we managed to track and re-interview 87.4% of the original
households and 82% of all individuals interviewed in 1998. These are reasonable
figures after a period of 9 years in between the survey rounds, a period characterised
by civil war. Well-known panels in developing countries such as the Kenya Life Panel
Survey 1998-2003/2005 (84%), the Indonesian Family Life Survey 1993,1998, 2000
(88%); and the KwaZulu-Natal Income Dynamics Study 1993-1998 (84%) have
similar attrition rates. Baird, Hamory and Miguel (2008) signal the lower re-contact
rates for panels who do not track individual members who moved between survey
rounds.

48
For 113 of the 126 of the drop out households we were able to find out the reason why
they dropped out, by asking neighbours and village authorities about their
whereabouts. The drop outs in the second round can be divided into four groups: (1)
all original household members deceased (24.8%). This mostly concerns small
households with old members, (2) the household moved to another place, but we were
unable to find where (22.1%), (3) the household disappeared all of a sudden and
nobody knows its current whereabouts (21.2%) or (4) the household dissolved
(31.9%), mostly parents deceased and children went their own way.
This kind of drop out is not different from drop out in other panel surveys. It is
important is to find out whether or not the drop out households differ from the tracked
households, which would bias subsequent estimation results. In Appendix 1 we
explore potential selection bias in two ways. First, we examine mean differences on
observables between tracked and drop out households and second we perform a probit
analysis of attrition similar to Fitzgerald, Gottschalk, and Moffit (1998). We find that
drop out households were on average smaller, were more likely to have an older,
female or less educated head of the household and had lower total income and less
cattle. In terms of poverty, measured as consumption per adult equivalent, the drop
outs do not differ from the tracked households. We do not observe a difference for the
intensity of violence, measured as the number of deaths and wounded at the village
level. The drop out households did have a slightly worse access to markets in 1998.
The fact that the violence in the civil war did not influence, or jeopardize, our tracking
of households is an important finding in itself. It means that panel surveys can be
conducted safely and with low drop-out rates in a war-affected country, with selection
effects not different from those in other panel surveys and with no selection, at least

49
not in our Burundi sample, on violence in civil war. Furthermore, it implies that the
possible real selection bias that could be attributed to the fact that those who do not
pay rebel tax are killed and therefore not in our sample, is not a significant problem
for our data.
None of our information pointed to the practice of extortion as a reason to leave the
area and hence be out of reach of our interviewers. We also included a formal test to
demonstrate that extortion is not correlated with attrition in our sample. We compute
the Pearson correlation coefficient of the probability to be extorted at the village level
(aggregated from household data) and the village level re-interview rate. The
coefficient is 0.09 and not statistically significant at the usual thresholds. Graph A
allows one to observe that there is no relationship between the two. We have included
this in the annex on attrition in the revised version of the paper.
Graph A
0.2
.4.6
.8
Pro
ba
bili
ty t
o
be
exto
rte
d (
an
y)
at
vill
ag
e le
ve
l
0 10 20 30 40 50
% of households not re-interviewed at village level
Attrition and Probability to be extorted (any) at village level, N=100

50
Annex 3:
Total 610 262 872 .8333333 0 1 1 .6666667 10 20 30 .5 45 64 109 .3333333 112 81 193 .1666667 236 75 311 0 207 21 228 of pscore 0 1 Total of block extort_any Inferior
and the number of controls for each block This table shows the inferior bound, the number of treated
The balancing property is satisfied
Total 610 202 812 .6666667 3 4 7 .5 34 43 77 .3333333 69 56 125 .1666667 245 76 321 0 259 23 282 of pscore 0 1 Total of block extort_cash_any Inferior
and the number of controls for each block This table shows the inferior bound, the number of treated
The balancing property is satisfied
Total 610 125 735 .6666667 2 1 3 .5 16 25 41 .3333333 38 34 72 .1666667 109 29 138 0 445 36 481 of pscore 0 1 Total of block extort_lab_any Inferior
and the number of controls for each block This table shows the inferior bound, the number of treated
The balancing property is satisfied
Total 610 137 747 .5 10 10 20 .3333333 66 44 110 .1666667 162 46 208 .0833333 182 33 215 0 190 4 194 of pscore 0 1 Total of block extort_cash Inferior
and the number of controls for each block This table shows the inferior bound, the number of treated
The balancing property is satisfied

51
Total 610 60 670 .5 1 1 2 .3333333 17 16 33 .1666667 62 16 78 .0833333 107 15 122 0 423 12 435 of pscore 0 1 Total of block extort_labour Inferior
and the number of controls for each block This table shows the inferior bound, the number of treated
The balancing property is satisfied
52
i This type of ambush is very well presented in the short film ‘Nawewe’ (meaning ‘you too’) who was nominated for an Oscar in 2010. ii The exceptions were the provinces of Rural Bujumbura and Bubanza were the rebel faction FNL
(Front National de la Libération) was the dominant force from the beginning till the end of the civil war. At the time of data collection however, these two provinces were not secure for field work. iii The model has been placed in the Appendix as we are not able to test its implications directly.
iv The issue that the first round of data collection did not take place before the start of the civil war
will be discussed in the robustness analysis. v To choose which hills to revisit and to end up with the same ratio of selected to unselected sites in
each province as in the 1998 survey, we listed, per province, all hills surveyed in 1998 and picked each fourth hill until we selected 100 hills. In the 1998 survey, 10 households were chosen randomly in each survey site. The survey site was the hill (sous-colline), the smallest administrative unit. vi The 2007 survey was financed through the MICROCON project (EU-6th Framework) with
contributions from the US Institute of Peace and Wageningen University. The research proposal was approved by an Ethical Review Board. During as well as after the survey, to the best of our knowledge, no respondent experienced negative repercussions from his/her participation. vii
The categories 3-4 are not mutually exclusive categories as ‘Any cash’ extortion does not exclude labour extortions that have been made on the same household. Whereas categories 5 and 6 are exclusive categories.