Extinction and threats to biodiversity. Two major causes Natural Causes (Non-Human) Human Causes.
31
Extinction and threats to biodiversity
-
Upload
clara-whitehead -
Category
Documents
-
view
220 -
download
2
Transcript of Extinction and threats to biodiversity. Two major causes Natural Causes (Non-Human) Human Causes.

Extinction and threats to biodiversity


Two major causesNatural Causes (Non-Human)Human Causes

Volcanic EruptionsDroughtMeteorsGlaciers and ice ageCompetition and Predation

H-Habitat destruction and fragmentation
I- Introduced speciesP-PollutionP-Practices of agricultureO-Over hunting
Dodo Bird – Extinct

Degradation: reducing the quality of available habitat Ex. Logging, agriculture, sewage
Fragmentation: splitting a single large, contiguous system into many disconnected areasEx. Putting a road through a wilderness area, or
building a dam across a riverLoss: Disappearing of an entire habitat
Ex. Paving natural area for building sites, converting prairies to farmland or residential subdivisions

Organisms that are living in an environment outside of its normal range or natural environment
Many are transported by accidentBiocontrol: Species transported intentionally to
control other “problem” species populationsCharacteristics:
Fast growth/reproductionLive in wide range of environmentsUsually harmful to environment Outcompete native organisms for local food
sources Leads to extinction of native organisms

Asian CarpKudzuRabbitsStarlingsCane Toads

“the vine that ate the South” and “The Green Menace”.
Grow up to 1 foot in a day!
Introduced from Japan as quick ground cover to prevent soil erosion

Asian Carp

Originally imported to clear algae from catfish ponds in the southern USA,
Flooding allowed some carp to escape into the Mississippi River and its tributaries where they quickly became MANY carp
Pose a strong threat to the Great LakesAsian Carp Research
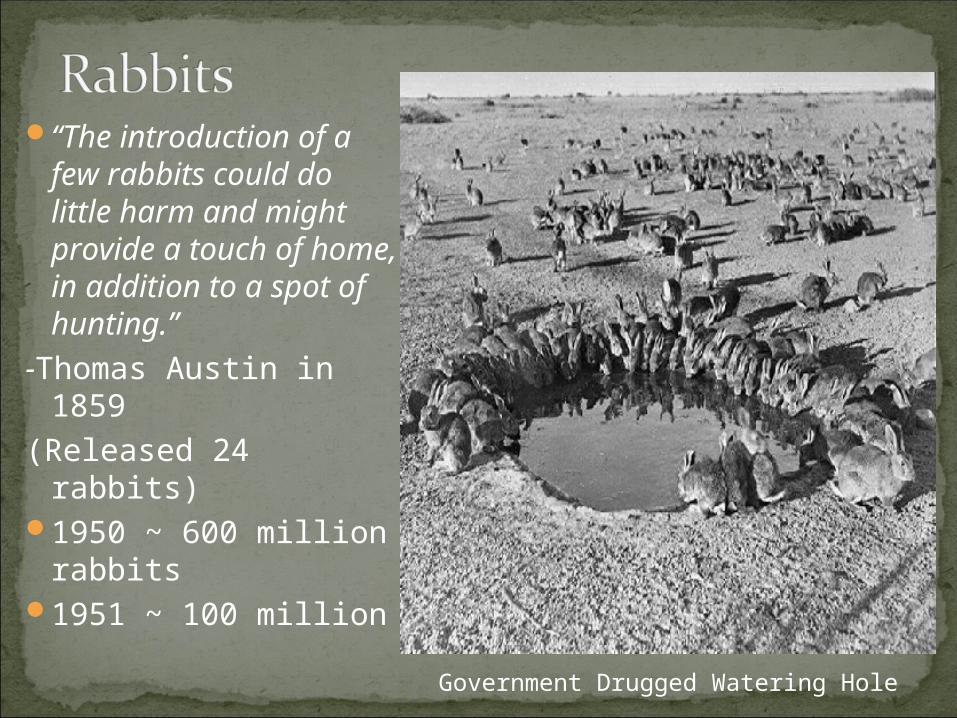
“The introduction of a few rabbits could do little harm and might provide a touch of home, in addition to a spot of hunting.”
-Thomas Austin in 1859
(Released 24 rabbits)1950 ~ 600 million
rabbits1951 ~ 100 million
Government Drugged Watering Hole


Today starlings are blamed for agricultural losses of up to $800 million annually in the United States, as well as being implicated in a number of deadly plane crashes.
~ 60 were released in New York’s Central Park in 1890.
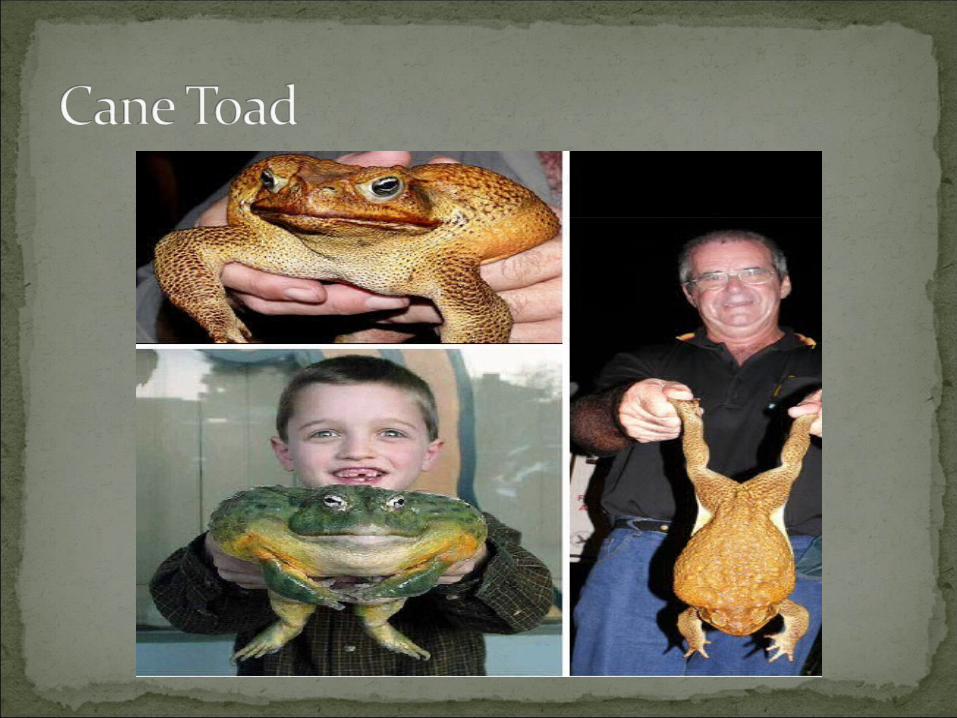

Good Example of biocontrol! In 1937 cane toads were released in
Australia's sugar cane plantations to control insect populations
By 1938 ~60,000 cane toads left sugar cane fields for more natural habitat (ate all majority of insect populations and outcompeted native amphibians for food)
Can grow up to 15 inches and eat anything!

Toxins added to the environment lead to a loss or degradation of habitat.

Farming causes habitat loss and reduces biodiversity because of…Monoculture: Farming of only one crop on a
large scalePesticides: Often lethal to many non-pest
speciesHerbicides: Lethal to species other than the
weeds
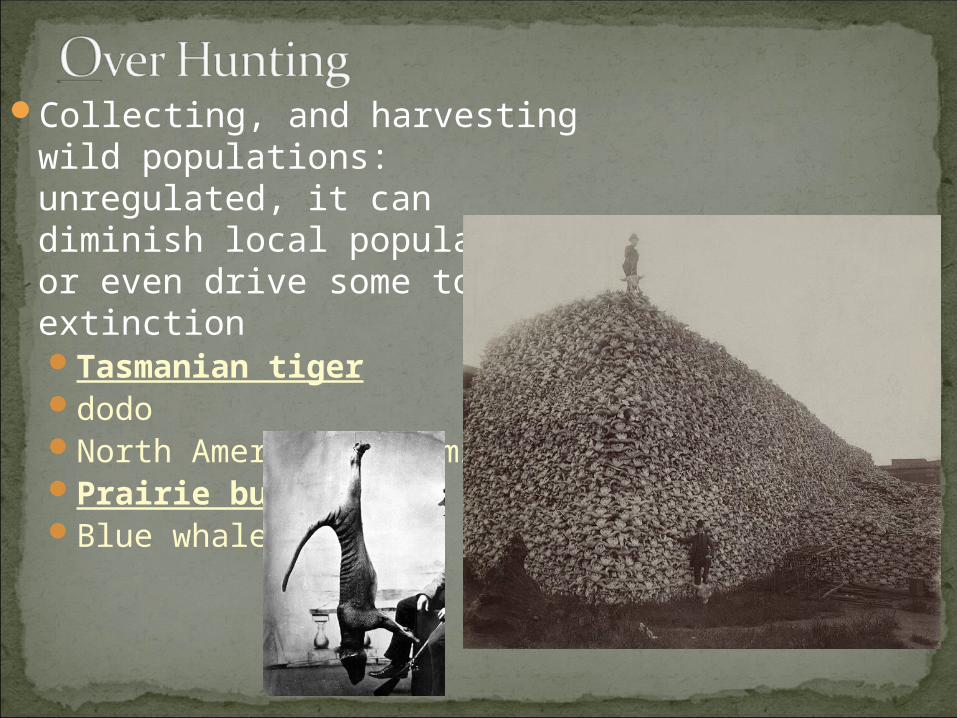
Collecting, and harvesting wild populations: unregulated, it can diminish local populations or even drive some to extinction Tasmanian tigerdodoNorth American sea minkPrairie buffalo Blue whale

OVERFISHING IS HUGE PROBLEM TODAY!CURRENT RATE OF CATCH IS
UNSUSTAINABLE

Fossil Records reveal average “lifetimes” of species.
Extinction occurs naturally and is referred to as the background rate of extinction
Humans have lead to a 1000x extinction rateEstimated 137 species lost each day
50,000 species a year
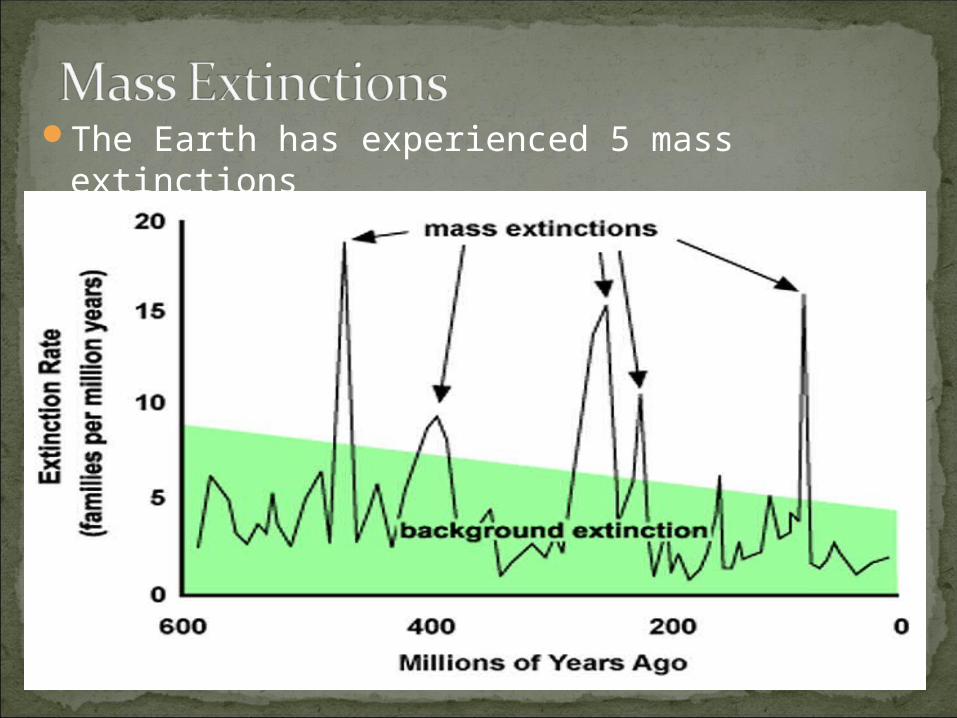
The Earth has experienced 5 mass extinctions

Extinction # 1 ~445 MYA Ordovician Stage – Dramatic loss of sea level due to forming Antarctica -57% Extinct
Extinction # 2 ~ 370 MYA Devonian Stage – Changes in sea level and global cooling stage -50% Extinct
Extinction #3 ~250 MYA Permian Stage- Breaking up of Pangea changed ocean currents- 83% Extinction
Extinction #4 ~200 MYA Triassic Stage – Climate warming from volcanic eruptions -48% Extinct
Extinction #5 ~65 MYA Cretaceous – Asteroid impacting the earth – 50% Extinct

Mammals: ~ 1 million yearsWith approximately 5,000
mammals the background rate is 1 every 200 years
In past 400 years 89 extinctions have been recorded.45x background rate.
Over 50 extinctions have occurred in the past century100x background rate

Organisms that are…Limited habitatExtremely specialized nicheLow reproductive potential Require a large territory MigratoryValuable economically (hunted)Vulnerable to pollutionIncompatible with civilization
may be more likely to go extinct

Contain 50% of Earth’s known species
Most species have specialized niches
Humans disrupt environment for logging
Changing one part of ecosystem alters the entire web of relationships
Breakdown of rainforest likely lead to extinction of 10% worlds species in 25 years
Regeneration rate is slow due to poor soil quality (rapid year round nutrient cycling depletes soil)


IUCN (International Union for Conservation of Nature)
Red list used to determine extinction riskSpecific Aims:
Provide system that can be applied consistentlyImprove evaluation of different factors which
affect the risk of extinction

Population size: How many of this species exist?
Reduction in population size: How fast is population decreasing?
Numbers of mature individuals: These are past their reproductive years and may lead
to further declineGeographic range and fragmentation:
Wide range makes the species less likely to be threatened
Fragmented habitat reduces interbreeding populations
Quality of habitat:Degraded habitat supports fewer individuals

Extinct (Ex) – No reasonable doubt that the last individual has died. Determined after exhaustive surveys of animals known range and expected habitats
Endangered (E)- Survival is unlikely if causal factors continue operating. Drastically reduced populations and habitat

Vulnerable (V) – Near endangered if causal factors continue. Numbers are abundant but are under threat from serious factors (overexploitation, habitat destruction)
Rare (R) – Small world populations that are at risk. Unexpected threat could easily cause a critical decline (small geographic disturbance)
Unknown (K) – Suspected to fit in one of the above categories but there is a lack of information