ExternE-Pol Externalities of Energy: Extension of ... · Externalities of Energy: Extension of...
76
1 ExternE-Pol Externalities of Energy: Extension of Accounting Framework and Policy Applications (Contract N° ENG1-CT-2002-00609) Final Report on Work Package 6 New energy technologies Roberto Dones, Thomas Heck, Christian Bauer and Stefan Hirschberg, Paul Scherrer Institut (PSI), Villigen, Switzerland Peter Bickel and Philipp Preiss, Universität Stuttgart, Stuttgart, Germany Luc Int Panis and Ina De Vlieger, VITO, Belgium Release 2 15 July 2005 Abstract The goal of the analysis of new energy systems was to estimate the associated external costs, by combining detailed life cycle inventories covering the complete energy chains and the full lifetime of all associated processes with damage factors from airborne emissions based on the impact- pathway approach. The cumulative inventories do not contain explicit information on the location of the emission sources. Therefore, the external costs were calculated based on average damage factors for emissions in Europe. For comparison, also several current average energy systems for Western European conditions were analysed employing the same method. Lignite, hard coal, natural gas, nuclear, photovoltaic, wind, and hydropower systems for power production were addressed. Oil, natural gas, and wood boilers as well as heat pumps were the analysed systems for heat production. Also small cogeneration plants burning diesel, natural gas, and wood were addressed. Results obtained for new and current technologies on the basis of the new ecoinvent database are discussed in one section of the report, whereas another section shows results for new energy technologies expected for Germany in the near future. The last section deals with the preliminary estimation of average external costs for the current European car fleet and new cars. Current fossil electricity systems exhibit the highest external costs. Introduction of advanced coal and natural gas technologies substantially reduces their external costs, with the gas combined cycle having the best performance; however, they still remain greater by a factor of roughly five to ten than nuclear or future photovoltaic, and ten to twenty than wind. Wood fuelled cogeneration units of the MW size, with associated wood chain, exhibit external costs (using exergy for allocation of the burdens to the co-products) comparable to gas cogeneration or lower, depending on the technology used. Electricity by decentralized small diesel and natural gas cogeneration ranks worse than new oil and natural gas technology, respectively. Greenhouse gas contribution to external costs is prevailing over other species for advanced fossil technologies, using the base case factor of 19 €/tonne CO 2 . For heating systems, oil has about 60% higher external costs than natural gas, and conventional wood scores somewhat in between due to the relatively high emissions of NO x and particulates. External costs of heat pumps strongly depend on the origin of the electricity supplied. Sensitivity analyses were performed reflecting on the one hand the uncertainties of impacts, e.g. due to unknown emission locations or due to uncertainties of impact functions, and on the other
Transcript of ExternE-Pol Externalities of Energy: Extension of ... · Externalities of Energy: Extension of...

1
ExternE-Pol Externalities of Energy:
Extension of Accounting Framework and Policy Applications (Contract N° ENG1-CT-2002-00609)
Final Report on Work Package 6
New energy technologies
Roberto Dones, Thomas Heck, Christian Bauer and Stefan Hirschberg, Paul Scherrer Institut (PSI), Villigen, Switzerland
Peter Bickel and Philipp Preiss, Universität Stuttgart, Stuttgart, Germany
Luc Int Panis and Ina De Vlieger, VITO, Belgium
Release 2
15 July 2005
Abstract
The goal of the analysis of new energy systems was to estimate the associated external costs, by combining detailed life cycle inventories covering the complete energy chains and the full lifetime of all associated processes with damage factors from airborne emissions based on the impact-pathway approach. The cumulative inventories do not contain explicit information on the location of the emission sources. Therefore, the external costs were calculated based on average damage factors for emissions in Europe. For comparison, also several current average energy systems for Western European conditions were analysed employing the same method. Lignite, hard coal, natural gas, nuclear, photovoltaic, wind, and hydropower systems for power production were addressed. Oil, natural gas, and wood boilers as well as heat pumps were the analysed systems for heat production. Also small cogeneration plants burning diesel, natural gas, and wood were addressed. Results obtained for new and current technologies on the basis of the new ecoinvent database are discussed in one section of the report, whereas another section shows results for new energy technologies expected for Germany in the near future. The last section deals with the preliminary estimation of average external costs for the current European car fleet and new cars.
Current fossil electricity systems exhibit the highest external costs. Introduction of advanced coal and natural gas technologies substantially reduces their external costs, with the gas combined cycle having the best performance; however, they still remain greater by a factor of roughly five to ten than nuclear or future photovoltaic, and ten to twenty than wind. Wood fuelled cogeneration units of the MW size, with associated wood chain, exhibit external costs (using exergy for allocation of the burdens to the co-products) comparable to gas cogeneration or lower, depending on the technology used. Electricity by decentralized small diesel and natural gas cogeneration ranks worse than new oil and natural gas technology, respectively. Greenhouse gas contribution to external costs is prevailing over other species for advanced fossil technologies, using the base case factor of 19 €/tonne CO2. For heating systems, oil has about 60% higher external costs than natural gas, and conventional wood scores somewhat in between due to the relatively high emissions of NOx and particulates. External costs of heat pumps strongly depend on the origin of the electricity supplied.
Sensitivity analyses were performed reflecting on the one hand the uncertainties of impacts, e.g. due to unknown emission locations or due to uncertainties of impact functions, and on the other

2
hand the sensitivity to monetary valuation. For electricity systems, change of damage factors does not affect the relative ranking of fossil systems, unless specific greenhouse gas damages per tonne CO2 are valued much lower than in the base case. In all cases, fossil systems rank worse than nuclear and renewables, which some exceptions for wood boilers. Consideration of the characteristics of the point of release and population density may somewhat change the external costs of wind and photovoltaics, but influences less the results for fossil and biomass-fuelled systems.
The preliminary estimation of external costs for the current European car fleet and new cars highlights the importance of the contribution of the infrastructure to external costs, especially when more stringent emission standards reduce pollutants in the exhaust.

3
Table of Contents
1 Introduction .................................................................................................................. 4 2 Life Cycle Inventories of current and new energy systems, ecoinvent-based ............. 5
2.1 Introduction .......................................................................................................... 5 2.2 Characteristics of the ecoinvent LCA database.................................................... 5 2.3 Energy technologies ............................................................................................. 6
2.3.1 Current technologies..................................................................................... 9 2.3.2 New technologies ....................................................................................... 12
2.4 Base damage factors ........................................................................................... 14 2.5 Results ................................................................................................................ 16
2.5.1 Electricity systems...................................................................................... 16 2.5.2 Current technologies................................................................................... 18 2.5.3 Heating systems.......................................................................................... 19
2.6 Sensitivity analyses ............................................................................................ 23 2.6.1 Damage factors ........................................................................................... 23 2.6.2 Results of the sensitivities .......................................................................... 26 2.6.3 Contribution of upstream energy chains..................................................... 46 2.6.4 Site-independent vs. site-dependent external cost factors .......................... 47
3 Life Cycle Inventories of energy systems for German new power plants and cogeneration units............................................................................................................... 48
3.1 Introduction ........................................................................................................ 48 3.2 Scope / boundaries of the system analysis ......................................................... 48 3.3 Description of Technologies............................................................................... 49
3.3.1 Electricity supply systems .......................................................................... 49 3.3.2 Cogeneration systems................................................................................. 51
3.4 LCI Results......................................................................................................... 52 3.4.1 Fossil-fuelled systems ................................................................................ 52 3.4.2 Bio-fuelled CHP systems ........................................................................... 53
3.5 Results of External Cost Calculation.................................................................. 53 3.6 Sensitivity of damage factors to key characteristics of point of emissions for up- and downstream steps of energy chains ......................................................................... 57 3.7 Notes on comparison of process chain analysis and hybrid LCA approach ...... 60
4 Passenger car transport systems ................................................................................. 62 4.1 Reference current technology............................................................................. 62 4.2 New technologies ............................................................................................... 62 4.3 Damage factors ................................................................................................... 63 4.4 Results for external costs.................................................................................... 65 4.5 Conclusions ........................................................................................................ 71
5 General conclusions and outlook................................................................................ 72 6 Appendix .................................................................................................................... 73
6.1 Allocation ........................................................................................................... 73 References .......................................................................................................................... 74

4
1 Introduction The goal of the analysis of new, selected advanced energy systems was to estimate the associated external costs, by combining detailed and internally consistent Life Cycle Inventories (LCI) with damage factors based on the impact-pathway approach. For comparison, also several current average energy systems have been analysed, employing the same method. The ecoinvent database v1.1, available online at www.ecoinvent.ch, offered a consistent starting basis for the analysis. Results obtained for new and current technologies on the basis of ecoinvent are discussed in Section 2, whereas Section 3 shows results for new energy technologies for energy chains expected for Germany around year 2010. Section 4 addresses a preliminary estimation of new car technologies compared with the current average European fleet.

5
2 Life Cycle Inventories of current and new energy systems, ecoinvent-based
2.1 Introduction In this project, external costs are quantified for new electric, heat, and transport energy technologies for Western European conditions, and as a reference also for currently installed average technologies and technologies available on European market around year 2000.
Fossil, nuclear, and renewable energy systems have been assessed using a full process analysis methodology. The life cycle of all stages of the considered energy systems has been systematically and consistently considered. An energy system or energy chain includes: energy resource extraction and processing, production of infrastructure and fuels, transport, conversion to electricity or heat or mechanical energy, and waste management. As a basis for such analyses, the database ecoinvent (www.ecoinvent.ch) provides detailed technological and environmental data.
2.2 Characteristics of the ecoinvent LCA database The recently released integrated database ecoinvent originates from the Swiss LCI study on current Swiss and Western European energy systems issued in 1994 and updated and extended in 1996 (Frischknecht et al. 1996). That study covered all main energy chains associated with electricity and heating technologies operational in the first half of the 1990s. Electricity mixes were addressed for UCTE countries. Different industrial sectors linked with the energy systems, like transport, construction machines, material manufacturing, and waste treatment were modelled with sufficient detail for serving the assessment of cumulative burdens associated with the unit of electric energy or heating energy delivered by an energy system. Burden means here an emission or non-renewable resource exploitation. Cumulative means here the result of a calculation, which may be iterative or direct using matrix inversion, to solve the system of linear equations describing the interconnections of the industrial sectors described and the full spectrum of material flows from and into the environment (biosphere) and throughout the sectors (technosphere), thus representing all recursive contributions and feedbacks.
With increasing interest and widespread uses of the LCA methodology, several other specific studies and specialized databases have since flourished in Switzerland and elsewhere for different economy sectors. The aim of the project “ecoinvent 2000” (2000-2004) was to create the centralized ecoinvent database, to establish a suitable common data format (EcoSpold), to make all existing (Swiss) databases consistent when transferred into ecoinvent, to update all inventory data to the reference year 2000, and to extend the modelling to additional processes and products. The database on energy systems mentioned above offered a suitable starting point framework for such an endeavour. The sectors included besides the energy systems are: construction materials, metals, chemicals, paper and board, forestry, agriculture, detergents, transport services and waste treatment. The methodology used in ecoinvent is extensively described in Frischknecht et al. (2004), while specific information on LCI for different sectors is included in several individual reports of the ecoinvent series. In particular, complete information on current energy systems, on the model data, and analyses of selected results are covered in the German report Dones et al. (2004a); an extended summary in English is also available (Dones et al. 2003b).
Several Organizations of the Swiss Technical University (so-called ETH-Domain) contributed to the project, namely EAWAG, EMPA, EPFL, ETHZ, and PSI, as well as the Swiss Federal Research Station for Agroecology and Agriculture (Agroscope FAL Reckenholz). These Organizations joined and founded the ecoinvent Centre, or Swiss Centre for Life Cycle Inventories. They received support from several Swiss Federal Offices. In particular, the work on the energy systems herewith utilized was supported by the Swiss Federal Office of Energy (BfE).
6
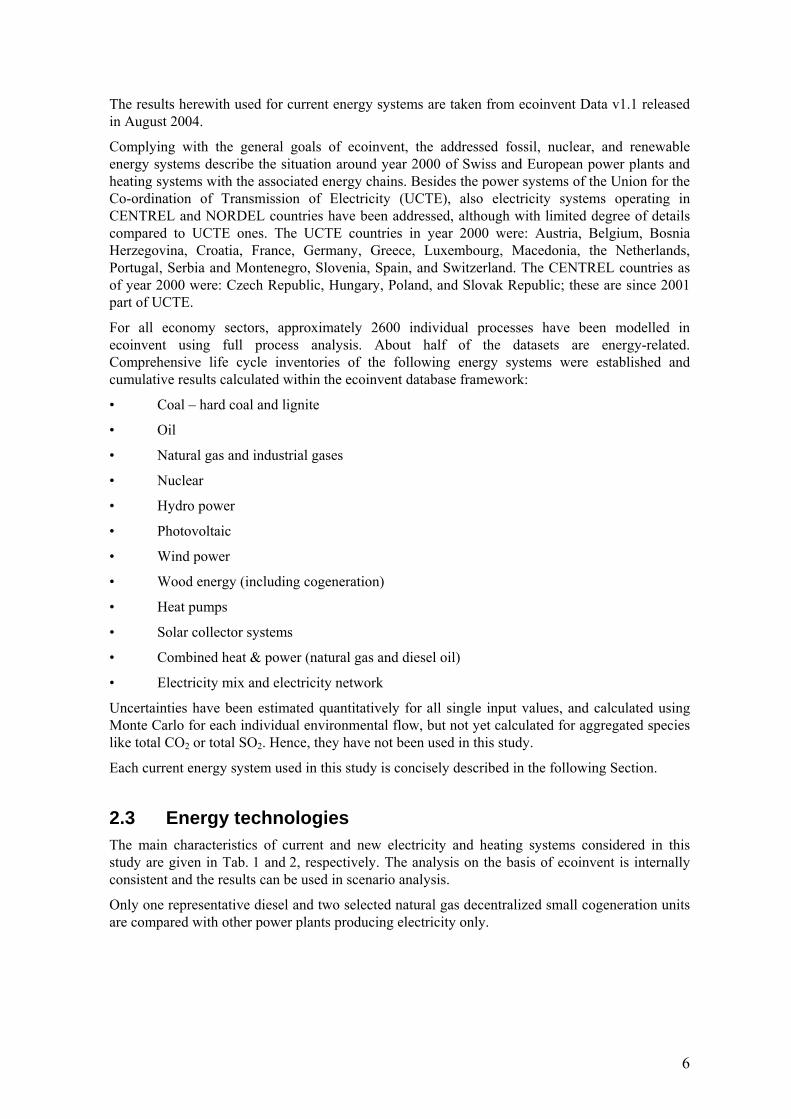
The results herewith used for current energy systems are taken from ecoinvent Data v1.1 released in August 2004.
Complying with the general goals of ecoinvent, the addressed fossil, nuclear, and renewable energy systems describe the situation around year 2000 of Swiss and European power plants and heating systems with the associated energy chains. Besides the power systems of the Union for the Co-ordination of Transmission of Electricity (UCTE), also electricity systems operating in CENTREL and NORDEL countries have been addressed, although with limited degree of details compared to UCTE ones. The UCTE countries in year 2000 were: Austria, Belgium, Bosnia Herzegovina, Croatia, France, Germany, Greece, Luxembourg, Macedonia, the Netherlands, Portugal, Serbia and Montenegro, Slovenia, Spain, and Switzerland. The CENTREL countries as of year 2000 were: Czech Republic, Hungary, Poland, and Slovak Republic; these are since 2001 part of UCTE.
For all economy sectors, approximately 2600 individual processes have been modelled in ecoinvent using full process analysis. About half of the datasets are energy-related. Comprehensive life cycle inventories of the following energy systems were established and cumulative results calculated within the ecoinvent database framework:
• Coal – hard coal and lignite
• Oil
• Natural gas and industrial gases
• Nuclear
• Hydro power
• Photovoltaic
• Wind power
• Wood energy (including cogeneration)
• Heat pumps
• Solar collector systems
• Combined heat & power (natural gas and diesel oil)
• Electricity mix and electricity network
Uncertainties have been estimated quantitatively for all single input values, and calculated using Monte Carlo for each individual environmental flow, but not yet calculated for aggregated species like total CO2 or total SO2. Hence, they have not been used in this study.
Each current energy system used in this study is concisely described in the following Section.
2.3 Energy technologies The main characteristics of current and new electricity and heating systems considered in this study are given in Tab. 1 and 2, respectively. The analysis on the basis of ecoinvent is internally consistent and the results can be used in scenario analysis.
Only one representative diesel and two selected natural gas decentralized small cogeneration units are compared with other power plants producing electricity only.

7
Table 1 Characteristics of the electricity systems analysed after ecoinvent. Energy
Source / Technology
Identifier in Fig. 1 and 2 Technology description Net
efficiency (%)
Allocation exergy to
el. (%) Notes
Coal Lignite Average present plant for UCTE & energy chain 39 - Installation of more efficient units and scrubbers will somewhat reduce external costs Hard Coal Average present plant for UCTE & energy chain 36 - Installation of more efficient units and scrubbers will somewhat reduce external costs
Hard Coal PFBC Pressurized Fluidised Bed Combustion (PFBC) power plant, technology around 2010 & present coal chain for Germany
47 - • Efficiency may improve to 50% • The coal chain may differ in future (origin of the coal)
Oil Oil Average present plant for UCTE & energy chain 38 - • The average includes base load and peak plants • Heavy oil used
Oil CC Combined Cycle (CC) best present technology & present oil chain for Europe 57.5 -
• Can be assumed for new units • Net efficiency may increase up to 60% • External costs roughly inversely proportional to efficiency increase
Natural gas Gas Average plant for UCTE & energy chain 38 -
Gas CC Combined Cycle (CC) best present technology & present gas chain for UCTE 57.5 -
• Can be assumed for new units • Net efficiency may increase up to 60% • External costs roughly inversely proportional to efficiency increase
Nuclear LWR Average Light Water Reactor (LWR) for UCTE & close fuel cycle 33 - • Damage factors for radioactive emissions approximated by DALY
• Not all isotopic species have been given a damage factor
PWR (centrifuge enr.) Average Pressurized Water Reactor (PWR) for Switzerland & close fuel cycle with centrifuge enrichment only
32 - • Can be assumed approximately for Advanced LWR, if the chain remains unaltered • In the current assessment, external costs associated with power plant are only a few
percent of total
Hydropower Hydropower (alpine) Average reservoir plant for Switzerland & relevant energy chain 78 -
• Small improvements in average efficiency expected (84%) • May not be representative for specific units/sites for different material intensity for the
dam and different flux of greenhouse gases from reservoir surface
Photovoltaic PV panel (S-Europe)
Average present technology for monocrystalline-Si 3 kWp grid-connected units manufactured in Europe, panel mounted on slanted roof, average irradiation in South Europe (1200 kWh/kWpeak·a)
12 (16.5 cell) -
• External costs inversely proportional to irradiation (for Central Europe it can be assumed average irradiation of 800 kWh/kWpeak·a)
• Boundary of system include inverter
PV integrated (S-Europe) Same as above but with panel integrated in roof - • The inventory may not be valid for systems produced outside Europe, for production technologies and electricity supply mixes for manufacturing might be different
PV integrated fut. (S-Europe)
Near future technology for monocrystalline-Si 3 kWp grid-connected units manufactured in Europe, panel integrated in slanted roof, average irradiation in South Europe (1200 kWh/kWpeak·a)
13 (17.5 cell) - • Near-future scenario for purified silicon production and improved cell technology
• Can be assumed for units around 2010
Wind Wind onshore 800kW Present technology, average capacity factor in Germany (20%) 25 - • External costs inversely proportional to capacity factor
• Lower external costs with higher nominal power rate
Wind offshore 2MW Current technology, shallow sea, reference capacity factor (30%) applicable near cost of North Sea (Middelgrunden, Denmark)
25 - • As above for onshore • Environmental inventories and associated external costs may differ with depth of sea
Cogeneration Diesel cogen diesel SCR 200kWe
Modern diesel unit, installed in Europe, using Selective Catalytic Reduction (SCR) and an oxidation catalyst
39 (el.) 43 (th.) 85 New units & associated average European oil chain
Cogeneration Natural gas
cogen gas lambda=1, 160kWe
Modern Lambda=1 motor gas cogeneration plant in Europe, using three-way catalytic converter
32 (el.) 55 (th.) 77
• New units installed & associated average Central European natural gas chain. • Different gas origins may change the contribution from the upstream chain to external
costs
cogen gas lean burn 1MWe Modern gas cogeneration plant in Europe, without catalysts
38 (el.) 44 (th.) 84
* Boundary for the analysis is the busbar of the power plant.
8
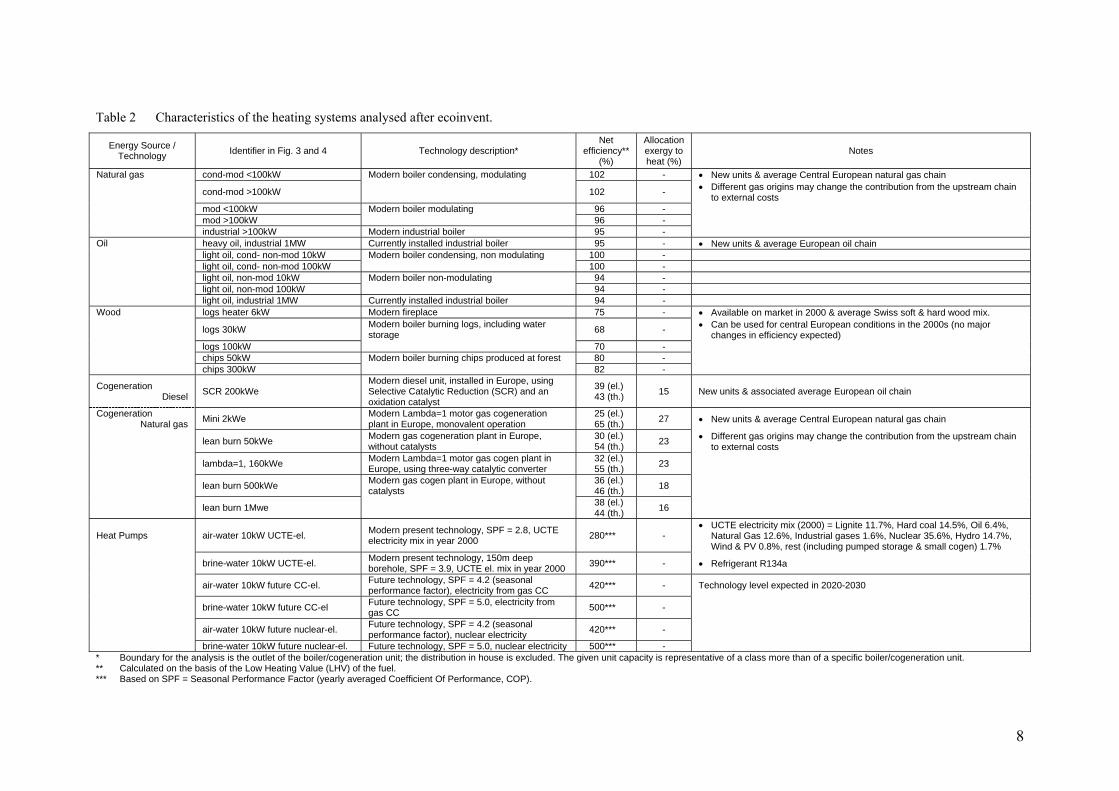
Table 2 Characteristics of the heating systems analysed after ecoinvent.
Energy Source / Technology Identifier in Fig. 3 and 4 Technology description*
Net efficiency**
(%)
Allocation exergy to heat (%)
Notes
Natural gas cond-mod <100kW Modern boiler condensing, modulating 102 - • New units & average Central European natural gas chain
cond-mod >100kW 102 - • Different gas origins may change the contribution from the upstream chain to external costs
mod <100kW Modern boiler modulating 96 - mod >100kW 96 - industrial >100kW Modern industrial boiler 95 - Oil heavy oil, industrial 1MW Currently installed industrial boiler 95 - • New units & average European oil chain light oil, cond- non-mod 10kW Modern boiler condensing, non modulating 100 - light oil, cond- non-mod 100kW 100 - light oil, non-mod 10kW Modern boiler non-modulating 94 - light oil, non-mod 100kW 94 - light oil, industrial 1MW Currently installed industrial boiler 94 - Wood logs heater 6kW Modern fireplace 75 - • Available on market in 2000 & average Swiss soft & hard wood mix.
logs 30kW Modern boiler burning logs, including water storage 68 - • Can be used for central European conditions in the 2000s (no major
changes in efficiency expected) logs 100kW 70 - chips 50kW Modern boiler burning chips produced at forest 80 - chips 300kW 82 -
Cogeneration Diesel SCR 200kWe
Modern diesel unit, installed in Europe, using Selective Catalytic Reduction (SCR) and an oxidation catalyst
39 (el.) 43 (th.) 15 New units & associated average European oil chain
Cogeneration Natural gas Mini 2kWe Modern Lambda=1 motor gas cogeneration
plant in Europe, monovalent operation 25 (el.) 65 (th.) 27 • New units & average Central European natural gas chain
lean burn 50kWe Modern gas cogeneration plant in Europe, without catalysts
30 (el.) 54 (th.) 23 • Different gas origins may change the contribution from the upstream chain
to external costs
lambda=1, 160kWe Modern Lambda=1 motor gas cogen plant in Europe, using three-way catalytic converter
32 (el.) 55 (th.) 23
lean burn 500kWe Modern gas cogen plant in Europe, without catalysts
36 (el.) 46 (th.) 18
lean burn 1Mwe 38 (el.) 44 (th.) 16
Heat Pumps air-water 10kW UCTE-el. Modern present technology, SPF = 2.8, UCTE electricity mix in year 2000 280*** -
• UCTE electricity mix (2000) = Lignite 11.7%, Hard coal 14.5%, Oil 6.4%, Natural Gas 12.6%, Industrial gases 1.6%, Nuclear 35.6%, Hydro 14.7%, Wind & PV 0.8%, rest (including pumped storage & small cogen) 1.7%
brine-water 10kW UCTE-el. Modern present technology, 150m deep borehole, SPF = 3.9, UCTE el. mix in year 2000 390*** - • Refrigerant R134a
air-water 10kW future CC-el. Future technology, SPF = 4.2 (seasonal performance factor), electricity from gas CC 420*** - Technology level expected in 2020-2030
brine-water 10kW future CC-el Future technology, SPF = 5.0, electricity from gas CC 500*** -
air-water 10kW future nuclear-el. Future technology, SPF = 4.2 (seasonal performance factor), nuclear electricity 420*** -
brine-water 10kW future nuclear-el. Future technology, SPF = 5.0, nuclear electricity 500*** - * Boundary for the analysis is the outlet of the boiler/cogeneration unit; the distribution in house is excluded. The given unit capacity is representative of a class more than of a specific boiler/cogeneration unit. ** Calculated on the basis of the Low Heating Value (LHV) of the fuel. *** Based on SPF = Seasonal Performance Factor (yearly averaged Coefficient Of Performance, COP).

9
2.3.1 Current technologies In the following, key information on the relevant energy chains is provided from (Dones et al. 2000b). CENTREL average technologies have not been addressed in this WP6, rather in WP7.
Coal
Hard coal has been analysed separately from lignite. Lignite mining has been addressed only for average European conditions. Key parameters for a high number of single lignite power plants in Europe have been used for determining country-specific average power plants as well as average UCTE (and CENTREL) lignite plant mixes. Because of the huge fuel masses to be burned, lignite power plants are mine-mouth. Therefore, the lignite energy chain is modelled without coal transport between mining and power plant.
Hard coal mining has been addressed for eight important production regions in the world: Eastern and Western Europe, North and South America, South Africa, East Asia, Russia, and Australia. Several key parameters for a highly representative number of single hard coal power plants in Europe around year 2000 have been used for determining country-specific hard coal electricity production as well average UCTE (and CENTREL) hard coal plant mixes. For each of these countries, a specific hard coal supply mix has been defined, representing the import shares from the eight production regions in year 2000. Due to limited data, steam coal is not treated separately from other mine products in the datasets describing the mining step in the eight regions.
In general, there are substantial differences for country-specific results for both hard coal and lignite chains. For direct power plant air emissions, emissions mostly depend on the efficiency of the plants as well as on the installation rate and efficiency of emission control devices. However, these differences have not been analysed here because the focus is on new power plant technologies in relation to average current technologies. While the upstream chain of lignite power plants does not have a significant influence on the cumulative results, the upstream chain of hard coal power plants can be considered an important factor, especially for countries importing overseas coal. The transport from these production regions to Europe generates for example relatively high emissions of nitrogen oxides and particulates.
Oil
The average UCTE power plant includes base load as well as medium and peak load conventional plants, describing the situation around year 2000 on the basis of individual country-specific averages. The oil energy chain is composed of field exploration, crude oil production, long distance transportation, oil refining, regional distribution, and the use of oil products in boilers for space heating and industry as well as in power plants.
Natural Gas
The upstream energy chain includes gas field exploration, natural gas production, natural gas purification, long distance transportation, and regional distribution in high and low pressure networks in Switzerland and Western Europe. High pressure gas is supplied to power plants, whereas low pressure gas is supplied to boilers and small cogeneration units.
Specific inventories have been investigated for single countries, either producers or users. The main producer countries for the supply of natural gas in Western European and Switzerland are the Russian Federation, The Netherlands, Norway, Germany, Great Britain, and Algeria. Their shares of the supply in different countries are considered. The import structure is decisive for the gas transport distances and for the environmental burdens related to the upstream chain. The import shares in year 2000 for the average UCTE natural gas plant are: 5% Germany; 24% The Netherlands; 34% Russian federation; 17% Norway; 16% Algeria/North Africa; and, 4% UK.
10
These shares have been applied also for the gas combined cycle power plant and the gas boilers. Shares for natural gas supply to Switzerland, used for the cogeneration systems, are only slightly different: 10% Germany; 28% The Netherlands; 36% Russian federation; 17% Norway; 4% Algeria/North Africa; and, 5% UK. Hence, considering the characteristics of each producing region and transport to consumers, there are no major differences in the burdens per unit of delivered gas for the two supply mixes. Onshore production has been treated separately from offshore production to the extent possible for a single region.
For the modelling of average natural gas power plants in different European countries, national average efficiencies are used. Large combined heat and power plants fuelled by natural gas have been also considered in the current average electricity supply, as far as data were available.
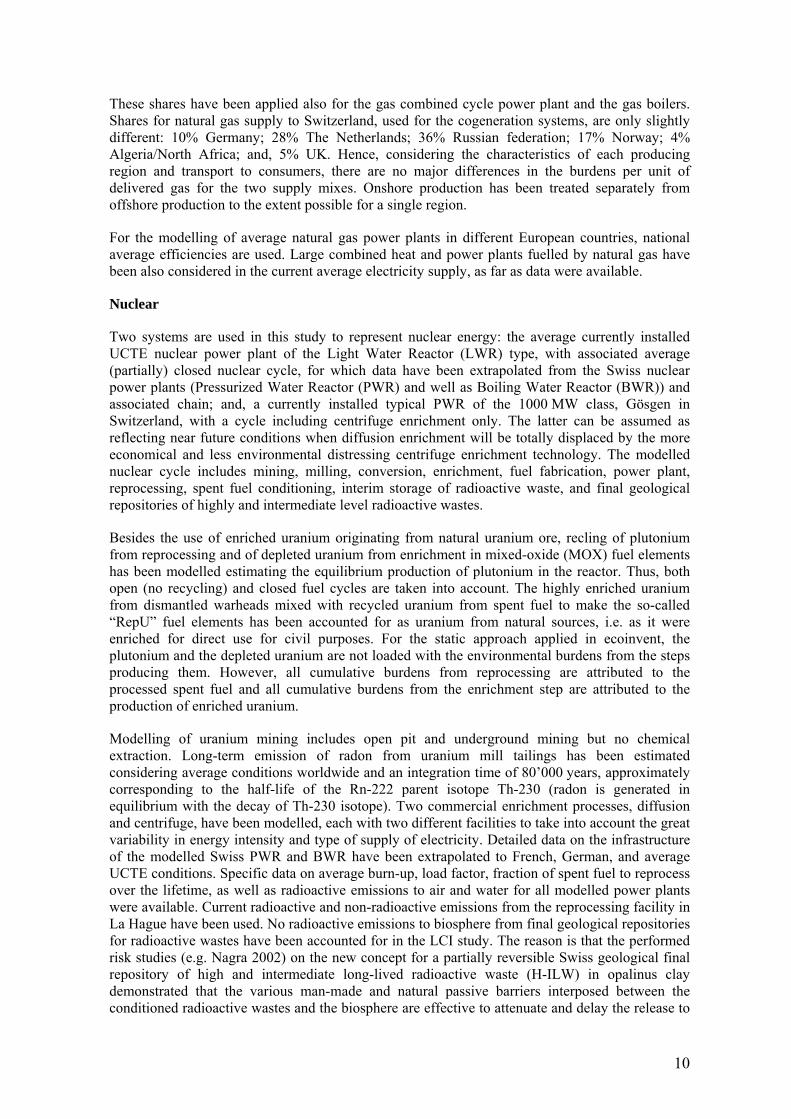
Nuclear
Two systems are used in this study to represent nuclear energy: the average currently installed UCTE nuclear power plant of the Light Water Reactor (LWR) type, with associated average (partially) closed nuclear cycle, for which data have been extrapolated from the Swiss nuclear power plants (Pressurized Water Reactor (PWR) and well as Boiling Water Reactor (BWR)) and associated chain; and, a currently installed typical PWR of the 1000 MW class, Gösgen in Switzerland, with a cycle including centrifuge enrichment only. The latter can be assumed as reflecting near future conditions when diffusion enrichment will be totally displaced by the more economical and less environmental distressing centrifuge enrichment technology. The modelled nuclear cycle includes mining, milling, conversion, enrichment, fuel fabrication, power plant, reprocessing, spent fuel conditioning, interim storage of radioactive waste, and final geological repositories of highly and intermediate level radioactive wastes.
Besides the use of enriched uranium originating from natural uranium ore, recling of plutonium from reprocessing and of depleted uranium from enrichment in mixed-oxide (MOX) fuel elements has been modelled estimating the equilibrium production of plutonium in the reactor. Thus, both open (no recycling) and closed fuel cycles are taken into account. The highly enriched uranium from dismantled warheads mixed with recycled uranium from spent fuel to make the so-called “RepU” fuel elements has been accounted for as uranium from natural sources, i.e. as it were enriched for direct use for civil purposes. For the static approach applied in ecoinvent, the plutonium and the depleted uranium are not loaded with the environmental burdens from the steps producing them. However, all cumulative burdens from reprocessing are attributed to the processed spent fuel and all cumulative burdens from the enrichment step are attributed to the production of enriched uranium.
Modelling of uranium mining includes open pit and underground mining but no chemical extraction. Long-term emission of radon from uranium mill tailings has been estimated considering average conditions worldwide and an integration time of 80’000 years, approximately corresponding to the half-life of the Rn-222 parent isotope Th-230 (radon is generated in equilibrium with the decay of Th-230 isotope). Two commercial enrichment processes, diffusion and centrifuge, have been modelled, each with two different facilities to take into account the great variability in energy intensity and type of supply of electricity. Detailed data on the infrastructure of the modelled Swiss PWR and BWR have been extrapolated to French, German, and average UCTE conditions. Specific data on average burn-up, load factor, fraction of spent fuel to reprocess over the lifetime, as well as radioactive emissions to air and water for all modelled power plants were available. Current radioactive and non-radioactive emissions from the reprocessing facility in La Hague have been used. No radioactive emissions to biosphere from final geological repositories for radioactive wastes have been accounted for in the LCI study. The reason is that the performed risk studies (e.g. Nagra 2002) on the new concept for a partially reversible Swiss geological final repository of high and intermediate long-lived radioactive waste (H-ILW) in opalinus clay demonstrated that the various man-made and natural passive barriers interposed between the conditioned radioactive wastes and the biosphere are effective to attenuate and delay the release to
11
the biosphere of not yet decayed radioisotopes, which will occur between 104 – 107 years from the sealing of the repositories. The calculated maximum individual dose to humans from this source must remain, for Switzerland, below a threshold, fixed by the Swiss Nuclear Authority, at any time and for all possible release scenarios. The time when the remaining released isotopes might have a peak in the biosphere is much longer (Nagra 2002) than the time of 60’000 years assumed in ecoinvent for the calculation of long-term releases from non-radioactive waste depositories (Doka 2003). Furthermore, it could be shown that even the amounts released over extremely long time remain very low when divided by the electricity production corresponding to the total deposited waste.
Hydro Power
The average Swiss reservoirs with concrete dams with a height of more than 30 meter have been modelled in ecoinvent and used here for comparison with other energy systems. The data have been extrapolated to other alpine countries and to Europe at large. Besides, also average run-of-river and pumped storage plants were also studied, but their results are not used here. Greenhouse gas emissions from the surface of reservoirs during operation have been quantified for alpine conditions and included in the figures shown here, but they may not be valid for other country/region average or site-specific conditions.
Photovoltaic
The entire manufacturing processes associated with the European production of photovoltaic (PV) panels has been considered. The production stages include silica sand production, metallurgical-grade silicon production, silicon purification, Czochralski monocrystalline silicon production, polycrystalline silicon production, wafer production, cell manufacturing, panel or laminate production; these stages are assumed to take place in different European countries. The boundary for the analysis includes the balance of system, i.e. infrastructure and inverter, up to the grid. Only small scale, 3 kWpeak grid-connected photovoltaic plants have been considered. Here shown are only results for the monocrystalline silicon, slanted roof panel applications, either mounted or integrated in the roof. These PV plants can be assumed to be representative for newly installed plants in South Europe around year 2000, for the average intensity of solar radiation in South Europe has been used. However, results can easily be extrapolated to other conditions by multiplying them with the appropriate ratio of yields. Lifetime assumed is 30 years.
The inventory may not be valid for systems produced outside of Europe, because production technologies and power mixes for production processes may differ. A scenario for near future (2005-2010) crystalline silicon technologies has been also defined, assuming improvements in manufacturing, improved cell efficiency, and an expanded photovoltaic market (Jungbluth 2003). Again, here only the results for monocrystalline silicon, integrated slanted roof future panels in South Europe are shown.
Wind Power
Two systems are here used for the estimation of external costs: an onshore 800 kW wind turbine with 20% capacity factor, average for Germany; and, a 2 MW offshore wind power plant, based on information from the wind park Middelgrunden, Denmark, with 30% capacity factor, rounding up the annual production to get a rough value for near to coast Northern European conditions. Results can be easily scaled up/down with the appropriate ratio of capacity factors. However, the data for the offshore plant may not be directly applicable for different conditions of water depth and distance from the coast.
For the LCI assessment, the infrastructure has been divided into two parts: the basement and the tower (major fixed parts), with an assumed lifetime of 40 years for onshore plants and 20 years for the offshore plant; and, the moving parts (rotor, nacelle) as well as the electric and electronic

12
components and cables between the generator and the electric grid, with an assumed lifetime of 20 years.
Wood Energy
Several classes of wood heating systems have been modelled, which represent average technologies available on the central European market around year 2000: wood chip fired 50 kW, 300 kW, and 1000 kW boilers; wood log fired 6 kW, 30 kW, and 100 kW boilers; and, pellet fired 15 kW and 50 kW boilers (results for pellet are not shown here). Mixed wood directly taken from forest (i.e., no residual wood nor waste wood were analysed), made of 72% softwood and 28% hardwood, which represents the Swiss commercial wood mix around year 2000, is assumed to be burned in logs and chips furnaces. In general, wood log boilers have lower efficiencies than wood chips furnaces of comparable capacity.
Heat Pumps
Two wide-spread types of 10 kW heat pumps for one-family houses are modelled: an air-water heat pump and a brine-water heat pump. The boundary for the results shown here is at the heat pump outlet before heat distribution. An average location in Europe is considered, for which the average UCTE electricity mix is used.
Combined Heat & Power
Different types of small natural gas and diesel combined heat and power (CHP) plants are included, as shown in Tab. 1 and 2. With the exception of the 1 MWe unit, Swiss conditions for the gas supply at low pressure distribution network were considered for CHPs in our analysis. However, considering that the shares for the origin of the gas are similar for Switzerland and UCTE (see above), for the purpose of this external cost assessment it can be assumed that the results are valid for central European conditions. Most important is the share of Russian gas, due to the higher leakage rate and energy uses for long-distance transportation from this production region.
2.3.2 New technologies Three new power technologies have been assessed for coal, oil, and natural gas, namely: the Pressurized Fluidised Bed Combustion (PFBC) coal power plant, technology around 2010 and present hard coal chain for Germany; the oil Combined Cycle (CC), technology available today, and oil chain for UCTE average current conditions; and, gas CC, technology available today, and natural gas chain for UCTE average current conditions. However, with good approximation, the external costs (with current damage factors, though) for these technologies in a longer time horizon (2020-2030) can be obtained just by scaling the results with the ratio of net efficiencies, because not much can be expected for further reduction of single pollutant species. For PFBC 53% efficiency in year 2030, the scaling factors would be 47/53 ≈ 0.9, for CC technology 57.5/60 ≈ 0.96 (efficiencies for year 2030 from (Dones et al. 1996)).
The reason for not modifying the current (year 2000) average European upstream chains for the assessed fossil new technologies is that the focus of this project is on conversion technologies and that a scenario analysis for fuel supply in future is beyond its scope. However, although some differences may be expected in the origin of the raw energy carriers and in some technologies used in the upstream (and downstream, where applicable) stages, the expected changes in environmental burdens (and hence damages) are most likely less important that the changes induced by new power plants for fossil systems.
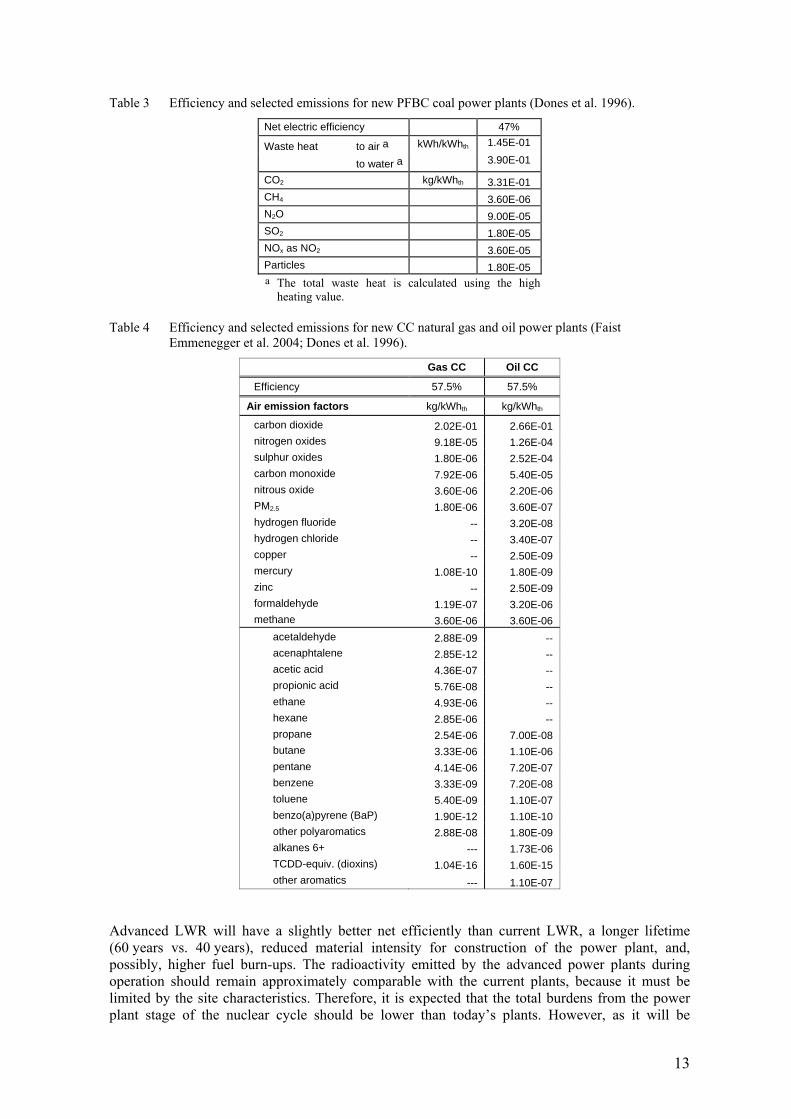
Main emissions for the new technologies are illustrated in Tab. 3 and 4, after (Faist Emmenegger et al. 2004) and (Dones et al. 1996).
13
Table 3 Efficiency and selected emissions for new PFBC coal power plants (Dones et al. 1996).
Net electric efficiency 47%
Waste heat to air a kWh/kWhth 1.45E-01
to water a 3.90E-01
CO2 kg/kWhth 3.31E-01 CH4 3.60E-06 N2O 9.00E-05 SO2 1.80E-05 NOx as NO2 3.60E-05 Particles 1.80E-05 a The total waste heat is calculated using the high
heating value.
Table 4 Efficiency and selected emissions for new CC natural gas and oil power plants (Faist Emmenegger et al. 2004; Dones et al. 1996).
Gas CC Oil CC
Efficiency 57.5% 57.5%
Air emission factors kg/kWhth kg/kWhth
carbon dioxide 2.02E-01 2.66E-01 nitrogen oxides 9.18E-05 1.26E-04 sulphur oxides 1.80E-06 2.52E-04 carbon monoxide 7.92E-06 5.40E-05 nitrous oxide 3.60E-06 2.20E-06 PM2.5 1.80E-06 3.60E-07 hydrogen fluoride -- 3.20E-08 hydrogen chloride -- 3.40E-07 copper -- 2.50E-09 mercury 1.08E-10 1.80E-09 zinc -- 2.50E-09 formaldehyde 1.19E-07 3.20E-06 methane 3.60E-06 3.60E-06
acetaldehyde 2.88E-09 -- acenaphtalene 2.85E-12 -- acetic acid 4.36E-07 -- propionic acid 5.76E-08 -- ethane 4.93E-06 -- hexane 2.85E-06 -- propane 2.54E-06 7.00E-08 butane 3.33E-06 1.10E-06 pentane 4.14E-06 7.20E-07 benzene 3.33E-09 7.20E-08 toluene 5.40E-09 1.10E-07 benzo(a)pyrene (BaP) 1.90E-12 1.10E-10 other polyaromatics 2.88E-08 1.80E-09 alkanes 6+ --- 1.73E-06 TCDD-equiv. (dioxins) 1.04E-16 1.60E-15 other aromatics --- 1.10E-07
Advanced LWR will have a slightly better net efficiently than current LWR, a longer lifetime (60 years vs. 40 years), reduced material intensity for construction of the power plant, and, possibly, higher fuel burn-ups. The radioactivity emitted by the advanced power plants during operation should remain approximately comparable with the current plants, because it must be limited by the site characteristics. Therefore, it is expected that the total burdens from the power plant stage of the nuclear cycle should be lower than today’s plants. However, as it will be
14
discussed in the results section, the power plant itself is a minimal contributor to total external costs. Hence, from this perspective current results for power plant can be roughly used for representing advanced technologies. The emissions from reprocessing should remain about similar (they comply with emission limits, again site specific), unless new (lower) standards would be issued. Emissions from mill tailings should reduce because reclamation practices seem to tend to improve worldwide. Hence, external costs from nuclear power are expected at least not to increase compared to the level they have today. Therefore, the assessment performed here can be assumed as preliminary for near future nuclear systems.
Future fossil heating systems are not expected to have their net efficiency improved much further, being very high already today due to the inclusion of modulation and condensing technologies. Sulphur content of light oil is already very low (0.1%), and NOx and CO from oil and gas boilers are normally below or even well below the thresholds of the European environmental regulations. If any meaningful change for the systems’ external costs may occur, this should come from upstream reductions, which are more difficult to control by the European fuel importers. Hence, the shown external costs should hold also for near future fossil boilers (with current damage factors). Also for wood logs and chips furnaces not much can be expected as for improvements of net efficiency. The changes that may substantially alter the external costs would come from pollution control technology for NOx and PM, but these are cost-effectively applied only in larger (centralized) units. Other wood (biomass) technologies should be addressed in order to verify whether reduction of external cost could be achieved compared to conventional furnaces, which would make wood heating more attractive from this point of view.
To estimate the effect of both advancements in technology and differences from the electricity supply used, the external costs of the two HP systems air-water and brine-water have been estimated for technology around year 2020-2030 (Gantner et al. 2001) supplied by either gas CC or nuclear power (for the latter, the best current technology has been used).
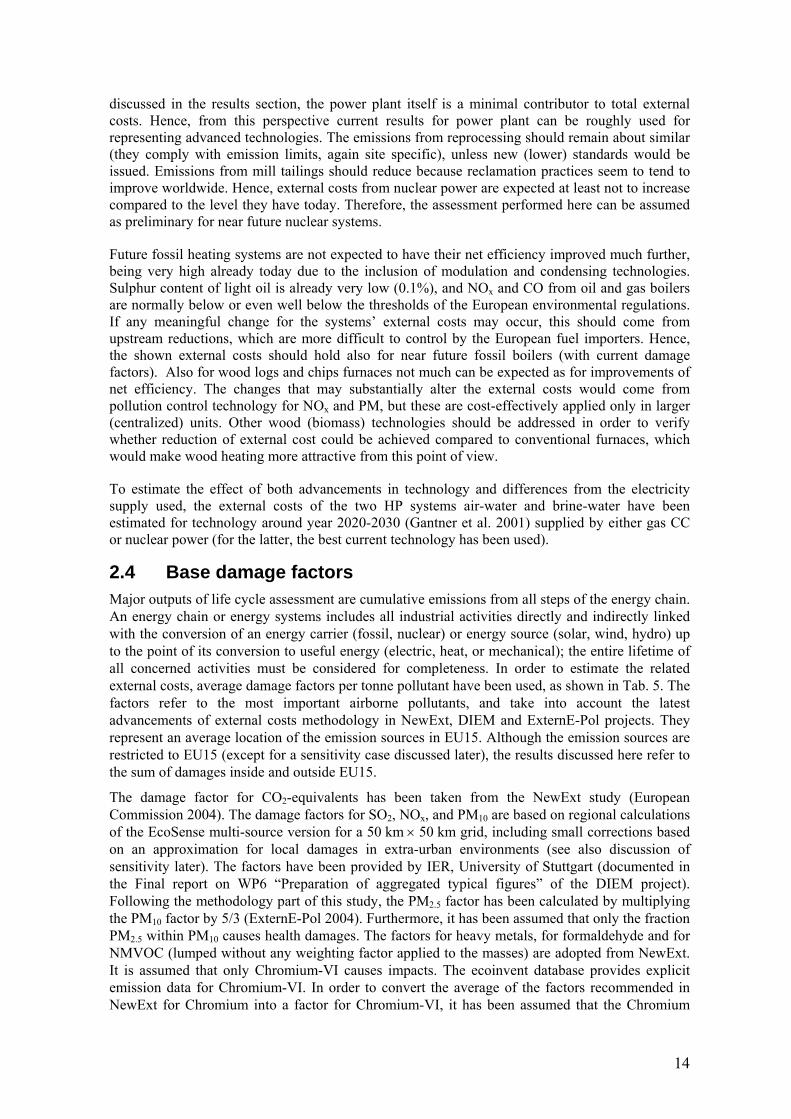
2.4 Base damage factors Major outputs of life cycle assessment are cumulative emissions from all steps of the energy chain. An energy chain or energy systems includes all industrial activities directly and indirectly linked with the conversion of an energy carrier (fossil, nuclear) or energy source (solar, wind, hydro) up to the point of its conversion to useful energy (electric, heat, or mechanical); the entire lifetime of all concerned activities must be considered for completeness. In order to estimate the related external costs, average damage factors per tonne pollutant have been used, as shown in Tab. 5. The factors refer to the most important airborne pollutants, and take into account the latest advancements of external costs methodology in NewExt, DIEM and ExternE-Pol projects. They represent an average location of the emission sources in EU15. Although the emission sources are restricted to EU15 (except for a sensitivity case discussed later), the results discussed here refer to the sum of damages inside and outside EU15.
The damage factor for CO2-equivalents has been taken from the NewExt study (European Commission 2004). The damage factors for SO2, NOx, and PM10 are based on regional calculations of the EcoSense multi-source version for a 50 km × 50 km grid, including small corrections based on an approximation for local damages in extra-urban environments (see also discussion of sensitivity later). The factors have been provided by IER, University of Stuttgart (documented in the Final report on WP6 “Preparation of aggregated typical figures” of the DIEM project). Following the methodology part of this study, the PM2.5 factor has been calculated by multiplying the PM10 factor by 5/3 (ExternE-Pol 2004). Furthermore, it has been assumed that only the fraction PM2.5 within PM10 causes health damages. The factors for heavy metals, for formaldehyde and for NMVOC (lumped without any weighting factor applied to the masses) are adopted from NewExt. It is assumed that only Chromium-VI causes impacts. The ecoinvent database provides explicit emission data for Chromium-VI. In order to convert the average of the factors recommended in NewExt for Chromium into a factor for Chromium-VI, it has been assumed that the Chromium
15
mixture at the emission sources contains about 13% Chromium-VI. The damage factor for primary sulfates has been assumed equal to the PM10 factor, the damage factor of primary nitrates has been assumed 50% of this value (according to the assumptions on toxicity of sulfates and nitrates in the methodology part of this study).
Table 5 Base damage factors per ton of pollutant emitted in EU15.
Species Damage factors [€2000/tonne]
CO2-equiv. 19
SO2 2939
NOx 2908
PM10 11723
PM2.5 19539
PM2.5-10 0
Arsenic 80000
Cadmium 39000
Chromium 31500
Chromium-VI 240000
Chromium-other 0
Lead 1600000
Nickel 3800
Formaldehyde 120
NMVOC 1124
Nitrates, primary 5862
Sulfates, primary 11723
Radioactive emissions 50000 * [€2000/DALY]
* Disability-Adjusted Life Years (DALY), assuming equal to the unit value of chronic YOLL.
In order to include a rough estimate of the damages due to radioactive emissions, and to make the estimation of external costs as close as possible to the LCI information on radioactive emissions from the nuclear cycle (as well as the direct emissions from the coal chains and the indirect contributions calculated for all energy chains and the electricity mixes), the Disability-Adjusted Life Years (DALY) concept has been used, applied to ionising radiation. The monetary value of a DALY was set equal to the monetary value of a life year (the latter is derived in the valuation part of the NewExt study). The DALY for ionising radiation is actually implemented with some approximations in two life cycle impact assessment methods, namely CML (Guinèe et al. 2001) and Eco-indicator 99 (Goedkoop and Spriensma 2000), after Frischknecht et al. (2000), who in turn based the health damage factors on the achievements of Dreicer et al. (1995). The latter study, performed in the frame of the early ExternE work, was focused on the French nuclear cycle, using only data from domestic representative nuclear activities for the various stages of the cycle. Therefore, the isotope-specific damage factors may not be representative for different conditions; in particular the damage factor for Rn-222 may be somewhat overestimated, because a great part of the milling around the world occurs in poorly populated areas. Furthermore, the species whose damage factors were estimated do not entirely match with the radioactive single or aggregated species inventoried in the ecoinvent database. From the above, the results of the present study for nuclear should be taken with care.
For each species, the same factors have been used for the direct emissions from the power plant as well as from the other contributions to cumulative emissions, i.e. from the infrastructure of the

16
power plant as well as the rest of the energy chain (upstream and downstream), which includes transport requirements. Although some of these indirect emissions may occur outside Europe, they are generally minor contributors to total. Furthermore, the characteristics of the database are such that application of location-specific damage factors for indirect contributions is not straightforward. Extension of the methodology should be attained in follow-up work.
2.5 Results The external costs per kWh are calculated by multiplying the cumulative emissions of each system with the base case damage factors (Tab. 5). Cumulative emissions from cogeneration systems have been allocated using the exergy concept, which is explained in the Appendix.
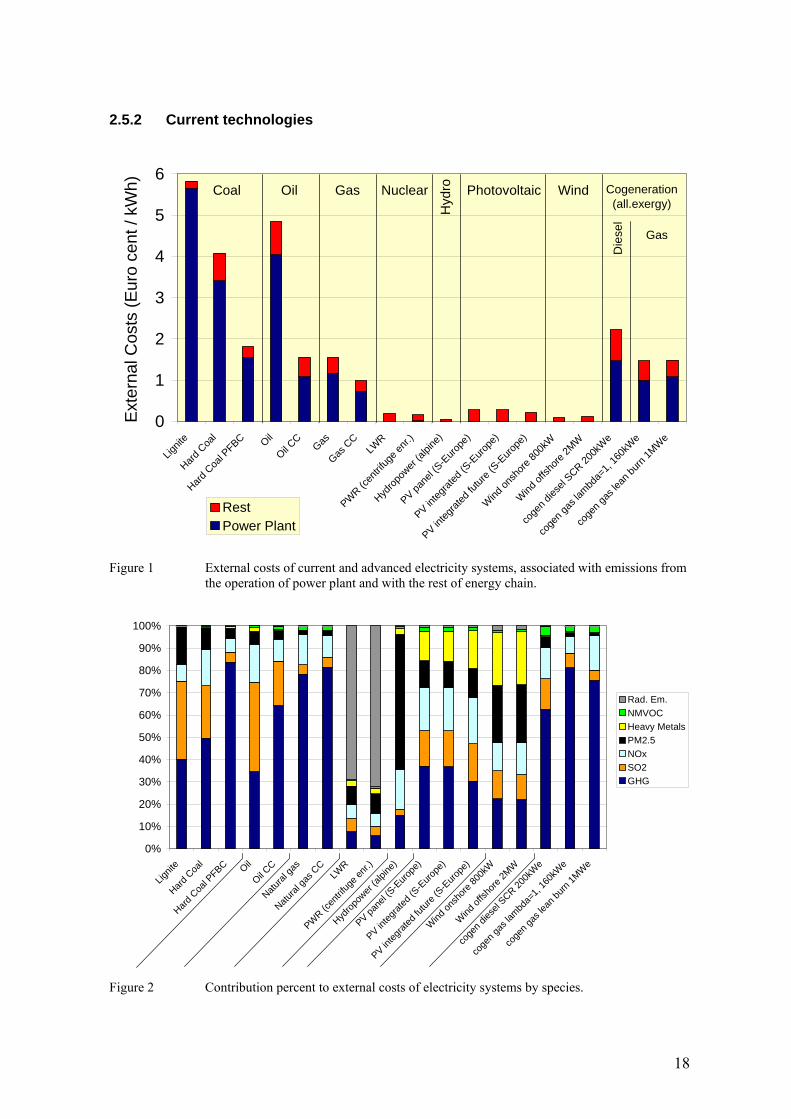
2.5.1 Electricity systems Tab. 6 shows the calculated cumulative emissions of the species or groups used in the pictures below. Fig. 1 shows an overview of the results for current and advanced electricity systems, and Fig. 2 gives the calculated contributions of the species to total external costs.
Current fossil systems for the generation of electricity exhibit the highest external costs, in the range of 1.6 to 5.8 c€/kWh (Fig. 1). In particular, lignite and oil current average UCTE installed technologies exhibit the highest values, 5.8 c€/kWh and 4.8 c€/kWh, respectively, followed by hard coal with 4.1 c€/kWh. Introduction of advanced technology (CC and PFBC) substantially reduces the external costs of fossil systems, but they still remain in the range of 1 to 2 c€/kWh. Marked differences between gas and oil apply also to cogeneration, for which natural gas technology generates external costs one third lower than diesel technology, approximately 1.5 c€/kWh vs. 2.2 c€/kWh, respectively. With the allocation by exergy, small decentralized diesel and natural gas cogeneration ranks worse than new oil (this even than coal PFBC) and natural gas electric technology, respectively. The contribution percent of upstream chains to external costs of current average UCTE fossil technologies ranges from nearly 25% for the natural gas chain (around 30% for gas cogeneration) to 17% for the hard coal and oil chains (34% for diesel cogeneration) and only 3% for lignite (whose power plants are mine-mouth, hence with upstream chain of relatively low significance in terms of airborne emissions). The upstream contributions generally increase or remain similar in relative terms for new fossil technologies: 26% gas CC, 31% oil CC, and 15% coal PFBC.
Contribution of greenhouse gases (GHG) to total costs is prevailing over other species for advanced fossil technologies, making over 80% of total external costs for gas CC and PFBC (Fig. 2). Current averages of lignite, hard coal and oil plants show still high contributions from SO2, 35%, 23% and 40%, respectively. The level of SO2 obviously depends on the sulphur content of the fuel and the extension of installation of scrubbers in the plants, but in the case of oil and somewhat of hard coal also from the upstream chain. The importance of the contribution of PM2.5 to external costs decreases from average lignite (17%), through hard coal (10%) and oil (6%), down to natural gas electricity systems (barely 2%). External costs from NOx make a substantial 16% or slightly more for hard coal and oil total external costs, while this share is 7% for lignite and nearly 14% for natural gas average UCTE systems. New fossil technologies exhibit 10% contribution to external costs from NOx for CC technology, 6% for PFBC. For the latter, the reduced NOx emissions are somewhat compensated by the production of the greenhouse gas N2O due to the relatively low temperature of combustion.

17
Table 6 Cumulative emissions for current and new technologies for power production systems (after ecoinvent).
Coal Oil Natural gas Cogeneration
(kg/kWh) Lignite Hard Coal Hard Coal PFBC Oil Oil CC Gas Gas CC Diesel SCR
200kWe Gas λ=1, 160kWe
Gas lean burn 1MWe
Greenhouse gases 1.23E+00 1.07E+00 7.98E-01 8.82E-01 5.26E-01 6.40E-01 4.23E-01 7.31E-01 6.27E-01 5.90E-01 SO2 6.95E-03 3.25E-03 2.76E-04 6.61E-03 1.06E-03 2.19E-04 1.47E-04 1.04E-03 3.28E-04 2.34E-04 NOx 1.49E-03 2.26E-03 3.86E-04 2.82E-03 5.21E-04 7.20E-04 3.29E-04 1.06E-03 3.80E-04 7.80E-04 PM2.5 (incl. primary nitrates & sulphates) 5.08E-04 2.07E-04 4.24E-05 1.45E-04 3.09E-05 1.46E-05 1.07E-05 5.68E-05 1.23E-05 1.06E-05
Heavy Metals (total, unweighted) 2.37E-07 4.58E-07 2.50E-07 3.93E-06 1.65E-07 2.47E-08 4.44E-08 3.40E-07 6.67E-08 4.17E-08
NMVOC (total, unweighted) 4.01E-05 1.06E-04 5.45E-05 3.96E-04 2.43E-04 2.72E-04 1.81E-04 8.41E-04 3.51E-04 3.83E-04
Radioactive Emiss. (unweighted). 2.97E-10 4.33E-10 1.83E-10 4.21E-10 2.78E-10 4.96E-11 3.59E-11 3.95E-10 8.07E-11 6.02E-11
Nuclear Hydropower Photovoltaic Wind
(kg/kWh)
LWR PWR centrifuge enichment
Alpine reservoir
Panel, mounted (South-Europe)
Panel, integrated
(South-Europe)
Panel, integrated
(South-Europe)
Onshore 800kW
Offshore 2MW
Greenhouse gases 7.64E-03 4.83E-03 3.70E-03 5.38E-02 5.34E-02 3.41E-02 1.05E-02 1.34E-02 SO2 3.78E-05 2.31E-05 4.15E-06 1.49E-04 1.50E-04 1.21E-04 3.81E-05 4.44E-05 NOx 3.94E-05 3.19E-05 2.87E-05 1.84E-04 1.82E-04 1.53E-04 3.85E-05 5.62E-05 PM2.5 (incl. primary nitrates & sulphates) 9.50E-06 8.26E-06 1.46E-05 1.72E-05 1.71E-05 1.46E-05 1.18E-05 1.55E-05
Heavy Metals (total, unweighted) 1.43E-07 1.31E-07 3.35E-08 4.45E-07 4.42E-07 4.23E-07 6.18E-07 6.37E-07
NMVOC (total, unweighted) 8.53E-06 7.73E-06 4.34E-06 3.75E-05 3.67E-05 2.83E-05 9.03E-06 1.20E-05
Radioactive Emiss. (unweighted). 2.61E-08 2.29E-08 2.06E-11 4.55E-10 4.56E-10 3.32E-10 6.84E-11 7.73E-11
18
2.5.2 Current technologies
0
1
2
3
4
5
6
Lignit
e
Hard C
oal
Hard C
oal P
FBC Oil
Oil CC
Gas
Gas C
CLW
R
PWR (c
entrif
uge e
nr.)
Hydrop
ower
(alpin
e)
PV pane
l (S-E
urope
)
PV integ
rated
(S-E
urope
)
PV integ
rated
futur
e (S-E
urope
)
Wind
onsh
ore 80
0kW
Wind
offsh
ore 2M
W
coge
n dies
el SCR 20
0kW
e
coge
n gas
lambd
a=1,
160k
We
coge
n gas
lean
burn
1MW
e
Ext
erna
l Cos
ts (E
uro
cent
/ kW
h)
RestPower Plant
Coal Oil Gas Nuclear
Hyd
ro
Gas
Photovoltaic Wind Cogeneration(all.exergy)
Die
sel
Figure 1 External costs of current and advanced electricity systems, associated with emissions from
the operation of power plant and with the rest of energy chain.
0%
10%
20%
30%
40%
50%
60%
70%
80%
90%
100%
Lignit
e
Hard C
oal
Hard C
oal P
FBC Oil
Oil CC
Natural
gas
Natural
gas C
CLW
R
PWR (c
entrif
uge e
nr.)
Hydrop
ower
(alpin
e)
PV pane
l (S-E
urope
)
PV integ
rated
(S-E
urope
)
PV integ
rated
futur
e (S-E
urope
)
Wind
onsh
ore 80
0kW
Wind
offsh
ore 2M
W
coge
n dies
el SCR 20
0kWe
coge
n gas
lambd
a=1,
160k
We
coge
n gas
lean
burn
1MW
e
Rad. Em.NMVOCHeavy MetalsPM2.5NOxSO2GHG
Figure 2 Contribution percent to external costs of electricity systems by species.

19
An important share of the cumulative environmental burdens of the current natural gas chain is generated by the production and processing of the gas. Emissions per kWh electricity are distributed very differently over the chain for different species (e.g. CO2, NOx, CH4). Carbon dioxide emissions are mainly the direct emissions during the operation of the power plant. For carbon monoxide, the emissions during production and transport are dominating. Cumulative methane emissions of a gas power plant originate almost completely from the upstream part of the chain. In particular the natural gas losses due to leakages in the long distance transport from Russia to UCTE countries are significant for the cumulative methane emissions. The distribution of the gas through the low pressure network contributes significantly to cumulative methane emissions.
Nuclear external costs are below 0.19 c€/kWh, of which 95% to nearly 100% from upstream and downstream contributions, i.e. the nuclear power plant contributes 5% or less to external costs from the cycle. Of the calculated costs, 70% are radioactivity-dependent. However, if discounting would be introduced, this contribution would strongly decrease, because most of the calculated damages from radiation are either related to very long term emissions (e.g., radon from uranium mill tailings) or to very long-lived isotopes giving very small dose rates. On the other hand, the present estimation of external costs from ionizing radiation is based on a preliminary calculation using the DALY concept, a rough attribution of cost/DALY, and a not complete (though meaningful) subset of isotope releases from the ecoinvent database. It is recommended to rework the estimation of damage factors from radioactive emissions in future projects of the ExternE series.
Wind onshore with nearly 0.09 c€/kWh performs slightly better than wind offshore with 0.12 c€/kWh. The reason of higher external costs for the offshore plant analysed lies in the calculated higher material intensity and higher energy needed for the installation, which are not compensated by the assumed higher capacity factor (i.e. higher average annual wind speed). However, the contribution percent to external costs of the considered species remain approximately the same for both applications (Fig. 2). With the assumed average energy yields, wind technology scores second best after hydropower and before nuclear.
Monocrystalline silicon photovoltaic (PV) panels of European fabrication, installed in Southern Europe with an assumed average yield of 1200 kWh/kWpeak·a cause nearly 0.28 c€/kWh, which would mean 0.41 c€/kWh for an average yield of 800 kWh/kWpeak·a in Central Europe. Assuming improvements in manufacturing technology of crystalline silicon, improved cell efficiency and an expanded photovoltaic market, 0.21 c€/kWh has been estimated for near future (around year 2010) systems, in South Europe applications. External costs associated with imported panels may differ due to different manufacturing technology and electricity supply. Due to the relatively high material intensity of PV and wind, the contribution from heavy metals is about 15% and nearly 25%, respectively.
Hydropower (alpine conditions) exhibits the lowest external costs of all systems, below 0.05 c€/kWh, but this may increase on sites were higher direct emission of GHG from the surface of reservoir occur (see for example (Dones et al. 2004c)) and where a higher material intensity or lower lifetime1 are calculated or assumed. The calculated value may change also depending on the assumptions for the emissions of particles from construction sites; after ecoinvent, the share of PM2.5 to total external costs is about 60%.
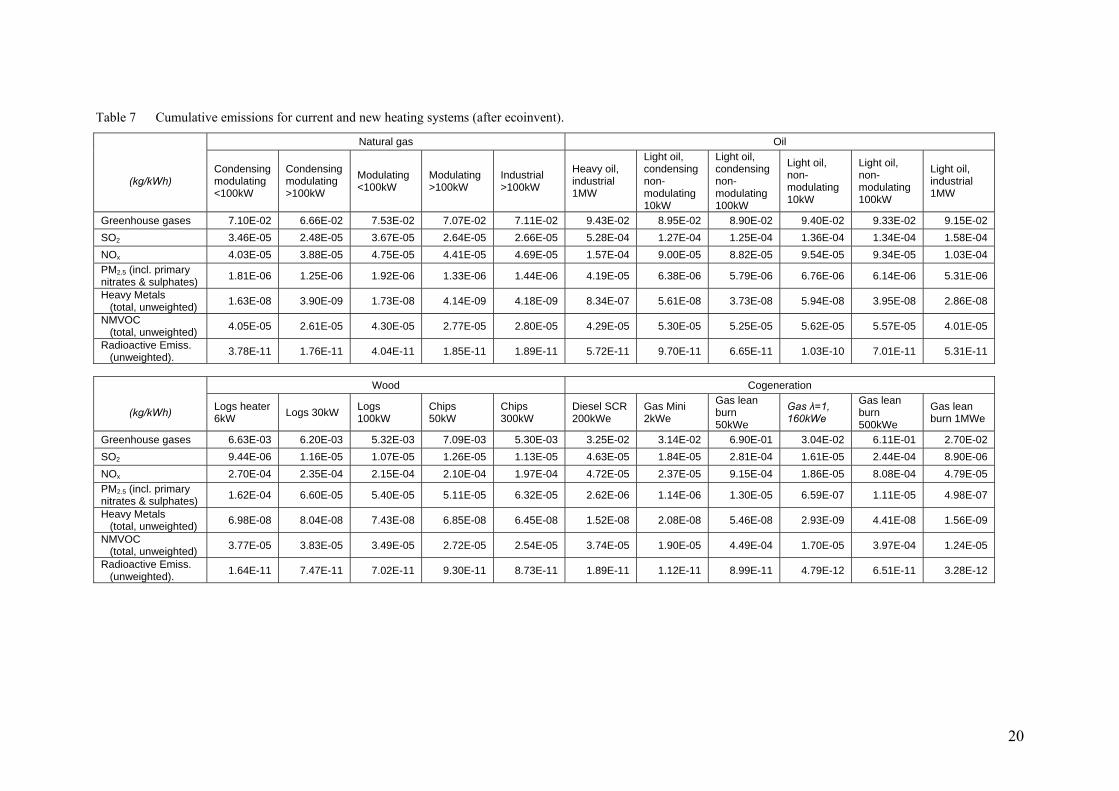
2.5.3 Heating systems Tab. 7 shows the calculated cumulative emissions of the species or groups used in the pictures below. Fig. 3 shows an overview of the results for modern and future heating systems, and Fig. 4 gives the calculated contributions of the species to total calculated external costs.
1 The lifetime of alpine dams assumed in ecoinvent is 150 years (Bolliger & Bauer 2004)
20
Table 7 Cumulative emissions for current and new heating systems (after ecoinvent).
Natural gas Oil
(kg/kWh) Condensing modulating<100kW
Condensing modulating >100kW
Modulating <100kW
Modulating >100kW
Industrial >100kW
Heavy oil, industrial 1MW
Light oil, condensing non-modulating 10kW
Light oil, condensing non-modulating 100kW
Light oil, non-modulating 10kW
Light oil, non-modulating 100kW
Light oil, industrial 1MW
Greenhouse gases 7.10E-02 6.66E-02 7.53E-02 7.07E-02 7.11E-02 9.43E-02 8.95E-02 8.90E-02 9.40E-02 9.33E-02 9.15E-02 SO2 3.46E-05 2.48E-05 3.67E-05 2.64E-05 2.66E-05 5.28E-04 1.27E-04 1.25E-04 1.36E-04 1.34E-04 1.58E-04 NOx 4.03E-05 3.88E-05 4.75E-05 4.41E-05 4.69E-05 1.57E-04 9.00E-05 8.82E-05 9.54E-05 9.34E-05 1.03E-04 PM2.5 (incl. primary nitrates & sulphates) 1.81E-06 1.25E-06 1.92E-06 1.33E-06 1.44E-06 4.19E-05 6.38E-06 5.79E-06 6.76E-06 6.14E-06 5.31E-06
Heavy Metals (total, unweighted) 1.63E-08 3.90E-09 1.73E-08 4.14E-09 4.18E-09 8.34E-07 5.61E-08 3.73E-08 5.94E-08 3.95E-08 2.86E-08
NMVOC (total, unweighted) 4.05E-05 2.61E-05 4.30E-05 2.77E-05 2.80E-05 4.29E-05 5.30E-05 5.25E-05 5.62E-05 5.57E-05 4.01E-05
Radioactive Emiss. (unweighted). 3.78E-11 1.76E-11 4.04E-11 1.85E-11 1.89E-11 5.72E-11 9.70E-11 6.65E-11 1.03E-10 7.01E-11 5.31E-11
Wood Cogeneration
(kg/kWh) Logs heater 6kW Logs 30kW Logs
100kW Chips 50kW
Chips 300kW
Diesel SCR 200kWe
Gas Mini 2kWe
Gas lean burn 50kWe
Gas λ=1, 160kWe
Gas lean burn 500kWe
Gas lean burn 1MWe
Greenhouse gases 6.63E-03 6.20E-03 5.32E-03 7.09E-03 5.30E-03 3.25E-02 3.14E-02 6.90E-01 3.04E-02 6.11E-01 2.70E-02 SO2 9.44E-06 1.16E-05 1.07E-05 1.26E-05 1.13E-05 4.63E-05 1.84E-05 2.81E-04 1.61E-05 2.44E-04 8.90E-06 NOx 2.70E-04 2.35E-04 2.15E-04 2.10E-04 1.97E-04 4.72E-05 2.37E-05 9.15E-04 1.86E-05 8.08E-04 4.79E-05 PM2.5 (incl. primary nitrates & sulphates) 1.62E-04 6.60E-05 5.40E-05 5.11E-05 6.32E-05 2.62E-06 1.14E-06 1.30E-05 6.59E-07 1.11E-05 4.98E-07
Heavy Metals (total, unweighted) 6.98E-08 8.04E-08 7.43E-08 6.85E-08 6.45E-08 1.52E-08 2.08E-08 5.46E-08 2.93E-09 4.41E-08 1.56E-09
NMVOC (total, unweighted) 3.77E-05 3.83E-05 3.49E-05 2.72E-05 2.54E-05 3.74E-05 1.90E-05 4.49E-04 1.70E-05 3.97E-04 1.24E-05
Radioactive Emiss. (unweighted). 1.64E-11 7.47E-11 7.02E-11 9.30E-11 8.73E-11 1.89E-11 1.12E-11 8.99E-11 4.79E-12 6.51E-11 3.28E-12

Table 7 (contd.) Cumulative emissions for current and new heating systems (after ecoinvent).
Heat Pump (kg/kWh) Current Future
(kg/kWh)
Air-water 10kW UCTE electricity
Brine-water 10kW UCTE electricity
Air-water 10kW CC electricity
Brine-water 10kW CC electricity
Air-water 10kW nuclear electricity
Brine-water 10kW nuclear electricity
Greenhouse gases 6.05E-02 4.37E-02 3.16E-02 2.55E-02 5.55E-03 3.54E-03 SO2 2.11E-04 1.53E-04 9.72E-06 8.16E-06 1.53E-06 1.28E-06 NOx 9.58E-05 8.79E-05 2.18E-05 1.83E-05 2.11E-06 1.77E-06 PM2.5 (incl. primary nitrates & sulphates) 1.46E-05 1.23E-05 7.10E-07 5.97E-07 5.46E-07 4.59E-07
Heavy Metals (total, unweighted) 1.49E-07 1.05E-07 2.93E-09 2.46E-09 8.63E-09 7.25E-09
NMVOC (total, unweighted) 1.82E-05 1.54E-05 1.60E-05 1.26E-05 4.51E-06 2.93E-06
Radioactive Emiss. (unweighted). 1.12E-09 8.09E-10 2.38E-12 2.00E-12 1.52E-09 1.27E-09
For heating systems, in general gas boilers have lower external costs than boilers burning light oil: the averages of considered systems are approximately 0.6 c€/kWhth vs. 0.94 c€/kWhth, respectively, with a quite narrow range of variation around them (Fig. 3). The upstream chain of gas and light oil contributes roughly one third to total external costs. GHG contribute two third of total external costs for oil, over 80% for gas boilers (Fig. 4). Burning heavy oil gives the highest damages with over 1.7 c€/kWhth (which is 80% higher than the external cost of 0.96 c€/kWhth calculated for the same plant burning light oil), where SO2 makes about 33% and GHG 38% of the damages.
A range of about 0.7 to 0.8 c€/kWhth has been calculated for wood conventional boilers, and the upstream chain contributes 20% to 30% to total damages. Therefore, with the base case damage factors, modern wood boilers rank in between oil and gas modern heating technologies, when the full chains are accounted for. Small particles and nitrogen oxides emissions contribute the most to total damages, i.e. nearly 60% and about 30%, respectively. The modern fireplace gives more than 1.5 c€/kWhth, mostly due to the relatively high particle release (75% of external cost). GHG contribute 7% or less to total external costs for modern wood systems, because the CO2 from wood combustion is compensated by tree sequestration.
The magnitude of external costs of heat pumps (HP) is controlled basically by two factors: the Seasonal Performance Factor (SPF) and the electricity supply source. For current systems and average UCTE electricity mix, the external costs are nearly 0.9 c€/kWhth and 0.7 c€/kWhth for the air-water HP and brine-water HP, respectively. These differences are mostly due to characteristics of the different natural heat reservoirs. For total cumulative GHG emissions from these heat pumps assumed to use R134a as refrigerant, the emissions of the refrigerant make roughly one tenth of the cumulative amounts.
With allocation by exergy, small decentralized cogeneration plants burning fossil fuels perform better compared to oil and natural gas boilers: 0.36 c€/kWhth for diesel and an average of 0.27 c€/kWhth calculated for the gas units.
Due to the fact that about 26% of the UCTE electricity mix is from coal systems, damages from SO2 contribute nearly one quarter to the total external costs, and together with PM2.5 and NOx they make nearly 50%. GHG damages make about 45% of the external costs. For future (2020-2030) HP technologies and electricity delivered by gas CC or nuclear, these costs go down to 0.26 c€/kWhth and 0.21 c€/kWhth, or nearly 0.08 c€/kWhth and 0.06 c€/kWhth, respectively for the two heat pump systems and the two electricity supply cases (Fig. 3). In case of electricity supply by gas CC, GHG make more than 80% of external costs, while for nuclear supply, GHG make 45% to 50% and the radioactivity accounts for roughly 40% of the external costs.

22
0.0
0.5
1.0
1.5
2.0
cond
-mod
<100k
W
cond
-mod
>100
kW
mod <10
0kW
mod >1
00kW
indus
trial >
100k
W
heav
y oil,
indus
trial 1
MW
light
oil, c
ond-
non-m
od 10
kW
light
oil, c
ond-
non-m
od 10
0kW
light
oil, n
on-m
od 10
kW
light
oil, n
on-m
od 10
0kW
light
oil, in
dustr
ial 1M
W
logs h
eater
6kW
logs 3
0kW
logs 1
00kW
chips
50kW
chips
300k
W
SCR 200k
We
Mini 2k
We
lean b
urn 50
kWe
lambd
a=1,
160k
We
lean b
urn 50
0kW
e
lean b
urn 1M
We
air-w
ater 1
0kW
UCTE-el
.
brine
-wate
r 10k
W UCTE-el
.
air-w
ater 1
0kW
futur
e CC-el
.
brine
-wate
r 10k
W futur
e CC-el
air-w
ater 1
0kW
futur
e nuc
lear-e
l.
brine
-wate
r 10k
W futur
e nuc
lear-e
l.
Ext
erna
l Cos
ts (E
uro
cent
/ kW
h th)
RestConversion unit
OilGas HPWood Cogeneration(all.exergy)
Die
sel
GasUCTE
El.CCEl.
nuclearEl.
Figure 3 External costs of heating systems, associated with emissions from the operation of
boiler/cogeneration unit and with the rest of energy chain.
0%
10%
20%
30%
40%
50%
60%
70%
80%
90%
100%
cond
mod
<100
kW
cond
mod
>100
kW
mod <1
00kW
mod >10
0kW
indus
trial >
100k
W
heav
y oil,
indus
trial 1
MW
light
oil, c
ond n
on-m
od 10
kW
light
oil, c
ond n
on-m
od 10
0kW
light
oil, n
on-m
od 10
kW
light
oil, n
on-m
od 10
0kW
light
oil, in
dustr
ial 1M
W
logs h
eater
6kW
logs 3
0kW
logs 1
00kW
chips
50kW
chips
300k
W
SCR 200k
We
Mini 2k
We
lean b
urn 50
kWe
lambd
a=1,
160k
We
lean b
urn 50
0kW
e
lean b
urn 1M
We
air-w
ater 1
0kW
UCTE-el
.
brine
-wate
r 10k
W UCTE-el
.
air-w
ater 1
0kW
futur
e CC-el
.
brine
-wate
r 10k
W fu
ture C
C-el
air-w
ater 1
0kW fu
ture n
uclea
r-el.
brine
-wate
r 10k
W fu
ture n
uclea
r-el.
Rad. Em.NMVOCHeavy MetalsPM2.5NOxSO2GHG
Gas Oil Wood HPCogeneration(all.exergy)
Figure 4 Contribution percent to external costs of heating systems by species. In conclusion, HP supplied by a highly efficient fossil electricity source or nuclear power plants or, obviously, by a renewable electricity source exhibit the lowest external costs among the heating systems, because no major changes can be expected for the fossil boilers nor dramatic improvements can be expected in their upstream chain.

23
2.6 Sensitivity analyses 2.6.1 Damage factors The external cost results shown above in Fig. 1 though 4 have been calculated using the base factors listed in Tab. 5. For sensitivity analysis, the same emission factors are combined with different sets of damage factors. The sensitivity cases reflect on the one hand the uncertainties of impacts, e.g. due to unknown emission locations or due to uncertainties of impact functions, and on the other hand the sensitivity to monetary valuation. These two groups are shown in Tab. 8 and 9, respectively.
Table 8 Damage factors per ton of pollutant emitted, for sensitivity analyses only. All, except for the last case, refer to emissions in the EU15 countries.
Species Sensitivity Local Sensitivity CO2-equivalent Low
Sensitivity PM10/PM2.5
Sensitivity EU25
Damage factors [€2000/tonne]
Damage factors [€2000/tonne]
Damage factors [€2000/tonne]
Damage factors [€2000/tonne]
CO2-equiv. 19 1 19 19 SO2 3524 2939 2939 3312 NOx 3021 2908 2908 3054 PM10 27042 11723 11723 11437 PM2.5 45070 19539 11723 19062 PM2.5-10 0 0 11723 0 Arsenic 80000 80000 80000 80000 Cadmium 39000 39000 39000 39000 Chromium 31500 31500 31500 31500 Chromium-VI 240000 240000 240000 240000 Chromium-other 0 0 0 0 Lead 1600000 1600000 1600000 1600000 Nickel 3800 3800 3800 3800 Formaldehyde 120 120 120 120 NMVOC 1124 1124 1124 1128 Nitrates, primary 13521 5862 5862 5719 Sulfates, primary 27042 11723 11723 11437 Radioactive emissions 50000 *
[€2000/DALY] 50000 *
[€2000/DALY]50000 *
[€2000/DALY] 50000 *
[€2000/DALY]* Disability-Adjusted Life Years (DALY), assuming equal to the unit value of chronic YOLL.
Sensitivity: Local (potentially higher local damages due to emissions in more densely populated areas)
The calculation of damage factors for ExternE is essentially based on the EcoSense model (European Commission 1999; Krewitt et al. 2001). In the current version of EcoSense, the regional atmospheric modelling is performed using a 50 km × 50 km grid. The regional model (WTM, Windrose Trajectory Model) includes complete emission, population and other data necessary for impact calculation. Thus the factors derived from the WTM model include all effects due to the considered pollutants in the given resolution of 50 km × 50 km.
In order to improve the accuracy of estimates of local effects, two principal lines have been followed in EcoSense:
a) For power plants, variants of the ISC (Industrial Source Complex) model have been implemented in EcoSense. The ISC model is usually applied within EcoSense on a 10 km × 10 km grid over an area of 100 km × 100 km with the emission source located in the centre.
b) For transport, special grids with high spatial resolutions have been added for some regions.
The disadvantage of the local models is the need of very detailed data of emission source locations, meteorology and receptor distribution.

24
The final report of NewExt (European Commission 2004) shows results for external cost factors per tonne emitted that have been used in NewExt for estimating damages from upstream/downstream processes of energy systems. The factors were derived from the regional Windrose Trajectory Model (WTM) with estimated correction factors to include local scale effects. The surplus factors were taken from the GREENSENSE study (European Commission 2003). The GREENSENSE study applies local damage factors from EcoSense transport calculations (urban, extra urban, highway). For each 50 km × 50 km grid cell with non-zero population, a local correction factor has been estimated in GREENSENSE. The link of these estimates to the ecoinvent life cycle assessment is not straightforward because it is not clear to which extent the assumptions about the locations fit together with the assumptions about processes in ecoinvent.
In order to give some indication about the sensitivity due to possible local effects as estimated in NewExt, the NewExt factors shown in Tab. 8, column “Sensitivity Local”, have been applied to the emission factors for the energy systems. The factors differ from the base factors mainly for primary particulates. The impacts on human health per tonne emitted primary fine particulates can be very high if the emissions take place in highly populated areas. The damage factors calculated in ExternE transport (European Commission 2000) show a strong variation depending on the different locations in Europe reaching from about 2000 Euro per tonne PM2.5 for some rural areas up to about 1 Million Euro per tonne PM2.5 for large cities like Paris or Athens centre. (Note that the impact functions used in this reference are now outdated but this is of secondary importance for the principal argument.) By contrast, the damage factors per tonne emitted NOx do not depend so much on the exact location within or around a city because the health impacts are assumed to result from secondary particulates the formation of which depends on the dispersion and mixing with other compounds in the atmosphere. (Nevertheless, NOx factors can differ significantly for different countries depending on meteorological conditions, background emissions and receptor distribution.)
Sensitivity: CO2-equivalent Low
The external cost estimates, in particular those for fossil systems, depend strongly on the assumptions about damage factors of CO2 and other GHG (i.e of CO2-equivalent). The impacts resulting from global warming are notoriously difficult to model and to valuate in monetary terms. Thus the corresponding damage factor is highly uncertain. For the base case, the damage factor (19 Euro per tonne emitted CO2-equivalent) from the NewExt study (European Commission 2004) has been applied. Within NewExt, this estimate has been derived from preferences revealed in international policy negotiations related to global warming and from public preferences revealed in referenda in Switzerland. The value is above the maximum of 16 Euro per ton emitted CO2 estimated earlier in ExternE (Tol and Downing 2000). Therefore, the external cost results calculated here are checked for sensitivity using a low estimate of the CO2-equivalent damage factor. For the low estimate, the factor based on CO2 world average values with 3% PRTP (pure rate of time preference) from (Tol and Downing 2000) has been used (1.0 Euro per tonne CO2, see Tab. 8). The minimum recommended marginal costs based on EU impacts only, with EU values and 3% PRTP, not applied here, were even another order of magnitude lower at 0.1 Euro per tonne CO2 (Tol and Downing 2000).
Sensitivity: PM10/PM2.5
The ecoinvent database provides emission data for PM2.5, i.e. particulates with an aerodynamic diameter below 2.5 µm, for particulates with diameter between 2.5 µm and 10 µm, and for particulates with diameter above 10 µm. In the base case, it has been assumed that the particulates health damages are exclusively due to the fraction PM2.5. Those particulates in PM10 with diameter between 2.5 µm and 10 µm have been neglected. The details of the mechanism causing health damages of particulates is still not fully understood, and therefore it is uncertain whether this assumption holds. Thus another sensitivity case was studied including all PM10 treated with a

25
common factor for PM10. According to the methodology part of this study, the PM10 factor was assumed to be 0.6 of the PM2.5 factor.
Sensitivity: Primary sulfates/nitrates
Further sources of uncertainty are damage factors for primary nitrates and primary sulfates emissions. The primary nitrates and sulfates emissions from power plants are usually not relevant (no direct emission have been accounted for from any of the conversion units described in ecoinvent), but some primary nitrates and sulfates can occur in the upstream part of the chain. It has been assumed that the damage factor for primary sulfates is the same as the one for PM10, and the damage factor of primary nitrates is 50% of this value. Because the emission location distribution and the dispersion of these species might differ from the parameters assumed for the PM10 factor, it is not clear if this assumption holds. Sensitivity analyses have been performed setting the sulfate and nitrate factor equal to zero. Because the differences to the base case have been found to be negligible due to very small contributions of primary sulfates and nitrates, the results are not shown here.
Sensitivity: EU25
The external cost estimates of the base case and of the other sensitivity cases shown refer to emission sources located in EU15. The calculations have been repeated with damage factors for EU25 in order to estimate the sensitivity to an extension of the emission source area. The modeling area of the impact assessment has not changed. The differences between the damage factors per tonne emitted pollutant for EU25 shown in Tab. 8 and the corresponding factors for EU15 shown in Tab. 5 are rather small.
Sensitivity to monetary valuation
During the recent ExternE study series, the impact functions but also the monetary unit values have been updated. The external cost estimates are particularly sensitive to the monetary value related to mortality. In ExternE, the monetary unit value of mortality impacts is expressed in terms of VOLY (value of a life year). Within the NexExt project, questionnaire surveys have been performed in Britain, France and Italy resulting in a VOLY of 50'000 Euro for chronic mortality. From this a value of 75'000 Euro for acute mortality was derived assuming a discount rate of 3%. The decisive value for chronic mortality is now about 50% of the chronic VOLY (96'500 Euro for 3% discounting) assumed in previous phases of ExternE (European Commission 1999; European Commission 2000). The error corrections or improvements of impact functions have to be distinguished from changes of the monetary valuation of mortality. Therefore some sensitivity cases combining the updated impact functions with the undiscounted NewExt valuation and the valuation before NewExt are shown. For simplicity, only the monetary unit values for chronic and acute mortality are changed, on the one hand because they have major influence on the results and on the other hand because the other major health impact unit values have changed compared to early estimates (European Commission 1999) but not compared to the year 2000 study (European Commission 2000). For crops and materials, only the latest monetary unit values are used because in this cases updates just reflect changes of market prices and thus the updated values can be regarded as conceptually unproblematic.
In order to combine the new impact factors with different valuation assumptions, EcoSenseLE (Droste-Franke and Deyneko 2004), a simplified version of the EcoSense model, has been used. Only the regional modeling results assuming high stack emissions for an average location in EU15 have been applied like in the base case.
Only the most important pollutants have been considered in the valuation sensitivity cases (Tab. 9), i.e. the heavy metals and formaldehyde have been neglected due to lack of information about the impact details (chronic mortality, acute mortality, diseases). This leads to a certain underestimation of the external costs, in particular for electricity from photovoltaic panels and wind power plants as shown in Fig. 2. Thus the results of the valuation sensitivity are not fully
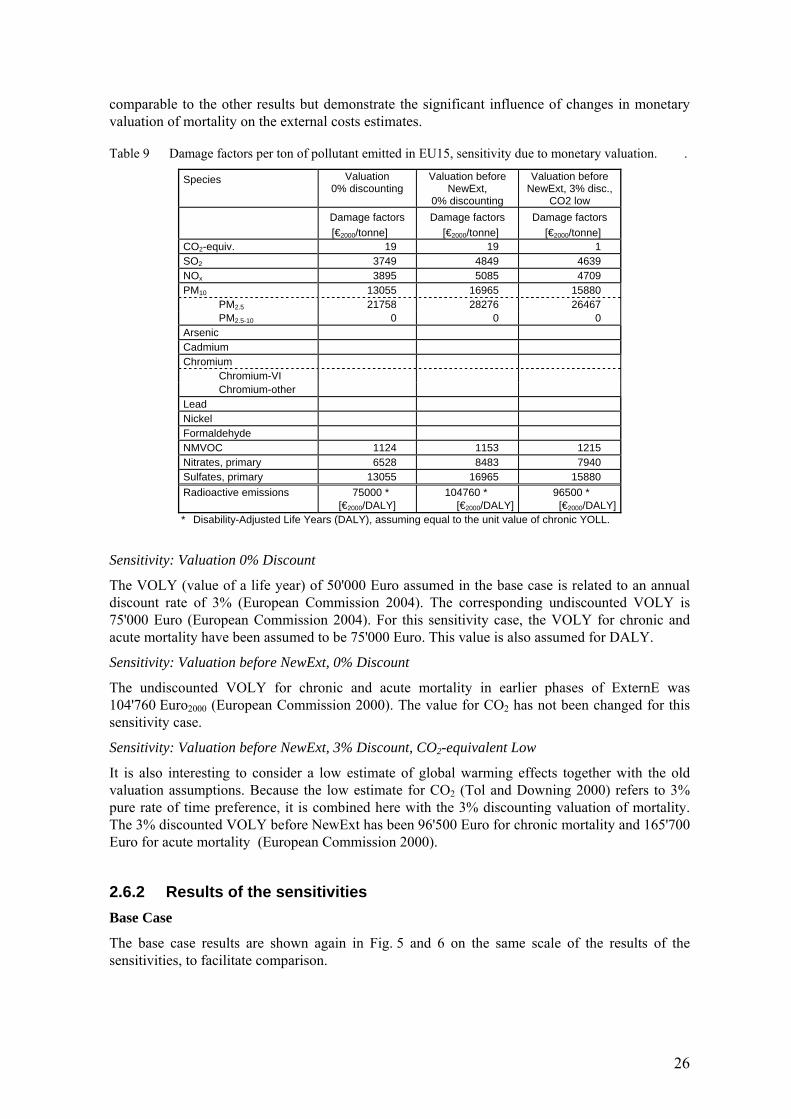
26
comparable to the other results but demonstrate the significant influence of changes in monetary valuation of mortality on the external costs estimates.
Table 9 Damage factors per ton of pollutant emitted in EU15, sensitivity due to monetary valuation. .
Species Valuation 0% discounting
Valuation before NewExt,
0% discounting
Valuation before NewExt, 3% disc.,
CO2 low
Damage factors [€2000/tonne]
Damage factors [€2000/tonne]
Damage factors [€2000/tonne]
CO2-equiv. 19 19 1 SO2 3749 4849 4639 NOx 3895 5085 4709 PM10 13055 16965 15880 PM2.5 21758 28276 26467 PM2.5-10 0 0 0 Arsenic Cadmium Chromium Chromium-VI Chromium-other Lead Nickel Formaldehyde NMVOC 1124 1153 1215 Nitrates, primary 6528 8483 7940 Sulfates, primary 13055 16965 15880 Radioactive emissions 75000 *
[€2000/DALY] 104760 *
[€2000/DALY]96500 *
[€2000/DALY] * Disability-Adjusted Life Years (DALY), assuming equal to the unit value of chronic YOLL.
Sensitivity: Valuation 0% Discount
The VOLY (value of a life year) of 50'000 Euro assumed in the base case is related to an annual discount rate of 3% (European Commission 2004). The corresponding undiscounted VOLY is 75'000 Euro (European Commission 2004). For this sensitivity case, the VOLY for chronic and acute mortality have been assumed to be 75'000 Euro. This value is also assumed for DALY.
Sensitivity: Valuation before NewExt, 0% Discount
The undiscounted VOLY for chronic and acute mortality in earlier phases of ExternE was 104'760 Euro2000 (European Commission 2000). The value for CO2 has not been changed for this sensitivity case.
Sensitivity: Valuation before NewExt, 3% Discount, CO2-equivalent Low
It is also interesting to consider a low estimate of global warming effects together with the old valuation assumptions. Because the low estimate for CO2 (Tol and Downing 2000) refers to 3% pure rate of time preference, it is combined here with the 3% discounting valuation of mortality. The 3% discounted VOLY before NewExt has been 96'500 Euro for chronic mortality and 165'700 Euro for acute mortality (European Commission 2000).
2.6.2 Results of the sensitivities Base Case
The base case results are shown again in Fig. 5 and 6 on the same scale of the results of the sensitivities, to facilitate comparison.
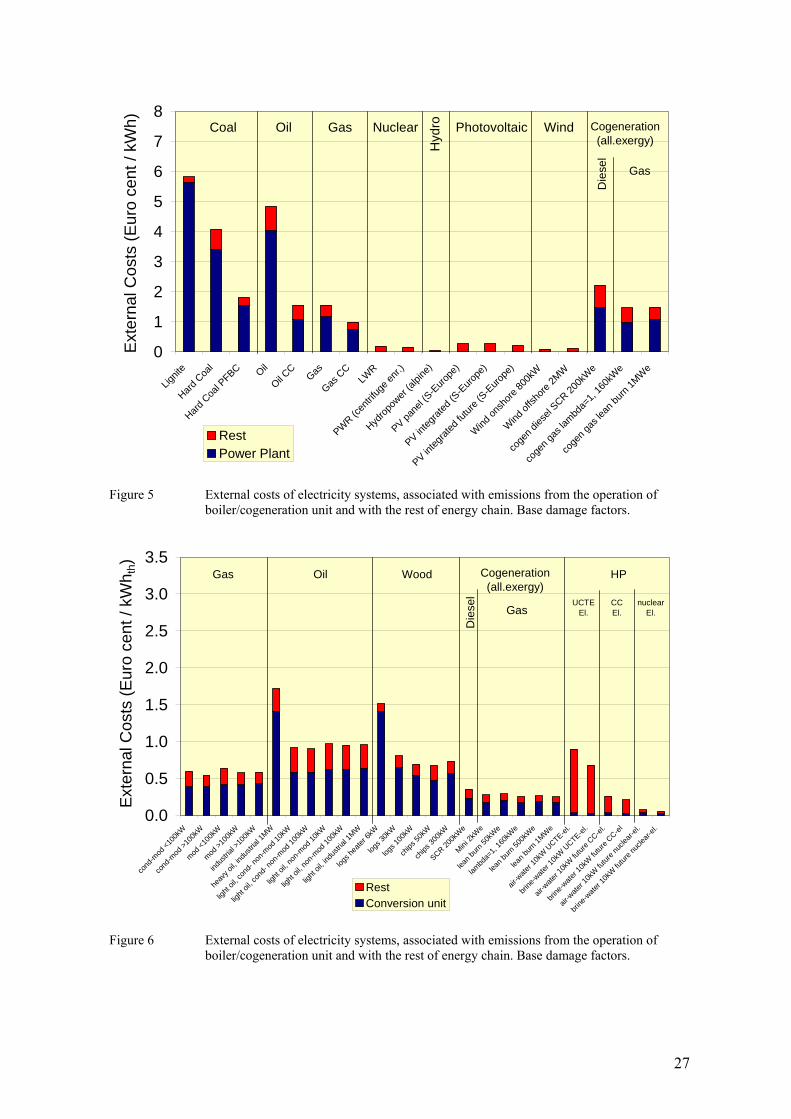
27
0
1
2
3
4
5
6
7
8
Lignit
e
Hard C
oal
Hard C
oal P
FBC Oil
Oil CC
Gas
Gas C
CLW
R
PWR (c
entrif
uge e
nr.)
Hydrop
ower
(alpin
e)
PV pane
l (S-E
urope
)
PV integ
rated
(S-E
urope
)
PV integ
rated
futur
e (S-E
urope
)
Wind on
shore
800k
W
Wind
offsh
ore 2M
W
coge
n dies
el SCR 20
0kW
e
coge
n gas
lambd
a=1,
160k
We
coge
n gas
lean
burn
1MW
e
Ext
erna
l Cos
ts (E
uro
cent
/ kW
h)
RestPower Plant
Coal Oil Gas Nuclear
Hyd
ro
Gas
Photovoltaic Wind Cogeneration(all.exergy)
Die
sel
Figure 5 External costs of electricity systems, associated with emissions from the operation of
boiler/cogeneration unit and with the rest of energy chain. Base damage factors.
0.0
0.5
1.0
1.5
2.0
2.5
3.0
3.5
cond
-mod
<100
kW
cond
-mod
>100
kW
mod <10
0kW
mod >1
00kW
indus
trial >
100k
W
heav
y oil,
indus
trial 1
MW
light
oil, c
ond-
non-m
od 10
kW
light
oil, c
ond-
non-m
od 10
0kW
light
oil, n
on-m
od 10
kW
light
oil, n
on-m
od 10
0kW
light
oil, in
dustr
ial 1M
W
logs h
eater
6kW
logs 3
0kW
logs 1
00kW
chips
50kW
chips
300k
W
SCR 200k
We
Mini 2k
We
lean b
urn 50
kWe
lambd
a=1,
160k
We
lean b
urn 50
0kW
e
lean b
urn 1M
We
air-w
ater 1
0kW
UCTE-el
.
brine
-wate
r 10k
W UCTE-el
.
air-w
ater 1
0kW fu
ture C
C-el.
brine
-wate
r 10k
W futur
e CC-el
air-w
ater 1
0kW
futur
e nuc
lear-e
l.
brine
-wate
r 10k
W futur
e nuc
lear-e
l.
Ext
erna
l Cos
ts (E
uro
cent
/ kW
h th)
RestConversion unit
OilGas HPWood Cogeneration(all.exergy)
Die
sel
GasUCTE
El.CCEl.
nuclearEl.
Figure 6 External costs of electricity systems, associated with emissions from the operation of
boiler/cogeneration unit and with the rest of energy chain. Base damage factors.
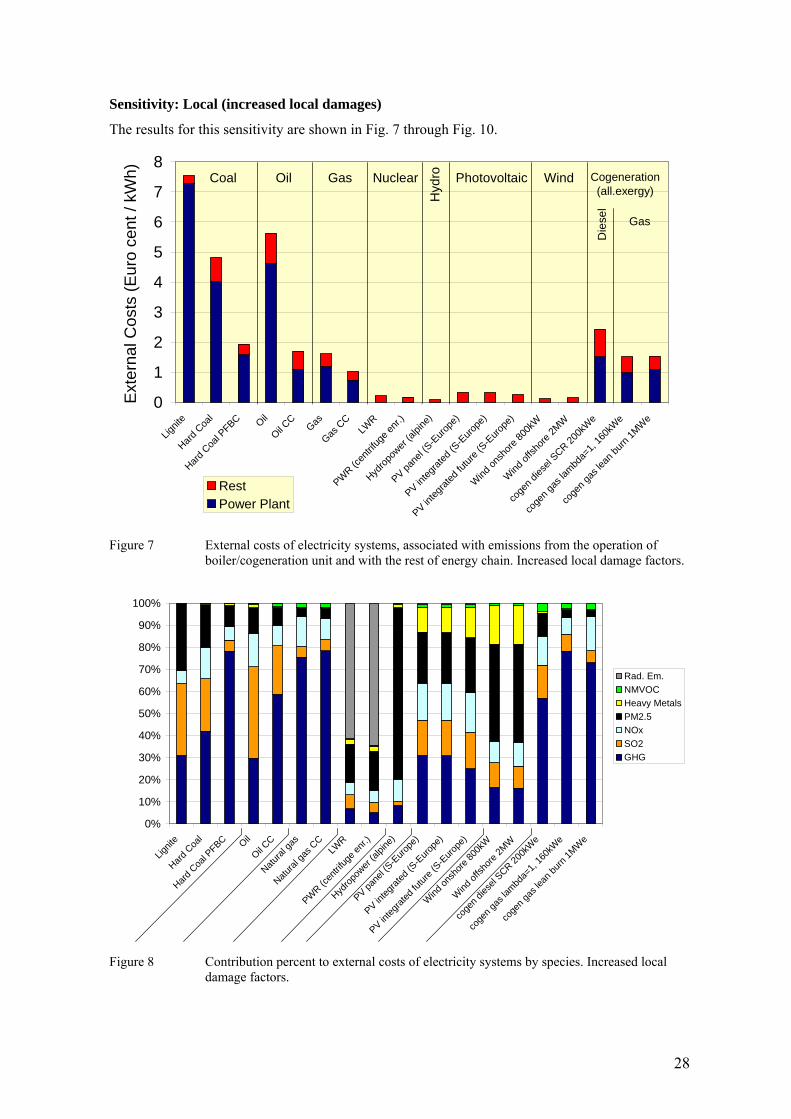
28
Sensitivity: Local (increased local damages)
The results for this sensitivity are shown in Fig. 7 through Fig. 10.
0
1
2
3
4
5
6
7
8
Lignit
e
Hard C
oal
Hard C
oal P
FBC Oil
Oil CC
Gas
Gas C
CLW
R
PWR (c
entrif
uge e
nr.)
Hydrop
ower
(alpin
e)
PV pane
l (S-E
urope
)
PV integ
rated
(S-E
urope
)
PV integ
rated
futur
e (S-E
urope
)
Wind on
shore
800k
W
Wind
offsh
ore 2M
W
coge
n dies
el SCR 20
0kW
e
coge
n gas
lambd
a=1,
160k
We
coge
n gas
lean
burn
1MW
e
Ext
erna
l Cos
ts (E
uro
cent
/ kW
h)
RestPower Plant
Coal Oil Gas Nuclear
Hyd
ro
Gas
Photovoltaic Wind Cogeneration(all.exergy)
Die
sel
Figure 7 External costs of electricity systems, associated with emissions from the operation of
boiler/cogeneration unit and with the rest of energy chain. Increased local damage factors.
0%
10%
20%
30%
40%
50%
60%
70%
80%
90%
100%
Lignit
e
Hard C
oal
Hard C
oal P
FBC Oil
Oil CC
Natural
gas
Natural
gas C
CLW
R
PWR (c
entrif
uge e
nr.)
Hydrop
ower
(alpin
e)
PV pane
l (S-E
urope
)
PV integ
rated
(S-E
urope
)
PV integ
rated
futur
e (S-E
urope
)
Wind
onsh
ore 80
0kW
Wind
offsh
ore 2M
W
coge
n dies
el SCR 20
0kW
e
coge
n gas
lambd
a=1,
160k
We
coge
n gas
lean
burn
1MW
e
Rad. Em.NMVOCHeavy MetalsPM2.5NOxSO2GHG
Figure 8 Contribution percent to external costs of electricity systems by species. Increased local
damage factors.

29
With factors for SO2 and PM reflecting increased local impacts, Oil and Coal systems exhibit the greatest variation for the electricity systems compared to the results for the Base Case. External costs increase by nearly 30% for Lignite electricity, 16% and 18% for Oil and Hard Coal average, respectively, 7% and 9% for Coal PFBC and Oil CC, respectively. Only about 4% variations are calculated for gas systems. Nuclear external costs increase by 12%, hydropower by 80%, PV by about 20%, and wind by 37%, prevalently for the PM emissions. However, the ranking of systems is not affected by this different set of damage factors. (Note however that this sensitivity case does not take into account differences of local effects of different systems.) Cogeneration diesel external costs increase by nearly 10%, while gas cogeneration systems increase only by 3% - 4%.
Compared to the Base Case, Oil heating systems’ external costs increase by 30% if fuelled by heavy oil, 9% if fuelled by light oil, while the increase for gas systems remains on the order of 4%. Oil and Gas cogeneration system also are affected by similar increases as for the respective boilers. Due to the coal component of the UCTE electricity mix, the external costs of HP driven by this electricity increase by more than 20%. Increases for HP driven by other electricity supply systems slightly increase along with the external costs of the electricity generation discussed in the previous paragraph.
0.0
0.5
1.0
1.5
2.0
2.5
3.0
3.5
cond
-mod
<100
kW
cond
-mod
>100
kW
mod <10
0kW
mod >1
00kW
indus
trial >
100k
W
heav
y oil,
indus
trial 1
MW
light
oil, c
ond-
non-m
od 10
kW
light
oil, c
ond-
non-m
od 10
0kW
light
oil, n
on-m
od 10
kW
light
oil, n
on-m
od 10
0kW
light
oil, in
dustr
ial 1M
W
logs h
eater
6kW
logs 3
0kW
logs 1
00kW
chips
50kW
chips
300k
W
SCR 200k
We
Mini 2k
We
lean b
urn 50
kWe
lambd
a=1,
160k
We
lean b
urn 50
0kW
e
lean b
urn 1M
We
air-w
ater 1
0kW
UCTE-el
.
brine
-wate
r 10k
W UCTE-el
.
air-w
ater 1
0kW fu
ture C
C-el.
brine
-wate
r 10k
W futur
e CC-el
air-w
ater 1
0kW
futur
e nuc
lear-e
l.
brine
-wate
r 10k
W futur
e nuc
lear-e
l.
Ext
erna
l Cos
ts (E
uro
cent
/ kW
h th)
RestConversion unit
OilGas HPWood Cogeneration(all.exergy)
Die
sel
GasUCTE
El.CCEl.
nuclearEl.
Figure 9 External costs of electricity systems, associated with emissions from the operation of
boiler/cogeneration unit and with the rest of energy chain. Increased local damage factors.
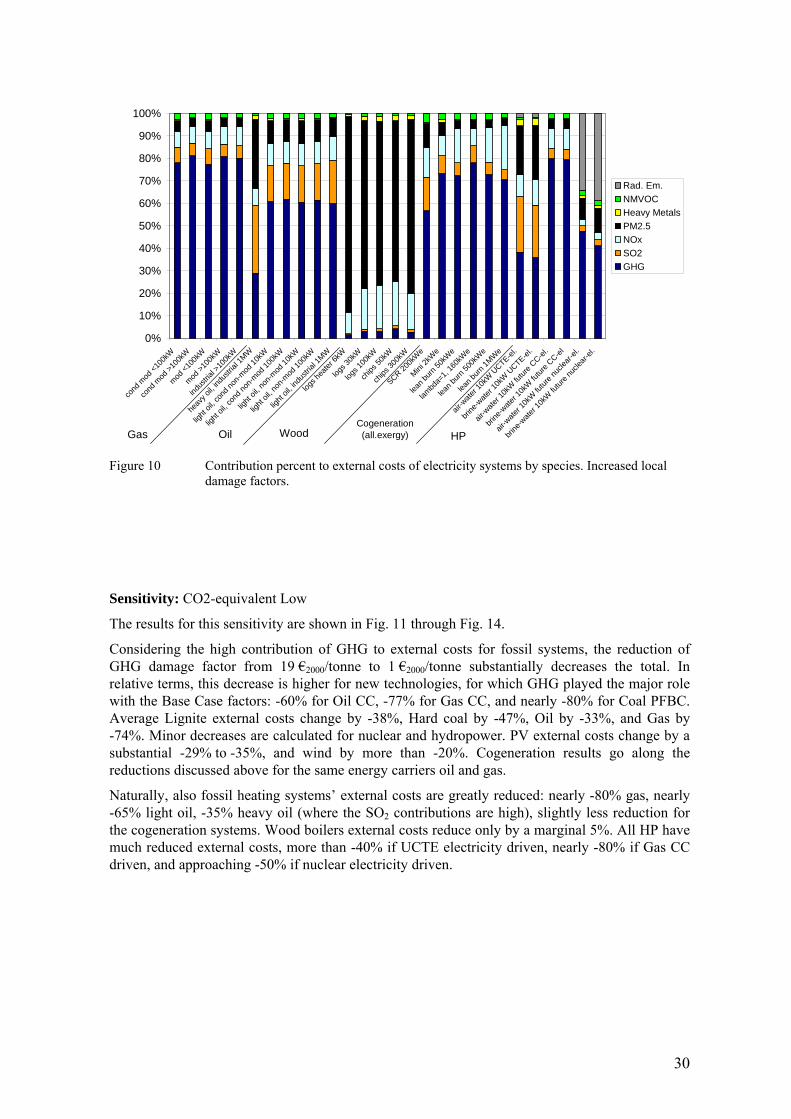
30
0%
10%
20%
30%
40%
50%
60%
70%
80%
90%
100%
cond
mod
<100
kW
cond
mod
>100
kW
mod <1
00kW
mod >1
00kW
indus
trial >
100k
W
heav
y oil,
indus
trial 1
MW
light
oil, c
ond n
on-m
od 10
kW
light
oil, c
ond n
on-m
od 10
0kW
light
oil, n
on-m
od 10
kW
light
oil, n
on-m
od 10
0kW
light
oil, in
dustr
ial 1M
W
logs h
eater
6kW
logs 3
0kW
logs 1
00kW
chips
50kW
chips
300k
W
SCR 200k
We
Mini 2k
We
lean b
urn 50
kWe
lambd
a=1,
160k
We
lean b
urn 50
0kW
e
lean b
urn 1M
We
air-w
ater 1
0kW
UCTE-el
.
brine
-wate
r 10k
W U
CTE-el.
air-w
ater 1
0kW
futur
e CC-el
.
brine
-wate
r 10k
W fu
ture C
C-el
air-w
ater 1
0kW
futur
e nuc
lear-e
l.
brine
-wate
r 10k
W fu
ture n
uclea
r-el.
Rad. Em.NMVOCHeavy MetalsPM2.5NOxSO2GHG
Gas Oil Wood HPCogeneration(all.exergy)
Figure 10 Contribution percent to external costs of electricity systems by species. Increased local
damage factors.
Sensitivity: CO2-equivalent Low
The results for this sensitivity are shown in Fig. 11 through Fig. 14.
Considering the high contribution of GHG to external costs for fossil systems, the reduction of GHG damage factor from 19 €2000/tonne to 1 €2000/tonne substantially decreases the total. In relative terms, this decrease is higher for new technologies, for which GHG played the major role with the Base Case factors: -60% for Oil CC, -77% for Gas CC, and nearly -80% for Coal PFBC. Average Lignite external costs change by -38%, Hard coal by -47%, Oil by -33%, and Gas by -74%. Minor decreases are calculated for nuclear and hydropower. PV external costs change by a substantial -29% to -35%, and wind by more than -20%. Cogeneration results go along the reductions discussed above for the same energy carriers oil and gas.
Naturally, also fossil heating systems’ external costs are greatly reduced: nearly -80% gas, nearly -65% light oil, -35% heavy oil (where the SO2 contributions are high), slightly less reduction for the cogeneration systems. Wood boilers external costs reduce only by a marginal 5%. All HP have much reduced external costs, more than -40% if UCTE electricity driven, nearly -80% if Gas CC driven, and approaching -50% if nuclear electricity driven.
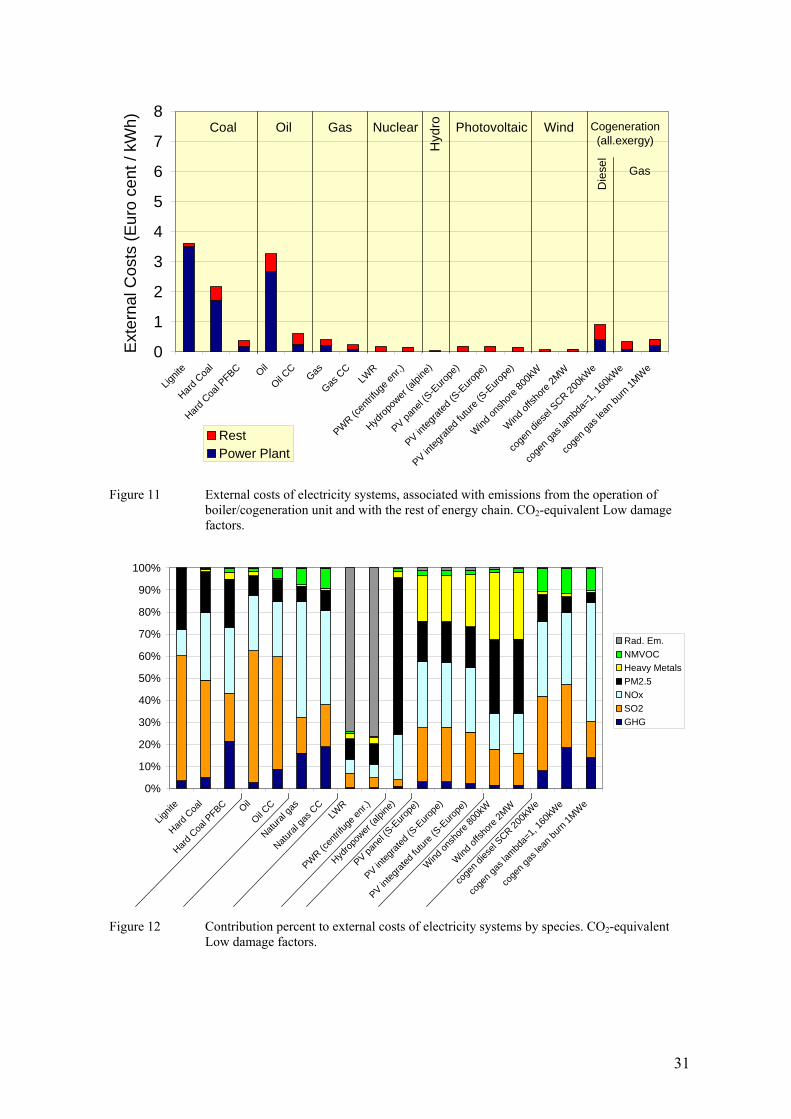
31
0
1
2
3
4
5
6
7
8
Lignit
e
Hard C
oal
Hard C
oal P
FBC Oil
Oil CC
Gas
Gas C
CLW
R
PWR (c
entrif
uge e
nr.)
Hydrop
ower
(alpin
e)
PV pane
l (S-E
urope
)
PV integ
rated
(S-E
urope
)
PV integ
rated
futur
e (S-E
urope
)
Wind on
shore
800k
W
Wind
offsh
ore 2M
W
coge
n dies
el SCR 20
0kW
e
coge
n gas
lambd
a=1,
160k
We
coge
n gas
lean
burn
1MW
e
Ext
erna
l Cos
ts (E
uro
cent
/ kW
h)
RestPower Plant
Coal Oil Gas Nuclear
Hyd
ro
Gas
Photovoltaic Wind Cogeneration(all.exergy)
Die
sel
Figure 11 External costs of electricity systems, associated with emissions from the operation of
boiler/cogeneration unit and with the rest of energy chain. CO2-equivalent Low damage factors.
0%
10%
20%
30%
40%
50%
60%
70%
80%
90%
100%
Lignit
e
Hard C
oal
Hard C
oal P
FBC Oil
Oil CC
Natural
gas
Natural
gas C
CLW
R
PWR (c
entrif
uge e
nr.)
Hydrop
ower
(alpin
e)
PV pane
l (S-E
urope
)
PV integ
rated
(S-E
urope
)
PV integ
rated
futur
e (S-E
urope
)
Wind
onsh
ore 80
0kW
Wind
offsh
ore 2M
W
coge
n dies
el SCR 20
0kW
e
coge
n gas
lambd
a=1,
160k
We
coge
n gas
lean
burn
1MW
e
Rad. Em.NMVOCHeavy MetalsPM2.5NOxSO2GHG
Figure 12 Contribution percent to external costs of electricity systems by species. CO2-equivalent
Low damage factors.

32
0.0
0.5
1.0
1.5
2.0
2.5
3.0
3.5
cond
-mod
<100
kW
cond
-mod
>100
kW
mod <10
0kW
mod >1
00kW
indus
trial >
100k
W
heav
y oil,
indus
trial 1
MW
light
oil, c
ond-
non-m
od 10
kW
light
oil, c
ond-
non-m
od 10
0kW
light
oil, n
on-m
od 10
kW
light
oil, n
on-m
od 10
0kW
light
oil, in
dustr
ial 1M
W
logs h
eater
6kW
logs 3
0kW
logs 1
00kW
chips
50kW
chips
300k
W
SCR 200k
We
Mini 2k
We
lean b
urn 50
kWe
lambd
a=1,
160k
We
lean b
urn 50
0kW
e
lean b
urn 1M
We
air-w
ater 1
0kW
UCTE-el
.
brine
-wate
r 10k
W UCTE-el
.
air-w
ater 1
0kW fu
ture C
C-el.
brine
-wate
r 10k
W futur
e CC-el
air-w
ater 1
0kW
futur
e nuc
lear-e
l.
brine
-wate
r 10k
W futur
e nuc
lear-e
l.
Ext
erna
l Cos
ts (E
uro
cent
/ kW
h th)
RestConversion unit
OilGas HPWood Cogeneration(all.exergy)
Die
sel
GasUCTE
El.CCEl.
nuclearEl.
Figure 13 External costs of electricity systems, associated with emissions from the operation of
boiler/cogeneration unit and with the rest of energy chain. CO2-equivalent Low damage factors.
0%
10%
20%
30%
40%
50%
60%
70%
80%
90%
100%
cond
mod
<100
kW
cond
mod
>100
kW
mod <1
00kW
mod >1
00kW
indus
trial >
100k
W
heav
y oil,
indus
trial 1
MW
light
oil, c
ond n
on-m
od 10
kW
light
oil, c
ond n
on-m
od 10
0kW
light
oil, n
on-m
od 10
kW
light
oil, n
on-m
od 10
0kW
light
oil, in
dustr
ial 1M
W
logs h
eater
6kW
logs 3
0kW
logs 1
00kW
chips
50kW
chips
300k
W
SCR 200k
We
Mini 2k
We
lean b
urn 50
kWe
lambd
a=1,
160k
We
lean b
urn 50
0kW
e
lean b
urn 1M
We
air-w
ater 1
0kW
UCTE-el
.
brine
-wate
r 10k
W U
CTE-el.
air-w
ater 1
0kW
futur
e CC-el
.
brine
-wate
r 10k
W fu
ture C
C-el
air-w
ater 1
0kW
futur
e nuc
lear-e
l.
brine
-wate
r 10k
W fu
ture n
uclea
r-el.
Rad. Em.NMVOCHeavy MetalsPM2.5NOxSO2GHG
Gas Oil Wood HPCogeneration(all.exergy)
Figure 14 Contribution percent to external costs of electricity systems by species. CO2-equivalent
Low damage factors.

33
Sensitivity: PM10/PM2.5
The results for this sensitivity are shown in Fig. 15 through Fig. 18.
0
1
2
3
4
5
6
7
8
Lignit
e
Hard C
oal
Hard C
oal P
FBC Oil
Oil CC
Gas
Gas C
CLW
R
PWR (c
entrif
uge e
nr.)
Hydrop
ower
(alpin
e)
PV pane
l (S-E
urope
)
PV integ
rated
(S-E
urope
)
PV integ
rated
futur
e (S-E
urope
)
Wind on
shore
800k
W
Wind
offsh
ore 2M
W
coge
n dies
el SCR 20
0kW
e
coge
n gas
lambd
a=1,
160k
We
coge
n gas
lean
burn
1MW
e
Ext
erna
l Cos
ts (E
uro
cent
/ kW
h)
RestPower Plant
Coal Oil Gas Nuclear
Hyd
ro
Gas
Photovoltaic Wind Cogeneration(all.exergy)
Die
sel
Figure 15 External costs of electricity systems, associated with emissions from the operation of
boiler/cogeneration unit and with the rest of energy chain. PM10/PM2.5 damage factors.
0%
10%
20%
30%
40%
50%
60%
70%
80%
90%
100%
Lignit
e
Hard C
oal
Hard C
oal P
FBC Oil
Oil CC
Natural
gas
Natural
gas C
CLW
R
PWR (c
entrif
uge e
nr.)
Hydrop
ower
(alpin
e)
PV pane
l (S-E
urope
)
PV integ
rated
(S-E
urope
)
PV integ
rated
futur
e (S-E
urope
)
Wind
onsh
ore 80
0kW
Wind
offsh
ore 2M
W
coge
n dies
el SCR 20
0kW
e
coge
n gas
lambd
a=1,
160k
We
coge
n gas
lean
burn
1MW
e
Rad. Em.NMVOCHeavy MetalsPM10NOxSO2GHG
Figure 16 Contribution percent to external costs of electricity systems by species. PM10/PM2.5
damage factors.

34
Coal systems external costs change by only a few percent, average Oil and Nuclear by 2%, and Oil CC and Gas negligibly. Hydropower external costs increases by 150% instead, depending on the relatively high contribution from PM emitted during dam construction to total external costs. PV external costs increase 10% and Wind 17% and 30% depending whether onshore or offshore (the latter has higher material manufacturing requirements, with associated higher PM released per functional unit).
Only remarkable change of external costs is calculated for the wood systems, for which PM emissions are relatively more important than for other heating systems: -30% for the fireplace, about -20% for logs and chips boilers.2
0.0
0.5
1.0
1.5
2.0
2.5
3.0
3.5
cond
-mod
<100
kW
cond
-mod
>100
kW
mod <10
0kW
mod >1
00kW
indus
trial >
100k
W
heav
y oil,
indus
trial 1
MW
light
oil, c
ond-
non-m
od 10
kW
light
oil, c
ond-
non-m
od 10
0kW
light
oil, n
on-m
od 10
kW
light
oil, n
on-m
od 10
0kW
light
oil, in
dustr
ial 1M
W
logs h
eater
6kW
logs 3
0kW
logs 1
00kW
chips
50kW
chips
300k
W
SCR 200k
We
Mini 2k
We
lean b
urn 50
kWe
lambd
a=1,
160k
We
lean b
urn 50
0kW
e
lean b
urn 1M
We
air-w
ater 1
0kW
UCTE-el
.
brine
-wate
r 10k
W UCTE-el
.
air-w
ater 1
0kW fu
ture C
C-el.
brine
-wate
r 10k
W futur
e CC-el
air-w
ater 1
0kW
futur
e nuc
lear-e
l.
brine
-wate
r 10k
W futur
e nuc
lear-e
l.
Ext
erna
l Cos
ts (E
uro
cent
/ kW
h th)
RestConversion unit
OilGas HPWood Cogeneration(all.exergy)
Die
sel
GasUCTE
El.CCEl.
nuclearEl.
Figure 17 External costs of electricity systems, associated with emissions from the operation of
boiler/cogeneration unit and with the rest of energy chain. PM10/PM2.5 damage factors.
2 The lower change of -12% calculated for 50 kW boilers burning chips is an effect of the direct emission value of PM
emitted by the boiler, assumed lower than in the case of the 300 kW boiler (Bauer 2003).

35
0%
10%
20%
30%
40%
50%
60%
70%
80%
90%
100%
cond
mod
<100
kW
cond
mod
>100
kW
mod <1
00kW
mod >1
00kW
indus
trial >
100k
W
heav
y oil,
indus
trial 1
MW
light
oil, c
ond n
on-m
od 10
kW
light
oil, c
ond n
on-m
od 10
0kW
light
oil, n
on-m
od 10
kW
light
oil, n
on-m
od 10
0kW
light
oil, in
dustr
ial 1M
W
logs h
eater
6kW
logs 3
0kW
logs 1
00kW
chips
50kW
chips
300k
W
SCR 200k
We
Mini 2k
We
lean b
urn 50
kWe
lambd
a=1,
160k
We
lean b
urn 50
0kW
e
lean b
urn 1M
We
air-w
ater 1
0kW
UCTE-el
.
brine
-wate
r 10k
W U
CTE-el.
air-w
ater 1
0kW
futur
e CC-el
.
brine
-wate
r 10k
W fu
ture C
C-el
air-w
ater 1
0kW
futur
e nuc
lear-e
l.
brine
-wate
r 10k
W fu
ture n
uclea
r-el.
Rad. Em.NMVOCHeavy MetalsPM10NOxSO2GHG
Gas Oil Wood HPCogeneration(all.exergy)
Figure 18 Contribution percent to external costs of electricity systems by species. PM10/PM2.5
damage factors.
Sensitivity: EU25
The results for this sensitivity are shown in Fig. 19 through Fig. 22.
0
1
2
3
4
5
6
7
8
Lignit
e
Hard C
oal
Hard C
oal P
FBC Oil
Oil CC
Gas
Gas C
CLW
R
PWR (c
entrif
uge e
nr.)
Hydrop
ower
(alpin
e)
PV pane
l (S-E
urope
)
PV integ
rated
(S-E
urope
)
PV integ
rated
futur
e (S-E
urope
)
Wind on
shore
800k
W
Wind
offsh
ore 2M
W
coge
n dies
el SCR 20
0kW
e
coge
n gas
lambd
a=1,
160k
We
coge
n gas
lean
burn
1MW
e
Ext
erna
l Cos
ts (E
uro
cent
/ kW
h)
RestPower Plant
Coal Oil Gas Nuclear
Hyd
ro
Gas
Photovoltaic Wind Cogeneration(all.exergy)
Die
sel
Figure 19 External costs of electricity systems, associated with emissions from the operation of
boiler/cogeneration unit and with the rest of energy chain. EU25 damage factors.

36
Only minor differences are calculated for electricity systems compared to the Base Case. The highest changes are for average Oil, nearly 6%, and Lignite, 4%. For all other systems, the changes are lower or even negligible. For heating systems, the highest change is for heavy oil industrial boiler: 4%. For all other systems the calculated changes are lower or negligible.
0%
10%
20%
30%
40%
50%
60%
70%
80%
90%
100%
Lignit
e
Hard C
oal
Hard C
oal P
FBC Oil
Oil CC
Natural
gas
Natural
gas C
CLW
R
PWR (c
entrif
uge e
nr.)
Hydrop
ower
(alpin
e)
PV pane
l (S-E
urope
)
PV integ
rated
(S-E
urope
)
PV integ
rated
futur
e (S-E
urope
)
Wind
onsh
ore 80
0kW
Wind
offsh
ore 2M
W
coge
n dies
el SCR 20
0kW
e
coge
n gas
lambd
a=1,
160k
We
coge
n gas
lean
burn
1MW
e
Rad. Em.NMVOCHeavy MetalsPM2.5NOxSO2GHG
Figure 20 Contribution percent to external costs of electricity systems by species. EU25 damage
factors.
0.0
0.5
1.0
1.5
2.0
2.5
3.0
3.5
cond
-mod
<100
kW
cond
-mod
>100
kW
mod <10
0kW
mod >1
00kW
indus
trial >
100k
W
heav
y oil,
indus
trial 1
MW
light
oil, c
ond-
non-m
od 10
kW
light
oil, c
ond-
non-m
od 10
0kW
light
oil, n
on-m
od 10
kW
light
oil, n
on-m
od 10
0kW
light
oil, in
dustr
ial 1M
W
logs h
eater
6kW
logs 3
0kW
logs 1
00kW
chips
50kW
chips
300k
W
SCR 200k
We
Mini 2k
We
lean b
urn 50
kWe
lambd
a=1,
160k
We
lean b
urn 50
0kW
e
lean b
urn 1M
We
air-w
ater 1
0kW
UCTE-el
.
brine
-wate
r 10k
W UCTE-el
.
air-w
ater 1
0kW fu
ture C
C-el.
brine
-wate
r 10k
W futur
e CC-el
air-w
ater 1
0kW
futur
e nuc
lear-e
l.
brine
-wate
r 10k
W futur
e nuc
lear-e
l.
Ext
erna
l Cos
ts (E
uro
cent
/ kW
h th)
RestConversion unit
OilGas HPWood Cogeneration(all.exergy)
Die
sel
GasUCTE
El.CCEl.
nuclearEl.
Figure 21 External costs of electricity systems, associated with emissions from the operation of
boiler/cogeneration unit and with the rest of energy chain. EU25 damage factors.

37
0%
10%
20%
30%
40%
50%
60%
70%
80%
90%
100%
cond
mod
<100
kW
cond
mod
>100
kW
mod <1
00kW
mod >1
00kW
indus
trial >
100k
W
heav
y oil,
indus
trial 1
MW
light
oil, c
ond n
on-m
od 10
kW
light
oil, c
ond n
on-m
od 10
0kW
light
oil, n
on-m
od 10
kW
light
oil, n
on-m
od 10
0kW
light
oil, in
dustr
ial 1M
W
logs h
eater
6kW
logs 3
0kW
logs 1
00kW
chips
50kW
chips
300k
W
SCR 200k
We
Mini 2k
We
lean b
urn 50
kWe
lambd
a=1,
160k
We
lean b
urn 50
0kW
e
lean b
urn 1M
We
air-w
ater 1
0kW
UCTE-el
.
brine
-wate
r 10k
W U
CTE-el.
air-w
ater 1
0kW
futur
e CC-el
.
brine
-wate
r 10k
W fu
ture C
C-el
air-w
ater 1
0kW
futur
e nuc
lear-e
l.
brine
-wate
r 10k
W fu
ture n
uclea
r-el.
Rad. Em.NMVOCHeavy MetalsPM2.5NOxSO2GHG
Gas Oil Wood HPCogeneration(all.exergy)
Figure 22 Contribution percent to external costs of electricity systems by species. EU25damage
factors.
Sensitivity: Valuation 0% Discounting
The results for this sensitivity are shown in Fig. 23 through Fig. 26.
Systems with relatively high SO2, NOx, and PM emissions are obviously penalized: 14% current Lignite; 13% current Hard coal; and, 16% current Oil. External costs for new fossil technologies change less, 4% Coal PFBC, 9% Oil CC. Natural gas system change about 5% - 6%. Nuclear systems’ results increase about 37%, due to assumed 50% increase of the Euro/DALY. Changes for PV are negligible. Wind external costs increase by 13%, and hydropower by 12%.
Increases are calculated also for fossil heating systems, especially for heavy oil (12%), light oil (7% - 8%), and wood (14%), whereas gas boilers increase is minor (4%). All HP have increased external costs: 10% if UCTE electricity driven; 4% if Gas CC driven; and, about 20% if nuclear electricity driven.

38
0
1
2
3
4
5
6
7
8
Lignit
e
Hard C
oal
Hard C
oal P
FBC Oil
Oil CC
Gas
Gas C
CLW
R
PWR (c
entrif
uge e
nr.)
Hydrop
ower
(alpin
e)
PV pane
l (S-E
urope
)
PV integ
rated
(S-E
urope
)
PV integ
rated
futur
e (S-E
urope
)
Wind on
shore
800k
W
Wind
offsh
ore 2M
W
coge
n dies
el SCR 20
0kW
e
coge
n gas
lambd
a=1,
160k
We
coge
n gas
lean
burn
1MW
e
Ext
erna
l Cos
ts (E
uro
cent
/ kW
h)
RestPower Plant
Coal Oil Gas Nuclear
Hyd
ro
Gas
Photovoltaic Wind Cogeneration(all.exergy)
Die
sel
Figure 23 External costs of electricity systems, associated with emissions from the operation of
boiler/cogeneration unit and with the rest of energy chain. Valuation 0% Discounting damage factors.
0%
10%
20%
30%
40%
50%
60%
70%
80%
90%
100%
Lignit
e
Hard C
oal
Hard C
oal P
FBC Oil
Oil CC
Natural
gas
Natural
gas C
CLW
R
PWR (c
entrif
uge e
nr.)
Hydrop
ower
(alpin
e)
PV pane
l (S-E
urope
)
PV integ
rated
(S-E
urope
)
PV integ
rated
futur
e (S-E
urope
)
Wind
onsh
ore 80
0kW
Wind
offsh
ore 2M
W
coge
n dies
el SCR 20
0kW
e
coge
n gas
lambd
a=1,
160k
We
coge
n gas
lean
burn
1MW
e
Rad. Em.NMVOCHeavy MetalsPM2.5NOxSO2GHG
Figure 24 Contribution percent to external costs of electricity systems by species. Valuation 0%
Discounting damage factors.

39
0.0
0.5
1.0
1.5
2.0
2.5
3.0
3.5
cond
-mod
<100
kW
cond
-mod
>100
kW
mod <10
0kW
mod >1
00kW
indus
trial >
100k
W
heav
y oil,
indus
trial 1
MW
light
oil, c
ond-
non-m
od 10
kW
light
oil, c
ond-
non-m
od 10
0kW
light
oil, n
on-m
od 10
kW
light
oil, n
on-m
od 10
0kW
light
oil, in
dustr
ial 1M
W
logs h
eater
6kW
logs 3
0kW
logs 1
00kW
chips
50kW
chips
300k
W
SCR 200k
We
Mini 2k
We
lean b
urn 50
kWe
lambd
a=1,
160k
We
lean b
urn 50
0kW
e
lean b
urn 1M
We
air-w
ater 1
0kW
UCTE-el
.
brine
-wate
r 10k
W UCTE-el
.
air-w
ater 1
0kW fu
ture C
C-el.
brine
-wate
r 10k
W futur
e CC-el
air-w
ater 1
0kW
futur
e nuc
lear-e
l.
brine
-wate
r 10k
W futur
e nuc
lear-e
l.
Ext
erna
l Cos
ts (E
uro
cent
/ kW
h th)
RestConversion unit
OilGas HPWood Cogeneration(all.exergy)
Die
sel
GasUCTE
El.CCEl.
nuclearEl.
Figure 25 External costs of electricity systems, associated with emissions from the operation of
boiler/cogeneration unit and with the rest of energy chain. Valuation 0% Discounting damage factors.
0%
10%
20%
30%
40%
50%
60%
70%
80%
90%
100%
cond
mod
<100
kW
cond
mod
>100
kW
mod <1
00kW
mod >1
00kW
indus
trial >
100k
W
heav
y oil,
indus
trial 1
MW
light
oil, c
ond n
on-m
od 10
kW
light
oil, c
ond n
on-m
od 10
0kW
light
oil, n
on-m
od 10
kW
light
oil, n
on-m
od 10
0kW
light
oil, in
dustr
ial 1M
W
logs h
eater
6kW
logs 3
0kW
logs 1
00kW
chips
50kW
chips
300k
W
SCR 200k
We
Mini 2k
We
lean b
urn 50
kWe
lambd
a=1,
160k
We
lean b
urn 50
0kW
e
lean b
urn 1M
We
air-w
ater 1
0kW
UCTE-el
.
brine
-wate
r 10k
W U
CTE-el.
air-w
ater 1
0kW
futur
e CC-el
.
brine
-wate
r 10k
W fu
ture C
C-el
air-w
ater 1
0kW
futur
e nuc
lear-e
l.
brine
-wate
r 10k
W fu
ture n
uclea
r-el.
Rad. Em.NMVOCHeavy MetalsPM2.5NOxSO2GHG
Gas Oil Wood HPCogeneration(all.exergy)
Figure 26 Contribution percent to external costs of electricity systems by species. Valuation 0%
Discounting damage factors.

40
Sensitivity: Valuation before NewExt 0% Discounting
The results for this sensitivity are shown in Fig. 27 through Fig. 30.
0
1
2
3
4
5
6
7
8
Lignit
e
Hard C
oal
Hard C
oal P
FBC Oil
Oil CC
Gas
Gas C
CLW
R
PWR (c
entrif
uge e
nr.)
Hydrop
ower
(alpin
e)
PV pane
l (S-E
urope
)
PV integ
rated
(S-E
urope
)
PV integ
rated
futur
e (S-E
urope
)
Wind on
shore
800k
W
Wind
offsh
ore 2M
W
coge
n dies
el SCR 20
0kW
e
coge
n gas
lambd
a=1,
160k
We
coge
n gas
lean
burn
1MW
e
Ext
erna
l Cos
ts (E
uro
cent
/ kW
h)
RestPower Plant
Coal Oil Gas Nuclear
Hyd
ro
Gas
Photovoltaic Wind Cogeneration(all.exergy)
Die
sel
Figure 27 External costs of electricity systems, associated with emissions from the operation of
boiler/cogeneration unit and with the rest of energy chain. Valuation before NewExt 0% Discounting damage factors.
0%
10%
20%
30%
40%
50%
60%
70%
80%
90%
100%
Lignit
e
Hard C
oal
Hard C
oal P
FBC Oil
Oil CC
Natural
gas
Natural
gas C
CLW
R
PWR (c
entrif
uge e
nr.)
Hydrop
ower
(alpin
e)
PV pane
l (S-E
urope
)
PV integ
rated
(S-E
urope
)
PV integ
rated
futur
e (S-E
urope
)
Wind
onsh
ore 80
0kW
Wind
offsh
ore 2M
W
coge
n dies
el SCR 20
0kW
e
coge
n gas
lambd
a=1,
160k
We
coge
n gas
lean
burn
1MW
e
Rad. Em.NMVOCHeavy MetalsPM2.5NOxSO2GHG
Figure 28 Contribution percent to external costs of electricity systems by species. Valuation before
NewExt 0% Discounting damage factors.

41
The increase of calculated external costs compared with the Base Case is obviously higher than for the previous sensitivity analysis: 36% current Lignite; 31% current Hard coal; 40% current Oil, and, 14% current Gas. External costs for new fossil technologies are: 9% Coal PFBC, 22% Oil CC, 11% Gas CC. Nuclear systems’ results increase about 85%, due to the more than doubled damage factor in Euro/DALY compared to the Base Case. Changes for PV are about 17%, and for hydropower 40%. Wind external costs increase by only 6%, because the increases are compensated by the missing accounting of heavy metals (see Tab. 9). With this set of damage factors, ranking of fossil systems does not change compared to the Base Case, but nuclear is more penalized and its external costs calculated comparable to current PV (Southern sites).
Relatively large increases are calculated also for fossil heating systems, especially for heavy oil (34%), light oil (around 20%), and wood (somewhat above 45%), whereas gas boilers increase is less (10 %). All HP have again increased external costs: 30% if UCTE electricity driven; 10% if Gas CC driven; and, about 50% if nuclear electricity driven. Ranking of systems is not substantially changed with the notable exception of wood boilers 30 kW logs and 300 kW chips which in this case have external costs comparable or even higher than oil boilers, and the air-water 10 kW HP driven by UCTE electricity whose external costs become slightly higher than light oil boilers’.
0.0
0.5
1.0
1.5
2.0
2.5
3.0
3.5
cond
-mod
<100
kW
cond
-mod
>100
kW
mod <10
0kW
mod >1
00kW
indus
trial >
100k
W
heav
y oil,
indus
trial 1
MW
light
oil, c
ond-
non-m
od 10
kW
light
oil, c
ond-
non-m
od 10
0kW
light
oil, n
on-m
od 10
kW
light
oil, n
on-m
od 10
0kW
light
oil, in
dustr
ial 1M
W
logs h
eater
6kW
logs 3
0kW
logs 1
00kW
chips
50kW
chips
300k
W
SCR 200k
We
Mini 2k
We
lean b
urn 50
kWe
lambd
a=1,
160k
We
lean b
urn 50
0kW
e
lean b
urn 1M
We
air-w
ater 1
0kW
UCTE-el
.
brine
-wate
r 10k
W UCTE-el
.
air-w
ater 1
0kW fu
ture C
C-el.
brine
-wate
r 10k
W futur
e CC-el
air-w
ater 1
0kW
futur
e nuc
lear-e
l.
brine
-wate
r 10k
W futur
e nuc
lear-e
l.
Ext
erna
l Cos
ts (E
uro
cent
/ kW
h th)
RestConversion unit
OilGas HPWood Cogeneration(all.exergy)
Die
sel
GasUCTE
El.CCEl.
nuclearEl.
Figure 29 External costs of electricity systems, associated with emissions from the operation of
boiler/cogeneration unit and with the rest of energy chain. Valuation before NewExt 0% Discounting damage factors.

42
0%
10%
20%
30%
40%
50%
60%
70%
80%
90%
100%
cond
mod
<100
kW
cond
mod
>100
kW
mod <1
00kW
mod >1
00kW
indus
trial >
100k
W
heav
y oil,
indus
trial 1
MW
light
oil, c
ond n
on-m
od 10
kW
light
oil, c
ond n
on-m
od 10
0kW
light
oil, n
on-m
od 10
kW
light
oil, n
on-m
od 10
0kW
light
oil, in
dustr
ial 1M
W
logs h
eater
6kW
logs 3
0kW
logs 1
00kW
chips
50kW
chips
300k
W
SCR 200k
We
Mini 2k
We
lean b
urn 50
kWe
lambd
a=1,
160k
We
lean b
urn 50
0kW
e
lean b
urn 1M
We
air-w
ater 1
0kW
UCTE-el
.
brine
-wate
r 10k
W U
CTE-el.
air-w
ater 1
0kW
futur
e CC-el
.
brine
-wate
r 10k
W fu
ture C
C-el
air-w
ater 1
0kW
futur
e nuc
lear-e
l.
brine
-wate
r 10k
W fu
ture n
uclea
r-el.
Rad. Em.NMVOCHeavy MetalsPM2.5NOxSO2GHG
Gas Oil Wood HPCogeneration(all.exergy)
Figure 30 Contribution percent to external costs of electricity systems by species. Valuation before
NewExt 0% Discounting damage factors.
Sensitivity: Valuation before NewExt 3% Discounting, CO2 Low
The results for this sensitivity are shown in Fig. 31 through Fig. 34.
With this set of damage factors, the ranking of the systems somewhat changes compared to the Base Case: new Coal PFBC has lower damage than Oil CC and average current Gas, but remains higher than Gas CC; Nuclear’s external costs are comparable with Gas CC and higher than PV (Southern sites). Numerically compared to the Base Case, current Lignite value changes -7%; current Hard coal -20%; but current Oil +2%. For new fossil technologies the change is greater: -72% for PFBC; -42% for Oil CC; and, 68% for Gas CC. PV and Wind external costs change about -20%, nuclear about +65%.
Also the ranking of heating systems changes compared to the Base Case changes: wood boilers have higher or even much higher external costs than gas or oil boiler, with the exception of the heavy oil industrial boiler (although in turn surpassed by the wood fireplace). HPs operated by UCTE electricity have now higher external costs than oil boilers, and HP driven by Gas CC exhibit only slightly higher external costs than HP with nuclear electricity. Relatively large changes are calculated for fossil heating systems, especially for gas (around -70%), light oil (around -45%), and wood (30% to 35%), whereas heavy oil industrial boiler change is minor (-7%). Changes for external costs for HP are: approaching -20% if UCTE electricity driven; -70% if Gas CC driven; and, 0% to -10% if nuclear electricity driven.

43
0
1
2
3
4
5
6
7
8
Lignit
e
Hard C
oal
Hard C
oal P
FBC Oil
Oil CC
Gas
Gas C
CLW
R
PWR (c
entrif
uge e
nr.)
Hydrop
ower
(alpin
e)
PV pane
l (S-E
urope
)
PV integ
rated
(S-E
urope
)
PV integ
rated
futur
e (S-E
urope
)
Wind on
shore
800k
W
Wind
offsh
ore 2M
W
coge
n dies
el SCR 20
0kW
e
coge
n gas
lambd
a=1,
160k
We
coge
n gas
lean
burn
1MW
e
Ext
erna
l Cos
ts (E
uro
cent
/ kW
h)
RestPower Plant
Coal Oil Gas Nuclear
Hyd
ro
Gas
Photovoltaic Wind Cogeneration(all.exergy)
Die
sel
Figure 31 External costs of electricity systems, associated with emissions from the operation of
boiler/cogeneration unit and with the rest of energy chain. Valuation before NewExt 3% Discounting, CO2 Low damage factors.
0%
10%
20%
30%
40%
50%
60%
70%
80%
90%
100%
Lignit
e
Hard C
oal
Hard C
oal P
FBC Oil
Oil CC
Natural
gas
Natural
gas C
CLW
R
PWR (c
entrif
uge e
nr.)
Hydrop
ower
(alpin
e)
PV pane
l (S-E
urope
)
PV integ
rated
(S-E
urope
)
PV integ
rated
futur
e (S-E
urope
)
Wind
onsh
ore 80
0kW
Wind
offsh
ore 2M
W
coge
n dies
el SCR 20
0kW
e
coge
n gas
lambd
a=1,
160k
We
coge
n gas
lean
burn
1MW
e
Rad. Em.NMVOCHeavy MetalsPM2.5NOxSO2GHG
Figure 32 Contribution percent to external costs of electricity systems by species. Valuation before
NewExt 3% Discounting, CO2 Low damage factors.
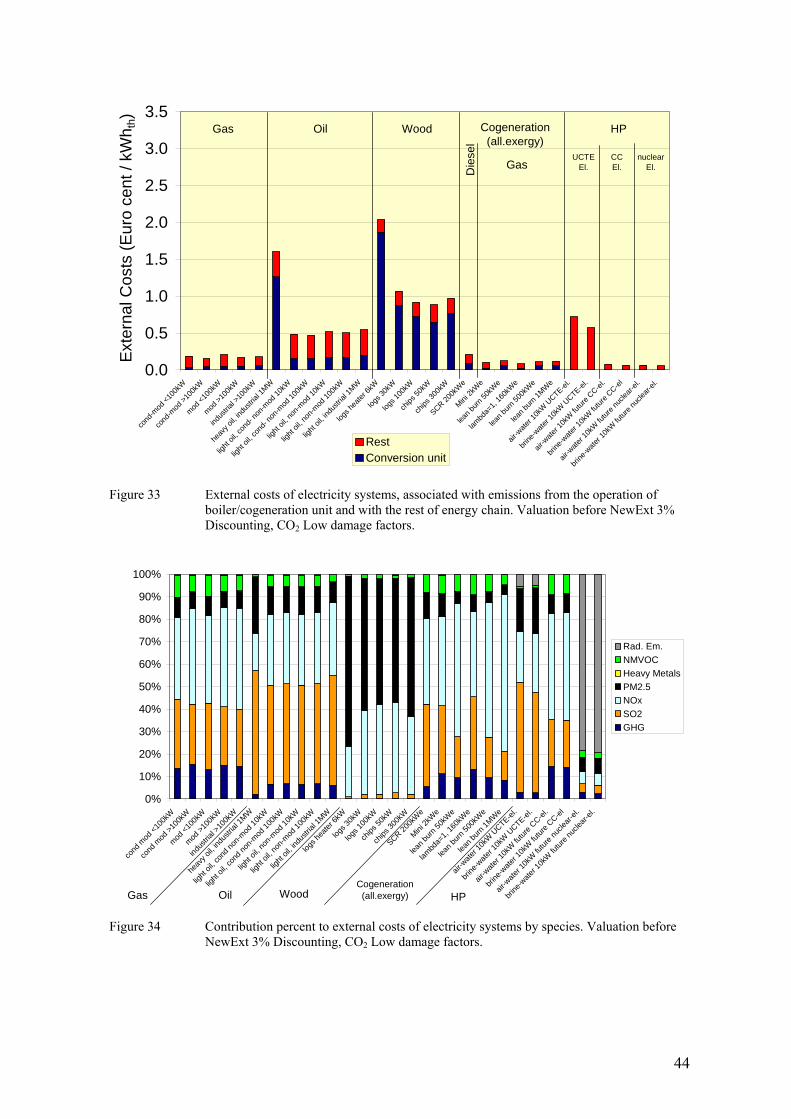
44
0.0
0.5
1.0
1.5
2.0
2.5
3.0
3.5
cond
-mod
<100
kW
cond
-mod
>100
kW
mod <10
0kW
mod >1
00kW
indus
trial >
100k
W
heav
y oil,
indus
trial 1
MW
light
oil, c
ond-
non-m
od 10
kW
light
oil, c
ond-
non-m
od 10
0kW
light
oil, n
on-m
od 10
kW
light
oil, n
on-m
od 10
0kW
light
oil, in
dustr
ial 1M
W
logs h
eater
6kW
logs 3
0kW
logs 1
00kW
chips
50kW
chips
300k
W
SCR 200k
We
Mini 2k
We
lean b
urn 50
kWe
lambd
a=1,
160k
We
lean b
urn 50
0kW
e
lean b
urn 1M
We
air-w
ater 1
0kW
UCTE-el
.
brine
-wate
r 10k
W UCTE-el
.
air-w
ater 1
0kW fu
ture C
C-el.
brine
-wate
r 10k
W futur
e CC-el
air-w
ater 1
0kW
futur
e nuc
lear-e
l.
brine
-wate
r 10k
W futur
e nuc
lear-e
l.
Ext
erna
l Cos
ts (E
uro
cent
/ kW
h th)
RestConversion unit
OilGas HPWood Cogeneration(all.exergy)
Die
sel
GasUCTE
El.CCEl.
nuclearEl.
Figure 33 External costs of electricity systems, associated with emissions from the operation of
boiler/cogeneration unit and with the rest of energy chain. Valuation before NewExt 3% Discounting, CO2 Low damage factors.
0%
10%
20%
30%
40%
50%
60%
70%
80%
90%
100%
cond
mod
<100
kW
cond
mod
>100
kW
mod <1
00kW
mod >1
00kW
indus
trial >
100k
W
heav
y oil,
indus
trial 1
MW
light
oil, c
ond n
on-m
od 10
kW
light
oil, c
ond n
on-m
od 10
0kW
light
oil, n
on-m
od 10
kW
light
oil, n
on-m
od 10
0kW
light
oil, in
dustr
ial 1M
W
logs h
eater
6kW
logs 3
0kW
logs 1
00kW
chips
50kW
chips
300k
W
SCR 200k
We
Mini 2k
We
lean b
urn 50
kWe
lambd
a=1,
160k
We
lean b
urn 50
0kW
e
lean b
urn 1M
We
air-w
ater 1
0kW
UCTE-el
.
brine
-wate
r 10k
W U
CTE-el.
air-w
ater 1
0kW
futur
e CC-el
.
brine
-wate
r 10k
W fu
ture C
C-el
air-w
ater 1
0kW
futur
e nuc
lear-e
l.
brine
-wate
r 10k
W fu
ture n
uclea
r-el.
Rad. Em.NMVOCHeavy MetalsPM2.5NOxSO2GHG
Gas Oil Wood HPCogeneration(all.exergy)
Figure 34 Contribution percent to external costs of electricity systems by species. Valuation before
NewExt 3% Discounting, CO2 Low damage factors.

45
Conclusions
For electricity systems, change of damage factors does not change the relative ranking of fossil systems, with the exception of low factor for GHG emissions which may favor PFBC vs. oil CC. Fossil systems are always penalized by external costs, whatever the scheme for damage factors adopted. Hydropower (in alpine regions) always remain the best performer, with the exception of the case of PM10 sensitivity where hydro external cost become similar to wind onshore, but this may be influenced by the relatively high value of particle emissions assumed in ecoinvent. With all sets, wind remains second best after hydropower. Nuclear external costs, although low in the absolute sense, are penalized by schemes adopting high costs per DALY due to radioactive emissions, i.e. by not discounting long-term effects. However, with the herewith adopted sets of damage factors, its performance becomes comparable with current PV’s only with low on no discounting of long-term effects, especially in combination with a low factor for GHG emissions. Accepting the allocation by exergy, electricity by decentralized small diesel and natural gas cogeneration ranks worse than new oil and natural gas technology, respectively, and never better than renewables or nuclear by changing the set of damage factors.
For heating systems, change of damage factors may change the ranking of conventional wood chips & logs boilers compared to oil and gas, and make these wood systems as the worst performing when GHG is valuated low or local damages are enhanced. Oil systems always remain more damaging than natural gas systems. Accepting the allocation by exergy, heat from decentralized small diesel and natural gas cogeneration is always ranked better than oil and natural gas boilers. The ranking of future HP driven by natural gas or nuclear (or renewable) electricity as the lowest sources of external costs (and lower than small cogeneration with fossil fuels) remains confirmed with all herewith analyzed sets of damage factors.

46
2.6.3 Contribution of upstream energy chains An exemplary sensitivity for variability of the contributions from the upstream chain is presented here for the case of the natural gas chain with natural gas Combined Cycle power plants installed in different European countries, using average factors (base case, see Tab. 5) for external costs. Results are shown in Tab. 10 and Fig. 35.
For the modeling, the advanced 400 MWe gas combined cycle power plant from ecoinvent has been used (Faist Emmenegger et al. 2004). For all countries considered, a net electric efficiency of 57.5% has been assumed. The fuel was assumed to be supplied by natural gas high pressure network for average current conditions in the corresponding country. The natural gas fuel chain has been modelled for each country separately, i.e. different current gas supply mixes and different transport distances have been taken into account.
The two calculations with and without site-specific external cost factors should give a measure of the uncertainty in the application of LCA inventory analyses for external costs estimation.
Table 10 External costs from cumulative emissions for gas systems associated with average European natural gas Combined Cycle and relative variations for country-specific CC power plants and relevant gas supply chain. Based on site-independent average external cost factors (base case).
Average Europe CH DE IT NL
c€/kWh % % % %
GHG 8.03E-03 0.1% 1.0% 1.1% -12.0%
SO2 4.32E-04 20.7% 56.3% 42.1% -89.7%
NOx 9.57E-04 2.7% 4.8% -2.0% -29.3%
PM2.5 2.08E-04 -0.3% 2.4% -0.8% -21.1%
Heavy Metals 2.22E-05 1.4% 1.3% 3.7% -22.6%
NMVOC 2.03E-04 11.0% 31.8% 29.3% -67.0%
Total 9.86E-01 1.5% 4.4% 3.2% -18.4% CH = Switzerland; DE = Germany; IT = Italy; NL = The Netherlands.
0%
10%
20%
30%
40%
50%
60%
70%
80%
90%
100%
AverageEurope
CH DE IT NL
NMVOCHeavy MetalsPM2.5NOxSO2GHG
Figure 35 Contribution percent to external costs of cumulative emissions for natural gas systems associated
with country-specific gas Combined Cycle based on site-independent average external cost factors (base case).
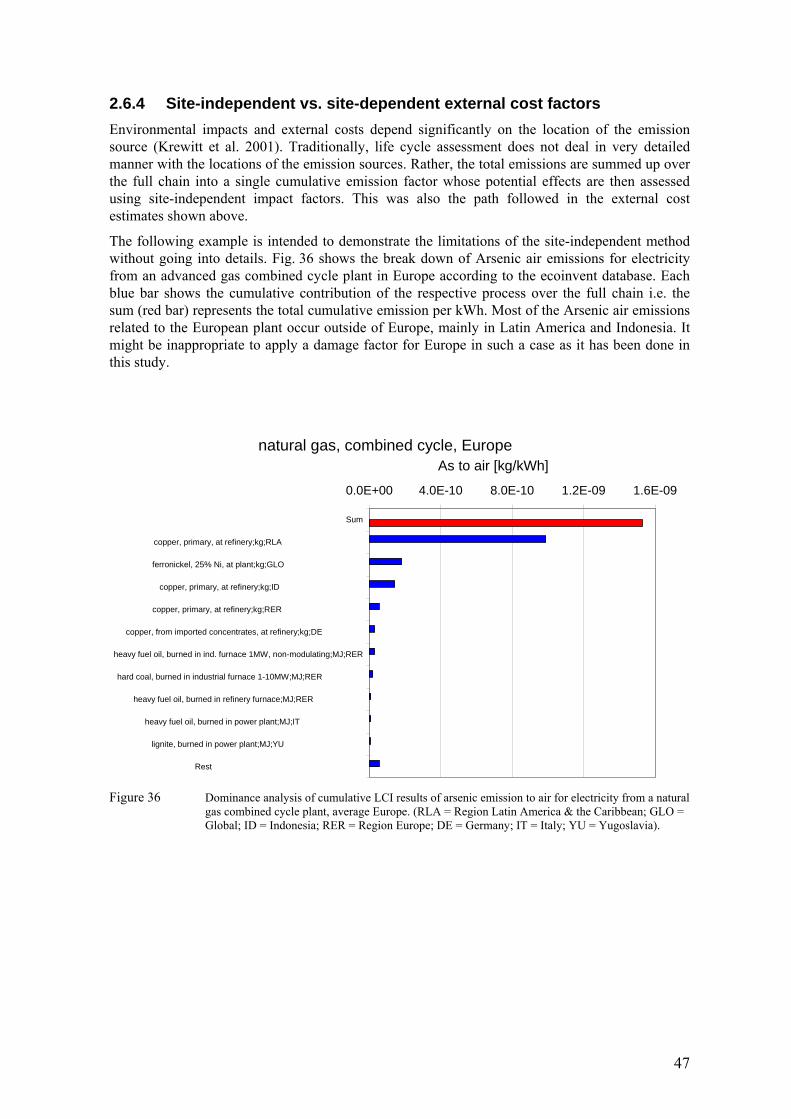
47
2.6.4 Site-independent vs. site-dependent external cost factors Environmental impacts and external costs depend significantly on the location of the emission source (Krewitt et al. 2001). Traditionally, life cycle assessment does not deal in very detailed manner with the locations of the emission sources. Rather, the total emissions are summed up over the full chain into a single cumulative emission factor whose potential effects are then assessed using site-independent impact factors. This was also the path followed in the external cost estimates shown above.
The following example is intended to demonstrate the limitations of the site-independent method without going into details. Fig. 36 shows the break down of Arsenic air emissions for electricity from an advanced gas combined cycle plant in Europe according to the ecoinvent database. Each blue bar shows the cumulative contribution of the respective process over the full chain i.e. the sum (red bar) represents the total cumulative emission per kWh. Most of the Arsenic air emissions related to the European plant occur outside of Europe, mainly in Latin America and Indonesia. It might be inappropriate to apply a damage factor for Europe in such a case as it has been done in this study.
natural gas, combined cycle, Europe
0.0E+00 4.0E-10 8.0E-10 1.2E-09 1.6E-09
Sum
copper, primary, at refinery;kg;RLA
ferronickel, 25% Ni, at plant;kg;GLO
copper, primary, at refinery;kg;ID
copper, primary, at refinery;kg;RER
copper, from imported concentrates, at refinery;kg;DE
heavy fuel oil, burned in ind. furnace 1MW, non-modulating;MJ;RER
hard coal, burned in industrial furnace 1-10MW;MJ;RER
heavy fuel oil, burned in refinery furnace;MJ;RER
heavy fuel oil, burned in power plant;MJ;IT
lignite, burned in power plant;MJ;YU
Rest
As to air [kg/kWh]
Figure 36 Dominance analysis of cumulative LCI results of arsenic emission to air for electricity from a natural
gas combined cycle plant, average Europe. (RLA = Region Latin America & the Caribbean; GLO = Global; ID = Indonesia; RER = Region Europe; DE = Germany; IT = Italy; YU = Yugoslavia).

48
3 Life Cycle Inventories of energy systems for German new power plants and cogeneration units
3.1 Introduction Within ExternE-Pol, another group of new technologies for power production has been separately assessed. This Chapter describes the technologies included, their emissions and the external costs estimated. More detailed investigations on the technologies and results of LCI can be found in (Briem et al. 2004) and (Mörschner and Eltrop 2004). Reference year for the LCI was the year 2010. The calculation of total inventories has been performed with the non-commercial software BALANCE 3.5 SPL which was developed at the Institute of Energy Economics and the Rational Use of Energy (IER) of the University of Stuttgart. It combines classical process chain analysis with Input-Output-Analysis (IOA), thus forming a hybrid approach. However, for the current exercise a full process chain analysis was carried out. The background data have been provided by (Frischknecht et al. 1996). Since this LCI study was especially focused on Switzerland (though most of the energy systems were also analysed for UCTE-countries conditions) and contains data for the early 1990s, the database has been revised for Germany and the year 2010, mainly reworking selected processes of fuel supply and electricity. This leads to some unintended but unavoidable inconsistencies. For example, a future energy or electricity mix will probably result in lower emission rates. However, for energy intensive processes in the basic industry (e.g. production of aluminium) this reduced emissions are not taken into account. This inconsistencies could have been only avoided by a comprehensive recalculation which was out of the scope of the study.
The projections include significant reductions of methane for natural gas supply (especially from Russian federation) and coal supply, on the order of 50% compared to the situation in 1997. However, the update leads for example to the assumption that the emission of particulates will double in the case of coal supply. This is due to longer transport routes and different mining processes.
In the inventories, processes such as material and energy demand for the construction of the plant, energy used for the manufacturing of components, fuel for the engines, spare parts and consumables, and energy demand for dismantling are covered.
The LCI data is representative for technologies which will be used in 2010. However, this date should be seen as an approximation because exact prognoses with regard to the technical development and availability of the technologies are not possible.
3.2 Scope / boundaries of the system analysis A predefinition of a geographical scope for upstream processes, i.e. raw materials and energy supply was not done because a restriction towards national boundaries is problematic and not helpful.
The functional unit is 1 kWhe at a specified voltage level at the busbar of the conversion plant, delivering electricity to the high-voltage power network. Exergy allocation is used for cogeneration (see Appendix).
For the technologies investigated the following airborne substances have been assessed: CO2, N2O, CH4, NOx, SO2, NMVOC, CO, and PM. PM means particulate matter, and in the herewith used LCI database it is not always specified whether the value means PM10 or PM2.5. If for the investigated technologies data concerning particulate matter is available, it is treated as PM10.

49
3.3 Description of Technologies In the following sections, the investigated technologies are individually described.
To be noted: Emissions occur in different life cycle stages. For each species, the sum of the emissions from all life cycle stages is called cumulative emission. All processes except of burning the fuel at power plants and cogeneration units make the herewith called up- and downstream processes. Therefore, emissions from up- and downstream processes include emissions caused by building the power plant, fuel supply, and dismantling and disposal (end of life) of the power plant. The emissions caused by burning the fuel at the power plant or cogeneration unit are herewith called direct emissions. Between building and dismantling of the power plant there is the so called operation phase. Emissions of the operation phase include mainly direct emissions from burning the fuel and emissions caused by fuel supply.
3.3.1 Electricity supply systems Five fossil power plants have been analysed:
- Coal-fired Integrated Gasification Combined Cycle power plants (C-IGCC)
- Lignite-fired Integrated Gasification Combined Cycle power plants (L-IGCC)
- Coal-fired steam turbine power plants (C-ST)
- Lignite-fired steam turbine power plant with integrated coal dryer (L-ST)
- Natural gas-fired combined cycle power plant (NG-CC)
Tab. 11 shows the key technical parameters of the considered new fossil fuelled system. The power plants are assumed to have a life time of 35 years and annual 7’500 full load hours.
Table 11 Technical parameters of the considered new fossil fuelled system.
Unit C-IGCC L-IGCC C-ST L-ST NG-CC
Net electric capacity MWe 450 450 600 1050 817 Efficiency % 51.5 51.5 47 50 60 Number of gas turbine [-] 1 1 --- --- 2
Number of steam turbine [-] 1 1 1 1 1
Full load operating hours h/a 7500 7500 7500 7500 7500
Technical lifetime a 35 35 35 35 35 Cooling process [-] wet cooling tower
Fuel coal mix at power plant
Rhineish lignite
coal mix at power plant
Rhineish lignite
natural gas - high pressure
Source: (Briem et al. 2004) IGCC Hard Coal / Lignite Coal-fired Integrated Gasification Combined Cycle power plant (C-IGCC)
The highest efficiencies are achieved with two thermodynamic cycles using gas and steam turbines. However, the fuel must be in gaseous form. Hence, solid fuels must be gasified and cleaned in order to be usable in gas turbines. This is achieved in IGCC power plants by gasification of the coal. However, the cleaning process cannot be performed with the high temperatures of the gas leaving the gasifier. Therefore, it must be cooled down and then cleaned
50
from particulates and sulphur components. The projected net electric efficiency for the year 2010 is up to 51.5%. The life cycle emissions originate by more than 90% from the operation phase, i.e. mainly the fuel supply and the direct emissions caused by burning the fuel. The direct emissions from burning the fuel contribute 90% to the CO2 emissions but only 30% to the SO2 emissions. The main part of CH4 emissions is caused by coal supply which also contributes more than 60% to the SO2 and NOx cumulative emissions from the energy chain. Besides hard coal, also other fuels can be gasified, e.g. lignite and biomass.
Lignite-fired Integrated Gasification Combined Cycle power plant (L-IGCC)
The IGCC technology is also usable for lignite. More than 90% of the cumulative life cycle emissions originate from the operation phase of the chain, and within the operation phase more than 90% are caused by direct emissions from burning the fuel. The latter contributes about 90% to the CO2, SO2 and NOx emissions but only 17% to the CH4 emissions. The remaining parts are mainly emitted by the lignite supply. NMVOC are emitted prevalently by mining.
Coal-fired steam turbine power plant (C-ST)
Present coal-fired power plants have electrical net efficiencies of 42 - 43%. In (Briem et al. 2004) it is assumed on the basis of actual research activities that the efficiency may be improved up to 47 % by the year 2010. Within the operation phase, the direct emissions and the coal supply are causing nearly all emissions. 90% of the CO2 emissions are caused by direct emissions as well as 50% of the SO2 and ca. 60% of the NOx emissions. Coal supply is responsible for nearly all of the CH4 emissions because methane is vented from mines. Hard coal-fired power plants are usually not used for base load so that the full load hours may be less than assumed here.
Lignite fired steam turbine with integrated coal drying process (L-ST)
At present, lignite-fired power plants have efficiencies of up to 45%. With improved drying processes, e.g. fluidised bed drying with rejected heat, higher efficiencies may be achieved. The projected power plant is assumed to have an efficiency of 50% in the year 2010. Similar to the previously described technologies, fuel supply and emissions caused by burning the fuel contribute more than 90% to the life cycle emissions of the power plant. More than 90% of the CO2, SO2 and NOx emissions are direct emissions whereas ca. 75% of total CH4 emissions are caused by the lignite supply.
Natural gas-fired gas combined cycle (NG-CC)
Today’s combined cycle power plants have electrical efficiencies of ca. 58%. Besides this high efficiency, combined cycle power plants have further advantages: no flue gas reduction is required and thus the specific plant costs are lower than those of other fossil-fired power plants.
The environmental impacts are comparably low due to high efficiencies and low fuel specific emissions. In (Briem et al. 2004) future configurations are estimated. It is a power plant with two gas turbines and one steam turbine. Of the cumulative emissions from all life cycle stages, mainly the direct emissions contribute to the respective emissions species. The direct emissions from burning the fuel contribute ca. 90% to the CO2 and ca. 70% to the NOx emissions, whereas the natural gas supply contributes more than 95% to the CH4 and SO2 emissions.
Usually, combined cycle power plants are not used for base load power generation, so that their annual full load hours are significantly lower than assumed here. The specific emissions in the operation phase are relatively independent from the full load hours but the specific emissions due to construction and end of life increase with decreasing full load hours.
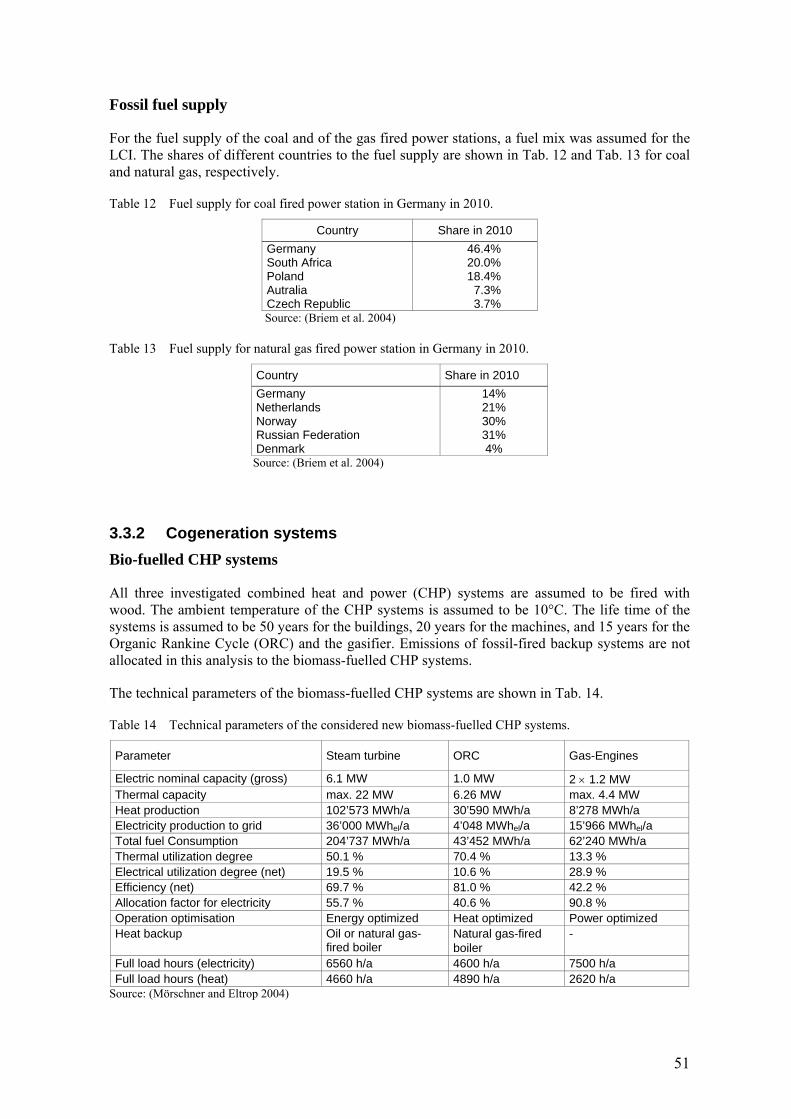
51
Fossil fuel supply
For the fuel supply of the coal and of the gas fired power stations, a fuel mix was assumed for the LCI. The shares of different countries to the fuel supply are shown in Tab. 12 and Tab. 13 for coal and natural gas, respectively.
Table 12 Fuel supply for coal fired power station in Germany in 2010.
Country Share in 2010 Germany 46.4% South Africa 20.0% Poland 18.4% Autralia 7.3% Czech Republic 3.7% Source: (Briem et al. 2004)
Table 13 Fuel supply for natural gas fired power station in Germany in 2010.
Country Share in 2010 Germany 14% Netherlands 21% Norway 30% Russian Federation 31% Denmark 4%
Source: (Briem et al. 2004) 3.3.2 Cogeneration systems Bio-fuelled CHP systems
All three investigated combined heat and power (CHP) systems are assumed to be fired with wood. The ambient temperature of the CHP systems is assumed to be 10°C. The life time of the systems is assumed to be 50 years for the buildings, 20 years for the machines, and 15 years for the Organic Rankine Cycle (ORC) and the gasifier. Emissions of fossil-fired backup systems are not allocated in this analysis to the biomass-fuelled CHP systems.
The technical parameters of the biomass-fuelled CHP systems are shown in Tab. 14.
Table 14 Technical parameters of the considered new biomass-fuelled CHP systems.
Parameter Steam turbine ORC Gas-Engines
Electric nominal capacity (gross) 6.1 MW 1.0 MW 2 × 1.2 MW Thermal capacity max. 22 MW 6.26 MW max. 4.4 MW Heat production 102’573 MWh/a 30’590 MWh/a 8’278 MWh/a Electricity production to grid 36’000 MWhel/a 4’048 MWhel/a 15’966 MWhel/a Total fuel Consumption 204’737 MWh/a 43’452 MWh/a 62’240 MWh/a Thermal utilization degree 50.1 % 70.4 % 13.3 % Electrical utilization degree (net) 19.5 % 10.6 % 28.9 % Efficiency (net) 69.7 % 81.0 % 42.2 % Allocation factor for electricity 55.7 % 40.6 % 90.8 % Operation optimisation Energy optimized Heat optimized Power optimized Heat backup Oil or natural gas-
fired boiler Natural gas-fired boiler
-
Full load hours (electricity) 6560 h/a 4600 h/a 7500 h/a Full load hours (heat) 4660 h/a 4890 h/a 2620 h/a
Source: (Mörschner and Eltrop 2004)

52
CHP steam turbine - Flue gas condensing
Heat is extracted at temperatures of 210°C with a pressure of 13 bar (process steam) as well as with a pressure of 3.5 bar at 130°C, 85°C, and 45°C. The heat at 130°C runs absorption refrigerating plants and the lower temperature heat is fed in a local district heating system. If the heat is not consumed totally the air-cooled condenser (LUKO) can be used. For backup considerations, two oil or natural gas-fired boilers are available. Altogether, 95% of the generated energy comes from wood. The emissions from the construction of this biomass-fuelled CHP plant do not contribute more than 10% to the total life cycle emissions. In contrast, direct emissions from burning the wood contribute ca. 75% - 90% to all considered emissions. The end of life of the system does not have significant emissions.
CHP internal combustion engine plant with biomass gasification
The biomass-fuel is dried from a moisture content of 45% to 20% with internal waste heat. Thus, the total utilisation factor is increased. At atmospheric pressure, the gasification of the biomass fuel is performed in an air based circulating fluidised bed. The generated gas is filtered and cooled and finally combusted in two gas engines.
Similarly to the distribution of the ORC CHP system, the emissions from the construction of the Gas-Engines CHP plant do not contribute more than 15% to the total life cycle emissions. Direct emissions from burning the wood contribute up to 80% of all considered emissions. The end of life of the system does not have significant emissions.
CHP Biomass-ORC
The Organic Rankine Cycle (ORC) CHP plant is used for base load heat supply in an existing local district heating system. Conventional natural gas-fired boilers are available to backup the supply. Heat which is extracted from the ORC and heat which is extracted from the flue gas and the thermo oil by economizers is supplied to the local district heating system. An air cooled re-cooling can be used in the ORC module in order to operate the ORC in condensation operation.
Similarly to the distribution of the steam turbine system, the emissions from the construction of the ORC CHP plant do not contribute more than 10% to the total life cycle emissions. Direct emissions caused by burning the fuel are up to 95% responsible for the main part of all considered emissions. The end of life of the cogeneration unit does not have significant emissions.
3.4 LCI Results In Tab. 15 and 16 the total life cycle emissions of the considered technologies are depicted.
3.4.1 Fossil-fuelled systems
Table 15 Emissions to air of the considered new fossil systems.
Emissions to air Unit C-IGCC L-IGCC C-ST L-ST NG-CC
CO2 g/kWhe 723 807 792 830 377 CO mg/kWhe 238 727 329 210 194 CH4 mg/kWhe 1689 62 1847 159 498 N2O mg/kWhe 31 26 36 27 12 SOx as SO2 mg/kWhe 669 622 1054 629 100 NOx as NO2 mg/kWhe 501 429 910 626 391 NMVOC mg/kWhe 115 35 134 37 84
PM10 mg/kWhe 282 282 310 290 0 Source: (Briem et al. 2004)

53
3.4.2 Bio-fuelled CHP systems
Table 16 Emissions into air from the considered new biomass-fuelled CHP systems.
Emission to air Unit Steam turbine Gas-Engines ORC
CO2, fossil g/kWhe 61 94 69 CO2, biogenic g/kWhe 1098 1367 1477 CO mg/kWhe 936 139 778 CH4 mg/kWhe 129 257 144 N2O mg/kWhe 6 30 7 SOx as SO2 mg/kWhe 393 133 637 NOx as NO2 mg/kWhe 715 1107 1421 NMVOC mg/kWhe 89 178 120 PM10 mg/kWhe 66 30 160 Source: (Mörschner and Eltrop 2004)
3.5 Results of External Cost Calculation For the calculation of external cost of different life cycle stages, specific damage factors have been used. In the following a comparison is made between the application of average damage factors for EU15 and country specific factors for Germany (sensitivity analysis). The damage factors used for direct emissions from power plants and cogeneration units are shown in Tab. 17. Moreover, “adjusted” damage factors have been developed in order to account for different conditions for up- and downstream processes, i.e. including all emissions except of direct emissions from burning the fuel, such as caused by building the power plant, fuel supply and dismantling of the power plant. The adjustment of the damage factors is based on assumptions, which are described in Chapter 3.6. The adjusted damage factors are displayed in Table 18.
Table 17 Damage Factors for the calculation of external costs for direct emissions from fossil and bio-fuel power plants and cogeneration units.
[Euro/kg] Damage Factors (Euro/kg)
Damage Factors (Euro/kg)
Group/Species (EU-15) (Germany) GHG 0.019 0.019 SO2 2.939 5.174 NOx 2.908 2.940 PM10 11.723 13.770 NMVOC (total, unweighted - w/o Formaldehyde)
1.124 1.610
Table 18 Adjusted Damage Factors for the calculation of external costs caused by up- and downstream processes of fossil and bio-fuelled technologies.
[Euro/kg] Damage Factors (Euro/kg)
Group/Species (EU-15 adjusted -fossil) GHG 0.019 SO2 3.442 NOx 3.054 PM10 14.698 NMVOC (total, unweighted - w/o Formaldehyde)
1.124

54
Valuation of external costs due to CO2-equiv. is based on the IPCC (2001) global warming potential – 100 years horizon. The weighting factors used are shown in Tab. 19.
Table 19 Characteristic factors used in this study for calculation of the CO2-equiv.
Greenhouse gases (relevant for power plants)
Characteristic factors (IPCC 2001)
[kg CO2-equiv. / kg] CO2 1 CH4 23 N2O 296
As shown in Fig. 37, the external costs of the power plants or cogeneration units are mainly caused by direct emissions from burning the fuel. For the bio-fuelled plants the life cycle phase operation, including the direct emissions due to burning the fuel, contributes ca. 50% to 70% to the external costs. The CO2 emissions of burning biomass fuel are assumed to be zero, because of the previous uptake of the CO2 by the plants (e.g. trees). For the fossil-fuelled as well as for the biomass-fuelled energy systems a significant contribution to the overall external costs is caused by the upstream process of the fuel supply. Similarly to the fossil fuelled power systems, for the biomass-fuelled systems the category fuel supply includes emissions caused by the operation of the plant, except of emissions from burning the fuel. Hence beside the wood supply it also includes emissions caused among others by the electricity consumption within the plant. This explains the still relatively high share of external costs due to GHG for bio-fuelled power plants, which is shown in Fig. 38. The electricity consumed is produced by the electricity mix of the German power network in 2010. This also includes fossil-fuelled power plants and therefore, leads to GHG emissions. The shares of the assumed scenario of the electricity mix in year 2010 are given in Tab. 20.
Table 20 Approximate shares of different technologies of the German electricity mix in 2010 (based on the reference scenario in (Prognos et al. 2002)).
Technology Share [%]
Hard coal 21% Lignite 18% Natural gas 19% Nuclear 17% Hydro 9% Wind 11%
The lowest costs are caused by the biomass steam turbine (B-ST). The natural gas combined cycle (NG-CC), the biomass internal combustion engine (B-ICE) plants and the biomass organic rankine cycle plant (B-ORC) cause also comparably low external costs, below 1 Euro-Cent/kWhe. The coal and lignite plants cause external costs above 2 Euro-Cent/kWhe.
The hard coal and lignite IGCC technologies have somewhat smaller external costs than the coal and lignite steam turbine power plants, when entire energy chains are accounted for. The lignite power plants have higher external costs than the hard coal fired power stations. The external costs of the fuel supply chain of lignite are as expected smaller than the ones of hard coal. This is mainly caused by higher CO2 emissions, but also by higher CH4 emissions from hard coal mining.
External costs caused by the bio-fuelled power plants are small in the case of the B-ST and the B-ICE plant. Of course, if the electricity used within the plant would not be taken from the German mix but from other energy sources with lower external costs, the external costs of the fuel chain would be consequently smaller. However, the internal (direct) costs would probably be higher.
Fig. 38 shows that for the fossil-fuelled power plants the result is dominated by the external costs due to GHG. The highest share for GHG is calculated for the NG-CC system. However, as shown
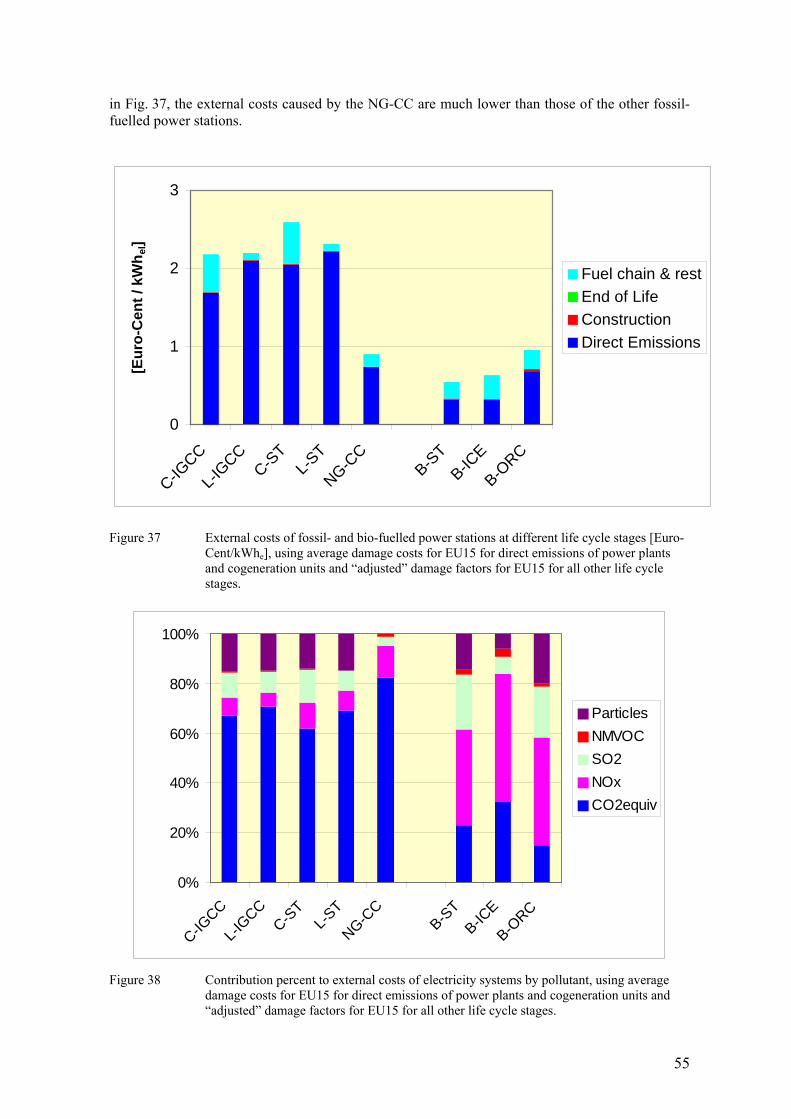
55
in Fig. 37, the external costs caused by the NG-CC are much lower than those of the other fossil-fuelled power stations.
0
1
2
3
C-IGCC
L-IGCC
C-ST
L-ST
NG-CC
B-ST
B-ICE
B-ORC
[Eur
o-C
ent /
kW
h el]
Fuel chain & restEnd of LifeConstructionDirect Emissions
Figure 37 External costs of fossil- and bio-fuelled power stations at different life cycle stages [Euro-
Cent/kWhe], using average damage costs for EU15 for direct emissions of power plants and cogeneration units and “adjusted” damage factors for EU15 for all other life cycle stages.
0%
20%
40%
60%
80%
100%
C-IGCC
L-IGCC
C-ST
L-ST
NG-CC
B-ST
B-ICE
B-ORC
ParticlesNMVOCSO2NOxCO2equiv
Figure 38 Contribution percent to external costs of electricity systems by pollutant, using average
damage costs for EU15 for direct emissions of power plants and cogeneration units and “adjusted” damage factors for EU15 for all other life cycle stages.
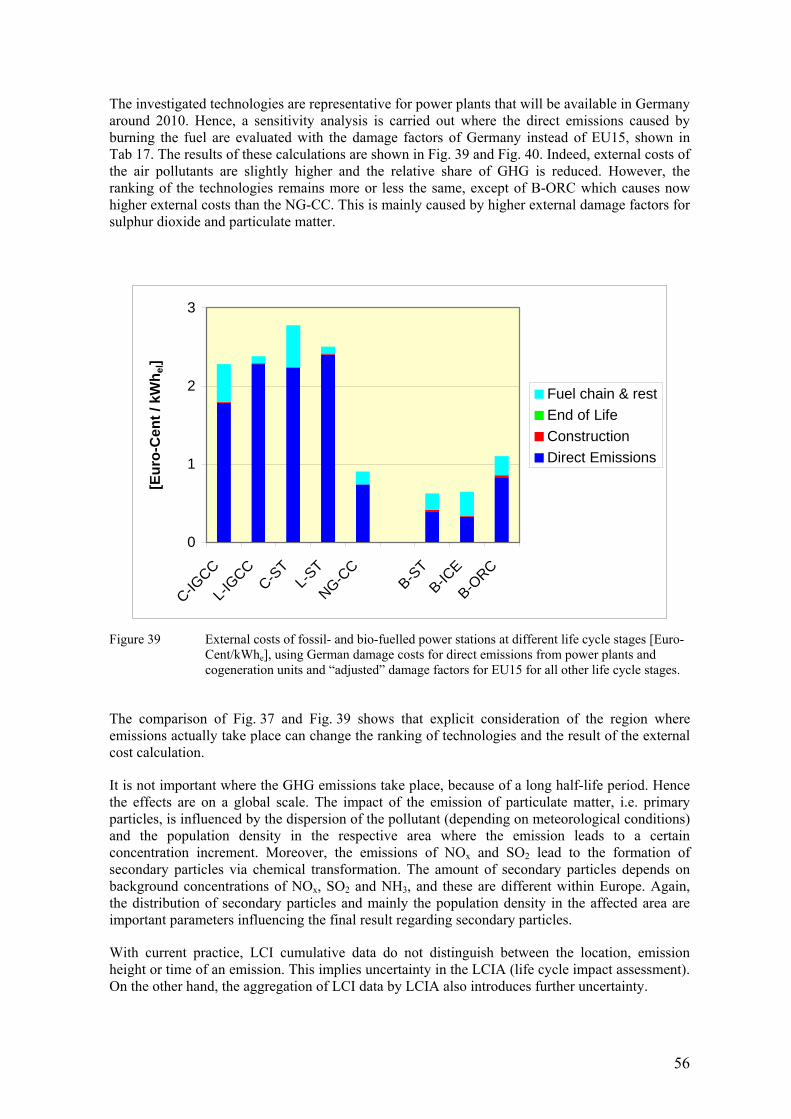
56
The investigated technologies are representative for power plants that will be available in Germany around 2010. Hence, a sensitivity analysis is carried out where the direct emissions caused by burning the fuel are evaluated with the damage factors of Germany instead of EU15, shown in Tab 17. The results of these calculations are shown in Fig. 39 and Fig. 40. Indeed, external costs of the air pollutants are slightly higher and the relative share of GHG is reduced. However, the ranking of the technologies remains more or less the same, except of B-ORC which causes now higher external costs than the NG-CC. This is mainly caused by higher external damage factors for sulphur dioxide and particulate matter.
0
1
2
3
C-IGCC
L-IGCC
C-ST
L-ST
NG-CC
B-ST
B-ICE
B-ORC
[Eur
o-C
ent /
kW
h el]
Fuel chain & restEnd of LifeConstructionDirect Emissions
Figure 39 External costs of fossil- and bio-fuelled power stations at different life cycle stages [Euro-
Cent/kWhe], using German damage costs for direct emissions from power plants and cogeneration units and “adjusted” damage factors for EU15 for all other life cycle stages.
The comparison of Fig. 37 and Fig. 39 shows that explicit consideration of the region where emissions actually take place can change the ranking of technologies and the result of the external cost calculation.
It is not important where the GHG emissions take place, because of a long half-life period. Hence the effects are on a global scale. The impact of the emission of particulate matter, i.e. primary particles, is influenced by the dispersion of the pollutant (depending on meteorological conditions) and the population density in the respective area where the emission leads to a certain concentration increment. Moreover, the emissions of NOx and SO2 lead to the formation of secondary particles via chemical transformation. The amount of secondary particles depends on background concentrations of NOx, SO2 and NH3, and these are different within Europe. Again, the distribution of secondary particles and mainly the population density in the affected area are important parameters influencing the final result regarding secondary particles.
With current practice, LCI cumulative data do not distinguish between the location, emission height or time of an emission. This implies uncertainty in the LCIA (life cycle impact assessment). On the other hand, the aggregation of LCI data by LCIA also introduces further uncertainty.

57
0%
10%
20%
30%
40%
50%60%
70%
80%
90%
100%
C-IGCC
L-IGCC
C-ST
L-ST
NG-CC
B-ST
B-ICE
B-ORC
ParticlesNMVOCSO2NOxCO2equiv
Figure 40 Contribution percent to external costs of electricity systems by pollutant, using German
damage costs for direct emissions from power plants and cogeneration units and “adjusted” damage factors for EU15 for all other life cycle stages.
The energy systems whose results are shown in Fig. 37 through 40 complement the spectrum of new technologies whose results are illustrated in Fig. 1 through 4. The external costs calculated for natural gas CC match very well – the minor difference can be easily explained with the slightly different net efficiency and differences in the main assumptions for the upstream chain (origin of the gas and leakage rates assumed). The advanced hard coal technologies PFBC and IGCC exhibit external costs of the same order of magnitude.
3.6 Sensitivity of damage factors to key characteristics of point of emissions for up- and downstream steps of energy chains
External costs of fossil- and bio-fuelled electricity systems
The external costs shown in Tab. 21, corresponding to those shown in Fig. 37 above, are derived using the same damage factors for all emissions, regardless of the local population density or release height. Corresponding information is often not available, because current LCI cumulative data do not give information on location and release height. Hence, for the results in Tab. 21 damage factors have been used which represent average damage costs for EU15 for high stack emissions outside urban areas. As can be seen in Tab. 21 the life cycle stages construction and disposal cause negligible external costs.

58
Table 21: External costs of fossil- and bio-fuelled electricity systems for different life cycle stages [Euro-Cent/kWhe], using average damage costs for EU15 for all life cycle stages.
Euro-Cent/kWhe C-IGCC L-IGCC C-ST L-ST NG-CC B-ST B-ICE B-ORC Direct Emissions 1.7 2.1 2.0 2.2 0.7 0.3 0.3 0.7 Construction 0.0 0.0 0.0 0.0 0.0 0.0 0.0 0.0 End of Life 0.0 0.0 0.0 0.0 0.0 0.0 0.0 0.0 Fuel chain 0.5 0.1 0.5 0.1 0.2 0.2 0.3 0.2 Total 2.2 2.2 2.6 2.3 0.9 0.5 0.6 0.9
Some of the emissions caused within up- and downstream processes may occur at a lower release height and within areas with lower or higher population density. Therefore, different estimates were made based on plausible assumptions to account for different emission locations and release heights. The assumptions taken for up- and downstream emissions are:
a) 1% are caused by transport processes (release height ground level), with 10% of the transport processes taking place in highly populated areas and 90% in lowly populated areas;
b) 80% are caused by industrial processes (release height approx. 80 m), whereas 5% of the industrial sites are located within a highly populated area and 95% within a lowly populated area;
c) the rest, i.e. 19% of these emissions, is assumed to be high stack emissions (release height > 200 m, e.g. what may be caused by supply of electricity produced by coal fired power stations), whereas 10% of these emissions are taking place within a highly populated area and 90% within a lowly populated area.
If the damage factors for up- and downstream processes (i.e., construction and disposal of power plants/cogeneration units as well as the fuel supply chain) are adjusted under the conditions described above, this results in slightly higher overall external cost. These external costs are displayed in Tab. 22. The relative changes, i.e. the increases of external costs are displayed as percent increase in Tab. 23.
Table 22: External costs of fossil- and bio-fuelled electricity systems for different life cycle stages [Euro-Cent/kWhe], using average damage costs for EU15 for direct emission of the power plant or cogeneration unit, and adjusted EU15 damage costs for up- and downstream processes, i.e. for all other life cycle stages.
Euro-Cent/kWhe C-IGCC L-IGCC C-ST L-ST NG-CC B-ST B-ICE B-ORC Direct Emissions (EU15-high stack) 1.7 2.1 2.0 2.2 0.7 0.3 0.3 0.7 Up- & downstream (EU15-up- and downstream) 0.5 0.1 0.5 0.1 0.2 0.2 0.3 0.3 Total 2.2 2.2 2.6 2.3 0.9 0.5 0.6 1.0
Table 23: Change of external cost estimates if adjusted damage costs (EU15) are used for up- and downstream steps; percent calculated as(results with adjusted damage factors / results without adjusted damage factors) –1) × 100.
Change C-IGCC L-IGCC C-ST L-ST NG-CC B-ST B-ICE B-ORC Direct Emissions 0.0% 0.0% 0.0% 0.0% 0.0% 0.0% 0.0% 0.0% Up- & downstream 6.2% 3.5% 6.2% 3.7% 4.3% 4.2% 3.6% 4.7% Total 1.3% 0.2% 1.2% 0.2% 0.8% 1.7% 1.8% 1.3%

59
The external costs caused by up- and downstream processes increase differently depending on the spectrum of the emitted pollutants. The external costs of particulate matter and SO2 increase by approx. 25% and 17%, respectively, whereas external costs of greenhouse gases are independent of the location and release height. It can be concluded that with respect to the assumptions made regarding local population density and release height for the overall external costs of fossil- and bio-fuelled technologies the location characteristics of up- and downstream processes are not important. However, since the assumptions are not based on a comprehensive analysis of LCI data, the sensitivity should be considered only as a first indication of possible variation of results.
External costs of wind energy converter and PV technologies External costs for wind energy converters (WEC) and PV technologies have been calculated with EU15 average damage factors using ecoinvent data, and results have been shown in Chapter 2. In order to perform a sensitivity analysis similarly to what done above for fossil and biomass electricity systems, the specific structures of the relevant up- and downstream processes of these two renewable systems should been taken somewhat into account. Since data on characteristics of the many different locations where emissions take place were not available, assumptions have been made which are based on estimations regarding the contribution of emissions caused by different life cycle stages such as material manufacturing or assembling + installation, using as a starting point ecoinvent results reported in (Jungbluth et al. 2005). The assumptions are described in the following items A through C. The results of these assumptions are used for both, WEC and PV technologies. This is of course a very rough approach and has to be refined in future impact assessment.
A. 1% of emissions from up- and downstream processes, i.e. practically the entire cumulative emissions, are caused by transport processes (release height ground level), whereas 10% of the transport processes take place within a highly populated area and 90% within a lowly populated area;
B. 60% of accumulated emissions are assumed to be caused by industrial processes (release height approx. 80 m), whereas 30% of this industrial sites are located within a highly populated area and 70% within a low populated area;
C. the rest, i.e. 39% of accumulated emissions is assumed to be high stack emissions (release height > 200 m, e.g. what may be caused by supply of electricity produced by coal fired power stations), whereas 10% of these emissions are taking place within a highly populated area and 90% within a lowly populated area.
The resulting damage factors differ from those illustrated in the preceding Section for fossil and biomass, as shown in Tab. 24. Results for this sensitivity on external costs are shown in Tab 25 together with the values calculated in Chapter 2.
Table 24 “Adjusted” Damage Factors for the calculation of external costs caused by up- and downstream processes of PV and WEC.
[Euro/kg] Damage Factors (Euro/kg)
Group/Species (EU-15 adjusted – PV/WEC) GHG 0.019 SO2 3.335 NOx 3.018 PM2.5 25.885 NMVOC (total, unweighted - w/o Formaldehyde)
1.124

60
Table 25 Application of adjusted damage factors for PV and WEC and comparison with results using average damage costs for EU15.
Photovoltaic (South-Europe) Wind
[Euro-Cent/kWh] Panel, mounted
Panel, integrated
Panel, integrated
(future)
Onshore 800 kW
Offshore 2 MW
Base External Cost – Average EU15 0.24 0.24 0.18 0.07 0.09
Adjusted External Costs – EU15 0.26 0.25 0.19 0.08 0.10
% Increase 7.9% 8.0% 8.9% 14.2% 14.1% The following facts should be noted:
1. In Tab. 6 PM2.5 is reported including primary nitrates and sulfates (the contribution of primary nitrates and sulfates is very small compared to other primary particles). It is assumed that the fraction of particulate matter with a size between 2.5 and 10 µm has no effect to human health (the damage factor for the fraction of particulate matter with a size between 2.5 and 10 µm is then assumed 0 €/tonne). However, the damage factor for the fraction of particulate matter with a size smaller than 2.5 µm is 67% higher than the one for PM10 which leads to similar results as if the higher emission of PM10 is evaluated with the smaller damage factor for PM10.
2. The LCI data for this sensitivity has been extracted from Tab. 6. The impact of heavy metals (total unweighted) and radioactive emissions (unweighted) has been excluded from the comparison in Tab. 25. Hence, the absolute values of external costs in Tab. 25 do not account for heavy metals and radioactive emissions. The percentage increase of external costs reflects only the impact of accounting for local conditions for the classical air pollutants in Tab. 6.
As shown in Tab. 25, the influence of the application of adjusted damage factors is higher in the case of PV and WEC technologies than in the case of fossil-fuelled technologies discussed before. Since the results of external cost estimation of different technologies is obviously influenced by the location of the emission, further investigation and more practical LCI data are in principle necessary in order to base assumptions regarding the adjustment of damage factors on better grounds. However, considering the relatively high resource investment for process LCA, a compromise between accommodating detailed information in LCI databases and use of sensitivity analysis for encompassing likely variations for external costs will always be necessary in energy systems analysis. The main goals for research are the following:
• Assessing the robustness of the resulting rankings of systems to use for environmental and energy policy decision making.
• The quantification of damage on environment and human health in monetary terms in order to perform cost-benefit analyses regarding measures which reduce emissions at every stage of the energy systems.
3.7 Notes on comparison of process chain analysis and hybrid LCA approach
The hybrid-approach is a combined use of Process Chain Analysis (PCA) and Input-Output-Analysis (IOA). The hybrid-approach completes the process chain analysis (PCA) by a model based on economic input-output-tables and data on sector specific elementary flows of processes not included in the process chain. It serves to check whether the existing process chain is detailed enough or whether the scope of the analysis has to be extended. The character of the processes involved influences the difference in results between both approaches. If only a few processes
61
contribute to the final result (e.g. CO2 emission due to the operation of a coal fired power station) the results of the hybrid-approach and the PCA are more or less the same, regardless of the scope of the analysis. If no single processes are dominating, the overall results increase significantly with the extension of the scope of the analysis.
Also, if fossil and nuclear energy systems are analysed the IOA delivers (at least for some life cycle stages, e.g. building of the power plant) additional results in the same order of magnitude as the PCA. However, these life cycle stages are only of minor importance for the overall result. The hybrid-approach supports an iterative analysis, in which additional processes are covered in detail until the contribution of the IOA is below a certain threshold. In other words: If in a first approximation the IOA part contributes significantly to the results, the analyst has to decide whether a more detailed PCA performed in a second step is necessary to avoid the uncertainties caused by the “average” values generated by the IOA.
The main advantages of the hybrid-approach are firstly, one can make a fast approximation of the possible outcome. Secondly, data gaps of PCA can be closed by approximations provided by the IOA. Therefore, the boundaries of the analysis are broadened and the analysis accounts for all included processes. This is in particular important if a system to be analysed consists of many processes or process steps. However, for fossil fuel power plants the results of a detailed PCA and the hybrid-approach will not differ significantly because the emissions over the whole life cycle are dominated by emissions during operation phase, whereas this life cycle stage is balanced well by both approaches.
62
4 Passenger car transport systems External costs for operational emissions for new technology of passenger cars (VITO 2004; Verbeiren 2003) have been compared with the LCI results of the current fleet in Europe (EU15) and Switzerland, taken from the ecoinvent database (Spielmann et al. 2004). Different sets of damage factors have been used, which should be seen as an attempt to understand ranges of values in a way of sensitivity analyses more than an analysis providing ultimate results.
4.1 Reference current technology The main assumptions in ecoinvent for the assessment of the current fleet of passenger cars in Europe around year 2000 (Spielmann et al. 2004) are summarized in the following:
• Year 2000 emissions from the average passenger car circulating in Switzerland and Europe were considered, taken from Keller and de Haan (2000);
• Composition of fleets in year 2000: 8% diesel cars in Switzerland; 20% diesel cars in Europe;
• The assumed car lifetime corresponds to 150’000 km/vehicle;
• 1.59 passengers/vehicle were assumed for the average car occupation;
• Data for car manufacturing were taken from the lifecycle inventory analysis of the “Golf A4, 1.4 liter Otto” from Schweimer & Levin (2002) – therefore representative of only part of the fleet.
• Car maintenance/disposal has been included;
• Road construction/maintenance/disposal has been also included;
• Emissions of particulates to air from abrasion of tires, brakes, and road were estimated for a 3.5 tonne van and directly applied for average European and Swiss cars. This may somewhat overestimate the emissions from small/medium size cars.
4.2 New technologies The key assumptions (VITO) on new technologies for year 2000, 2005, and 2010 whose external costs are evaluated in this report are described in the following:
- Diesel cars: Direct diesel injection. The after treatment of emissions is effected by an oxicat for euro 3 and 4 (mostly) and an oxicat + particle filter + DeNOx in 2010.
- Petrol cars: The propulsion system is a Otto-engine with indirect injection (multi point injection). The after treatment of emissions is effected by a three-way catalytic converter (lambda 1 control) for euro 3 and 4. In 2010 standard variable valve control is assumed.
- Hybrid diesel: The propulsion system is a diesel engine (see diesel) and a charge sustaining battery technology (Nickel-Metal Hydride batteries (NiMH) in 2010). No charge will be required from the electric grid. This technology is not yet available.
- Hybrid petrol: An Otto-engine (see petrol) combined with a battery technology (NiMH). No charge is required from the electric grid. This technology is already available (e.g. Toyota Prius).
The overview limit values Euro 3 and 4 for passenger cars are illustrated in Tab. 26.

63
Table 26 Emission limit values for Euro 3 and 4 directives. Directive Date* CO
(g/km) NOx+HC (g/km)
HC (g/km)
NOx (g/km)
PM (g/km)
Euro 3 98/69/EC petrol diesel
1/1/2000
2.3 0.64
- 0.56
0.20 -
0.15 0.50
- 0.05
Euro 4 98/69/EC petrol diesel
1/1/2005 1.0 0.50
- 0.30
0.10 -
0.08 0.25
- 0.025
* Introduction date for all new cars.
The emission factors assumed here for new car technologies, from VITO (2004) and Verbeiren et al. (2003), are not equal to the absolute emission values of the emission legislation 98/69/EC, but are based on MEET, Copert III and VITO expertise. These are summarized in Tab. 27 (VITO 2004; Verbeiren 2003).
Table 27 Emission factors assumed for new car technologies (VITO).
Diesel Petrol Hybrid Diesel
Hybrid Petrol
kg/km 2000 (euro 3)
2005 (euro 4)
2010 2000 (euro 3)
2005 (euro 4)
2010 2010 2000 (euro 3)
2005 (euro 4)
2010
GHG 1.59E-01 1.52E-01 1.49E-01 1.99E-01 1.89E-01 1.87E-01 1.12E-01 1.38E-01 1.33E-01 1.29E-01SO2 1.63E-05 5.12E-06 1.00E-06 2.04E-05 6.36E-06 1.26E-06 7.52E-07 1.41E-05 4.48E-06 8.68E-07NOx 6.39E-04 4.28E-04 1.81E-04 2.70E-05 1.50E-05 1.20E-05 1.81E-04 2.07E-05 1.87E-05 1.66E-05PM2.5 3.10E-05 1.53E-05 3.60E-06 1.00E-06 1.00E-06 5.00E-07 1.80E-06 1.00E-06 7.50E-07 5.00E-07VOC 3.07E-05 2.70E-05 1.53E-05 2.60E-05 1.80E-05 8.67E-06 7.67E-06 8.67E-06 6.93E-06 5.20E-06CO 2.46E-04 1.97E-04 1.23E-04 2.60E-03 1.30E-03 8.67E-04 6.16E-05 8.67E-04 6.94E-04 5.20E-04
The assumptions for the sulphur content in fuel for the time frame considered are
Year 2000 150 ppm
Year 2005 50 ppm
Year 2010 10 ppm
Emissions of SO2 are calculated stoichiometrically from the sulphur content.
4.3 Damage factors Two sets of damage factors have been proposed by VITO and IER for a preliminary calculation of external costs of new car technologies. These two sets are based on the same methodology and only differ in some detailed assumptions. They are shown in Tab. 28 and 29, respectively. They reflect the insights developed by the two groups and different ways of calculating European averages for damages from particles and sulphur dioxide, especially for emissions in urban environment (VITO provided explicitly for road transport only the key factors for PM2.5 and SO2). However, considering the several sources of relatively high uncertainties (emissions, dispersion, population densities, background pollution, health effects of particulates depending of their size and composition) and the economic values of damages, the calculated variations may be negligible.
For VITO’s set of damage factors, a population weighted average for the countries included in the study ExternE Core/transport lead to a figure of 29800 Euro/tonne applicable to emission of PM2.5 from rural and highway operation. The cost per tonne for urban trajectories depends heavily on local population density. Following the same rather rudimentary approach, the factor estimated by VITO for particle damage in urban environment is approximately 600’000 Euro/tonne. For diesel cars the numbers for PM2.5 given above have been increased by the value for DME ("Diesel Motor

64
Emissionen", German translation of “emissions from diesel motor”), as shown in Tab. 28. The EU15 damage factors of the base case given in Tab. 5 have been used for all upstream emissions as well as for tire abrasion products. The factor used for abrasion particles may not reflect the real damages, but no specific damage factor has been ascertained within ExternE-Pol. Furthermore, the uncertainties in the inventory data (besides the uncertainty of data on airborne emissions, no consideration has been given here on emissions directly to soil and water as accounted for in the ecoinvent database), combined with the uncertainties for local pollution factors add to the uncertainty in the actual damage factors.
Table 28 Damage factors assumed for the assessment of current and new car technologies: source VITO. Group/Species Damage Factors
upstream1)
(Euro/kg)
Damage FactorsVehicle operation
Rural/Highway
(Euro/kg)
Damage Factors Vehicle operationUrban (Euro/kg)
Damage Factors Vehicle operation
Rural/Highway DIESEL (Euro/kg)
Damage Factors Vehicle operation
Urban DIESEL (Euro/kg)
GHG 0.019 0.019 0.019 0.019 0.019 SO2 2.9 2.724 10.730 2.724 10.730 NOx 2.9 2.908 2.908 2.908 2.908 PM2.5 19.5 29.8 600. 30.7 609.7 As 80. Cd 39. Cr-VI 240. Pb 1600. Ni 3.8 Formaldehyde 0.12 NMVOC (total, unweighted - w/o Formaldehyde) 1.1 1.124 1.124 1.124 1.124
Nitrates (primary) 5.9 Sulfates (primary) 11.7 Radioactive emissions 50000.
(Euro/DALY) 1) “high” emission sources – values rounded.
For the IER’s set of damage factors, reported in Tab. 29, vehicle operation specific factors for ground level emissions were used, taking into account local effects due to SO2 and PM2.5 in three different emission locations. For the estimation of a fictitious average location which would represent a sort of average mix route combining urban and highway/rural roads, 38% urban emissions over total were assumed, based on data collected within the UNITE project, for which data were available for 12 different European countries. For IER estimates, urban conditions comparable to Stuttgart in terms of population density and size are assumed to represent a sort of European urban average, whereas a mix of rural and small towns has been defined to estimate the factor for "extra-urban" conditions (Tab. 29).
IER set does not differentiate between different particle and SO2 damage factors for petrol and diesel, which in view of the approximate character of this exercise introduces no remarkable changes in the results. IER derived the transport specific damage factors in line with those used for the upstream damage factors: reducing all low level emissions in the EU15 by 10% and treating primary and secondary particles according to the recommendations from the findings of this project (ExternE-Pol 2004). Because it is assumed that primary combustion particulates from cars have a higher toxicity than other particulates (e.g. from abrasion), the corresponding “combustion PM2.5” damage factor is 1.5 times the “non-combustion PM2.5” damage factor.
The EU15 damage factors of the base case given in Tab. 5 have been used for all upstream emissions (they are reported rounded also in Tab. 28 and 29, for comparison).

65
Table 29 Damage factors assumed for the assessment of current and new car technologies (rounded): source IER.
Group/Species Damage Factors
upstream1) (Euro/kg)
Damage Factors Vehicle operation2) “average location”3)
(Euro/kg)
Damage Factors Vehicle operation2)
“Urban” (Euro/kg)
Damage Factors Vehicle operation2)
“Extra-Urban” (Euro/kg)
GHG 0.019 0.019 0.019 0.019 SO2 2.9 4.6 5.8 3.9 NOx 2.9 3.2 3.2 3.2 PM2.5 (combustion) 19.5 178. 391. 48. PM2.5 (non-combustion/tire abrasion)4) 119. 261. 32.
As 80. Cd 39. Cr-VI 240. Pb 1600. Ni 3.8 Formaldehyde 0.12 NMVOC (total, unweighted - w/o Formaldehyde) 1.1 1.1 1.1 1.
Nitrates (primary) 5.9 Sulfates (primary) 11.7 Radioactive emissions 50000.
(Euro/DALY) 1) “high” emission sources – values rounded. 2) “low” emission sources (ground level). 3) local damage (for SO2 direct and PM2.5) calculated as mix of urban and extra-urban emissions in EU15 countries in 1998 (share urban: 38%, extra-urban: 62%).
4.4 Results for external costs
It must be stressed that the shown valuations have been performed with a rough approach compared to detailed modelling efforts as for example in the ExternE Core/transport, because the main focus of the work for ExternE-Pol WP6 was on emissions. However, the orders of magnitude of results should be sufficiently representative, but care should be always taken in deriving conclusions that may be strongly affected by different sources of uncertainties. Fig. 41 shows the results for external costs associated with average 2000 European and Swiss passenger car fleet from the ecoinvent database compared to results for new technologies, using VITO damage factors. The emissions per kilometre for highway, rural, and urban conditions are (arbitrarily) assumed to be contributing 1/3 each. Included in the ecoinvent assessment were the manufacturing of cars, road infrastructure, and the fuel chains, which have not been extrapolated to new technologies beyond year 2000. However, in first approximation the order of magnitude of results for infrastructure could be used also for new cars, and the fuel chain contribution could be scaled down by the fuel efficiency. Ecoinvent data of emissions of particles and heavy metals to air, soil, and water from tire and road abrasion as well as brake line wear have not been applied to the data set for new technologies. The used damage factor for PM2.5 from tire and brake abrasion leads to a very tiny contribution, four orders of magnitudes lower than the total external costs for year 2000 average cars and three orders of magnitude lower for the best of new technologies.
Upstream emissions make 25% of external costs of current European fleet of passenger cars, and even 44% of the Swiss fleet, due to the lower share of diesel car and possibly also to higher average efficiency of the cars circulating in Switzerland. More stringent emission limits, reduced sulfur content in the fuel, and efficiency improvements in the year 2000 diesel and petrol cars cause a meaningful reduction of the external costs. In case of the petrol car 2000, the external costs from operation are even lower than the costs associated with upstream emissions.

66
0
0.5
1
1.5
2
2.5
Eur
ope
2000
Sw
itzer
land
2000
2000
(eur
o 3)
2005
(eur
o 4)
2010
2000
(eur
o 3)
2005
(eur
o 4)
2010
2010
2000
(eur
o 3)
2005
(eur
o 4)
2010
Exte
rnal
Cos
ts (E
uro
cent
s / k
m)
AbrasionFuel chain
Car infrastructureEngine operation
Average fleet Diesel Petrol Hybrid
Diesel Petrol
New technologiesAverage 2000
(ecoinvent)
Figure 41 External costs for passenger cars: current European fleet (with upstream contributions) and new technologies (only engine operation included except for diesel and petrol cars 2000, euro 3). Damage factors for emissions of PM2.5 and SO2 during operation: source VITO. Assuming 1/3 each urban, highway, rural.
Fig. 42 shows the relative contributions from various species to external costs of the ecoinvent average fleet including operation as well as upstream burdens. Major contributor to total is the emission of particulates (from combustion and wear). Fig. 43 shows the relative contributions from various species to external costs from the operation (only) of new technologies. Due to the reduction of pollutant emission rates, external costs associated with GHG emissions, basically a function of the efficiency of the engine, make more than 90% of the contribution to total for petrol cars, whereas for new diesel cars the external costs from NOx and particle emissions during operation will still make one third of total external costs in year 2010.
Results of a sensitivity considering 50% of the emissions from urban traffic and 50% from highway/rural are shown in Fig. 44. Compared with the reference case shown in Fig. 41, the calculated differences of external costs for airborne emissions from engine operation are 20% and 8%, and for total cumulative emissions 14% and 4% for European and Swiss average car, respectively. Changes for new cars are around 10%. This confirms that the order of magnitude of the external costs for average driving cycles is sufficiently robust with the given damage factors.

67
0%
10%
20%
30%
40%
50%
60%
70%
80%
90%
100%
Europe 2000 Switzerland 2000
Rad. Em.NMVOCHeavy MetalsPM2.5NOxSO2GHG
Figure 42 Contribution percent to external costs of year 2000 European fleet of passenger cars by
species, full energy chain and infrastructure included. Damage factors for emissions of PM2.5 and SO2 during operation: source VITO.
0%
10%
20%
30%
40%
50%
60%
70%
80%
90%
100%
2000
(eur
o 3)
2005
(eur
o 4)
2010
2000
(eur
o 3)
2005
(eur
o 4)
2010
2010
2000
(eur
o 3)
2005
(eur
o 4)
2010
NMVOCPM2.5NOxSO2GHG
Diesel Petrol HybridDiesel Petrol
Figure 43 Contribution percent to external costs of passenger cars of new technologies by species
(GHG, SO2, NOx, PM2.5, NMVOC); only engine operation included. Damage factors for emissions of PM2.5 and SO2 during operation: source VITO.

68
0
0.5
1
1.5
2
2.5
Eur
ope
2000
Sw
itzer
land
2000
2000
(eur
o 3)
2005
(eur
o 4)
2010
2000
(eur
o 3)
2005
(eur
o 4)
2010
2010
2000
(eur
o 3)
2005
(eur
o 4)
2010
Exte
rnal
Cos
ts (E
uro
cent
s / k
m)
AbrasionFuel chain
Car infrastructureEngine operation
Averagefleet Diesel Petrol Hybrid
Diesel Petrol
New technologiesAverage 2000
(ecoinvent)
Figure 44 External costs for passenger cars: current European fleet (with upstream contributions) and new technologies (only engine operation included except for diesel and petrol cars 2000, euro 3). Damage factors for emissions of PM2.5 and SO2 during operation: source VITO. Sensitivity for 50% share of emissions stemming from urban driving.
Results using the damage factor set of IER are shown in Fig. 45. For new technologies, one third of the emissions per kilometre is (arbitrarily) assumed to be released in urban conditions, the rest in extra-urban locations, whereas direct operation emissions for current fleets from the ecoinvent database, for which the origin of urban vs. extra-urban is not given, have been multiplied by the IER “average location” set (Tab. 29). The higher damage factor assumed for particles from abrasion compared to the previously analyzed set, results in a higher related contribution to external costs but still not greater than a few percent, for current cars. Nevertheless, this appears to be an issue to go deeper into in next LCI and ExternE projects, especially when with future car technologies the importance of upstream and non-combustion related emissions is likely to increase.
Differences with the external costs calculated with VITO’s damage factor sets are not very large: on the order of a few percent points for current fleet and new petrol cars, and around 10% for new diesel cars.
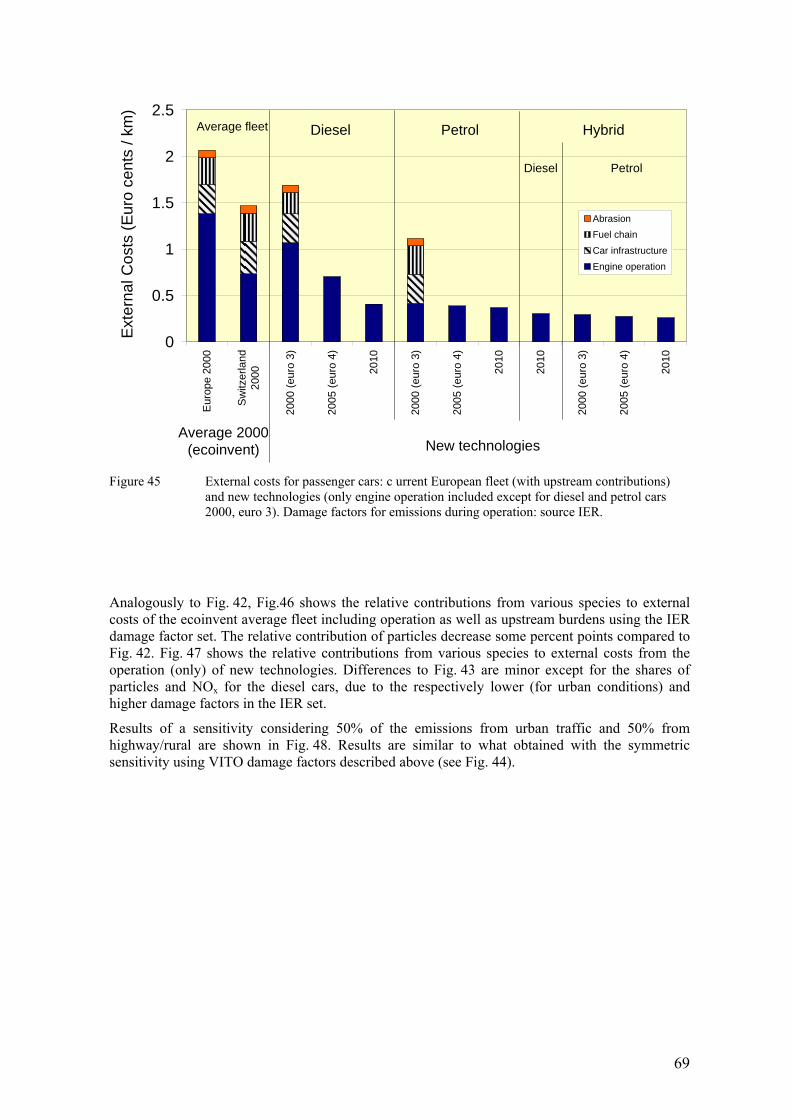
69
0
0.5
1
1.5
2
2.5
Eur
ope
2000
Sw
itzer
land
2000
2000
(eur
o 3)
2005
(eur
o 4)
2010
2000
(eur
o 3)
2005
(eur
o 4)
2010
2010
2000
(eur
o 3)
2005
(eur
o 4)
2010
Exte
rnal
Cos
ts (E
uro
cent
s / k
m)
AbrasionFuel chain
Car infrastructureEngine operation
Average fleet Diesel Petrol Hybrid
Diesel Petrol
New technologiesAverage 2000
(ecoinvent)
Figure 45 External costs for passenger cars: c urrent European fleet (with upstream contributions) and new technologies (only engine operation included except for diesel and petrol cars 2000, euro 3). Damage factors for emissions during operation: source IER.
Analogously to Fig. 42, Fig.46 shows the relative contributions from various species to external costs of the ecoinvent average fleet including operation as well as upstream burdens using the IER damage factor set. The relative contribution of particles decrease some percent points compared to Fig. 42. Fig. 47 shows the relative contributions from various species to external costs from the operation (only) of new technologies. Differences to Fig. 43 are minor except for the shares of particles and NOx for the diesel cars, due to the respectively lower (for urban conditions) and higher damage factors in the IER set.
Results of a sensitivity considering 50% of the emissions from urban traffic and 50% from highway/rural are shown in Fig. 48. Results are similar to what obtained with the symmetric sensitivity using VITO damage factors described above (see Fig. 44).
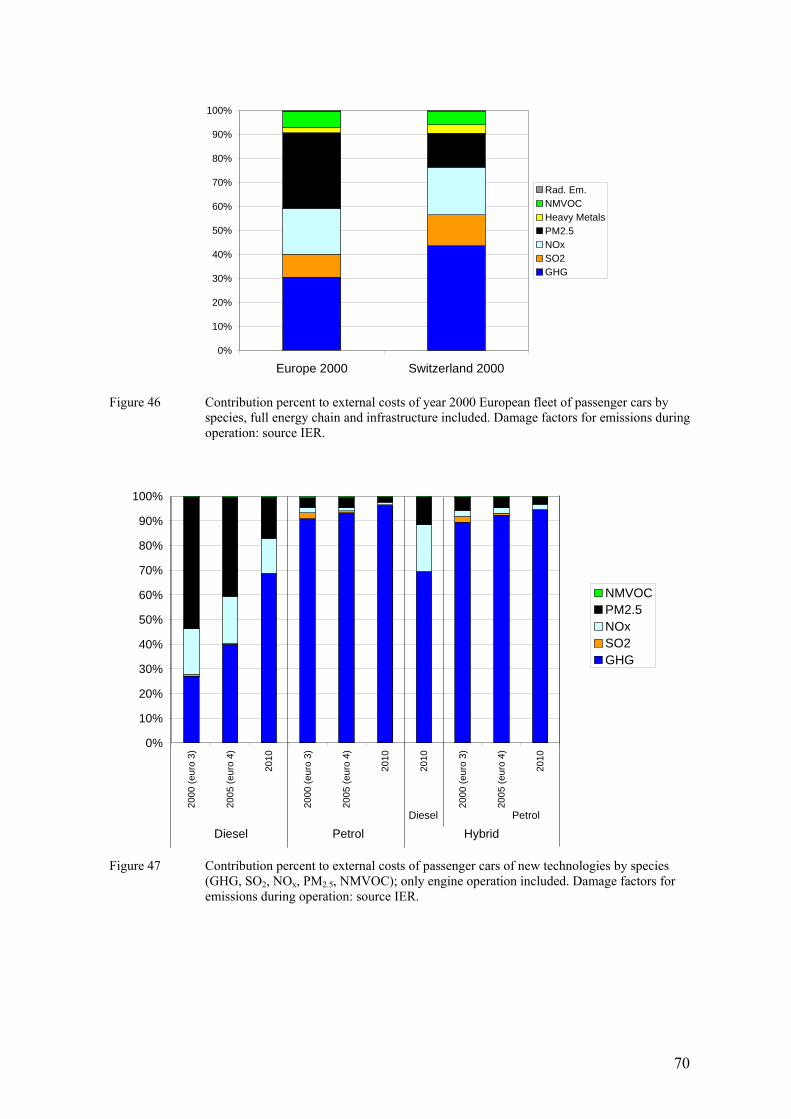
70
0%
10%
20%
30%
40%
50%
60%
70%
80%
90%
100%
Europe 2000 Switzerland 2000
Rad. Em.NMVOCHeavy MetalsPM2.5NOxSO2GHG
Figure 46 Contribution percent to external costs of year 2000 European fleet of passenger cars by
species, full energy chain and infrastructure included. Damage factors for emissions during operation: source IER.
0%
10%
20%
30%
40%
50%
60%
70%
80%
90%
100%
2000
(eur
o 3)
2005
(eur
o 4)
2010
2000
(eur
o 3)
2005
(eur
o 4)
2010
2010
2000
(eur
o 3)
2005
(eur
o 4)
2010
NMVOCPM2.5NOxSO2GHG
Diesel Petrol HybridDiesel Petrol
Figure 47 Contribution percent to external costs of passenger cars of new technologies by species
(GHG, SO2, NOx, PM2.5, NMVOC); only engine operation included. Damage factors for emissions during operation: source IER.

71
0
0.5
1
1.5
2
2.5
Euro
pe 2
000
Switz
erla
nd20
00
2000
(eur
o 3)
2005
(eur
o 4)
2010
2000
(eur
o 3)
2005
(eur
o 4)
2010
2010
2000
(eur
o 3)
2005
(eur
o 4)
2010
Ext
erna
l Cos
ts (E
uro
cent
s / k
m)
AbrasionFuel chain
Car infrastructureEngine operation
Averagefleet Diesel Petrol Hybrid
Diesel Petrol
New technologiesAverage 2000
(ecoinvent)
Figure 48 External costs for passenger cars: current European fleet (with upstream contributions) and new technologies (only engine operation included except for diesel and petrol cars 2000, euro 3). Damage factors for emissions during operation: source IER. Sensitivity for 50% share of emissions stemming from urban driving.
4.5 Conclusions • For average circulating cars in year 2000, the operation is the largest contributor to total
external costs. Upstream emissions (fuel chain and infrastructure) contribute 25 - 30% of total external costs for EU15 average car and about 45% for Swiss average car.
• For new technologies already available in year 2000 complying with euro 3 standard and fuelled by petrol, damages associated with upstream emissions become greater than operational emissions, roughly 60% vs. 40%, respectively. For diesel fuel, the operational phase (including abrasion) still prevails, making roughly 70% of the total external costs.
• In general, for new technologies and more stringent emission regulations, it is expected that upstream emissions may dominate operational emissions (and impacts).
• The more stringent the regulation for pollutants’ emissions and the more efficient the engines, the more the external costs from exhaust emissions will be dominated by the GHG component, for the considered GHG damage factor.
• With the considered sets of damage factors and given the proper weight to the coarse approach used in this study to calculate the external costs for average driving cycles, the calculated orders of magnitude of external costs appear to be sufficiently representative for current and new technologies. However, it is recommended to further study the LCI of new cars and infrastructures as well as to improve the damage factors, in particular of the abrasion particles.

72
5 General conclusions and outlook Process chain analysis has been applied by different teams using somewhat different life cycle inventory databases. However, the results for external costs of current and new energy technologies with associated energy systems are in relatively close agreement, and the minor differences can be easily explained with input data and assumptions. Therefore, these external costs can be reliably used for different applications and comparisons.
The cumulative life cycle inventories do not contain explicit information on the location of the emission sources. Therefore, the external costs presented here were calculated based on average damage factors for emissions in Europe, in agreement with the common practice in present life cycle impact assessment. However, life cycle assessment links the production processes of different regions of the world. Because impact factors as well as valuation factors can differ significantly for different countries or locations, further investigation of the location of emissions would be valuable. Assessment of external costs for site-specific conditions for future energy systems for the various energy sources (especially fossil power plants) should be pursued in future studies. Preliminary sensitivity analyses performed for electricity systems have shown the relative importance for external costs assessment of wind and photovoltaics of aspects like pollutant release height and population density. Cumulative external costs of fossil and biomass-fuelled systems are likely to be less affected by evaluation of up- and downstream processes including fuel supply with respect to different local conditions. However, the impacts due to emissions caused by some stages of the fuel supply here not analyzed into detail, such as long distance fuel transport outside the EU, have to be particularly investigated.
In the current exercise, external costs were calculated based on average European damage factors for all fuel cycle stages. This is an approximation which for certain processes (in particular transport processes) should be refined to better reflect the location of the emission, which is very important for estimating the range of the results. In particular for the external costs of road passenger transport systems, the level of detail of the analysis is not comparable to dedicated studies like e.g. ExternE Core/Transport (European Commission 2000). This has to be taken into account when interpreting the results.
The preliminary analysis for cars highlights the importance of addressing the infrastructure of cars for the estimation of consistent total environmental inventories and hence of life cycle external cost from the car systems. Moreover, further studies should aim at improving both, emission factor and damage factor for the abrasion particles.
Additional advanced and innovative technologies (e.g., hydrogen production and utilization; CO2 capture and sequestration technologies) and different time horizons should be further analysed, as already planned in the NEEDS project (2004-2008) of the ExternE series. As well, a wider range of renewable technologies should be assessed, like wood pellets, wood/biomass gasification, solar thermal plants, etc. For all technologies the time horizon needs to be extended beyond near future.
It is recommended to rework the estimation of damage factors from radioactive emissions in future projects of the ExternE series, because the currently available factors do not match the available isotope emission inventories.

73
6 Appendix 6.1 Allocation In order to attribute the energy and material requirements as well as burdens of CHP plants to the two co-products heat and electricity, an allocation method must be chosen. Herewith applied is the exergy allocation, thus accounting for the different thermodynamic quality of the co-products.
Exergy measures which part of a quantity of energy can be made available in the form of work. This definition assumes that mechanical work as well as electrical energy are pure exergy. The second fundamental theorem of thermodynamics describes the losses connected with transformation of heat into another form of energy. Hence, the exergy content exth of a unit of heat (which is available at a temperature Tm in an ambient temperature of T0) is represented by the ratio of the exergy of the heat Exth and the heat Q:
⎟⎟⎠
⎞⎜⎜⎝
⎛−==
m
thth T
TQ
Exex 01
Temperatures are expressed as Kelvin [K]. The ambient temperature T0 is specified with 288 K. Hence, the allocation factor for electricity is
thel
elel ExW
WAll
+=
Using this allocation factor emissions can be allocated to the functional unit of 1 kWhe In the same way an allocation factor for the functional unit kWhth is applied.

74
References Bauer C. (2004) Holzenergie. In: Dones et al. (2004) Sachbilanzen von Energiesystemen: Grundlagen für den ökologischen Vergleich von Energiesystemen und den Einbezug von Energiesystemen in Ökobilanzen für die Schweiz. Final report ecoinvent 2000 No. 6. Paul Scherrer Institut Villigen; Swiss Centre for Life Cycle Inventories, Dübendorf, Switzerland. Retrieved from: www.ecoinvent.ch.
Bolliger R. and Bauer C. (2004) Wasserkraft. In: Dones et al. (2004) Sachbilanzen von Energiesystemen: Grundlagen für den ökologischen Vergleich von Energiesystemen und den Einbezug von Energiesystemen in Ökobilanzen für die Schweiz. Final report ecoinvent 2000 No. 6. Paul Scherrer Institut Villigen; Swiss Centre for Life Cycle Inventories, Dübendorf, Switzerland. Retrieved from: www.ecoinvent.ch.
Briem S., Blesl M., Fahl, U., Ohl M. (2004): Chapter 10 Fossil gefeuerte Kraftwerke. In: Briem S., Blesl M., Fahl U., Ohl M., Moerschner J., Eltrop L., Voß A., Viebahn P., Krewitt W., Gürzenich D., Tryfonidou R., Wagner H.-J., Corradini R. and Richter S. (2004) Lebenszyklusanalysen ausgewählter zukünftiger Stromerzeugungstechniken, Ein Forschungsvorhaben mit finanzieller Unterstützung des Bundesministeriums für Wirtschaft und Arbeit. Stuttgart, pp. 253-339.
Doka G. (2003): Life Cycle Inventories of Waste Treatment Services. Final report ecoinvent 2000 No. 13, EMPA St. Gallen, Swiss Centre for Life Cycle Inventories, Dübendorf, Switzerland. Retrieved from: www.ecoinvent.ch.
Dones R., Bauer C., Bolliger R., Burger B., Faist Emmenegger M., Frischknecht R., Heck T., Jungbluth N. and Röder A. (2004a) Sachbilanzen von Energiesystemen: Grundlagen für den ökologischen Vergleich von Energiesystemen und den Einbezug von Energiesystemen in Ökobilanzen für die Schweiz. Final report ecoinvent 2000 No. 6. Paul Scherrer Institut Villigen; Swiss Centre for Life Cycle Inventories, Dübendorf, Switzerland. Retrieved from: www.ecoinvent.ch.
Dones R., Bauer C., Bolliger R., Burger B., Faist Emmenegger M., Frischknecht R., Heck T., Jungbluth N. and Röder A. (2004b) Life Cycle Inventories of Energy Systems: Results for Current Systems in Switzerland and other UCTE Countries. Final report ecoinvent 2000 No. 5. Paul Scherrer Institut, Villigen; Swiss Centre for Life Cycle Inventories, Dübendorf, Switzerland. Retrieved from: www.ecoinvent.ch.
Dones R., Heck T. and Hirschberg S. (2004c) Greenhouse Gas Emissions from Energy Systems, Comparison and Overview. In: Cleveland C. (Ed.) Encyclopedia of Energy, Vol. 3, pp. 77-95. Academic Press/Elsevier, San Diego, USA.
Dones R., Gantner U., Hirschberg S., Doka G. and Knoepfel I. (1996) Environmental Inventories for Future Electricity Supply Systems for Switzerland. PSI Report No.96 07, Villigen, Switzerland.
Dreicer M., Tort V. and Manen P. (1995) ExternE, Externalities of Energy, Vol. 5, Nuclear. Centre d’Étude sur l’Evaluation de la Protection dans le Domaine Nucléair (CEPN), France; European Commission DGXII, Science, Research and Development JOULE, Luxembourg.
Droste-Franke B. and Deyneko T. (2004) EcoSense LE. IER, University of Stuttgart, Germany.
European Commission (2004) New Elements for the Assessment of External Costs from Energy Technologies (NewExt). Brussels, European Commission, DG Research, Technological Development and Demonstration (RTD).
European Commission (2003) An applied integrated environmental impact assessment framework for the European Union (GREENSENSE). Brussels, European Commission DG Research.
European Commission (2000) “External Costs of Energy Conversion – Improvement of the Externe Methodology And Assessment Of Energy-Related Transport Externalities”. European Commission. Final Report for Contract JOS3-CT97-0015, published as Environmental External Costs of Transport. R. Friedrich & P. Bickel (Eds.). Springer Verlag, Heidelberg (2001).
European Commission (1999) Externalities of fuel cycles. ExternE - Externalities of energy. Volume 7: Methodology 1998 update. European Commission, DG XII, Science, Research and Development, Brussels.
ExternE-Pol (2004) Externalities of Energy: Extension of accounting framework and Policy Applications. Final Technical Report.
Faist Emmenegger M., Heck T. and Jungbluth N. (2004) Erdgas. In: Dones et al. (2004) Sachbilanzen von Energiesystemen: Grundlagen für den ökologischen Vergleich von Energiesystemen und den Einbezug von Energiesystemen in Ökobilanzen für die Schweiz. Final report ecoinvent 2000 No. 6. Paul Scherrer Institut

75
Villigen; Swiss Centre for Life Cycle Inventories, Dübendorf, Switzerland. Retrieved from: www.ecoinvent.ch.
Frischknecht R., Jungbluth N., Althaus H.-J., Doka G., Dones R., Heck T., Hellweg S., Hischier R., Nemecek T., Rebitzer G. and Spielmann M. (2004) Overview and Methodology. Final report ecoinvent 2000 No. 1. Swiss Centre for Life Cycle Inventories, Dübendorf, Switzerland. Retrieved from: www.ecoinvent.ch.
Frischknecht R., Braunschweig A., Hofstetter P. and Suter P. (2000) Human health damages due to ionising radiation in life cycle impact assessment. Environ. Impact Assessment Rev. 20 pg. 159-189.
Frischknecht R., Hofstetter P., Knoepfel I., Ménard M., Dones R., and Zollinger E. (1996) Ökoinventare von Energiesystemen. Grundlagen für den ökologischen Vergleich von Energiesystemen und den Einbezug von Energiesystemen in Ökobilanzen für die Schweiz. Zürich.
Gantner U., Jakob M. and Hirschberg S. (2001) Perspektiven der zukünftigen Strom- und Wärmeversorgung für die Schweiz – Ökologische und ökonomische Betrachtungen. Project GaBE, PSI Report Nr. 01-12, Villigen, Switzerland. Retrievable at http://www.psi.ch/gabe/ as “Perspektiven der zukünftigen Energieversorgung in der Schweiz unter Berücksichtigung von nachfrageorientierten Massnahmen – Ökologische und ökonomische Betrachtungen (12.Mai 2001)”.
Goedkoop M. and Spriensma R. (2000) The Eco-indicator 99: A damage oriented method for life cycle impact assessment. PRé Consultants, Amersfoort, The Netherlands.
Guinèe J. B., (final editor), Gorrée M., Heijungs R., Huppes G., Kleijn R., de Koning A., van Oers L., Wegener Sleeswijk A., Suh S., Udo de Haes H. A., de Bruijn H., van Duin R., Huijbregts M. A. J., Lindeijer E., Roorda A. A. H. and Weidema B. P. (2001) Life cycle assessment; An operational guide to the ISO standards; Part 3: Scientific Background. Ministry of Housing, Spatial Planning and Environment (VROM) and Centre of Environmental Science (CML), Den Haag and Leiden, The Netherlands.
IPCC (2001) Houghton J.T., Ding Y., Griggs D.J., Noguer M., van der Linden P.J., Dai X., Maskell K., and Johnson C.A., Climate Change 2001: The Scientific Basis. Contribution of Working Group I to the Third Assessment Report of the Intergovernmental Panel on Climate Change. Cambridge University Press, Cambridge, United Kingdom and New York, USA.
Jungbluth N. (2004) Photovoltaik. In: Dones et al. (2004) Sachbilanzen von Energiesystemen: Grundlagen für den ökologischen Vergleich von Energiesystemen und den Einbezug von Energiesystemen in Ökobilanzen für die Schweiz. Final report ecoinvent 2000 No. 6. Paul Scherrer Institut Villigen; Swiss Centre for Life Cycle Inventories, Dübendorf, Switzerland. Retrieved from: www.ecoinvent.ch.
Jungbluth N., Bauer C., Dones R. and Frischknecht R. (2005) Life Cycle Assessment for Emerging Technologies: Case Studies for Photovoltaic and Wind Power. In: Int J LCA Vol. 10 (1) 24-34.
Keller M. and de Haan P. (2000) Luftschadstoffemissionen des Strassenverkehrs 1950-2020: Nachtrag. Nr. 255. Bundesamt für Umwelt, Wald und Landschaft (BUWAL), Bern, Switzerland.
Krewitt W., Trukenmüller A., Bachmann T.M. and Heck T. (2001) Country-specific damage factors for air pollutants. A step towards site dependent Life Cycle Impact Assessment. Int. J. LCA, 6, pg. 199–210.
Mörschner J. and Eltrop L. (2004) Chapter 9 Biomasse. In: Briem S., Blesl M., Fahl U., Ohl M., Moerschner J., Eltrop L., Voß A., Viebahn P., Krewitt W., Gürzenich D., Tryfonidou R., Wagner H.-J., Corradini R. and Richter S. (2004) Lebenszyklusanalysen ausgewählter zukünftiger Stromerzeugungstechniken, Ein Forschungsvorhaben mit finanzieller Unterstützung des Bundesministeriums für Wirtschaft und Arbeit. Stuttgart, pp. 199-249.
Nagra (2002) Project Opalinus Clay - Safety Report - Demonstration of disposal feasibility for spent fuel, vitrified high-level waste and long-lived intermediate-level waste (Entsorgungsnachweis). No. NTB 02-05 Nagra Technical Report, Nagra, Wettingen, Switzerland.
Prognos, IER, WI (2002) Szenarienerstellung, Endbericht an die Enquete-Kommission „Nachhaltige Energieversorgung unter den Bedingungen der Globalisierung und der Liberalisierung“ des 14. Deutschen Bundestages, Prognos AG, Institut für Energiewirtschaft und Rationelle Energieanwendung, Universität Stuttgart, Wuppertal Institut für Klima, Umwelt, Energie, Basel, Stuttgart, Wuppertal, Juli 2002.
Schweimer G. and Levin M. (2002) Life cycle inventory for the Golf A4. Retrieved from http://www.volkswagenumwelt.de/_content/service_935.asp.

76
Spielmann M., Kägi T., Stadler P. and Tietje O. (2004) Life Cycle Inventories of Transport Services. Final report ecoinvent 2000 No. 14. UNS, ETH-Zurich, Swiss Centre for Life Cycle Inventories, Dübendorf, Switzerland. Retrieved from: www.ecoinvent.ch.
Tol R.S.J. and Downing T.E. (2000) The Marginal Costs of Climate Changing Emissions. Institute for Environmental Studies, Amsterdam, The Netherlands.
Verbeiren S., De Vlieger I., Pelkmans L., De Keyser W. and Springael J. (2003) SUSATRANS, Sustainability evaluation of individual technologies (Task A). VITO-report 2003/IMS/R14. Belgium.
VITO (2004) Transport emission model TEMAT 2004. Belgium.