Extent, configuration and diversity of burned and forested ...
15
RESEARCH ARTICLE Extent, configuration and diversity of burned and forested areas predict bat richness in a fire-maintained forest Rachel V. Blakey . Elisabeth B. Webb . Dylan C. Kesler . Rodney B. Siegel . Derek Corcoran . Jerry S. Cole . Matthew Johnson Received: 24 February 2020 / Accepted: 28 January 2021 Ó The Author(s) 2021 Abstract Context Fire transforms, fragments and sometimes maintains forests, creating mosaics of burned and unburned patches. Highly mobile animals respond to resources in the landscape at a variety of spatial scales, yet we know little about their landscape-scale rela- tionships with fire. Objectives We aimed to identify drivers of bat richness in a landscape mosaic of forested and burned areas while identifying spatial scales at which bat richness was most strongly related to extent, config- uration, and diversity measures of landscape-level habitat. Methods We used multi-species hierarchical occu- pancy modelling to relate bat richness to landscape variables at 10 spatial scales, based on acoustic data collected in the Sierra Nevada, United States. We also assessed redundancy among landscape variable type (extent, configuration, and diversity) and between focal patch types (forested and burned). Results Bat richness was positively associated with heterogenous landscapes, shown by positive associa- tions with pyrodiversity, extent and mean area of Supplementary Information The online version contains supplementary material available at https://doi.org/10.1007/ s10980-021-01204-y. R. V. Blakey (&) Missouri Cooperative Fish and Wildlife Research Unit, School of Natural Resources, University of Missouri, Busch Natural Resources Building, 302 Anheuser, Columbia, MO 65211, USA e-mail: [email protected] R. V. Blakey D. C. Kesler R. B. Siegel J. S. Cole The Institute for Bird Populations, PO Box 518, Petaluma, CA 94953, USA Present Address: R. V. Blakey La Kretz Center for California Conservation Science, Institute of the Environment and Sustainability, University of California, Los Angeles, California 90095, USA E. B. Webb U.S. Geological Survey, Missouri Cooperative Fish and Wildlife Research Unit, School of Natural Resources, University of Missouri, Busch Natural Resources Building, 302 Anheuser, Columbia, MO 65211, USA D. Corcoran Department of Ecology & Evolutionary Biology, University of Connecticut, Storrs, Connecticut, USA D. Corcoran Departamento de Ecologı ´a, Facultad de Ciencias Biolo ´gicas, Pontificia Universidad Cato ´lica de Chile, Santiago, Chile M. Johnson Inventory & Monitoring Division, U.S. National Park Service, Southern Colorado Plateau Network, 2255 N Gemini Dr, Flagstaff, AZ 86001, USA 123 Landscape Ecol https://doi.org/10.1007/s10980-021-01204-y
Transcript of Extent, configuration and diversity of burned and forested ...

RESEARCH ARTICLE
Extent, configuration and diversity of burned and forestedareas predict bat richness in a fire-maintained forest
Rachel V. Blakey . Elisabeth B. Webb . Dylan C. Kesler . Rodney B. Siegel .
Derek Corcoran . Jerry S. Cole . Matthew Johnson
Received: 24 February 2020 / Accepted: 28 January 2021
� The Author(s) 2021
Abstract
Context Fire transforms, fragments and sometimes
maintains forests, creating mosaics of burned and
unburned patches. Highly mobile animals respond to
resources in the landscape at a variety of spatial scales,
yet we know little about their landscape-scale rela-
tionships with fire.
Objectives We aimed to identify drivers of bat
richness in a landscape mosaic of forested and burned
areas while identifying spatial scales at which bat
richness was most strongly related to extent, config-
uration, and diversity measures of landscape-level
habitat.
Methods We used multi-species hierarchical occu-
pancy modelling to relate bat richness to landscape
variables at 10 spatial scales, based on acoustic data
collected in the Sierra Nevada, United States. We also
assessed redundancy among landscape variable type
(extent, configuration, and diversity) and between
focal patch types (forested and burned).
Results Bat richness was positively associated with
heterogenous landscapes, shown by positive associa-
tions with pyrodiversity, extent and mean area ofSupplementary Information The online version containssupplementary material available at https://doi.org/10.1007/s10980-021-01204-y.
R. V. Blakey (&)
Missouri Cooperative Fish and Wildlife Research Unit,
School of Natural Resources, University of Missouri,
Busch Natural Resources Building, 302 Anheuser,
Columbia, MO 65211, USA
e-mail: [email protected]
R. V. Blakey � D. C. Kesler � R. B. Siegel � J. S. ColeThe Institute for Bird Populations, PO Box 518, Petaluma,
CA 94953, USA
Present Address:R. V. Blakey
La Kretz Center for California Conservation Science,
Institute of the Environment and Sustainability,
University of California, Los Angeles,
California 90095, USA
E. B. Webb
U.S. Geological Survey, Missouri Cooperative Fish and
Wildlife Research Unit, School of Natural Resources,
University of Missouri, Busch Natural Resources
Building, 302 Anheuser, Columbia, MO 65211, USA
D. Corcoran
Department of Ecology & Evolutionary Biology,
University of Connecticut, Storrs, Connecticut, USA
D. Corcoran
Departamento de Ecologıa, Facultad de Ciencias
Biologicas, Pontificia Universidad Catolica de Chile,
Santiago, Chile
M. Johnson
Inventory & Monitoring Division, U.S. National Park
Service, Southern Colorado Plateau Network, 2255 N
Gemini Dr, Flagstaff, AZ 86001, USA
123
Landscape Ecol
https://doi.org/10.1007/s10980-021-01204-y(0123456789().,-volV)( 0123456789().,-volV)

burned patches, burned and forested edge density and
patch density and relationships were generally con-
sistent across scales. Extent of forest cover and burned
areas were highly correlated, but configuration and
diversity of these patch types diverged.
Conclusions Bat communities of our study area
appear to be largely resilient to wildfire and adapted to
more heterogenous forests and shorter-interval fire
regimes that likely predominated before the fire
suppression era.
Keywords Acoustic � Chiroptera � Hierarchicaloccupancy model � Pyrodiversity � Western united
states � Wildfire
Introduction
Fires transform and fragment forests, creating mosaics
of burned and unburned areas and interfaces between
them (Lloret et al. 2002; Parkins et al. 2018). While
effects of forest heterogeneity on wildlife have been
comparatively well studied, we know much less about
how the configuration of burned areas influences
biodiversity (Kelly et al. 2012; Parkins et al. 2018).
Highly mobile animals in particular, have the ability to
move between burned and unburned patches and
therefore may respond to landscape composition,
configuration and diversity at multiple scales (Rocha
et al. 2016; Tingley et al. 2016b; Nimmo et al. 2019).
Limited research indicates that highly mobile animals
may benefit from increased mobility and foraging
opportunities afforded by fire edges (Eyes et al. 2017;
Vanbianchi et al. 2017) but this is not consistent across
species (Eby et al. 2013; Geary et al. 2019). Positive
relationships between species richness and pyrodiver-
sity have led to an increasing focus on managing
landscapes with heterogenous burn patterns (Sitters
et al. 2014; Ponisio et al. 2016; Tingley et al. 2016b).
However, translating this appreciation for the value of
burn heterogeneity into regional management for
highly mobile species will require understanding the
aspects of burned area configuration to be managed
and the appropriate scale for management as well as
underlying drivers of biodiversity-fire relationships
(Swan et al. 2015; Kelly and Brotons 2017; Nimmo
et al. 2019).
Insectivorous bats are highly mobile predators that
respond to forest structure and fire based on their
diverse call and morphological traits (Schnitzler et al.
2003; Denzinger and Schnitzler 2013; Blakey et al.
2019). At fine spatial scales (B 500 m), bats adapted to
open areas and many edge-adapted species benefit
from higher burn severity and more frequent fire
(Armitage and Ober 2012; Buchalski et al. 2013;
Inkster-Draper et al. 2013; Cox et al. 2016; Blakey
et al. 2019; Steel et al. 2019). Bats also use edges and
openings created by timber harvest (Law et al. 2016b
and references therein). Clutter-tolerant species may
be negatively associated with forest openings and
burned areas, but the evidence is not consistent across
studies (Law and Chidel 2002; Morris et al. 2010;
Webala et al. 2011; Buchalski et al. 2013; Cox et al.
2016; Silvis et al. 2016; Blakey et al. 2019). Openings
and edges can act as movement corridors, connecting
habitat patches (Kalcounis-Rueppell et al. 2013) or
provide high quality foraging habitat (Malison and
Baxter 2010; Gonsalves et al. 2012), by combining
ease of flight and echolocation in open space with
abundant prey in cluttered vegetation along edges
(Arrizabalaga-Escudero et al. 2015).
Bats respond to habitat features at different spatial
scales (Perry et al. 2008; Mendes et al. 2017; Starbuck
et al. 2020). At a fine scale (\100 m), habitat use is
often driven by prey abundance or fine-scale habitat
structure such as presence of water or edges (Morris
et al. 2010; Muller et al. 2012; Blakey et al. 2017a). At
home range scales ([ 500 m), habitat use may be
influenced by the extent or configuration of resources
(forest, edge, open areas, roost networks, water)
(Lookingbill et al. 2010; Johnson et al. 2012;
Fuentes-Montemayor et al. 2017). A study in Califor-
nia showed that, when considered together, bat cap-
tures increased as the density of forest edge within 1.5
km increased (Duff and Morrell 2007). In agricultural
systems of Europe, bat richness and overall activity
increased with proximity to forest edges (Heim et al.
2015). Although high levels of habitat fragmentation
can reduce bat richness and activity, for example in
urban or agricultural settings (Hale et al. 2012; Russo
and Ancillotto 2015; Mendes et al. 2017), heterogene-
ity of vegetation also may positively influence bats at
the landscape scale by increasing edge density (Kling-
beil and Willig 2009). The scale at which bats respond
most strongly to habitat varies with their mobility, as
well as morphological and call traits (Farneda et al.
123
Landscape Ecol

2015; Fuentes-Montemayor et al. 2017), leading to
scale-dependent relationships between landscape
structure and bat richness (Mendes et al. 2017). To
date, landscape-scale effects of fire on bat communities
have included investigation of the extent of high
severity burned area at 2 km scale (Buchalski et al.
2013), burn severity and pyrodiversity at scales B 500
m (Steel et al. 2019) and burn severity at scales from 90
m to 5,760 m (Starbuck et al. 2020). The landscape
diversity and configuration of burned and forested
areas have not been investigated simultaneously and
the influence of the configuration of burned areas on bat
communities remains unstudied.
We studied how bat richness varied in response to
five landscape variables representing extent, configu-
ration, and diversity of burned and forested areas. Our
aim was to better understand the complex relation-
ships among forest cover, fire, and diversity of highly
mobile animals. We chose to investigate forested areas
alongside burned areas because previous studies have
provided evidence that changes to vegetation structure
are key to mammal response to fire (Swan et al. 2015;
Blakey et al. 2019).We aimed to identify drivers of bat
richness in a landscape mosaic of forest and burned
areas, identifying the spatial scale at which bat
richness is most strongly related to extent, configura-
tion and diversity measures of landscape-level habitat
and assessing redundancy among landscape variables.
We made six specific predictions (Table 1).
Methods
Study area
We surveyed bats in Plumas National Forest (4638
km2), which encompasses part of the Sierra Nevada
mountain range in northern California (40�0000100N120�4000500W, Fig. 1). Elevations within the Forest
range from 311 to 2433m, mean annual rainfall is high
for the state of California (1036± 306 mm), and mean
temperature is 10.1 ± 0.9 �C (1895–2017; Western
Regional Climate Center 2017). Dominant vegetation
includes lower and upper montane forest such as
ponderosa pine (Pinus ponderosa) mixed conifer,
white fir (Abies concolor) mixed conifer and red fir
(Abies magnifica) forest, interspersed with meadows
and montane chaparral (Fites-Kaufman et al. 2007).
The forest has experienced seven particularly large ([
20,000 ha) wildfires occurring since 2000. The study
area was not highly fragmented at the time of the
study, with 66% forest cover, 11% open (treeless)
unburned areas, 14% burned forested areas and 9%
both burned and open areas (USDA Forest Service
2017, 2019). However, this structure may not reflect a
historical state, as recent Northern Sierra Nevada
vegetation structure (2005) is likely to have greater
cover of dense forest, larger patch sizes, and more
homogeneous vegetation structure than historical
vegetation prior to widespread timber harvesting
(1941) (Lydersen and Collins 2018).
Bat surveys
We surveyed bats acoustically and analyzed bat calls
using methods described in detail in Blakey et al.
(2019) and briefly summarized here. We sampled 83
randomly selected sites within Plumas National
Forest, recording echolocating bats using Pettersson
D500x bat detectors (Pettersson Elektronik, Uppsala,
Sweden) over three spring-summer periods, corre-
sponding to bat lactation season and the period of
greatest bat activity. Within these periods, sampling
was conducted between 8 June and 31 July 2015, 31
May–8 August 2016 and 12 June–24 July 2017 and
individual sites were not revisited in multiple years.
As year (2015, 2016, 2017) was not a significant
predictor of bat species occupancy in a previous study
using the same dataset (Blakey et al. 2019), we did not
include it in our models. We visited each site once and
placed a bat detector with the microphone elevated to
2 m to record from before sunset to after sunrise (7:30
pm–6:30 am) for three consecutive nights. We used
automated acoustic analysis software (SonoBat 4.2.2,
SonoBat, Arcata, CA, US) to identify bats to species
(where possible). We used the SonoVet tool to
manually check calls that had been identified to
species by the software to ensure a high level of
confidence in the identifications (Russo and Voigt
2016). A species was recorded as ‘‘detected’’ when at
least one call was of sufficient quality with diagnostic
characteristics for confident identification; detection
was recorded for each night separately.
Focal patch types (forested and burned areas)
We calculated extent of forest cover and burned areas
(proportional cover of all forested or burned patches
123
Landscape Ecol

within buffer) at 10 spatial scales defined by 10
concentric buffers of 1–10 km radius around each
study site (Fig. 1c, d). Given the number of sites (n =
83), within the 4638 km2 study area, some buffers
overlapped, and this overlap increased with buffer
radius. Median number of buffers overlapping with
each site ranged from 0 at 1 km to 12 at 10 km and
proportion overlap (the mean across each site’s
overlap with its maximum overlapping site) was
0.10 ± 0.01 SD (1 km) and 0.77 ± 0.02 (10 km). To
assess how increasing overlap among buffers may
influence characterization of our landscape over and
above inherent spatial autocorrelation, we compared
variograms of our sites (all 10 buffers), with a set of 25
sites evenly spaced 20 km apart across the study area
to provide non-overlapping buffers from 1 to 10 km
(Fig. S1, Supplementary material). We found that at
larger buffer sizes, the relationships between site
similarity and distance between sites appeared similar
across our study buffers and the non-overlapping
buffers, giving us confidence that increased similarity
between sites at larger buffer sizes is due to a broader
sample of the landscape, rather than increased overlap
(Fig. S1). To calculate forest cover, we first extracted
canopy cover from vegetation mapping polygon data
(USDA Forest Service 2019) based on the CALVEG
(‘‘Classification and Assessment with Landsat of
Visible Ecological Groupings’’), which has an approx-
imate grain size of 30 m (Nelson et al. 2015) and was
developed from source data from 2000 to 2014 (USDA
Forest Service 2019) (Fig. 1a). We discovered that not
all fires had been updated within the dataset; vegeta-
tion source data was from a time period that preceded
25 fires occurring between 1996 and 2015, this area
represented 7% of the study area. As a full revision of
the vegetation dataset was out the scope of this study,
we visually inspected maps of the high severity
patches of these 25 fires and confirmed that they
largely represented open areas at the time of the study,
using 2016 one meter National Agriculture Imagery
Table 1 Description and justifications for predictions of this study
Prediction Justification
a. Bat richness is more strongly related to forest cover variables
than fire variables.
Previous work in the study area indicated that forest structure is a
key driver of the relationship between bats and fire in fire-prone
coniferous forests (Blakey et al. 2019)
b. Bat richness is more strongly related to configuration of forest
cover than extent of forest cover
Given bats have strong associations with edges and gaps (Loeb
and O’Keefe 2011; Gonsalves et al. 2012), it is likely that
configuration, rather than proportion of forest will likely be
more important for maintaining a diverse community
c. Bat richness increases with increasing vegetation structural
diversity and pyrodiversity and these relationships will be
consistent across scales.
Given bats respond in varying ways to forest structure, according
to their traits (Blakey et al. 2017b), it is likely that a variety of
structures will likely host the greatest number of bats.
Similarly, at the site-scale, bat species of coniferous forests
respond differently to fire (Buchalski et al. 2013; Blakey et al.
2019) indicating that greater pyrodiversity will result in more
species
d. Bat richness is negatively related to forest cover continuity at
finer scales and positively related to forest cover continuity at
broader scales; richness is positively related to burned area
continuity at finer scales and negatively related at broader
scales.
While edges and gaps are important features for foraging bats at
finer scales (Loeb and O’Keefe 2011; Gonsalves et al. 2012),
excessive fragmentation of habitat is likely to reduce species
richness (Trubitt et al. 2019)
e. Landscape extent and configuration variables are highly
correlated across scales.
Landscape extent and configuration variables are often reported
to be correlated in the literature (Andren 1994)
f. Forest and burned area variables are highly correlated across
scales.
Fire can transform landscape structure, creating edges and
openings, this is particularly so for high severity fire, which is
common in the study area
Predictions a-d relate to relationships between landscape variables and bat richness and predictions e-f relate to redundancy among
landscape variables
123
Landscape Ecol

Program (NAIP) imagery to check vegetation struc-
ture. We then classified areas within our vegetation
data overlapping with these high severity polygons as
zero canopy cover. We characterized open areas as
zero canopy cover areas and forest as non-zero canopy
cover areas, while edge was the boundary between
these two categories (Fig. 1c). Burned areas were
defined as any areas that had burned between 1987 and
2015, using a USDA Forest Service (2017) canopy
burn severity (hereafter ‘‘burn severity’’) dataset
(Fig. 1b). The burned edge was defined by the
boundary between burned areas (of any severity) and
unburned areas (those that had no recorded fires since
1987). The number of detectors was not balanced
between unburned and burned sites (n = 28 burned, n =
55 unburned) because sites were selected as part of a
Forest Service monitoring program with multiple
goals. However, we were most interested in the
relationships between bats and the broader burned
landscapes and burn configurations varied substan-
tially across the sites. Three small fires burned within
the study area during the study (2015–2017), which we
consider unlikely to affect study findings because
although their burned area overlapped with five site
buffers, these were restricted to the 10 km buffer zones
Fig. 1 Bat acoustic sampling sites (circles, n = 83) within
Plumas National Forest in the Sierra Nevada mountain range,
Northern California, USA (see inset). Maps show the National
Forest boundary with (a) forested (green) and open (grey) areas,and (b) areas burned between 1987 and 2015 (red) and unburnedduring those years (white). Panels (c) and (d) show 10
concentric 1-km buffers around a single site (blue circle), the
location of which is indicated in panels (a) and (b) with a blue
point and dashed 10-km buffer circle. Panel (c) shows forest
edges (green lines) used to calculate edge density and panel
(d) shows variability in maximum burn severity from high
(purple) to low (yellow), the standard deviation of burn
severities was used to represent pyrodiversity; see Methods:
Focal Patch Types (Forested and Burned Areas).
123
Landscape Ecol

([9 km from sites) and overlapping areas were\0.1
% (0.01–0.06 %).
In addition to extent, we calculated three configu-
ration variables for forested and burned areas within
each buffer—mean patch area (mean of individual
patch areas), patch density (number of patches divided
by buffer area), and edge density (edge distance
divided by buffer area)—and one diversity variable
(details below). We converted forest cover and burned
area spatial layers to rasters (30 m resolution) and used
FRAGSTATS (McGarigal 1995) within the SDMtools
v1.1-221 package to calculate the three configuration
variables at each of the 10 buffer distances for each
site.
We estimated vegetation structural diversity by
taking the standard deviation of canopy cover across
all pixels within each buffer, using vegetation data
(USDA Forest Service 2019) based on the CALVEG
(‘‘Classification and Assessment with Landsat of
Visible Ecological Groupings’’) classification (Nelson
et al. 2015) for all vegetation variables. To estimate
pyrodiversity (Fig. 1d), we calculated the standard
deviation of burn severity across all pixels within each
buffer (Tingley et al. 2016b). Burn severity was the
maximum burn severity value recorded since 1987,
expressed as a value ranging from to 5, where classes
0–5 indicate 0 = unburned, 1 = burned but no change in
canopy, 2 B 25, 3 = 25–50, 4 = 50–75, 5 C 75 %
canopy cover loss using burn severity spatial data
(USDA Forest Service 2017).
Relationships among landscape variables
We had two objectives when investigating relation-
ships among predictor variables (Table 1, predictions
e-f). The first was to investigate the degree of
correlation (Pearson’s correlation coefficient) between
variables representing the extent of each focal patch
type (forest or burned area) with variables represent-
ing configuration of patches or diversity. Given strong
effects of fire on vegetation structure, the second
objective was to establish the degree of correlation
between these same variables (extent, configuration,
and diversity) when calculated for forested versus
burned areas. For both of these objectives, we were
interested in the effects of spatial scale, specifically
grain size, on variable associations, so correlations
were calculated at each of the 10 buffer distances.
Relationships between bat richness and landscape
variables
We made four predictions about relationships between
bat richness and landscape variables (Table 1a–d)
which we investigated using multi-species hierarchi-
cal occupancy modelling (Kery and Royle 2008)
following methods described in detail in Tingley et al.
(2016b). We chose an occupancy approach because
bat detectability during acoustic studies varies greatly
among species and with environmental factors (Rod-
house et al. 2012; Banner et al. 2018).We assumed our
observed data (yi,j,k) were imperfect observations of
the true unobserved occupancy state of species i at site
j (zi,j) where detection or non-detection of species i at
site j on night k conformed to a Bernoulli distribution,
such that:
yi;j;k �Bernoulli pi;j;k � zi;j� �
For all models, we modelled detectability as a
function of three uncorrelated covariates, daily max-
imum (maxT) and minimum (minT) temperatures and
moon illuminated fraction (moon), which were found
to be important predictors of bat detection variability
within the study area (Blakey et al. 2019). We
modelled the probability of detecting bat species i at
site j on night k (pi,j,k) as the logit-linear function of the
three detection covariates:
logit pi;j;k� �
¼ a0i þ a1imaxTj;k þ a2iminTj;kþ a3imoonj;k
We fit separate multi-species occupancy models for
each landscape variable (n = 5; extent, mean patch
area, patch density, edge density, diversity) and each
buffer distance (n = 10; 1–10 km) for both forested and
burned areas (n = 100 models). For each model, the
landscape predictor (e.g. extent of forest cover at 1 km
buffer distance) was the sole predictor of multi-species
occupancy probability. We expected the true occur-
rence state of zi,j to follow a Bernoulli distribution such
that:
zi;j �Bernoulli wi;j� �
We modeled occupancy probability for species i at
site j as a logit-linear function of the covariate of
interest (var), for example: extent of burned area at
buffer size of 5 km.
123
Landscape Ecol

logit wi;j� �
¼ b0i þ b1ivarj
We did not include temporal variables as occu-
pancy covariates (e.g. day of season, year), because
these variables were not found to be significant
predictors of occupancy of the 9 most common bat
species in the study area (Blakey et al. 2019). We fitted
Bayesian hierarchical models using vague priors
(normal: l = 0, s = 0.01, gamma: r = 0.1, k = 0.1)
and estimated model parameters with 3 Markov-chain
Monte Carlo simulations with 5000 burn-in iterations
and sampled the posterior for 5000 iterations thinned
by every 5th iteration. This process yielded 3000
posterior samples. To ensure model convergence, we
checked trace plots and verified that all R-hat values
were\1.1. We assessed residual spatial autocorrela-
tion by first extracting the residuals (or ‘‘discrepancy’’)
for each model by subtracting occupancy probability
(wi;j) from occupancy state (zi;j) for each species in
each of the 3000 draws from the posterior sample
(Wright et al. 2019) and then applying the Moran’s I
test to each species in each model. We then calculated
the proportion of iterations for each model that
resulted in a rejection of the null hypothesis that there
was zero spatial autocorrelation in the residuals at a =
0.05 (evidence for significant spatial autocorrelation
unaccounted for by the model). We fitted models with
the JAGS program (Plummer 2003) within the R
statistical programming language (R Development
Core Team 2019) with the jagsUI v1.5.1 package
(Kellner 2019). Model code was developed from
JAGS code used in Tingley et al. (2016b), available
online at (Tingley et al. 2016a).
We used the posterior sample of the hyperparam-
eters (community-level parameters) at each scale and
used these to interpret the magnitude and direction of
the relationship between bat occupancy at the com-
munity level and the variable of interest. Given that
hyperparameters are in essence the average effect of
each variable across all species modeled, they should
be highly correlated with the effect of a variable on
richness.
To graph the predicted relationships between bat
richness and our landscape variables, we fit separate
generalized linear models (GLMs) with a Poisson
distribution and log link to each of the 3000 posterior
samples of the true occurrence state (zi,j) for all bat
species from each of the 100 models. We used
estimated richness (sum of all species predicted to
occur) as a Poisson-distributed response variable (with
log link) and the landscape variable as the predictor.
We calculated the mean and 95% Bayesian credible
intervals for predicted richness values across all
iterations for the range of the predictor variable to
interpret modelled relationships. We interpreted sig-
nificant relationships as those where credible intervals
of modelled coefficients did not overlap zero.
Results
Scale-Dependent relationships between bat
richness, forest cover and burned areas
Our final bat dataset spanned 249 survey nights (83
sites for three nights each). Bat species recorded
included 17 species: Myotis californicus (69 nights
detected); M. evotis (61); Lasionycteris noctivagans
(44); Eptesicus fuscus (35); Tadarida brasiliensis
(31); M. lucifugus (24); Lasiurus cinereus (24); M.
thysanodes (20); M. yumanensis (16); Antrozous
pallidus (16); M. volans (15); L. blossevillii (8); M.
ciliolabrum (4); Corynorhinus townsendii (4); Paras-
trellus hesperus (3); Euderma maculatum (2); Eumops
perotis (2). Bat richness decreased with increasing
extent of forest cover and mean forest patch area and
increased with increasing extent of burned area and
mean size of burned patch across all scales (Figs. 2 and
3). Patch and edge density were positively associated
with bat richness for forest cover across scales, but
with burned areas only at finer scales (Figs. 2 and 3).
Bat richness increased with pyrodiversity but was
unrelated to vegetation structural diversity (Fig. 2).
As predicted (Table 1a), forest cover variables were
stronger predictors of bat richness than were burned
area variables (Figs. 2 and 3). However, contrary to
our predictions, extent variables tended to have similar
or larger effect sizes compared to configuration and
diversity variables (Table 1b and Fig. 3). While bat
richness increased with pyrodiversity as expected,
there was no evidence that bat richness increased with
vegetation structural diversity (Table 1c and Figs. 2
and 3).
We found limited support for our prediction that bat
richness would be negatively related to forest cover
continuity at finer scales and positively related to
forest cover continuity at broader scales, and the
inverse for burned areas (Table 1d). Instead, bat
123
Landscape Ecol
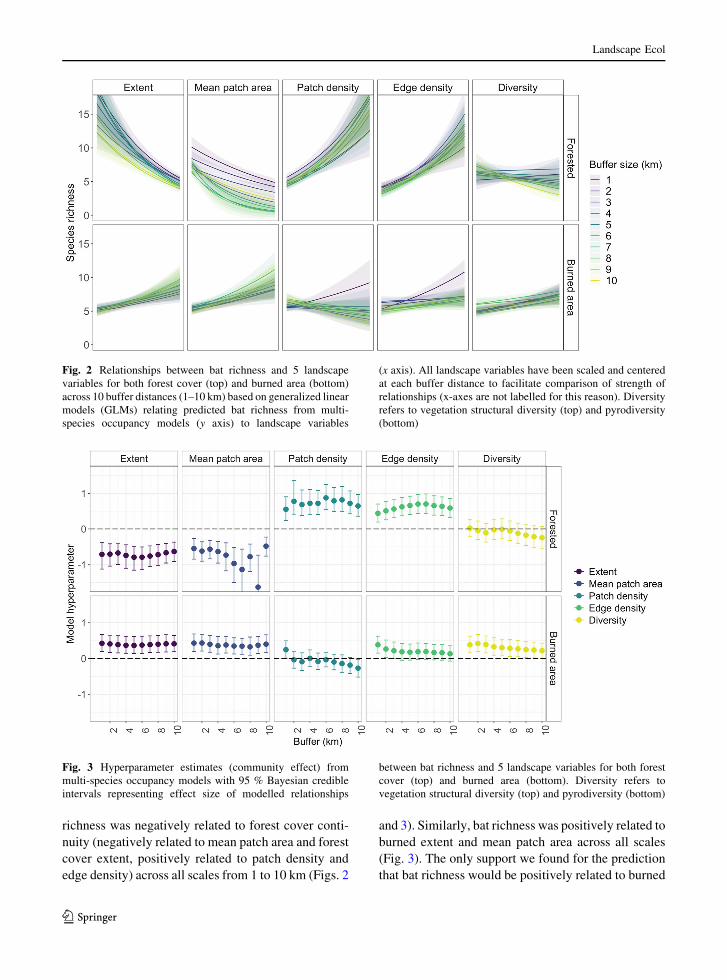
richness was negatively related to forest cover conti-
nuity (negatively related to mean patch area and forest
cover extent, positively related to patch density and
edge density) across all scales from 1 to 10 km (Figs. 2
and 3). Similarly, bat richness was positively related to
burned extent and mean patch area across all scales
(Fig. 3). The only support we found for the prediction
that bat richness would be positively related to burned
Fig. 2 Relationships between bat richness and 5 landscape
variables for both forest cover (top) and burned area (bottom)
across 10 buffer distances (1–10 km) based on generalized linear
models (GLMs) relating predicted bat richness from multi-
species occupancy models (y axis) to landscape variables
(x axis). All landscape variables have been scaled and centered
at each buffer distance to facilitate comparison of strength of
relationships (x-axes are not labelled for this reason). Diversity
refers to vegetation structural diversity (top) and pyrodiversity
(bottom)
Fig. 3 Hyperparameter estimates (community effect) from
multi-species occupancy models with 95 % Bayesian credible
intervals representing effect size of modelled relationships
between bat richness and 5 landscape variables for both forest
cover (top) and burned area (bottom). Diversity refers to
vegetation structural diversity (top) and pyrodiversity (bottom)
123
Landscape Ecol
area continuity at finer scales and negatively related to
burned area continuity at broader scales was the
relationship between richness and patch density,
which varied in this direction (Table 1d and Fig. 3).
Otherwise, strength of relationships between bat
richness and landscape variables were generally
consistent across spatial scales (Figs. 2 and 3;
Fig. S2). Our assessment of residual spatial autocor-
relation in our models showed that there was spatial
autocorrelation in residuals for the majority of itera-
tions (80 % of models, mean proportion of iterations =
0.572 (0.466–0.804)) for one of the 17 species (M.
evotis). For the remaining 16 species, the proportion of
iterations showing spatial autocorrelation in residuals
was much lower (mean = 0.053 (0.004–0.194)). We
therefore consider that spatial autocorrelation may
have influenced our results by underestimating vari-
ance, but it is unlikely that spatial autocorrelation
invalidates our results.
Is there redundancy among extent, configuration,
and diversity measures of landscape-level habitat?
Associations between landscape variables varied with
focal patch type (forested or burned) and sometimes
also with spatial scale (1–10 km) (Fig. 4). In contrast to
our predictions (Table 1e), extent of forested area was
highly correlated (|R|[0.7) with only one other forest
variable across all scales (patch density; negatively)
and highly positively correlated with mean forested
patch area only at finer scales (\ 3 km, Fig 4a).
However, extent of burned area was highly positively
correlated with mean burned patch area, pyrodiversity,
and edge density at all scales and with patch density at
the finest (1 km) scale, consistent with our predictions
(Fig 4b). Also in contrast to our predictions (Table 1f),
forest cover and burned area variables were not highly
correlated with one another, only extent of forest cover
and burned area were negatively correlated by |R|[0.6 across all scales (Fig. 4c). Among configuration
variables, burned area variables were more strongly
correlated to one another, with all variables highly
correlated (|R|[0.7) at the finest scale (1 km), while
edge density, pyrodiversity, and mean patch area were
also highly correlated at 2 km and edge density, and
pyrodiversity were highly correlated across all scales.
Among forest cover configuration variables, edge
density was highly correlated with patch density and
mean patch area at the finest scale (1 km) and also at
the broadest scale (10 km) but no strong correlations
occurred in the intermediate scales.
Discussion
Our study revealed new insights into landscape-scale
habitat relationships of mobile species in fire-affected
forests. We found mixed support for our predictions,
finding evidence for stronger relationships between
bat richness and forest structure as compared to fire
(Table 1a) but little evidence for stronger relationships
between bat richness and configuration, rather than
extent variables (Table 1b). While we found evidence
that pyrodiversity increases bat richness across all
spatial scales, we found no evidence that forest
structural diversity, as measured in our study, influ-
enced bat richness (Table 1c). We found little support
for the prediction that relationships between bat
richness and landscape variables varied across scales
(Table 1e) and while forested and burned area extents
were highly correlated, configuration variables were
not correlated between the two focal patch types
(Table 1f).
Bat richness was strongly predicted by extent and
configuration of forest cover across scales, such that
patchier forest, with high edge density and lower
overall cover, resulted in the highest bat richness. In
this way, our study is consistent with previous studies
showing that bats are resilient to or may even benefit
from a degree of forest heterogeneity (Bernard and
Fenton 2007; Klingbeil andWillig 2009) while at odds
with studies showing negative effects of heterogeneity
on bat communities (Fenton 1992; Ferreira et al.
2017). Negative relationships between forest continu-
ity and bat richness were consistent across scales, at
odds with our predictions. This may be because the bat
community of our study area is adapted to historically
more heterogenous forests and relatively short-inter-
val fire regimes (Steel et al. 2019). Present-day forests
of the Northern Sierra Nevada are likely to have
greater forest continuity and extent of dense forest
than they did historically (Lydersen and Collins 2018).
Similarly, due to fire suppression and climate change,
modern fire regimes are less variable than historically
(Cansler and Mckenzie 2014; Safford and Stevens
2017), with an increase in larger and more homoge-
nous high severity burned patches (Steel et al. 2018).
The positive relationships we found between bat
123
Landscape Ecol

richness, burned area extent, burned patch size and
edge density, along with other studies showing high
resilience of bat communities in Western forests to
fire, also indicate that bats of the region may be
adapted to shorter fire intervals (Buchalski et al. 2013;
Steel et al. 2019; Starbuck et al. 2020). We may expect
the negative relationship we observed between bat
richness and forest cover to become positive after a
threshold of forest fragmentation due to fire or other
mechanisms, given positive relationships that have
been demonstrated between bats and vegetation cover
in agricultural, urban (Threlfall et al. 2011; Bailey
et al. 2019), and fragmented tropical landscapes
(Rocha et al. 2016). While the shift in the relationship
between bat richness and burned patch density from
positive at the finest scale (1 km) to negative at the
broadest scale (10 km), may provide initial support for
this prediction, further study is needed to establish
thresholds of heterogeneity for bats in burned
landscapes.
Our result that pyrodiversity was positively asso-
ciated with bat richness across landscape scales
supports findings that bat richness increases with
pyrodiversity at finer scales (500 m) (Steel et al. 2019),
likely due to variable responses to burned area
characteristics by bat species (Starbuck et al. 2020)
with different ecological and morphological traits
(Blakey et al. 2019). Interestingly, pyrodiversity was
not correlated with vegetation structural diversity,
which was unrelated to bat richness. This finding
suggests that factors additional to forest structure are
likely influencing bat community response to burned
landscapes, potentially including booms in prey
productivity (Malison and Baxter 2010) or gradual
ecotones between forests and open areas, providing
habitat for diverse bat guilds and maintained by
mixed-severity fire (Broken-Brow et al. 2019). Dis-
crepancies between the fire and vegetation datasets in
timing and accuracy may also have influenced the lack
of correlation between the pyrodiversity and vegeta-
tion structural diversity and lack of a relationship
between bat richness and vegetation structural
diversity.
Fig. 4 Associations between landscape variables examined in
this study at different spatial scales. Panel A shows correlations
between extent of forest cover and configuration/diversity
variables (mean patch area, patch density, edge density, and
vegetation structural diversity) at buffer scales ranging from 1 to
10 km. Panel B shows the same relationships for burned area
(correlations between burned area extent and configuration/di-
versity variables) and Panel C (‘‘Comparison’’) shows the
correlations between the same variables measured for both
forest and burned area. Grey dashed lines show |R| = 0.7, an
indicator of when variable collinearity may distort model
estimation (Dormann et al. 2013)
123
Landscape Ecol

Several limitations are important to consider when
interpreting our results that may also be productive
areas for future study. First, the burned areas assessed
in our study represented a variety of different fires
which burned since 1987 and encompassed a range of
severities, which could partially explain the lower than
expected correlations between burned and forested
configurations and could influence relationships
between bat richness and landscape variables given
both burn severity and time since fire have been shown
to influence bat occurrence (Blakey et al. 2019; Steel
et al. 2019; Starbuck et al. 2020). To partially assess
the importance of this variability in fire regime, during
the exploratory stage we ran models using only high
severity burned areas to calculate the landscape extent
and configuration variables and recorded similar
modelled relationships. The variability among burned
areas included in this study likely masked some of the
more subtle relationships between bats and burned
areas in space and time, especially because two
species in the study area have exhibited site-scale
relationships with time since fire at finer scales
(Blakey et al. 2019). Further, our measures of
occupancy are based on acoustic data and therefore
do not provide information about other important
aspects of bat response to fire, including: roost habitat
for bats, which may be a limiting factor, particularly
during the maternity period (Kunz et al. 2003); or
reproductive rates, which may be reduced following
fire (Ancillotto et al. 2020). Finally, we approximate
forest cover and burned area edges based on mapped
extent of forest cover and burned areas and do not
differentiate between gradual and abrupt edges, which
may influence bat habitat use (Broken-Brow et al.
2020). While bat communities appear to be resilient to
or even benefit from some degree of forest hetero-
geneity at landscape scales in coniferous forest, it is
important to remember that many individual bat
species require forest cover or unburned areas for
commuting, roosting, and foraging (Henderson et al.
2008; Snider et al. 2013; Threlfall et al. 2013; Law
et al. 2016a).
Conclusion
Our study has implications for natural resource
managers and landscape ecologists who seek to
conserve or understand highly mobile animal
communities in fire-maintained coniferous forests.
Prior to European colonization, the northern Sierra
Nevada bat community existed within a mixed-
severity fire regime that maintained a mosaic of
patches on the landscape through frequent low- to
moderate-severity wildfire (Van Wagtendonk and
Fites-Kaufman 2018). Forest management directed
at simulating vegetation patterns maintained by wild-
fire (i.e., pyrodiversity) has been proposed in the Sierra
Nevada to reduce the risk of broad-scale stand-
replacing wildfire (Sherlock 2007; North et al.
2009), and using this approach to restore habitat patch
size, structure and configuration to a natural range of
variation will likely benefit bat communities. Man-
agement practices directed at restoring bat diversity
could benefit from concomitant consideration of
species-specific habitat needs. For example, conser-
vation concerns have been raised for six of 17 bat
species on this landscape, and five of these six species
are adapted to foraging in structurally complex
vegetation (late-seral forest; Blakey et al. 2019). On
this landscape, a combination of maintaining existing
late-seral forest while incorporating wildland fire use
(van Wagtendonk 2007) and/or implementing vege-
tation treatments that replicate patterns maintained by
frequent mixed-severity fire (i.e., pyrodiversity) in
mid-seral forest (e.g. North et al. 2019) could maintain
habitat for clutter-adapted species while restoring fire-
maintained conditions across the landscape and pro-
moting bat diversity.
For landscape ecologists, we found independent
relationships between bat richness and configuration
of forested and burned areas. We showed that in fire-
maintained coniferous forests, even when extent of
forest cover and burned areas are correlated, config-
uration and diversity of these metrics may diverge.
Relationships between bat richness and landscape
variables were relatively consistent across scales,
similar to Starbuck et al. (2020). However, further
study is needed to investigate thresholds of hetero-
geneity for bats in burned landscapes, particularly in
regions where wildfires are increasing in frequency
and extent (Dennison et al. 2014).
Acknowledgements We are grateful to the USDA Forest
Service for funding this research and Plumas National Forest for
providing logistical support. We thank Plumas Audubon Society
and J. Buchanan, A. Martinez, A. Enos, E. Ingalls, H. Wall, E.
Deal, and G. Graells for their involvement with field data
collection. We also thank G. Rotert who helped recover files
123
Landscape Ecol
from a corrupted hard drive, J. Szewczak for assistance
mentoring in call identification. Comments by N. McIntyre, C.
Ray, M. Tingley and two anonymous reviewers greatly
improved the manuscript. Missouri Cooperative Fish and
Wildlife Research Unit is jointly sponsored by the MDC, the
University of Missouri, the U.S. Fish and Wildlife Service, the
U.S. Geological Survey, and theWildlife Management Institute.
Any use of trade, firm, or product names is for descriptive
purposes only and does not imply endorsement by the U.S.
Government. This is contribution 697 of The Institute for Bird
Populations.
Open Access This article is licensed under a Creative
Commons Attribution 4.0 International License, which permits
use, sharing, adaptation, distribution and reproduction in any
medium or format, as long as you give appropriate credit to the
original author(s) and the source, provide a link to the Creative
Commons licence, and indicate if changes were made. The
images or other third party material in this article are included in
the article’s Creative Commons licence, unless indicated
otherwise in a credit line to the material. If material is not
included in the article’s Creative Commons licence and your
intended use is not permitted by statutory regulation or exceeds
the permitted use, you will need to obtain permission directly
from the copyright holder. To view a copy of this licence, visit
http://creativecommons.org/licenses/by/4.0/.
Data accessibility Bat detection data are archived on the
USDA Forest Service Nature Resource Information System
(https://www.fs.fed.us/nrm/index.shtml) and also on the Bat
Acoustic Monitoring Portal (BatAMP): https://batamp.
databasin.org/datasets/65ce65a3c3ed4672a3d14aba5ef90677
(2015); https://batamp.databasin.org/datasets/
fe446554eb31429d8c14462e3c3e0d4a (2016); and, https://
batamp.databasin.org/datasets/
db15f5ee4dd7462fa6d1d1097e41656a (2017).
References
Ancillotto L, Bosso L, Conti P, Russo D (2020) Resilient
responses by bats to a severe wildfire: conservation
implications. Anim Conserv. in press
Andren H (1994) Effects of habitat fragmentation on birds and
mammals in landscapes with different proportions of
suitable habitat: a review. Oikos 71:355–366
Armitage DW, Ober HK (2012) The effects of prescribed fire on
bat communities in the longleaf pine sandhills ecosystem.
J Mammal 93:102–114. https://doi.org/10.1644/11-
MAMM-A-169.1
Arrizabalaga-Escudero A, Garin I, Garcıa-Mudarra JL, Alberdi
A, Aihartza, J, Goiti U (2015) Trophic requirements
beyond foraging habitats: the importance of prey source
habitats in bat conservation. Biol Conserv 191:512–519
Bailey AM, Ober HK, Reichert BE, McCleery RA (2019)
Canopy cover shapes bat diversity across an urban and
agricultural landscape mosaic. Environ Conserv
46:193–200. https://doi.org/10.1017/S0376892919000109
Banner KM, Irvine KM, Rodhouse TJ, Wright WJ, Rodriguez
RM, Litt AR (2018) Improving geographically extensive
acoustic survey designs for modeling species occurrence
with imperfect detection and misidentification. Ecol Evol
8:6144–6156. https://doi.org/10.1002/ece3.4162
Bernard E, Fenton MB (2007) Bats in a fragmented landscape:
Species composition, diversity and habitat interactions in
savannas of Santarem, Central Amazonia, Brazil. Biol
Conserv 134:332–343. https://doi.org/10.1016/j.biocon.
2006.07.021
Blakey RV, Kingsford RT, Law BS, Stoklosa J (2017) Flood-
plain habitat is disproportionately important for bats in a
large river basin. Biol Conserv 215(1):10
Blakey RV, Law BS, Kingsford RT, Stoklosa J (2017) Terres-
trial laser scanning reveals below-canopy bat trait rela-
tionships with forest structure. Remote Sens Environ
198:40–51. https://doi.org/10.1016/j.rse.2017.05.038
Blakey R V., Webb EB, Kesler DC, Siegel RB, Corcoran D,
Johnson M (2019) Bats in a changing landscape: Linking
occupancy and traits of a diverse montane bat community
to fire regime. Ecol Evol ece3.5121. https://doi.org/10.
1002/ece3.5121
Broken-Brow JP, Armstrong KN, Leung LKP (2019) The
importance of grassland patches and their associated rain-
forest ecotones to insectivorous bats in a fire-managed,
tropical landscape. Wildl Res 46:649–656. https://doi.org/
10.1071/WR18012
Buchalski MR, Fontaine JB, Heady PA, Hayes JP, Frick WF
(2013) Bat response to differing fire severity in mixed-
conifer forest California, USA. PLoS One 8:e57884.
https://doi.org/10.1371/journal.pone.0057884
Cansler CA, Mckenzie D (2014) Climate, fire size, and bio-
physical setting control fire severity and spatial pattern in
the northern Cascade Range, USA. Ecol Appl
24:1037–1056. https://doi.org/10.1890/13-1077.1
CoxMR,Willcox EV, Keyser PD, Vander Yacht AL (2016) Bat
response to prescribed fire and overstory thinning in
hardwood forest on the Cumberland Plateau, Tennessee.
For Ecol Manage 359:221–231. https://doi.org/10.1016/j.
foreco.2015.09.048
Dennison PE, Brewer SC, Arnold JD, Moritz MA (2014) Large
wildfire trends in the western United States, 1984–2011.
Geophys Res Lett 41:2928–2933. https://doi.org/10.1002/
2014GL059576
Denzinger A, Schnitzler H-U (2013) Bat guilds, a concept to
classify the highly diverse foraging and echolocation
behaviors of microchiropteran bats. Front Physiol 4:164.
https://doi.org/10.3389/fphys.2013.00164
Dormann CF, Elith J, Bacher S, Buchmann C, Carl G, Carre G,
Marquez JRG, Gruber B, Lafourcade B, Leitao PJ, Mun-
kemuller T, Mcclean C, Osborne PE, Reineking B,
Schroder B, Skidmore AK, Zurell D, Lautenbach S (2013)
Collinearity: A review of methods to deal with it and a
simulation study evaluating their performance. Ecography.
36:027–046. https://doi.org/10.1111/j.1600-0587.2012.
07348.x
Duff A, Morrell TE (2007) Predictive occurrence models for bat
species in California. J Wildl Manage 71:693–700. https://
doi.org/10.2193/2005-692
123
Landscape Ecol

Eby S, Mosser A, Swanson A, Packer C, Ritchie M (2013) The
impact of burning on lion Panthera leo habitat choice in an
African savanna. Curr Zool 59. https://doi.org/10.1093/
czoolo/59.3.335
Eyes SA, Roberts SL, Johnson MD (2017) California Spotted
Owl (Strix occidentalis occidentalis) habitat use patterns ina burned landscape. Condor 119:1–15. https://doi.org/10.
1650/CONDOR-16-184.1
Farneda FZ, Rocha R, Lopez-Baucells A, Groenenberg M, Silva
I, Palmeirim JM, Bobrowiec PED, Meyer CFJ (2015)
Trait-related responses to habitat fragmentation in Ama-
zonian bats. J. Appl. Ecol. 52:1381–1391. https://doi.org/
10.1111/1365-2664.12490
Fenton MB (1992) Phyllostomid bats (Chiroptera: Phyllosto-
midae) as indicators of habitat disruption in the Neotropics.
Biotropica 24:440–446
Ferreira DF, Rocha R, Lopez-Baucells A, Farneda FZ, Carreiras
JMB, Palmeirim JM, Meyer CFJ (2017) Season-modulated
responses of Neotropical bats to forest fragmentation. Ecol
Evol 7:4059–4071. https://doi.org/10.1002/ece3.3005
Fites-Kaufman J, Rundel P, Stephenson N, Weixelman DA
(2007) Montane and subalpine vegetation of the Sierra
Nevada and Cascade Ranges. Terr Veg Calif 456–501.
https://doi.org/10.1525/california/9780520249554.003.
0017
Fuentes-Montemayor E, Macgregor NA, Lopez-Gallego Z, Park
KJ (2017) Species mobility and landscape context deter-
mine the importance of local and landscape-level attri-
butes. Ecol Appl 27:1541–1554
Geary WL, Doherty TS, Nimmo DG, Tulloch AIT, Ritchie EG
(2019) Predator responses to fire: a global systematic
review and meta-analysis. J Anim Ecol 89:955–971
Gonsalves L, Law BS, Webb C, Monamy V (2012) Are vege-
tation interfaces important to foraging insectivorous bats in
endangered coastal saltmarsh on the Central Coast of New
South Wales? Pacific Conserv Biol 18:282–292
Hale JD, Fairbrass AJ, Matthews TJ, Sadler JP (2012) Habitat
composition and connectivity predicts bat presence and
activity at foraging sites in a large UK conurbation. PLoS
One 7:e33300. https://doi.org/10.1371/journal.pone.
0033300
Heim O, Treitler JT, Tschapka M, Knornschild M, Jung K
(2015) The importance of landscape elements for bat
activity and species richness in agricultural areas. PLoS
One 10:1–13. https://doi.org/10.1371/journal.pone.
0134443
Henderson LE, Farrow LJ, Broders HG (2008) Intra-specific
effects of forest loss on the distribution of the forest-de-
pendent northern long-eared bat (Myotis septentrionalis).Biol Conserv 141:1819–1828. https://doi.org/10.1016/j.
biocon.2008.04.028
Inkster-Draper TE, Sheaves M, Johnson CN, Robson SKA
(2013) Prescribed fire in eucalypt woodlands: Immediate
effects on a microbat community of northern Australia.
Wildl Res 40:70–76. https://doi.org/10.1071/WR12133
Johnson JB, Mark Ford W, Edwards JW (2012) Roost networks
of northern myotis (Myotis septentrionalis) in a managed
landscape. For Ecol Manage 266:223–231. https://doi.org/
10.1016/j.foreco.2011.11.032
Kalcounis-Rueppell MC, Briones KM, Homyack JA, Petric R,
Marshall MM, Miller DA (2013) Hard forest edges act as
conduits, not filters, for bats. Wildl Soc Bull 37:571–576
Kellner K (2019) jagsUI: a wrapper around rjags to streamline
JAGS analyses. https://cran.r-project.org/web/packages/
jagsUI/index.html
Kelly LT, Brotons L (2017) Using fire to promote biodiversity.
Science 355:1264–1265. https://doi.org/10.1126/science.
aam7672
Kelly LT, Nimmo DG, Spence-Bailey LM, Taylor RS, Watson
SJ, Clarke MF, Bennett AF (2012) Managing fire mosaics
for small mammal conservation: A landscape perspective.
J Appl Ecol 49:412–421. https://doi.org/10.1111/j.1365-
2664.2012.02124.x
Kery M, Royle JA (2008) Hierarchical Bayes estimation of
species richness and occupancy in spatially replicated
surveys. J Appl Ecol 45:589–598. https://doi.org/10.1111/
j.1365-2664.2007.0
Klingbeil BT, Willig MR (2009) Guild-specific responses of
bats to landscape composition and configuration in frag-
mented Amazonian rainforest. J Appl Ecol 46:203-213 ST
Kunz TH, Lumsden LF, Fenton MB (2003) Ecology of cavity
and foliage roosting bats. Bat Ecol 1:3–89Law BS, Chidel M (2002) Tracks and riparian zones facilitate
the use of Australian regrowth forest by insectivorous bats.
J Appl Ecol 39:605–617
Law BS, Gonsalves L, Chidel M, Brassil T (2016) Subtle use of
a disturbance mosaic by the south-eastern long-eared bat
(Nyctophilus corbeni): an extinction-prone, narrow-space
bat. Wildl Res 43:153–168
Law BS, Park KJ, Lacki MJ (2016) Insectivorous bats and sil-
viculture: balancing timber production and bat conserva-
tion. In: Voigt CC, Kingston T (eds) Bats in the
Anthropocene: Conservation of Bats in a Changing World.
Springer Open, Cham, Switzerland, pp 105–150
Lloret F, Calvo E, Pons X, Dıaz-Delgado R (2002)Wildfires and
landscape patterns in the Eastern Iberian Peninsula. Landsc
Ecol 17:745–759. https://doi.org/10.1023/A:
1022966930861
Loeb SC, O’Keefe JM (2011) Bats and Gaps: The Role of Early
Successional Patches in the Roosting and Foraging Ecol-
ogy of Bats. In: Greenberg C, Collins B, Thompson F (eds)
Sustaining Young Forest Communities. Springer, Nether-
lands, Dordrecht, pp 167–189. https://doi.org/10.1007/
978-94-007-1620-9
Lookingbill TR, Elmore AJ, Engelhardt KAM, Churchill JB,
Edward Gates J, Johnson JB (2010) Influence of wetland
networks on bat activity in mixed-use landscapes. Biol
Conserv 143:974–983
Lydersen JM, Collins BM (2018) Change in vegetation patterns
over a large forested landscape based on historical and
contemporary aerial photography. Ecosystems
21:1348–1363. https://doi.org/10.1007/s10021-018-0225-
5
Malison RL, Baxter CV (2010) The fire pulse: Wildfire stimu-
lates flux of aquatic prey to terrestrial habitats driving
increases in riparian consumers. Can J Fish Aquat Sci
67:570–579
McGarigal K (1995) FRAGSTATS: spatial pattern analysis
program for quantifying landscape structure. US
123
Landscape Ecol

Department of Agriculture, Forest Service, Pacific North-
west Research Station
Mendes ES, Fonseca C,Marques SF,Maia D, Ramos Pereira MJ
(2017) Bat richness and activity in heterogeneous land-
scapes: guild-specific and scale-dependent? Landsc Ecol
32:295–311. https://doi.org/10.1007/s10980-016-0444-0
Morris AD, Miller DA, Kalcounis-Rueppell MC (2010) Use of
forest edges by bats in a managed pine forest landscape.
J Wildl Manage 74:26–34. https://doi.org/10.2193/2008-
471
Muller J, Mehr M, Bassler C, Fenton MB, Hothorn T, Pretzsch
H, Klemmt H-J, Brandl R (2012) Aggregative response in
bats: prey abundance versus habitat. Oecologia
169:673–84. https://doi.org/10.1007/s00442-011-2247-y
Nelson ML, Brewer CK, Solem SJ (2015) Existing vegetation
classification, mapping and inventory technical guide,
version 2.0. Gen. Tech. Rep. WO-90. https://www.fs.fed.
us/emc/rig/documents/protocols/vegClassMapInv/EVTG_
v2-0_June2015.pdf. Accessed 1 Jun 2016
Nimmo DG, Avitabile S, Banks SC, Bliege Bird R, Callister K,
Clarke MF, Dickman CR, Doherty TS, Driscoll DA,
Greenville AC, Haslem A, Kelly LT, Kenny SA, Lahoz-
Monfort JJ, Lee C, Leonard S, Moore H, Newsome TM,
Parr CL, Ritchie EG, Schneider K, Turner JM, Watson S,
Westbrooke M, Wouters M, White M, Bennett AF (2019)
Animal movements in fire-prone landscapes. Biol. Rev.
94:981–998. https://doi.org/10.1111/brv.12486
North MP, Stevens JT, Greene DF, Coppoletta M, Knapp EE,
Latimer AM, Restaino CM, Tompkins RE, Welch KR,
York RA, Young DJN, Axelson JN, Buckley TN, Estes BL,
Hager RN, Long JW, Meyer MD, Ostoja SM, Safford HD,
Shive KL, Tubbesing CL, Vice H, Walsh D, Werner CM,
Wyrsch P (2019) Tamm Review: Reforestation for resi-
lience in dry western U.S. forests. For Ecol Manage
432:209–224. https://doi.org/10.1016/j.foreco.2018.09.
007
North MP, Stine P, Hara KO, Zielinski WJ, Stephens SL (2009)
An ecosystem management strategy for Sierran mixed-
conifer forest. Gen. Tech. Rep. PSW-GTR-220. Albany,
CA, USA
Parkins K, York A, Di Stefano J (2018) Edge effects in fire-
prone landscapes: Ecological importance and implications
for fauna. Ecol Evol 5937–5948. https://doi.org/10.1002/
ece3.4076
Perry RW, Thill RE, Leslie DM (2008) Scale-dependent effects
of landscape structure and composition on diurnal roost
selection by forest bats. J Wildl Manage 72:913–925.
https://doi.org/10.2193/2006-435
Plummer M (2003) JAGS: A program for analysis of Bayesian
graphical models using Gibbs sampling. In: Hornik K,
Leisch F, Zeilesis A (eds) Proceedings of the Third Inter-
national Workshop on Distributed Statistical Computing.
Technische Universitat Wien, Vienna, Austria
Ponisio LC, Wilkin K, M’Gonigle LK, Kulhanek K, Cook L,
Thorp R, Griswold T, Kremen C (2016) Pyrodiversity
begets plant-pollinator community diversity. Glob Chang
Biol 22:1794–1808. https://doi.org/10.1111/gcb.13236
R Development Core Team (2019) R: A language and envi-
ronment for statistical computing. http://www.r-project.
org/. Accessed 8 Apr 2020
Rocha R, Lopez-Baucells A, Farneda FZ, Groenenberg M,
Bobrowiec PED, Cabeza M, Palmeirim JM, Meyer CFJ
(2016) Consequences of a large-scale fragmentation
experiment for Neotropical bats disentangling the relative
importance of local and landscape-scale effects. Landsc
Ecol. https://doi.org/10.1007/s10980-016-0425-3
Rodhouse TJ, Ormsbee PC, Irvine KM, Vierling LA, Szewczak
JM, Vierling KT (2012) Assessing the status and trend of
bat populations across broad geographic regions with
dynamic distribution models. Ecol Appl 22:1098–1113.
https://doi.org/10.1890/11-1662.1
Russo D, Ancillotto L (2015) Sensitivity of bats to urbanization:
A review. Mamm Biol 80:205–212. https://doi.org/10.
1016/j.mambio.2014.10.003
Russo D, Voigt CC (2016) The use of automated identification
of bat echolocation calls in acoustic monitoring: A cau-
tionary note for a sound analysis. Ecol Indic 66:598–602.
https://doi.org/10.1016/j.ecolind.2016.02.036
Safford HD, Stevens JT (2017) Natural Range of Variation
(NRV) for yellow pine and mixed conifer forests in the
bioregional assessment area, including the Sierra Nevada,
southern Cascades, and Modoc and Inyo National Forests.
Gen Tech Rep PSW-GTR-2562 1–151
Schnitzler H-U, Moss CF, Denzinger A (2003) From spatial
orientation to food acquisition in echolocating bats. Trends
Ecol Evol 18:386–394. https://doi.org/10.1016/S0169-
5347(03)00185-X
Sherlock JW (2007) Integrating stand density management with
fuel reduction. In: Powers RF (ed) Restoring Fire-adapted
Ecosystems: Proceedings of the 2005 National Silviculture
Workshop. Gen. Tech. Rep. PSW-GTR-203. Albany, CA,
pp 55–66
Silvis A, Gehrt SD, Williams RA (2016) Effects of shelterwood
harvest and prescribed fire in upland Appalachian hard-
wood forests on bat activity. For Ecol Manage
360:205–212. https://doi.org/10.1016/j.foreco.2015.10.
010
Sitters H, Christie FJ, Di Stefano J, Swan M, Penman T, CollinsPC, York A (2014) Avian responses to the diversity and
configuration of fire age classes and vegetation types across
a rainfall gradient. For. Ecol. Manage. 318:13–20. https://
doi.org/10.1016/j.foreco.2014.01.009
Snider EA, Cryan PM, Wilson KR (2013) Roost selection by
western long-eared myotis (Myotis evotis) in burned and
unburned pinon–juniper woodlands of southwestern Col-
orado. J Mammal 94:640–649. https://doi.org/10.1644/11-
MAMM-A-153.1
Starbuck CA, Considine ES, Chambers CL (2020) Water and
elevation are more important than burn severity in pre-
dicting bat activity at multiple scales in a post-wildfire
landscape. PLoS One 15:e0231170. https://doi.org/10.
1371/journal.pone.0231170
Steel ZL, Campos B, Frick WF, Burnett R, Safford HD (2019)
The effects of wildfire severity and pyrodiversity on bat
occupancy and diversity in fire-suppressed forests. Sci Rep
1–11. https://doi.org/10.1038/s41598-019-52875-2
Steel ZL, Koontz MJ, Safford HD (2018) The changing land-
scape of wildfire: burn pattern trends and implications for
California ’ s yellow pine and mixed conifer forests.
Landsc Ecol 33:1159–1176. https://doi.org/10.1007/
s10980-018-0665-5
123
Landscape Ecol

Swan M, Christie F, Sitters H, York A, Di Stefano J (2015)
Predicting faunal fire responses in heterogeneous land-
scapes: The role of habitat structure. Ecol Appl
25:2293–2305. https://doi.org/10.1890/14-1533.1
Threlfall CG, Law BS, Banks PB (2013) The urban matrix and
artificial light restricts the nightly ranging behaviour of
Gould’s long-eared bat (Nyctophilus gouldi). Austral Ecol38:921–930. https://doi.org/10.1111/aec.12034
Threlfall C, Law BS, Penman T, Banks PB (2011) Ecological
processes in urban landscapes: mechanisms influencing the
distribution and activity of insectivorous bats. Ecography
(Cop) 34:814–826
Tingley MW, Ruiz-Gutierrez V, Wilkerson RL, Howell CA,
Siegel RB (2016a) Data from: Pyrodiversity promotes
avian diversity over the decade following forest fire.
https://doi.org/10.5061/dryad.871pc
Tingley MW, Ruiz-Gutierrez V, Wilkerson RL, Howell CA,
Siegel RB (2016b) Pyrodiversity promotes avian diversity
over the decade following forest fire. Proc R Soc B Biol Sci
283. https://doi.org/10.1098/rspb.2016.1703
Trubitt RT, Hovick TJ, Gillam EH, McGranahan DA (2019)
Habitat associations of bats in a working rangeland land-
scape. Ecol Evol 9:598–608. https://doi.org/10.1002/ece3.
4782
USDA Forest Service (2017) Vegetation Burn Severity -
Canopy Cover [ESRI personal geodatabase] Region 5
North Sierra. https://www.fs.usda.gov/detail/r5/
landmanagement/gis/?cid=stelprd3804880. Accessed 10
May 2018
USDA Forest Service (2019) Existing Vegetation - CALVEG,
[ESRI personal geodatabase] Eveg Mid Region 5 North
Sierra. https://data.fs.usda.gov/geodata/edw/edw_
resources/meta/S_USA.EVMid_R05_NorthSierra.xml.
Accessed 7 Jun 2019
van Wagtendonk JW (2007) The History and Evolution of
Wildland Fire Use. Fire Ecol 3:3–17. https://doi.org/10.
4996/fireecology.0302003
Van Wagtendonk JW, Fites-Kaufman J (2018) Sierra Nevada
bioregion. In: Van Wagtendonk JW, Sugihara NG, Ste-
phens SL, Thode AE, Shaffer KE, Fites-Kaufman JA (eds)
Fire in California’s Ecosystems, Second Edi. University of
California Press, Oakland, California, United States,
pp 264–294. https://doi.org/10.1525/california/
9780520246058.003.0012
Vanbianchi CM, Murphy MA, Hodges KE (2017) Canada lynx
use of burned areas: Conservation implications of changing
fire regimes. Ecol Evol 7:2382–2394. https://doi.org/10.
1002/ece3.2824
Webala PW, Craig MD, Law BS, Armstrong KN, Wayne AF,
Bradley JS (2011) Bat habitat use in logged jarrah eucalypt
forests of south-western Australia. J Appl Ecol
48:398–406. https://doi.org/10.1111/j.1365-2664.2010.
01934.x
Western Regional Climate Center (2017) Western US Climate
Historical Summaries: Quincy Station (047195). https://
wrcc.dri.edu/cgi-bin/cliMAIN.pl?ca7195. Accessed 20 Jul
2017
Wright WJ, Irvine KM, Higgs MD (2019) Identifying occu-
pancy model inadequacies: can residuals separately assess
detection and presence? Ecology 100:1–9. https://doi.org/
10.1002/ecy.2703
Publisher’s Note Springer Nature remains neutral with
regard to jurisdictional claims in published maps and
institutional affiliations.
123
Landscape Ecol