Extensive Translational Regulation of Gene Expression in ... · PDF fileExtensive...
16
LARGE-SCALE BIOLOGY ARTICLE Extensive Translational Regulation of Gene Expression in an Allopolyploid (Glycine dolichocarpa) W Jeremy E. Coate, a,1 Haim Bar, b and Jeff J. Doyle c a Department of Biology, Reed College, Portland, Oregon 97202-8199 b Department of Biological Statistics and Computational Biology, Cornell University, Ithaca, New York 14853-2601 c Department of Plant Biology, Cornell University, Ithaca, New York 14853-4301 ORCID ID: 0000-0002-1619-8643 (J.E.C.) All flowering plants have experienced repeated rounds of polyploidy (whole-genome duplication), which has in turn driven the evolution of novel phenotypes and ecological tolerances and been a major driver of speciation. The effects of polyploidy on gene expression have been studied extensively at the level of transcription and, to a much lesser extent, at the level of the steady state proteome, but not at the level of translation. We used polysome profiling by RNA-Seq to quantify translational regulation of gene expression in a recently formed (;100,000 years ago) allotetraploid (Glycine dolichocarpa) closely related to the cultivated soybean (Glycine max). We show that there is a high level of concordance between the allopolyploid transcriptome and translatome overall but that at least one-quarter of the transcriptome is translationally regulated. We further show that translational regulation preferentially targets genes involved in transcription, translation, and photosynthesis, causes regional and possibly whole-chromosome shifts in expression bias between duplicated genes (homoeologs), and reduces transcriptional differences between the polyploid and its diploid progenitors, possibly attenuating misregulation resulting from genome merger and/or doubling. Finally, translational regulation correlates positively with long-term retention of homoeologs from a paleopolyploidy event, suggesting that it plays a significant role in polyploid evolution. INTRODUCTION Polyploidy (whole-genome duplication [WGD]) is a pervasive feature of plant evolution. Duplication events occurred in the common ancestor of seed plants ;319 million years ago (MYA), the common ancestor of flowering plants ;192 MYA, and the common ancestor of core eudicots (the largest group of flow- ering plants) ;117 MYA (Tang et al., 2008; Jiao et al., 2011, 2012). The majority of core eudicot lineages, and most major crops, have subsequently experienced one or more additional polyploidy events (Bowers et al., 2003; Blanc and Wolfe, 2004a; Schlueter et al., 2004; Jiao et al., 2011, 2012). Polyploidy has generated a wide range of novel and/or transgressive traits (Levin, 1983; Warner and Edwards, 1993; Pires et al., 2004; Ni et al., 2009; Jiao et al., 2011; Coate et al., 2012, 2013; Ilut et al., 2012), is a common mechanism of plant speciation (Wood et al., 2009), and may have played a central role in flowering plant diversification (Fawcett et al., 2009; Jiao et al., 2011). Consequently, much effort has been invested in under- standing how genome duplication, complicated by genome merger in polyploids formed through hybridization (allopoly- ploids), functions to give rise to new traits. A central focus of this effort has aimed at understanding the regulation of gene ex- pression in massively duplicated genomes (Guo et al., 1996; Adams et al., 2003; Albertin et al., 2006, 2007; Wang et al., 2006; Flagel et al., 2008, 2009; Hegarty et al., 2008; Ni et al., 2009; Buggs et al., 2010; Coate and Doyle, 2010; Schnable et al., 2011; Ilut et al., 2012; Coate et al., 2013a). The vast majority of polyploid expression studies have measured transcript abun- dance, leaving open the question of how regulatory steps downstream of transcription impact these recurring patterns of gene expression. Variations in transcript abundance are not al- ways biologically meaningful, and many functional patterns of gene expression are established posttranscriptionally (Keene, 2007; Joshi et al., 2011). Translation represents a major regu- latory step in the gene expression pathway (Kawaguchi and Bailey-Serres, 2002; Schwanhäusser et al., 2011; Vogel and Marcotte, 2012). In plants, translational regulation plays a sig- nificant role in cell type–specific gene expression (Jiao and Meyerowitz, 2010; Mustroph et al., 2009; Mustroph and Bailey- Serres, 2010) and is pervasive in response to a wide range of stimuli (Kawaguchi et al., 2004; Branco-Price et al., 2005, 2008; Mustroph et al., 2009; Juntawong and Bailey-Serres, 2012; Park et al., 2012; Reynoso et al., 2012). Translation is often regulated in a sequence-specific manner (Sonenberg and Hinnebusch, 2009), and extensive posttranscriptional regulation of allele- specific expression has been demonstrated in yeast hybrids (Khan et al., 2012). A handful of studies in polyploids have examined expression at the protein level (Albertin et al., 2006, 2007; Hu et al., 2011, 2013; Yao et al., 2011), but due to both technical and biological 1 Address correspondence to [email protected]. The author responsible for distribution of materials integral to the findings presented in this article in accordance with the policy described in the Instructions for Authors (www.plantcell.org) is: Jeremy E. Coate (jcoate@ reed.edu). W Online version contains Web-only data. www.plantcell.org/cgi/doi/10.1105/tpc.113.119966 The Plant Cell, Vol. 26: 136–150, January 2014, www.plantcell.org ã 2014 American Society of Plant Biologists. All rights reserved.
Transcript of Extensive Translational Regulation of Gene Expression in ... · PDF fileExtensive...

LARGE-SCALE BIOLOGY ARTICLE
Extensive Translational Regulation of Gene Expression in anAllopolyploid (Glycine dolichocarpa)W
Jeremy E. Coate,a,1 Haim Bar,b and Jeff J. Doylec
a Department of Biology, Reed College, Portland, Oregon 97202-8199bDepartment of Biological Statistics and Computational Biology, Cornell University, Ithaca, New York 14853-2601cDepartment of Plant Biology, Cornell University, Ithaca, New York 14853-4301
ORCID ID: 0000-0002-1619-8643 (J.E.C.)
All flowering plants have experienced repeated rounds of polyploidy (whole-genome duplication), which has in turn driven theevolution of novel phenotypes and ecological tolerances and been a major driver of speciation. The effects of polyploidy ongene expression have been studied extensively at the level of transcription and, to a much lesser extent, at the level of thesteady state proteome, but not at the level of translation. We used polysome profiling by RNA-Seq to quantify translationalregulation of gene expression in a recently formed (;100,000 years ago) allotetraploid (Glycine dolichocarpa) closely relatedto the cultivated soybean (Glycine max). We show that there is a high level of concordance between the allopolyploidtranscriptome and translatome overall but that at least one-quarter of the transcriptome is translationally regulated. Wefurther show that translational regulation preferentially targets genes involved in transcription, translation, and photosynthesis,causes regional and possibly whole-chromosome shifts in expression bias between duplicated genes (homoeologs), andreduces transcriptional differences between the polyploid and its diploid progenitors, possibly attenuating misregulationresulting from genome merger and/or doubling. Finally, translational regulation correlates positively with long-term retentionof homoeologs from a paleopolyploidy event, suggesting that it plays a significant role in polyploid evolution.
INTRODUCTION
Polyploidy (whole-genome duplication [WGD]) is a pervasivefeature of plant evolution. Duplication events occurred in thecommon ancestor of seed plants ;319 million years ago (MYA),the common ancestor of flowering plants ;192 MYA, and thecommon ancestor of core eudicots (the largest group of flow-ering plants) ;117 MYA (Tang et al., 2008; Jiao et al., 2011,2012). The majority of core eudicot lineages, and most majorcrops, have subsequently experienced one or more additionalpolyploidy events (Bowers et al., 2003; Blanc and Wolfe, 2004a;Schlueter et al., 2004; Jiao et al., 2011, 2012). Polyploidy hasgenerated a wide range of novel and/or transgressive traits(Levin, 1983; Warner and Edwards, 1993; Pires et al., 2004; Niet al., 2009; Jiao et al., 2011; Coate et al., 2012, 2013; Ilut et al.,2012), is a common mechanism of plant speciation (Wood et al.,2009), and may have played a central role in flowering plantdiversification (Fawcett et al., 2009; Jiao et al., 2011).
Consequently, much effort has been invested in under-standing how genome duplication, complicated by genomemerger in polyploids formed through hybridization (allopoly-ploids), functions to give rise to new traits. A central focus of this
effort has aimed at understanding the regulation of gene ex-pression in massively duplicated genomes (Guo et al., 1996;Adams et al., 2003; Albertin et al., 2006, 2007; Wang et al., 2006;Flagel et al., 2008, 2009; Hegarty et al., 2008; Ni et al., 2009;Buggs et al., 2010; Coate and Doyle, 2010; Schnable et al.,2011; Ilut et al., 2012; Coate et al., 2013a). The vast majority ofpolyploid expression studies have measured transcript abun-dance, leaving open the question of how regulatory stepsdownstream of transcription impact these recurring patterns ofgene expression. Variations in transcript abundance are not al-ways biologically meaningful, and many functional patterns ofgene expression are established posttranscriptionally (Keene,2007; Joshi et al., 2011). Translation represents a major regu-latory step in the gene expression pathway (Kawaguchi andBailey-Serres, 2002; Schwanhäusser et al., 2011; Vogel andMarcotte, 2012). In plants, translational regulation plays a sig-nificant role in cell type–specific gene expression (Jiao andMeyerowitz, 2010; Mustroph et al., 2009; Mustroph and Bailey-Serres, 2010) and is pervasive in response to a wide range ofstimuli (Kawaguchi et al., 2004; Branco-Price et al., 2005, 2008;Mustroph et al., 2009; Juntawong and Bailey-Serres, 2012; Parket al., 2012; Reynoso et al., 2012). Translation is often regulatedin a sequence-specific manner (Sonenberg and Hinnebusch,2009), and extensive posttranscriptional regulation of allele-specific expression has been demonstrated in yeast hybrids(Khan et al., 2012).A handful of studies in polyploids have examined expression
at the protein level (Albertin et al., 2006, 2007; Hu et al., 2011,2013; Yao et al., 2011), but due to both technical and biological
1 Address correspondence to [email protected] author responsible for distribution of materials integral to the findingspresented in this article in accordance with the policy described in theInstructions for Authors (www.plantcell.org) is: Jeremy E. Coate ([email protected]).W Online version contains Web-only data.www.plantcell.org/cgi/doi/10.1105/tpc.113.119966
The Plant Cell, Vol. 26: 136–150, January 2014, www.plantcell.org ã 2014 American Society of Plant Biologists. All rights reserved.

constraints, these studies have provided data on homoeolog-specific expression for only a small number of genes (Hu et al.,2011, 2013; Koh et al., 2012). Additionally, protein abundance isthe net result of transcription, translation, and other regulatorysteps (e.g., mRNA degradation) and does not therefore providedirect information about the contributions of these steps in-dividually. Thus, although translational regulation likely repre-sents a biologically and evolutionarily significant aspect ofpolyploid gene expression, it remains largely unexplored.
Polysome profiling takes advantage of the fact that transcriptsbound by polyribosomes (polysomes) migrate further than un-bound transcripts when centrifuged through a Suc densitygradient. Consequently, polysomal RNA (which we define as thetranslatome) can be separated from nonpolysomal RNA. Theconcentration of transcripts from any given gene can then becompared between the two fractions, with differences indicatingtranslational regulation of gene expression. Thus, polysomeprofiling is a relatively straightforward method for characterizingthe translatome, providing a direct measure of translationalregulation, and, when coupled with RNA-Seq, enabling high-throughput quantification of homoeolog usage. To determinethe extent, nature, and significance of translational regulation inallopolyploidy, we performed polysome profiling with RNA-Seqon leaf tissue of Glycine dolichocarpa, an allotetraploid speciesrelated to soybean (Glycine max) formed via hybridization be-tween the diploid species Glycine syndetika and Glycine to-mentella ;100,000 years ago (Doyle et al., 2004). We show thatthe translatome of G. dolichocarpa is highly correlated with itstranscriptome but that nearly 25% of genes are significantlyregulated at the translational level. We further show that trans-lational regulation differs by transcript abundance and functionof the underlying genes, causes regional and possibly whole-chromosome shifts in homoeolog expression bias, and reducesdeviations between the transcriptomes of G. dolichocarpa andits diploid progenitors. Finally, we show that translational regu-lation correlates positively with long-term retention of homoe-ologous genes, suggesting that translational regulation playsa significant role in the evolution of polyploid genomes.
RESULTS
To estimate the extent to which gene expression is transla-tionally regulated in an allotetraploid (G. dolichocarpa = T2), weisolated total mRNA, polysomal mRNA, and nonpolysomalmRNA from leaf tissue and performed RNA-Seq on each frac-tion. Total mRNA (designated “T”) is all of the mRNA in a cell (thetranscriptome). Polysomal RNA (P) is the fraction of the tran-scriptome associated with polysomes (the translatome). Non-polysomal RNA (NP) is the fraction of mRNA not associated withpolysomes; thus, the fraction of standing mRNA not contributingto the translatome (Table 1 summarizes the abbreviationsused frequently in this article). We also performed RNA-Seq onthe leaf transcriptomes of each diploid progenitor species(G. tomentella [D3] and G. syndetika [D4]). We used these data toquantify and characterize translational regulation of the com-bined T2 transcriptome (combining the D3 and D4 homoeolo-gous subtranscriptomes; “combined expression”), as well as
translational regulation of each homoeologous subtranscriptome(“homoeolog expression”). In total, we analyzed two biologicalreplicates of the T2 transcriptome, three biological replicates eachof T2 polysomal RNA and T2 nonpolysomal RNA, and three bi-ological replicates each of the D3 and D4 diploid progenitortranscriptomes.
Combined Expression
Reads were mapped to 40,553 genes in at least one of the threemRNA fractions (87% of the 46,430 high confidence genemodels in the G. max reference genome, Glyma 1.0; Schmutzet al., 2010), with 34,197 genes (74%) expressed in all threefractions. Normalized expression estimates (reads per kilobaseper million mapped reads [RPKM]) were highly correlated amongreplicates, though correlations were slightly higher in P (r2 = 0.93to 0.98) than in NP (r2 = 0.93 to 0.95) and considerably higherthan in T (r2 = 0.84) (Supplemental Figure 1). This is consistentwith previous studies showing that transcription is more sto-chastic than translation and that translational regulation servesto remove biological noise inherent at the transcriptional level(Keene, 2007, Joshi et al., 2011).Overall, expression profiles were also highly correlated among
the three RNA fractions (r2 $ 0.89; Figure 1). Globally, therefore,the translatome closely reflects the transcriptome. Nonetheless,4 to 12% of genes differed in transcript concentration (falsediscovery rate [FDR] < 0.05) in each pairwise comparison (Fig-ures 1A to 1C), indicating translational regulation for a subset ofgenes. We defined genes as positively translationally regulated(PTR) if transcript abundance was significantly higher in P than inNP with an intermediate value in T. Similarly, we defined genesas negatively translationally regulated (NTR) if transcript abun-dance was significantly higher in NP than in P with an in-termediate value in T. By these criteria, 8.8% of genes weretranslationally regulated, with 1224 genes (3.4%) exhibitingpositive translational regulation and 1928 genes (5.4%) ex-hibiting negative translational regulation (Figure 1D). Using morerelaxed criteria of a 2-fold expression difference between P andNP (regardless of statistical significance), with an intermediate
Table 1. Abbreviations Used
Abbreviation Definition
T2 The allopolyploid, G. dolichocarpaD3 Diploid progenitor, G. tomentellaD4 Diploid progenitor, G. syndetikaT Total mRNA (the transcriptome)P Polysomal mRNA (the translatome)NP Nonpolysomal mRNAPTR Positive translational regulationPTRD3 PTR of the D3 homoeologPTRD4 PTR of the D4 homoeologNTR Negative translational regulationNTRD3 NTR of the D3 homoeologNTRD4 NTR of the D4 homoeologDDP Diploid distinguishing polymorphismRPKM Reads per kilobase per million readsRPKMD3 RPKMs derived from the D3 homoeologRPKMD4 RPKMs derived from the D4 homoeolog
Translatome of an Allopolyploid 137
expression level in T, 18.6% of genes were translationally reg-ulated (2152 genes [6.0%] PTR and 4475 [12.6%] NTR). Re-quiring that the difference in expression between P and NP besignificant (FDR < 0.05) and $2-fold, 7.3% of genes weretranslationally regulated (881 [2.5%] PTR and 1703 [4.8%] NTR).Thus, roughly 7 to 19% of the T2 combined transcriptome wastranslationally regulated, of which approximately one-third werePTR and two-thirds were NTR.
Homoeolog Expression
Based on RNA-Seq libraries from three D3 diploid accessionsand three D4 diploid accessions, we identified sites that differedbetween the two diploid progenitor species of T2, which we calldiploid distinguishing polymorphisms (DDPs; Ilut et al., 2012).
Sites that were polymorphic within a diploid species were ex-cluded from the DDP set. Wherever reads from T2 overlappedthese sites at a read depth $5, we calculated the fraction ofreads derived from each homoeolog. For each gene, we esti-mated homoeolog usage by calculating the weighted average ofall DDPs in that gene.In total, we identified 190,374 DDPs, of which 166,496 were
distributed across 27,132 genes (an average of 6.1 DDPs/gene)and 23,878 were annotated as intergenic. To focus on geneswith the most reliable estimates of homoeolog usage, we re-stricted our analysis to the subset for which estimates wereobtained in all biological replicates of all three RNA fractions (T,P, and NP). This subset consisted of 3874 genes (hereafter re-ferred to as the “homoeolog gene set”). Within this gene set,homoeolog usage estimates were derived from 31,154 DDPs
Figure 1. The T2 Transcriptome and Translatome Are Highly Correlated for Combined Expression.
Scatterplots of expression estimates (RPKM) for pairwise comparisons between the three mRNA pools. Tables indicate the total number of genesplotted (“Total”; shown in gray) and the number of genes that are differentially expressed at FDR < 0.05 (“FDR < 0.05”; shown in blue). In (D), genes witha $2-fold difference in expression (regardless of significance) are shown with red outline, and genes with FDR < 0.05 and with $2-fold difference inexpression are shown with blue fill and green outline.(A) Polysomal (P) versus total (T).(B) Nonpolysomal (NP) versus total (T).(C) Polysomal (P) versus nonpolysomal (NP).(D) Polysomal (P) versus nonpolysomal (NP), excluding genes with no expression detected in T.
138 The Plant Cell

(8.1 DDPs/gene on average). We observed both D3 and D4sequences in 28,503 out of 31,154 DDPs (91.5%) and in 3862out of 3874 homoeolog genes (99.7%) in at least one of thethree T2 RNA fractions. This confirms that the vast majority ofDDPs represent conserved differences between the D3 and D4diploids that were inherited by T2. Estimates of homoeologusage (fraction of reads) were multiplied by the total read countfor each of the 3874 homoeolog genes to obtain homoeolog-specific read counts and RPKMs (RPKMD3 and RPKMD4). Aswith combined expression, biological replicates were highlycorrelated for homoeolog expression in P and NP (r2 $ 0.88) andto a lesser extent in T (r2 = 0.82).
As with combined expression, the translatome was highlycorrelated with the transcriptome for relative expression ofhomoeologs (r2 $ 0.66; Figures 2A and 2B) and for homoeolog-specific RPKM (r2 $ 0.87; Figures 2C and 2D). Of 632 genesexhibiting a significant bias in homoeolog usage (RPKMD3 �
RPKMD4) in T (FDR < 0.05), 600 (94.9%) showed usage bias inthe same direction in P and NP (Supplemental Figure 2). Thisbias was significant (FDR < 0.05) for 566 genes in P (89.6%), 534genes in NP (84.5%), and 511 genes in both P and NP (80.9%).Only one gene exhibited significant homoeolog bias in T andsignificant opposite bias in P (Glyma11g13960; D4/D3 = 0.24 inT and 2.29 in P). Thus, extreme translational regulation of homoe-olog usage was rare, and homoeolog usage at the translational levelgenerally reflected homoeolog usage at the transcriptional level.Nonetheless, as with combined expression, we observed
several cases of translational regulation of homoeolog usage.Such regulation can take two forms: (1) shifts in the proportion ofcombined expression derived from each homoeolog (D4/D3homoeolog ratio = relative regulation; Figure 2B) and (2) absoluteincreases or decreases in subgenome-specific transcriptabundance (P versus NP expression for D3 or D4 homoeolog =absolute regulation; Figures 2C and 2D).
Figure 2. The T2 Transcriptome and Translatome Are Highly Correlated for Relative Homoeolog Usage and for Expression within Each Subgenome.
(A) Scatterplot of relative homoeolog expression (proportion of combined expression derived from the D4 homoeolog) in the homoeolog gene set (n =3874) for the polysomal (P) versus total (T) mRNA fractions.(B) Scatterplot of relative homoeolog expression in the polysomal (P) versus nonpolysomal (NP) mRNA fractions. A total of 3669 of 3874 genes (94.7%)showed a shift in relative homoeolog usage of <25% (blue diamonds); of the remaining 205 genes (5.3%) that showed a $25% shift in relativehomoeolog expression (red or green diamonds), 48 (1.2%; green diamonds) showed a statistically significant shift (translational regulation of relativehomoeolog usage; TRRHU).(C) Scatterplot of D3 homoeolog expression (RPKMD3) in P versus T.(D) Scatterplot of D4 homoeolog expression (RPKMD4) in P versus T.Tables in (C) and (D) indicate total number of genes plotted (“Total”; shown in gray) and the number of genes that are differentially expressed at FDR <0.05 (“FDR < 0.05”; shown in blue).
Translatome of an Allopolyploid 139
We identified 48 genes (1.2%) exhibiting significant translationalregulation of relative homoeolog usage (Figure 2B; SupplementalData Set 1). For 28 genes, the proportion of D4 homoeolog tran-scripts increased in the polysomal fraction versus the tran-scriptome, and for 20 genes, the proportion of D4 homoeologtranscripts decreased. Using more relaxed criteria of a $25percentage point shift regardless of statistical significance (e.g.,polysomal D4 fraction = 40%; nonpolysomal D4 fraction = 65%),205 genes (5.3%) were translationally regulated (Figure 2B).Thus, translational regulation of relative homoeolog usage (1 to5%) appears to be less common than translational regulation ofcombined expression (7 to 19%).
We detected more cases of absolute regulation within eachsubgenome (significant differences in RPKMD3 and/or RPKMD4
between P and NP, with an intermediate value in T; Figures 2Cand 2D). A total of 378 genes (9.8% of the homoeolog gene set)exhibited translational regulation of the D3 homoeolog. Of these,148 (39.2%) were positively regulated (exhibited an enrichmentof the D3 homoeolog in P versus NP; designated “PTRD3”), and230 (60.8%) were negatively regulated (exhibited a depletion ofthe D3 homoeolog in P versus NP; “NTRD3”). Similarly, 360genes (9.3%) exhibited translational regulation of the D4 ho-moeolog, of which 132 (36.7%) were positively regulated(PTRD4) and 228 (63.3%) were negatively regulated (NTRD4).Thus, the extent of translational regulation was roughly equalbetween the two homoeologous transcriptomes and similar tothat of combined expression. Additionally, as with combinedexpression, negative TR was more prevalent than positive TRwithin subtranscriptomes.
Translational Regulation of the T2 TranscriptomeIs Widespread
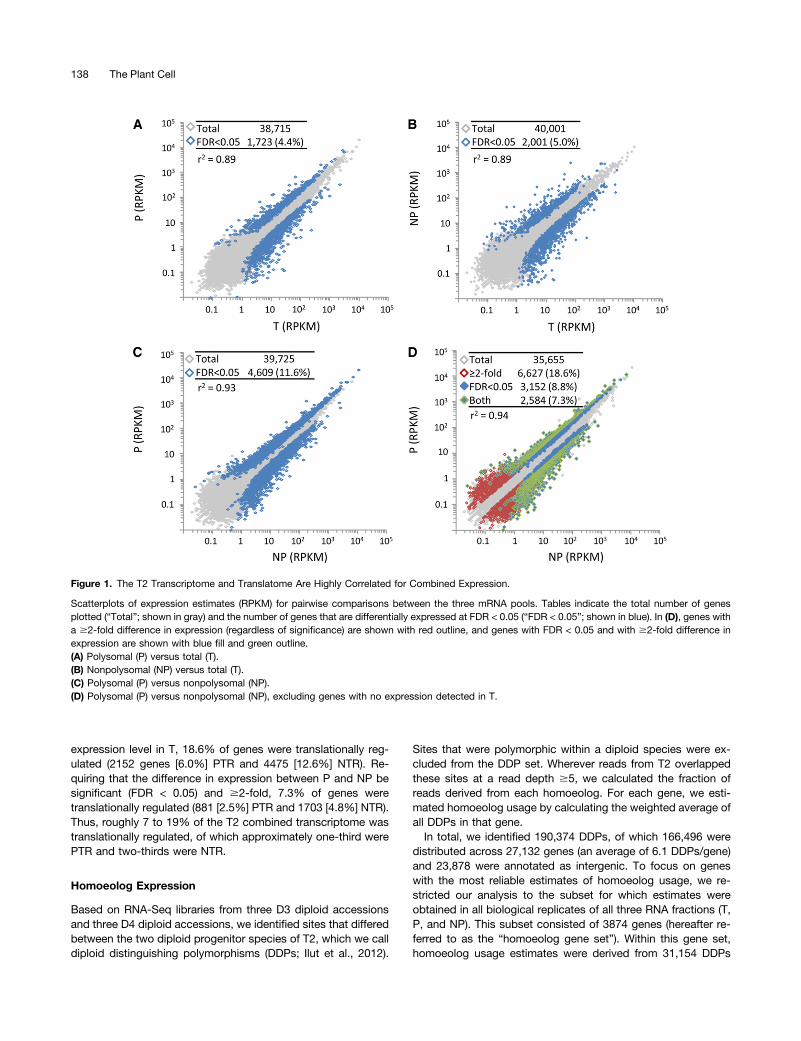
Within the homoeolog gene set, we detected one or more formsof translational regulation in 923 out of 3874 genes (23.8%;Figure 3). This most likely represents a minimum estimate of thetrue extent of translational regulation as it is likely that we wouldhave detected additional cases with more biological replication.Though the homoeolog gene set includes only 8.3% of the highconfidence genes in the soybean genome, the fraction of theseexhibiting translational regulation of combined expression (645/3874; 16.6%) is similar to our estimate from the full gene set (7.3to 18.6%), suggesting that the homoeolog genes are repre-sentative of the whole transcriptome. Thus, although there wasa high level of concordance overall between the T2 tran-scriptome and translatome, we estimate that at least one-quarter of all genes are translationally regulated in one form oranother. A total of 637 genes in the homoeolog gene set (16.4%)exhibited translational regulation at the homoeolog level (Figure3). Extrapolating to the whole genome, we infer that ;7600genes (16.4% of the high confidence gene models) are trans-lationally regulated at the homoeolog level in T2.
The fact that several hundred genes exhibited absolutetranslational regulation within subgenomes, but only 48 exhibi-ted significant shifts in relative homoeolog usage, indicates thatthe two subgenomes are, in most cases, translationally regu-lated in concert. Indeed, 84.1% of genes exhibiting translationalregulation of absolute homoeolog usage in one or both
subgenomes responded in the same direction in both (Table 2).Additionally, only four genes exhibited significant oppositeregulation between the two subgenomes in T2, each involvingPTRD4 and NTRD3. Together, these data suggest that trans-lational regulation tends to affect both homoeologous tran-scriptomes equally.Of the 48 genes exhibiting significant translational regulation
of relative homoeolog usage (cis-translational regulation), 28were also significantly translationally regulated in terms of ab-solute homoeolog usage, with 23 exhibiting NTR of one or theother homoeolog and only eight exhibiting PTR of one or theother homoeolog (three were PTRD4 and NTRD3). This is con-sistent with the observation that NTR is more prevalent thanPTR, both for combined expression and for absolute regulationof homoeologs.
Translational Regulation Differs by Transcript Abundance
Mean expression in T for the PTR gene set was 111.7 RPKM,compared with 18.7 RPKM for the full set of genes expressed inT, and 11.7 RPKM for the NTR gene set. Median expression was23.2 RPKM, 3.9 RPKM, and 5.4 RPKM for PTR, T, and NTR,respectively. Thus, the distribution of expression levels wasshifted upwards for PTR genes relative to NTR (SupplementalFigure 3A). Comparable patterns were observed for each sub-transcriptome (Supplemental Figures 3B and 3C). Therefore, itappears that translational regulation in T2 tends to promoteprotein synthesis from highly transcribed genes and to suppressprotein synthesis from genes that are transcribed at lower levels.Similar to the genes that were NTR for absolute expression,
genes that exhibited regulation of relative homoeolog usagewere generally transcribed at a lower level than those that did not(Supplemental Figure 3D). This is consistent with the observation
Figure 3. Nearly One-Quarter of the Genes in the Homoeolog Gene SetDemonstrate Translational Regulation in T2.
Venn diagram of translationally regulated genes in the homoeolog geneset (n = 3874). TRD3, translational regulation of the D3 homoeolog; TRD4,translational regulation of the D4 homoeolog; TRcomb, translational reg-ulation of combined (D3+D4) expression; TRRHU, translational regulationof relative homoeolog usage.
140 The Plant Cell

that translational regulation of relative homoeolog usage is usuallyachieved via negative regulation of one of the two homoeologs.Expression levels were similar for genes in which translation fa-vored D3 (mean = 34.4 RPKM, median = 23.0 RPKM, n = 20) orD4 (mean = 34.7 RPKM, median = 22.6 RPKM, n = 28).
Translational Regulation Differs by Gene Ontology andSubcellular Localization
Gene Ontology enrichment analysis indicated that the PTR genesets (PTR, PTRD3, and PTRD4) were enriched for genes encodingribosomal proteins or otherwise functioning in translation anddepleted for genes functioning in transcription, whereas the NTRgene sets (NTR, NTRD3, and NTRD4) showed the opposite pat-tern (Supplemental Figure 4 and Supplemental Data Set 2).Consistent with these molecular process terms, the PTR setswere also enriched for genes encoding cytoplasmic proteins,whereas the NTR sets were enriched for genes encoding pro-teins localized to the nucleus. The PTR gene sets were alsoenriched for genes encoding plastid proteins, including genesinvolved in photosynthesis, whereas plastid- and photosynthe-sis-related Gene Ontology terms were underrepresented in theNTR gene sets (Supplemental Figure 4). Accordingly, targetingpredictions from Predotar (http://urgi.versailles.inra.fr/predotar/predotar.html) indicated that the PTR gene set is enriched forgenes targeted to plastids: 25.2% of the PTR genes are pre-dicted to be chloroplast targeted compared with 7.8% of thehigh-confidence soybean genes (x2 = 480, df = 1, P < 0.001) and6.7% of the NTR genes (x2 = 212.0, df = 1, P < 0.001).
Translational Regulation Has No Net Effect on D4 GenomeExpression Dominance
Across the homoeolog gene set, mean homoeolog usage wasbiased slightly toward D4 in all three RNA fractions: 53.6% in Tand P, and 53.7% in NP (Supplemental Figure 5A). By contrast,mean expression was 49.9% D4 at the diploid level (obtained bydividing expression [RPKM] in the D4 diploid by the sum ofexpression in D3 and D4). Thus, D4 homoeolog usage wassignificantly higher in all three tetraploid fractions (T, P, and NP)than is predicted by combining the diploid transcriptomes in
silico (P < 0.001; t test). Similarly, all three fractions exhibitedcomparable numbers of genes with a D4 expression bias (x2 #
0.192, df = 1, P $ 0.662) and significantly more than expectedbased on the combined diploid transcriptomes (x2 $ 49.9, df =1, P < 0.001; Supplemental Figure 5B). Because the D4 ho-moeolog fractions in P and NP were comparable to that in T,there does not appear to be any global translational bias in ho-moeolog usage, consistent with our conclusion that translationalregulation predominantly affects both homoeologs equally.
Translational Regulation Has Regional Effects onHomoeolog Dominance
Unbalanced homoeolog expression bias at the transcriptionallevel, like that favoring D4 homoeologs in T2, has been observedin other allopolyploids (Flagel et al., 2008, 2009; Innes et al.,2008; Buggs et al., 2010; Lin et al., 2010; Schnable et al., 2011;Freeling et al., 2012; Grover et al., 2012) and has been proposedto facilitate biased fractionation (the disproportionate loss ofgenes from one homoeologous genome versus the other;Freeling and Thomas, 2006; Schnable et al., 2011; Freeling et al.,2012). Averaging D4 homoeolog usage over 25-gene windowsalong chromosomes of the soybean reference genome, weobserved nearly uniform D4 homoeolog expression dominanceat the transcriptional level (T) over most of the length of all 20chromosomes (Figure 4; Supplemental Figure 6). The D4 ho-moeolog contributed >50% of combined expression in 2734 outof 3389 25-gene windows (80.7%).Though the D4 bias was not amplified at the level of trans-
lation overall, we looked to see if physically linked genesshow similar patterns of bias that might suggest translationalregulation favors one subgenome over the other in localizedgenomic neighborhoods. Translational regulation acted toshift expression toward the D4 homoeolog across the majorityof chromosomes 1 (Figure 4), 4, 16, and 18 (SupplementalFigure 6). By contrast, translation shifted expression toward theD3 homoeolog for most of chromosomes 5 (Figure 4) and 14(Supplemental Figure 6). On chromosome 20, translationincreased D4 homoeolog bias across 68 of the first 74 25-gene windows (covering ;80% of the length of the chro-mosome) and decreased D4 bias across the remaining 4625-gene windows (Figure 4). Similar mixed patterns wereobserved for the remaining chromosomes (2, 3, 6 to 13, 15,17, and 19; Supplemental Figure 6). It is likely that genomicrearrangements have occurred between T2 (and/or its diploidprogenitors) and the soybean reference genome, such thatnot all genes physically linked in soybean are linked in T2.Some of the mixed patterns observed here (e.g., chromo-some 20) could therefore be an artifact of such rearrange-ments. Overall, however, synteny is likely to be largelyconserved between T2 and soybean. Genetic linkage mapsof nine chromosomes in Glycine latifolia, which is equallydiverged from soybean as is T2, were nearly collinear withtheir homoeologous soybean chromosomes (Chang et al.2013). Thus, translational regulation appears to have re-gional and/or chromosomal effects on expression bias, insome cases favoring the D3 subgenome, and in other casesfavoring the D4 subgenome.
Table 2. Homoeologs Are Translationally Regulated in Concert
Homoeolog 1
Homoeolog 2
Total Samea Oppositeb
PTR 242 210 (86.8%) 32 (13.2%)NTR 375 309 (82.4%) 39 (10.4%)Total 617 519 (84.1%) 71 (11.5%)
For genes that are PTR or NTR for at least one homoeolog, thedistribution of genes showing the same or opposite translationalregulation of the other homoeolog. Values in parentheses indicate thenumber of genes exhibiting the specified form of translational regulation.aBoth homoeologs are translationally regulated in the same direction(positive or negative).bD3 and D4 homoeologs are translationally regulated in oppositedirections (one positive and the other negative).
Translatome of an Allopolyploid 141

Because translational regulation generally promotes the ex-pression of highly transcribed genes (Supplemental Figure 3),one possibility is that these regional effects are simply a by-product of translation favoring the more highly transcribed ho-moeolog. This does not appear to be the case, however,because translation frequently shifted homoeolog usage in favorof the less transcribed homoeolog (Figure 4). For example,translation increased the D4 fraction of combined expression onchromosome 1 even where the D4 homoeolog was transcribedat a lower level than the D3 homoeolog. Additionally, despitemodest effects on homoeolog usage overall, translational reg-ulation reversed transcriptional bias (changed which homoeologwas expressed at >50% of combined expression) in 525 out of3389 25-gene windows (15.5%) and in 773 out of 3874 genes(20.0%). Shifts toward the D3 homoeolog (310 25-gene win-dows) were more common than shifts toward the D4 homoeolog(215 25-gene windows) in absolute terms (P < 0.0001; two-tailedbinomial test), though less frequent as a proportion of possible25-gene windows (11.3% of 25-gene windows with D4 tran-scriptional dominance compared with 32.8% of 25-gene windowswith D3 transcriptional dominance; x2 = 186.0, df = 1, P < 0.001).
Translational Regulation Reduces TranscriptionalDifferences between T2 and Its Diploid Progenitors
We quantified the leaf transcriptomes of the diploid progenitorspecies of T2 (D3 and D4) by RNA-Seq. For genes exhibitingsignificant differences in combined expression at the transcrip-tional level between T2 and one or both diploids (FDR < 0.05),translation generally acted to reduce these differences. Genesthat were transcribed at a significantly higher level in T2 than inthe D3 and/or D4 diploids were more likely to be NTR than thegenome-wide average (Figure 5A). Conversely, genes that weretranscribed at a significantly lower level in T2 than in D3, and toa lesser extent D4, were more likely to be PTR than the ge-nome-wide average (Figure 5A). A similar picture is observedwhen expression levels of individual genes are considered:genes that were overtranscribed in T2 versus either diploidwere translationally repressed (lower RPKMP/RPKMT) relativeto the whole genome, and genes that were undertranscribed inT2 versus either diploid exhibited enhanced translation (higherRPKMP/RPKMT) relative to the genome-wide average (Figure5B). As a result, absolute differences in RPKM between T2 andeither diploid were generally reduced in the T2 translatomerelative to the T2 transcriptome (Figure 5C; SupplementalTable 1).Translational regulation also tended to modulate homoeolog
expression ratios to reflect diploid expression ratios moreclosely. Of the 3874 genes in the homoeolog gene set, 3044were transcribed at equivalent levels in the D3 and D4 diploids.Of these, homoeolog usage within the T2 transcriptome wasbalanced for 2705 genes (88.9%) and deviated from equal ex-pression for 339 genes (11.1%), with 163 showing a D3homoeolog bias and 176 showing a D4 homoeolog bias (Figure6A). For those genes with balanced homoeolog usage in T,consistent with equal expression at the diploid level, trans-lational regulation had no directional effect on D4/D3 homoeologratios (Figure 6B). By contrast, for genes in which a homoeologbias was introduced in the T2 transcriptome, translational reg-ulation partially restores the balance in homoeolog expression(moved the D4/D3 ratio closer to 1; Figure 6B). The homoeologratio was more diploid-like in P than in T for 215 of 339 geneswith a homoeolog bias in T (P < 0.0001; two-tailed binomialprobability assuming an equal chance for P to be more or lessdiploid-like than T).Conversely, 830 genes differed significantly in transcript
abundance between diploid D3 and diploid D4 (FDR < 0.05),with 408 more highly expressed in D3 and 422 more highlyexpressed in D4. For these 830 genes, 128 homoeolog pairs(15.4%) exhibited significant bias (FDR < 0.05) in the T2transcriptome that was comparable to the bias at the diploidlevel (<1.5-fold difference between the diploid D4/D3 ratioand the D4/D3 ratio in T; Figure 6C). Of the remaining genes,homoeolog bias was amplified in 213 (25.7%), attenuated in176 (21.2%), and reversed in 125 (15.1%) relative to differ-ences at the diploid level (Figure 6C). For the 128 genesshowing a D4/D3 homoeolog ratio in T comparable to that ofthe diploids, the translatome had no directional effect onhomoeolog usage (Figure 6D). By contrast, for genes inwhich the homoeolog ratio in T deviated from the diploid
Figure 4. Translational Regulation Exerts Regional Effects on Homoe-olog Usage in T2.
(A) Average D4 homoeolog fraction of combined expression in the T2transcriptome (T; blue line) and translatome (P; red line) in 25-genesliding windows across chromosomes 1, 5, and 20. Tick marks on the xaxis indicate 25-gene increments (starting from the 25th gene). Grayshading delineates sliding windows in which the majority of genes arelocated in pericentromeric regions defined by Du et al. (2012).(B) Percentage of 25-gene windows in which the D4 fraction is increasedin P relative to T (light gray) or in which the D4 homoeolog fraction isdecreased in P relative to T (dark gray).
142 The Plant Cell

ratio, translational regulation tended to partially restore ho-moeolog bias to a more diploid-like level (Figure 6D). Thehomoeolog ratio was more diploid-like in P than in T for 321/514 genes (62.5%) among these genes (P < 0.0001; two-tailed binomial probability).
Overall, therefore, there was a propensity for translationalregulation to partially restore homoeolog expression ratiosin T to a more diploid-like level (Figures 6B and 6D). Thiswas true whether or not genes were differentially expressedat the diploid level and regardless of the direction in which
homoeolog usage deviated from relative expression in thediploids.
Positive Translational Regulation Correlates with GreaterRetention of Homoeologs from the Most Recent GlycinePaleopolyploidy Event
The common ancestor of T2, D3, D4, and G. max experienceda WGD event 5 to 13 MYA (Shoemaker et al., 2006; Schmutz et al.,2010; Doyle and Egan, 2010; defined as the “A” WGD event inCoate et al., 2011). Based on conserved synteny within the G. max
Figure 5. Translational Regulation Reduces Differences in Combined Transcription between T2 and Its Diploid Progenitors.
(A) Fraction of translationally regulated genes that are PTR and NTR for the full genome (“All”) and for genes that are differentially transcribed in T2versus one or both of its diploid progenitors (e.g., “>D4” indicates that transcript abundance [RPKM] in T2 is significantly higher than in the D4 diploid;“<D4” indicates that transcript abundance in T2 is significantly lower than in the D4 diploid). Asterisks indicate a ratio significantly different than thegenome-wide ratio (x2 P value < 0.05).(B) Combined expression in polysomal mRNA (translatome) divided by combined expression in total mRNA (transcriptome) in T2 for the full genome andfor the subsets of genes that are differentially transcribed between T2 and its progenitors. Black diamonds represent sample means. Error bars indicateminimum and maximum values.(C) Scatterplot of differences in expression between T2 (transcriptome or translatome) and the D4 diploid transcriptome (absolute value [RPKMT2 2
RPKMD4]) for the whole genome (top) and for genes that are differentially transcribed between T2 and D4 (bottom). The smaller the difference betweenT2 and D4, the closer the data point is to the x axis. Genes are ordered by differences between the T2 and D4 transcriptomes (red squares). Bluediamonds show the corresponding difference between the T2 translatome and D4 transcriptome. The differences between the T2 translatome and D4are greater than or equal to the differences between the T2 transcriptome and D4 for the majority of genes overall (63.6%; blue diamonds at or abovethe red curve). By contrast, for genes that are differentially transcribed between T2 and D4, differences are smaller in the T2 translatome for the majorityof genes (63.5%; blue diamonds below the red curve). Similar patterns were observed for T2 versus D3 and T2 versus D3 and D4 (data not shown).
Translatome of an Allopolyploid 143

genome, Du et al. (2012) identified genes that have retained bothhomoeologs (“deletion-resistant” [delR], following Paterson et al.,2006) and genes that have fractionated (“duplication-resistant”[dupR]) following the “A” duplication.
Overall, translationally regulated genes were more likely tohave retained duplicates from the “A” duplication event than thegenome-wide average (Table 3), with PTR genes exhibitingslightly higher retention levels than NTR genes. With the ex-ception of the genes that were NTR for combined expression, allsets of translationally regulated genes had significantly higher
retention levels than the whole genome for “A” homoeologpairs.High expression levels have been shown to correlate with
homoeolog retention in soybean and other species (Jiang et al.,2013). Because PTR genes are also more highly expressed thanthe genome-wide average (Supplemental Figure 3), we looked tosee if the higher retention rate for PTR genes was simplya function of higher average transcription level. Percentage ofretention for PTR genes with transcript abundance at or belowthe genome-wide average (17.8 RPKM in T) was comparable to
Figure 6. Translational Regulation Reduces Differences in Homoeolog Usage between T2 and Its Diploid Progenitors.
(A) D4/D3 homoeolog ratios in the T2 transcriptome are plotted against D4/D3 diploid ratios for genes that are equally transcribed in the D3 and D4diploids (n = 3044). Genes in green show significantly higher expression of the D4 homoeolog than of the D3 homoeolog (“D4 bias”) in the T2transcriptome. Genes in red show significantly higher expression of the D3 homoeolog than of the D4 homoeolog (“D3 bias”) in the T2 transcriptome.Genes in blue show equal expression of D3 and D4 homoeologs in T2 (“No bias”), consistent with equal expression between D3 and D4 diploids.(B) Box-and-whisker plots showing D4/D3 ratios in the diploids, the T2 transcriptome (T), and the T2 translatome (P) for each category (no bias, D4 bias,and D3 bias) shown in (A).(C) D4/D3 homoeolog ratios in the T2 transcriptome are plotted against D4/D3 diploid ratios for genes that are differentially transcribed between D3 andD4 diploids (FDR < 0.05; n = 830). Genes are color coded based on whether the T2 transcriptome preserves (“Same”), amplifies, attenuates, or reversesthe D4/D3 ratio relative to the diploids.(D) Box-and-whisker plots showing ratios (highest expressed at the diploid level/lowest expressed at the diploid level) in the diploids, the T2 tran-scriptome (T), and the T2 translatome (P) for each category (amplified, same, attenuated, and reversed) shown in (C). In each case where homoeologusage in the T2 transcriptome differs from relative expression in the diploids, translational regulation partially restores homoeolog usage to a morediploid-like level.
144 The Plant Cell

that of PTR genes with transcript abundance greater than thegenome-wide average (74.4% versus 74.7%). Additionally,median transcript abundance was similar for PTR dupR genesand PTR delR genes (22.7 RPKM versus 24.0 RPKM). Thus, thecorrelation between PTR and higher retention following the “A”polyploidy event does not appear to be a function of highertranscript abundance. The fact that NTR genes, which weregenerally transcribed below the genome-wide average, alsoexhibited elevated retention of duplicates from the “A” poly-ploidy event further suggests that the correlation betweentranslational regulation and retention is not simply a function oftranscription level.
DISCUSSION
Though translatomic approaches have been used to studyregulation of gene expression in plants (Kawaguchi et al., 2004;Jiao and Meyerowitz, 2010; Mustroph and Bailey-Serres, 2010;Juntawong and Bailey-Serres, 2012), few studies have exam-ined gene expression downstream of transcription in recentpolyploids (Albertin et al., 2006, 2007; Hu et al., 2011, 2013; Yaoet al., 2011), and none have specifically examined translationalregulation. Here, we have shown that the transcriptome andtranslatome of a recently formed allotetraploid (G. dolichocarpaT2) related to soybean were highly correlated overall but that;10% of genes in each duplicated subgenome (homoeologs)exhibited significant translational regulation, and 10% exhibitedtranslational regulation of combined expression. Together, ofthe 3874 genes for which the contribution of the two homoeol-ogous subgenomes could be distinguished with confidence (thehomoeolog gene set), 923 (23.8%) exhibited at least one form oftranslational regulation (translational regulation of combinedexpression, absolute regulation of homoeolog usage, and/orrelative regulation of homoeolog usage). It is likely that withadditional biological replication (and, thereby, more statisticalpower), this number would have been higher. Thus, assumingthat the homoeolog gene set is representative of the completegene set in soybean, at least one-quarter of all genes in the leaftranscriptome are translationally regulated to some extent.
NTR was more prevalent than PTR, both for combined ex-pression and homoeolog-specific expression, which appears tobe a common pattern in plants. In unstressed Arabidopsisthaliana leaves, 118 genes exhibited polysomal over non-polysomal (P/NP) expression ratios below the 95% confidenceinterval for the genome-wide distribution, compared with 91exhibiting P/NP ratios above the 95% confidence interval(Kawaguchi et al., 2004). Translational repression was also dra-matically more prevalent than PTR in various stress responses,such as dehydration (Kawaguchi et al., 2004) and hypoxia(Branco-Price et al., 2005, 2008).Though ;10% of the genes in each homoeologous genome
were translationally regulated, the two subgenomes were mostlyregulated in concert. Consequently, only ;1 to 5% of genesexhibited translational regulation of relative homoeolog usage (ashift between the full transcriptome and the polysomal fractionin the proportion of expression derived from each homoeolog).Thus, homoeolog expression bias (or lack thereof) observed atthe transcriptional level was largely preserved in the trans-latome. Consistent with these observations, Hu et al. (2013)found greater transcriptome/proteome concordance for ho-moeolog usage than for combined expression in allopolyploidGossypium barbadense.T2 exhibited expression bias favoring D4 at the transcriptional
level with, on average, 53.6% of transcripts derived from the D4homoeolog. Though subtle, this D4 homoeolog bias was quiteconsistent throughout the genome: 80.7% of 25-gene windowsacross the soybean reference genome exhibit an average D4proportion of combined expression >50%. Similar levels of ex-pression dominance have been observed in other allopolyploids,including cotton (Gossypium hirsutum; Flagel et al., 2008) andmaize (Zea mays; Schnable et al., 2011).We speculated that translational regulation might enhance D4
genome dominance but found that it had no net effect onhomoeolog usage: The mean D4 homoeolog proportion ofcombined expression in the T2 translatome was identical to thatin the transcriptome (53.6%), and 89% of 25-gene windows witha transcriptional bias favoring D4 homoeologs retained a D4bias in the translatome. However, translational regulation did
Table 3. Distribution of Retained Homoeologs (DelR) and Singletons (DupR) in the Soybean Genome from the Glycine “A” Polyploidy Event by Type ofTranslational Regulation
Gene Class Gene Count % of Total
DelRa DupRb Total DelR DupR x2 P Value
All 28,066 12,965 41,031 68.4 31.6 – –
PTR 876 296 1,172 74.7 25.3 21.3 <0.001PTRD3 117 28 145 80.7 19.3 10.1 0.001PTRD4 98 29 127 77.2 22.8 4.5 0.034NTR 1,242 530 1,772 70.1 29.9 2.2 0.134NTRD3 172 52 224 76.8 23.2 7.3 0.007NTRD4 168 50 218 77.1 22.9 7.5 0.006TRRHU 40 8 48 83.3 16.7 5.0 0.026
TRRHU = translational regulation of relative homoeolog usage. Reported x2 and P values are for comparisons of the corresponding gene set to the fullgenome (“All”).aDeletion-resistant (“A” homoeologs retained).bDuplication-resistant (“A” homoeologs fractionated).
Translatome of an Allopolyploid 145

exert many regional effects on homoeolog usage. Strikingly,translation shifted expression toward the D3 subgenome overmost of the length of two soybean reference chromosomes, aswell as in several smaller genomic neighborhoods within chro-mosomes. It is not known to what extent synteny is conservedbetween T2 and soybean, so we cannot determine the precise ge-ography of translational effects on homoeolog usage in T2. However,limited evidence suggests that gene order is largely conserved be-tween the two genomes (Innes et al., 2008, Chang et al., 2013), and itappears clear that translational regulation imposes regional, andpossibly chromosomal, shifts in homoeolog usage.
Flagel et al. (2009) presented evidence for coordinated tran-scriptional regulation of physically linked homoeologs, andtranslation has been shown to coordinately regulate functionallyrelated genes via RNA regulons (Keene, 2007). Our data suggestthat there is coordinated translational regulation of physicallylinked genes as well. The mechanism for such regulation is notreadily apparent, given that transcripts are not bound by anysort of physical linkage, but linked genes could share similarcis-elements that function to coordinate translation (e.g., pyrimidine-rich translational elements common to the 59 untranslated re-gions of most mTOR-regulated mammalian genes; Hsieh et al.,2012).
Overall, translational regulation reversed transcriptional bias in15.5% of 25-gene windows and 20.0% of individual genes, withshifts toward the D3 homoeolog slightly more frequent thanshifts toward the D4 homoeolog. Therefore, rather than ampli-fying and/or stabilizing D4 dominance genome-wide, trans-lational regulation acted on a more local level, amplifying D4 biasin some genomic neighborhoods, but favoring D3 in others.Thus, though the effects of translation on homoeolog usagewere generally modest, our data suggest that genome domi-nance may in fact be a chromosomal or segmental phenome-non, rather than being genome-wide as has been proposed(Schnable et al., 2011; Freeling et al., 2012). In maize and otherpaleopolyploids where unbalanced homoeolog expression biashas been observed, the diploid progenitors are extinct, making itimpossible to definitively assign chromosomes to subgenomes.In such studies, the assumption was made that one subgenomecomprises the less fractionated chromosomes and the othersubgenome comprises the more fractionated chromosomes. Iffractionation bias is dictated by homoeolog expression(Schnable et al., 2011; Freeling et al., 2012), our data suggestthis assumption may be unwarranted and that fractionation biasoccurs at finer scales than whole subgenomes.
Intriguingly, our data suggest that translational regulationplays a role in determining the long-term fates of homoeologousgenes. Genes that were translationally regulated in our studyexhibited significantly higher retention of duplicates from theGlycine-specific paleopolyploidy event 5 to 13 MYA (Doyle andEgan, 2010) than genes that were not, with PTR genes retainedat a slightly higher rate than NTR genes.
PTR could facilitate retention by strengthening selection onabsolute dosage (Conant and Wolfe, 2007). Recent studies haveshown a significant association between the metabolic fluxcatalyzed by an enzyme and retention of the underlying genesfollowing a paleopolyploidy event in Arabidopsis (Bekaert et al.,2011; Hudson et al., 2011). The authors speculated that
increases in the protein products of some genes are beneficial(e.g., enzymes catalyzing rate-limiting steps in essential meta-bolic pathways). If protein abundance increases with gene copynumber (a positive gene dosage response), selection would there-fore act to preserve duplicates of genes encoding such proteins.Similarly, selection might favor positive translational regulation asanother mechanism for increasing the cellular titer of such proteins.PTR in G. dolichocarpa leaves preferentially targeted highly
transcribed genes, which likely encode many of the proteins thatare required at a high cellular titer. Additionally, genes withplastid functions and genes encoding translation-related pro-teins (ribosomal proteins and translation initiation factors) werepreferentially PTR. Ribosomal proteins are among the mostabundant proteins in the cell (Ishihama et al., 2008; Margueratet al., 2012), and translation is rate limiting for protein synthesisof the most abundant proteins (Marguerat et al., 2012). Thus, itmight be expected that an increase in ribosomal proteins wouldfacilitate greater protein synthesis, particularly in a recentlyformed polyploid such as T2, which transcribes nearly twice asmany genes as its diploid progenitors (Coate and Doyle, 2010).Similarly, photosynthetic proteins are among the most abundantproteins in green plant tissue and are often rate limiting to pri-mary productivity (Coate et al., 2011; Coate and Doyle, 2013).The fact that ribosomal and photosynthetic proteins are morelikely to be PTR than the genome-wide average in T2 and morelikely to be retained in duplicate following polyploidy in a varietyof species (Blanc and Wolfe, 2004b) supports the notion thatthey are under selection for increased absolute dosage.Alternatively, it has been proposed that selection on relative
dosage explains many recurring patterns of gene duplicate re-tention and loss (Papp et al., 2003; Birchler et al., 2007; Freeling,2009; Birchler and Veitia, 2010; Coate et al., 2011). Specifically,many protein complexes and signaling cascades require a spe-cific stoichiometry among the interacting proteins to functionproperly. To the extent that protein abundance is dictated bygene copy number, small-scale duplications (e.g., tandem du-plications) that affect some but not all subunits of dosage sen-sitive complexes disrupt this stoichiometry and are thereforedeleterious. By contrast, by duplicating all genes in a dosagesensitive complex, polyploidy is more likely to preserve properstoichiometry. As a consequence, dosage-sensitive genes arepreferentially retained following WGD and preferentially lostfollowing small-scale duplications (Blanc and Wolfe, 2004b;Seoighe and Gehring, 2004; Maere et al., 2005; Paterson et al.,2006; Thomas et al., 2006; Coate et al., 2011). However, proteinabundance is regulated at many other levels beyond gene copynumber, and polyploidy has been shown to produce a widerange of gene dosage responses at the transcriptional level (Guoet al., 1996; Coate and Doyle, 2010) that potentially disrupt thestoichiometry of interacting proteins. Having additional layers ofgene expression regulation on top of transcription could reduceunbalanced or ectopic expression resulting from duplication andprovide an additional safeguard against dosage imbalance.In many instances, translational regulation likely represents
a mechanism for reducing transcriptional noise (Keene, 2007;Joshi et al., 2011), and we found that translational regulationtends to reduce differences in expression between thecombined T2 transcriptome and the transcriptomes of its diploid
146 The Plant Cell

progenitor species. Similarly, translation generally brings ho-moeolog usage in T2 more in line with expression levels in thetwo diploid progenitor species. These translational adjustmentscould represent corrections of transcriptional misregulation in-duced by genome merger or doubling. By correcting transcrip-tional misregulation resulting from gene duplication, we proposethat translational regulation reduces selection against geneduplicates in dosage-sensitive complexes, thereby explaininghigher long-term retention of homoeologs among translationallyregulated genes than the genome as a whole.
Finally, the few cases of translational regulation of relativehomoeolog usage could represent a form of expression sub- orneofunctionalization (Flagel et al., 2008). Following duplication,most genes experience relaxed selective constraint (Lynch andConery, 2000, 2003). This, in turn, is thought to facilitate theevolution of new functions (neofunctionalization) or partitioningof ancestral functions (subfunctionalization). Genes that are sub-or neofunctionalized are then preserved via purifying selection.Relaxed selection could have enabled the acquisition of novelcis-regulatory elements or mutation of existing cis-regulatoryelements that resulted in new or altered forms of translationalregulation. Such sub- or neofunctionalization at the translationallevel could have then favored duplicate retention (Adams andWendel, 2005).
In conclusion, though the leaf transcriptome and translatome ofallopolyploid G. dolichocarpa T2 were highly correlated overall,translational regulation exerted considerable influence over geneexpression, with nearly one-quarter of the transcriptome trans-lationally regulated to some extent. This translational regulationappeared to tune the polyploid transcriptome to the exigencies ofa doubled genome. T2 leaf mesophyll cells have larger tran-scriptomes (Coate and Doyle, 2010) and more chloroplasts thando D3 or D4 diploids (Coate et al., 2012). In response, translationalregulation appeared to increase production of both translationalmachinery and plastid-targeted proteins. At the same time,translation reduced differences between the transcriptomes of T2and its diploid progenitors, suggesting that it served to attenuatemisregulation resulting from genome merger and/or doubling. Wepropose that these adjustments explain why translationally reg-ulated genes are more likely to be retained in duplicate followingolder polyploidy events than genes that are not.
METHODS
Plant Material
Glycine dolichocarpa (T2; CSIRO accession number G1134) plants weregrown from seed in a growth chamber under the following conditions:12-h/12-h light/dark cycle, 22°C/18°C light/dark temperature, and a lightintensity of 125 mmol m22 s21. Two weeks after germination, fully ex-panded leaflets were collected 1.5 to 2.0 h into the light period andimmediately frozen in liquid nitrogen. Three separate pools of leaf tissuewere collected for three biological replicates. For each biological replicate,leaflets were pooled from six individuals (one leaflet per individual).
Polysome Extraction
For each biological replicate, 0.2 g of leaf tissue was ground to a finepowder in liquid nitrogen and suspended in 1 mL of extraction buffer(0.2 M Tris-HCl, 0.2 M KCl, 35 mM MgCl2, 25 mM EGTA, 0.2 M Suc, 1%
Triton X-100, 2% polyoxyethylene-10-tridecyl ether, 0.5 mg/mL heparin,100 mM b-mercaptoethanol, 100 mg/mL chloramphenicol, and 25 mg/mLcyclohexamide). Debris was removed by centrifuging for 1 min at 4000rpm and 4°C through a Pierce 2-mL centrifuge column (Fisher). Thefiltrate was incubated on ice for 10 min to solubilize membranes andcentrifuged for 5 min at 14,000 rpm and 4°C. The supernatant wastransferred to a new tube, combined with one-twentieth volume of sodiumdeoxycholate, incubated for 5 min on ice to complete microsomal mem-brane solubilization, and centrifuged again for 5 min at 14,000 rpm and 4°C.
For each of three biological replicates, the supernatant was dividedinto two equal fractions, and EDTA was added to one fraction to a finalconcentration of 20mM to dissociate RNP complexes (EDTA control). Theuntreated fraction was layered onto a 15 to 62.5% Suc gradient (10 mLtotal volume) containing 40 mM Tris-HCl, 20 mM KCl, 10 mM MgCl2,0.5 mg/mL heparin, 0.1 mg/mL chloramphenicol, and 0.025 mg/mL cyclo-hexamide. The EDTA control was layered onto an identical Suc gradientexcept that it contained 1 mM EDTA in place of 10 mM MgCl2. Gradientswere centrifuged at 45,000 rpm for 65 min at 4°C and separated into12 fractions by sequentially pipetting 410-mL aliquots from the top of thegradient. Each fraction was pipetted into a tube containing 50 mL of 0.2 MEDTA and 5% SDS, pH 8.0, and inverted to mix.
RNA Extraction
Phenol/chloroform/isoamyl (0.4 mL; 25:24:1) was added to each fraction,which was then vortexed and centrifuged at maximum speed for 4 min atroom temperature. The upper phase was then transferred to a new tubeand mixed with 1 mL 95% ethanol and then centrifuged at maximumspeed for 15 min at room temperature. Pellets were dried and resus-pended in 30 mL of ice-cold TE buffer.
To determine which fractions contained polysomal RNA, aliquots ofeach fraction were run on nondenaturing agarose gels. RNA/ribosomeassociations are disrupted in the EDTA-treated controls. Consequently,fractions from the EDTA control gradients for which rRNA bands could bevisualized (fractions 1 to 6 in all cases) contained nonpolysomal RNA.rRNA bands were absent or nearly invisible in all heavier fractions of EDTAcontrols (Supplemental Figure 7). By contrast, rRNA bands were clearlyvisible in all fractions of untreated (EDTA-free) gradients (SupplementalFigure 7). Consequently, fractions 7 to 12 of the untreated gradients wereassumed to contain polysomal RNA. This cutoff corresponds to thoseused in other studies (Kawaguchi et al., 2004) and was confirmed byquantifying RNA in each fraction by UV absorbance. For the EDTA-treated fractions, 84% of the total nucleic acids recovered was contained infractions 1 to 6. The bulk of the remaining 16% was most likely genomicDNA, based on the presence of high molecular weight bands on the gels.RNA concentrationsweremore uniform across the EDTA-free fractions, and41% of total nucleic acids recovered was in fractions 7 to 12.
For each biological replicate, fractions 1 to 6 from the EDTA-freegradients were pooled and designated “nonpolysomal” (NP). Fractions 7to 12 were pooled and designated “polysomal” (P). Unfractionated RNAextracted using the RNeasy Kit (Qiagen) was designated “total” RNA (T).All RNA fractions were treated with DNase I (NEB).
Illumina Library Preparation and Sequencing
Single-end RNA-Seq libraries were constructed for three biologicalreplicates each of polysomal and nonpolysomal RNA. Libraries weremade following the Illumina mRNA sequencing protocol (Illumina), withthe following modifications: (1) two rounds of poly(A) selection wereperformed using the DynabeadsmRNADIRECT kit (Life Technologies); (2)RNA was fragmented for 2 min at 70°C using the RNA fragmentationreagents kit (Life Technologies); and (3) Illumina PE adapters were re-placed with custom-made adapters containing 3-nucleotide barcodes inorder to facilitate multiplexing of samples.
Translatome of an Allopolyploid 147
Sequencing was performed on the HiSequation 2000 platform (Illu-mina), generating100-nucleotide reads, respectively. Equimolar amountsof three barcoded libraries were combined and sequenced per channel. Inaddition to the polysomal and nonpolysomal libraries, the transcriptomes(total mRNA) of two biological replicates of T2 total and three biologicalreplicates of each diploid progenitor,Glycine syndetika (D4; CSIRO accessionnumbers G1300, G2073, and G2321), and Glycine tomentella (D3; CSIROaccession numbers G1366, G1403, and G1820) were grown under identicalconditions and prepared and sequenced as described by Coate et al. (2013).
Data Analysis
Multiplexed reads from FASTQ Sanger files were split into their respectivelibraries based on 59 3-nucleotide barcode sequences, then trimmed toremove barcodes and low quality 39 bases. Reads were quality filteredusing the FASTQ Quality Filter in the FASTX-Toolkit (http://hannonlab.cshl.edu/fastx_toolkit/; default settings). Reads were mapped to thesoybean (Glycine max) genome using Bowtie (Langmead et al., 2009) withthe following parameters: -a,–best,–strata, -m 1, -n 3, -l 30, and -e 250 (78-nucleotide reads) or –e 288 (90-nucleotide reads). These settings ensurethat only reads mapping unambiguously to a single locus in the soybeangenome were used in this study. Read counts per gene were determinedusing HTSeq (http://www-huber.embl.de/users/anders/HTSeq/doc/overview.html) using the “–m intersection-noempty” setting. For eachlibrary, transcript abundance per transcriptome for a given gene wasestimated as the number of reads unambiguously mapped to that geneper kilobase and per million unambiguously mapped reads generated bythat library (RKPM). Genes differentially expressed (FDR < 0.05) in pair-wise comparisons of T, P, and NP and in pairwise comparisons of T, D3diploid, and D4 diploid were identified using DESeq (Anders and Huber,2010). For D3 and D4, individual accessions (n = 3) were treated as bi-ological replicates for the species. The contributions of D3 and D4subgenomes to gene expression in T, P, and NP were determined asdescribed by Ilut et al. (2012), except that three accessions per diploidspecies were sequenced instead of one. Sites that were polymorphicamong accessions within either diploid species were excluded from thelist of DDPs.
Gene ontology enrichment analysis was performed using the AgriGOWeb tool (http://bioinfo.cau.edu.cn/agriGO/; Du et al., 2010). Significancewas determined using Fisher’s exact test with the Yekutieli adjustment formultiple comparisons. For combined expression, enrichment was de-termined relative to all genes expressed in T and in P and/or NP (n =35,655). For homoeolog-specific expression, enrichment was determinedrelative to the homoeolog gene set (n = 3874).
Accession Numbers
Sequence data (FASTQ files from RNA-Seq experiments) from this articlecan be found in the National Center for Biotechnology InformationSequence Read Archive under accession numbers SRX131445-46,SRX134815-16, SRX134818, SRX134820, SRX134822, SRX134824,SRX134827, SRX316786, and SRX316881 to SRX316885.
Supplemental Data
The following materials are available in the online version of this article.
Supplemental Figure 1. Correlations of Combined Expression Esti-mates among Biological Replicates.
Supplemental Figure 2. Strong Transcriptional Biases in HomoeologUsage Are Preserved in the Translatome.
Supplemental Figure 3. Distribution of Transcript Levels for GenesThat Are Translationally Regulated and Those That Are Not.
Supplemental Figure 4. Relative Enrichment or Depletion of PlantGOSlim Terms among Genes That Are Translationally Regulated.
Supplemental Figure 5. D4 Homoeolog Expression Dominance in T2.
Supplemental Figure 6. Average D4 Homoeolog Fraction of Com-bined Expression in the T2 Transcriptome and Translatome in 25-GeneSliding Windows across Each Soybean Reference Chromosome.
Supplemental Figure 7. Nondenaturing Gels of RNA SamplesExtracted from Suc Gradient Fractions.
Supplemental Table 1. Translation Reduces Transcript-Level Differ-ences in Expression between T2 and Its Diploid Progenitors.
Supplemental Data Set 1. Genes Exhibiting Significant TranslationalRegulation of Relative Homoeolog Usage.
Supplemental Data Set 2. Gene Ontology Terms Overrepresentedamong Translationally Regulated Gene Sets.
ACKNOWLEDGMENTS
We thank Amber Hotto for help with the polysome profiling protocol. Thiswork was supported by grants from the U.S. National Science Founda-tion (0939423, 0744306, and 0822258).
AUTHOR CONTRIBUTIONS
J.J.D. and J.E.C. designed the research. J.E.C. performed the research.J.E.C., H.B., and J.J.D. analyzed the data. J.E.C. and J.J.D. wrote thearticle.
Received October 22, 2013; revised January 3, 2014; accepted January14, 2014; published January 31, 2014.
REFERENCES
Adams, K.L., Cronn, R., Percifield, R., and Wendel, J.F. (2003).Genes duplicated by polyploidy show unequal contributions to thetranscriptome and organ-specific reciprocal silencing. Proc. Natl.Acad. Sci. USA 100: 4649–4654.
Adams, K.L., and Wendel, J.F. (2005). Polyploidy and genomeevolution in plants. Curr. Opin. Plant Biol. 8: 135–141.
Albertin, W., Alix, K., Balliau, T., Brabant, P., Davanture, M.,Malosse, C., Valot, B., and Thiellement, H. (2007). Differentialregulation of gene products in newly synthesized Brassica napusallotetraploids is not related to protein function nor subcellularlocalization. BMC Genomics 8: 56.
Albertin, W., Balliau, T., Brabant, P., Chèvre, A.M., Eber, F.,Malosse, C., and Thiellement, H. (2006). Numerous and rapidnonstochastic modifications of gene products in newly synthesizedBrassica napus allotetraploids. Genetics 173: 1101–1113.
Anders, S., and Huber, W. (2010). Differential expression analysis forsequence count data. Genome Biol. 11: R106.
Bekaert, M., Edger, P.P., Pires, J.C., and Conant, G.C. (2011). Two-phase resolution of polyploidy in the Arabidopsis metabolic networkgives rise to relative and absolute dosage constraints. Plant Cell 23:1719–1728.
Birchler, J.A., and Veitia, R.A. (2010). The gene balance hypothesis:Implications for gene regulation, quantitative traits and evolution.New Phytol. 186: 54–62.
148 The Plant Cell

Birchler, J.A., Yao, H., and Chudalayandi, S. (2007). Biologicalconsequences of dosage dependent gene regulatory systems.Biochim. Biophys. Acta 1769: 422–428.
Blanc, G., and Wolfe, K.H. (2004a). Widespread paleopolyploidy inmodel plant species inferred from age distributions of duplicategenes. Plant Cell 16: 1667–1678.
Blanc, G., and Wolfe, K.H. (2004b). Functional divergence ofduplicated genes formed by polyploidy during Arabidopsis evolution.Plant Cell 16: 1679–1691.
Bowers, J.E., Chapman, B.A., Rong, J.K., and Paterson, A.H.(2003). Unravelling angiosperm genome evolution by phylogeneticanalysis of chromosomal duplication events. Nature 422: 433–438.
Branco-Price, C., Kaiser, K.A., Jang, C.J.H., Larive, C.K., andBailey-Serres, J. (2008). Selective mRNA translation coordinatesenergetic and metabolic adjustments to cellular oxygen deprivationand reoxygenation in Arabidopsis thaliana. Plant J. 56: 743–755.
Branco-Price, C., Kawaguchi, R., Ferreira, R.B., and Bailey-Serres, J. (2005). Genome-wide analysis of transcript abundanceand translation in Arabidopsis seedlings subjected to oxygendeprivation. Ann. Bot. (Lond.) 96: 647–660.
Buggs, R.J.A., Chamala, S., Wu, W., Gao, L., May, G.D., Schnable,P.S., Soltis, D.E., Soltis, P.S., and Barbazuk, W.B. (2010).Characterization of duplicate gene evolution in the recent naturalallopolyploid Tragopogon miscellus by next-generation sequencingand Sequenom iPLEX MassARRAY genotyping. Mol. Ecol. 19(suppl. 1): 132–146.
Chang, S., Hartman, G.L., Singh, R.J., Lambert, K.N., Hobbs, H.A.,and Domier, L.L. (2013). Identification of high-quality single-nucleotide polymorphisms in Glycine latifolia using a heterologousreference genome sequence. Theor. Appl. Genet. 126: 1627–1638.
Coate, J.E., and Doyle, J.J. (2013). Genomics and transcriptomics ofphotosynthesis in polyploids. In Polyploid and Hybrid Genomics, Z.J.Chen and J.A. Birchler, eds (Hoboken, NJ: Wiley-Blackwell), pp. 153–169.
Coate, J.E., and Doyle, J.J. (2010). Quantifying whole transcriptomesize, a prerequisite for understanding transcriptome evolutionacross species: An example from a plant allopolyploid. GenomeBiol. Evol. 2: 534–546.
Coate, J.E., Luciano, A.K., Seralathan, V., Minchew, K.J., Owens,T.G., and Doyle, J.J. (2012). Anatomical, biochemical, and photosyntheticresponses to recent allopolyploidy in Glycine dolichocarpa (Fabaceae).Am. J. Bot. 99: 55–67.
Coate, J.E., Powell, A.F., Owens, T.G., and Doyle, J.J. (2013).Transgressive physiological and transcriptomic responses to lightstress in allopolyploid Glycine dolichocarpa (Leguminosae). Heredity(Edinb) 110: 160–170.
Coate, J.E., Schlueter, J.A., Whaley, A.M., and Doyle, J.J. (2011).Comparative evolution of photosynthetic genes in response to polyploidand nonpolyploid duplication. Plant Physiol. 155: 2081–2095.
Conant, G.C., and Wolfe, K.H. (2007). Increased glycolytic flux as anoutcome of whole-genome duplication in yeast. Mol. Syst. Biol. 3: 129.
Doyle, J.J., Doyle, J.L., Rauscher, J.T., and Brown, A.H.D. (2004).Evolution of the perennial soybean polyploid complex (Glycinesubgenus Glycine): A study of contrasts. Biol. J. Linn. Soc. Lond.82: 583–597.
Doyle, J.J., and Egan, A.N. (2010). Dating the origins of polyploidyevents. New Phytol. 186: 73–85.
Du, J., Tian, Z., Sui, Y., Zhao, M., Song, Q., Cannon, S.B., Cregan,P., and Ma, J. (2012). Pericentromeric effects shape the patterns ofdivergence, retention, and expression of duplicated genes in thepaleopolyploid soybean. Plant Cell 24: 21–32.
Du, Z., Zhou, X., Ling, Y., Zhang, Z., and Su, Z. (2010). agriGO: A GOanalysis toolkit for the agricultural community. Nucleic Acids Res.38: W64–W70.
Fawcett, J.A., Maere, S., and Van de Peer, Y. (2009). Plants withdouble genomes might have had a better chance to survive theCretaceous-Tertiary extinction event. Proc. Natl. Acad. Sci. USA106: 5737–5742.
Flagel, L., Udall, J., Nettleton, D., and Wendel, J. (2008). Duplicategene expression in allopolyploid Gossypium reveals two temporallydistinct phases of expression evolution. BMC Biol. 6: 16.
Flagel, L.E., Chen, L., Chaudhary, B., and Wendel, J.F. (2009).Coordinated and fine-scale control of homoeologous gene expression inallotetraploid cotton. J. Hered. 100: 487–490.
Freeling, M. (2009). Bias in plant gene content following differentsorts of duplication: Tandem, whole-genome, segmental, or bytransposition. Annu. Rev. Plant Biol. 60: 433–453.
Freeling, M., and Thomas, B.C. (2006). Gene-balanced duplications,like tetraploidy, provide predictable drive to increase morphologicalcomplexity. Genome Res. 16: 805–814.
Freeling, M., Woodhouse, M.R., Subramaniam, S., Turco, G., Lisch,D., and Schnable, J.C. (2012). Fractionation mutagenesis andsimilar consequences of mechanisms removing dispensable orless-expressed DNA in plants. Curr. Opin. Plant Biol. 15: 131–139.
Grover, C.E., Gallagher, J.P., Szadkowski, E.P., Yoo, M.J., Flagel,L.E., and Wendel, J.F. (2012). Homoeolog expression bias andexpression level dominance in allopolyploids. New Phytol. 196:966–971.
Guo, M., Davis, D., and Birchler, J.A. (1996). Dosage effects on geneexpression in a maize ploidy series. Genetics 142: 1349–1355.
Hegarty, M.J., Barker, G.L., Brennan, A.C., Edwards, K.J., Abbott,R.J., and Hiscock, S.J. (2008). Changes to gene expressionassociated with hybrid speciation in plants: Further insights fromtranscriptomic studies in Senecio. Philos. Trans. R. Soc. Lond. BBiol. Sci. 363: 3055–3069.
Hsieh, A.C., et al. (2012). The translational landscape of mTOR signallingsteers cancer initiation and metastasis. Nature 485: 55–61.
Hu, G., Houston, N.L., Pathak, D., Schmidt, L., Thelen, J.J., andWendel, J.F. (2011). Genomically biased accumulation of seedstorage proteins in allopolyploid cotton. Genetics 189: 1103–1115.
Hu, G., Koh, J., Yoo, M.J., Grupp, K., Chen, S., and Wendel, J.F.(2013). Proteomic profiling of developing cotton fibers from wild anddomesticated Gossypium barbadense. New Phytol. 200: 570–582.
Hudson, C.M., Puckett, E.E., Bekaert, M., Pires, J.C., andConant, G.C. (2011). Selection for higher gene copy number afterdifferent types of plant gene duplications. Genome Biol. Evol. 3:1369–1380.
Ilut, D.C., Coate, J.E., Luciano, A.K., Owens, T.G., May, G.D.,Farmer, A.D., and Doyle, J.J. (2012). A comparative transcriptomicstudy of an allotetraploid and its diploid progenitors illustrates theunique advantages and challenges of RNA-seq in plant species.Am. J. Bot. 99: 383–396.
Innes, R.W., et al. (2008). Differential accumulation of retroelementsand diversification of NB-LRR disease resistance genes induplicated regions following polyploidy in the ancestor of soybean.Plant Physiol. 148: 1740–1759.
Ishihama, Y., Schmidt, T., Rappsilber, J., Mann, M., Hartl, F.U.,Kerner, M.J., and Frishman, D. (2008). Protein abundance profilingof the Escherichia coli cytosol. BMC Genomics 9: 102.
Jiang, W., Liu, Y., Xia, E., and Gao, L. (2013). Prevalent role ofgene features in determining evolutionary fates of whole-genomeduplication duplicated genes in flowering plants. Plant Physiol. 161:1844–1861.
Jiao, Y., et al. (2011). Ancestral polyploidy in seed plants andangiosperms. Nature 473: 97–100.
Jiao, Y., et al. (2012). A genome triplication associated with earlydiversification of the core eudicots. Genome Biol. 13: R3.
Translatome of an Allopolyploid 149

Jiao, Y., and Meyerowitz, E.M. (2010). Cell-type specific analysisof translating RNAs in developing flowers reveals new levels ofcontrol. Mol. Syst. Biol. 6: 419.
Joshi, A., Van de Peer, Y., and Michoel, T. (2011). Structural andfunctional organization of RNA regulons in the post-transcriptionalregulatory network of yeast. Nucleic Acids Res. 39: 9108–9117.
Juntawong, P., and Bailey-Serres, J. (2012). Dynamic light regulation oftranslation status in Arabidopsis thaliana. Front. Plant Sci. 3: 66.
Kawaguchi, R., and Bailey-Serres, J. (2002). Regulation oftranslational initiation in plants. Curr. Opin. Plant Biol. 5: 460–465.
Kawaguchi, R., Girke, T., Bray, E.A., and Bailey-Serres, J. (2004).Differential mRNA translation contributes to gene regulation undernon-stress and dehydration stress conditions in Arabidopsisthaliana. Plant J. 38: 823–839.
Keene, J.D. (2007). RNA regulons: Coordination of post-transcriptionalevents. Nat. Rev. Genet. 8: 533–543.
Khan, Z., Bloom, J.S., Amini, S., Singh, M., Perlman, D.H., Caudy,A.A., and Kruglyak, L. (2012). Quantitative measurement of allele-specific protein expression in a diploid yeast hybrid by LC-MS. Mol.Syst. Biol. 8: 602.
Koh, J., Chen, S., Zhu, N., Yu, F., Soltis, P.S., and Soltis, D.E.(2012). Comparative proteomics of the recently and recurrentlyformed natural allopolyploid Tragapogon mirus (Asteraceae) and itsparents. New Phytol. 196: 292–305.
Langmead, B., Trapnell, C., Pop, M., and Salzberg, S.L. (2009).Ultrafast and memory-efficient alignment of short DNA sequencesto the human genome. Genome Biol. 10: R25.
Levin, D.A. (1983). Poly ploidy and novelty in flowering plants. Am.Nat. 122: 1–25.
Lin, J.Y., Stupar, R.M., Hans, C., Hyten, D.L., and Jackson, S.A.(2010). Structural and functional divergence of a 1-Mb duplicated regionin the soybean (Glycine max) genome and comparison to an orthologousregion from Phaseolus vulgaris. Plant Cell 22: 2545–2561.
Lynch, M., and Conery, J.S. (2000). The evolutionary fate andconsequences of duplicate genes. Science 290: 1151–1155.
Lynch, M., and Conery, J.S. (2003). The evolutionary demography ofduplicate genes. J. Struct. Funct. Genomics 3: 35–44.
Maere, S., De Bodt, S., Raes, J., Casneuf, T., Van Montagu, M., Kuiper,M., and Van de Peer, Y. (2005). Modeling gene and genomeduplications in eukaryotes. Proc. Natl. Acad. Sci. USA 102: 5454–5459.
Marguerat, S., Schmidt, A., Codlin, S., Chen, W., Aebersold, R., andBähler, J. (2012). Quantitative analysis of fission yeast transcriptomesand proteomes in proliferating and quiescent cells. Cell 151: 671–683.
Mustroph, A., and Bailey-Serres, J. (2010). The Arabidopsistranslatome cell-specific mRNA atlas: Mining suberin and cutin lipidmonomer biosynthesis genes as an example for data application.Plant Signal. Behav. 5: 320–324.
Mustroph, A., Zanetti, M.E., Jang, C.J.H., Holtan, H.E., Repetti,P.P., Galbraith, D.W., Girke, T., and Bailey-Serres, J. (2009).Profiling translatomes of discrete cell populations resolves alteredcellular priorities during hypoxia in Arabidopsis. Proc. Natl. Acad.Sci. USA 106: 18843–18848.
Ni, Z., Kim, E.D., Ha, M., Lackey, E., Liu, J., Zhang, Y., Sun, Q., andChen, Z.J. (2009). Altered circadian rhythms regulate growth vigourin hybrids and allopolyploids. Nature 457: 327–331.
Papp, B., Pál, C., and Hurst, L.D. (2003). Dosage sensitivity and theevolution of gene families in yeast. Nature 424: 194–197.
Park, S.H., Chung, P.J., Juntawong, P., Bailey-Serres, J., Kim,Y.S., Jung, H., Bang, S.W., Kim, Y.K., Do Choi, Y., and Kim, J.K.(2012). Posttranscriptional control of photosynthetic mRNA decay
under stress conditions requires 39 and 59 untranslated regions andcorrelates with differential polysome association in rice. PlantPhysiol. 159: 1111–1124.
Paterson, A.H., Chapman, B.A., Kissinger, J.C., Bowers, J.E.,Feltus, F.A., and Estill, J.C. (2006). Many gene and domain familieshave convergent fates following independent whole-genomeduplication events in Arabidopsis, Oryza, Saccharomyces andTetraodon. Trends Genet. 22: 597–602.
Pires, J.C., Zhao, J., Schranz, M.E., Leon, E.J., Quijada, P.A.,Lukens, L.N., and Osborn, T.C. (2004). Flowering time divergenceand genomic rearrangements in resynthesized Brassica polyploids(Brassicaceae). Biol. J. Linn. Soc. Lond. 82: 675–688.
Reynoso, M.A., Blanco, F.A., Bailey-Serres, J., Crespi, M., andZanetti, M.E. (2012). Selective recruitment of mRNAs and miRNAsto polyribosomes in response to rhizobia infection in Medicagotruncatula. Plant J. 73: 289–301.
Schlueter, J.A., Dixon, P., Granger, C., Grant, D., Clark, L., Doyle, J.J.,and Shoemaker, R.C. (2004). Mining EST databases to resolveevolutionary events in major crop species. Genome 47: 868–876.
Schmutz, J., et al. (2010). Genome sequence of the palaeopolyploidsoybean. Nature 463: 178–183.
Schnable, J.C., Springer, N.M., and Freeling, M. (2011). Differentiation ofthe maize subgenomes by genome dominance and both ancient andongoing gene loss. Proc. Natl. Acad. Sci. USA 108: 4069–4074.
Schwanhäusser, B., Busse, D., Li, N., Dittmar, G., Schuchhardt, J.,Wolf, J., Chen, W., and Selbach, M. (2011). Global quantification ofmammalian gene expression control. Nature 473: 337–342.
Seoighe, C., and Gehring, C. (2004). Genome duplication led tohighly selective expansion of the Arabidopsis thaliana proteome.Trends Genet. 20: 461–464.
Shoemaker, R.C., Schlueter, J., and Doyle, J.J. (2006).Paleopolyploidy and gene duplication in soybean and other legumes.Curr. Opin. Plant Biol. 9: 104–109.
Sonenberg, N., and Hinnebusch, A.G. (2009). Regulation of translationinitiation in eukaryotes: Mechanisms and biological targets. Cell 136:731–745.
Tang, H., Wang, X., Bowers, J.E., Ming, R., Alam, M., andPaterson, A.H. (2008). Unraveling ancient hexaploidy throughmultiply-aligned angiosperm gene maps. Genome Res. 18: 1944–1954.
Thomas, B.C., Pedersen, B., and Freeling, M. (2006). Followingtetraploidy in an Arabidopsis ancestor, genes were removedpreferentially from one homeolog leaving clusters enriched in dose-sensitive genes. Genome Res. 16: 934–946.
Vogel, C., and Marcotte, E.M. (2012). Insights into the regulation ofprotein abundance from proteomic and transcriptomic analyses.Nat. Rev. Genet. 13: 227–232.
Wang, J., Tian, L., Lee, H.S., Wei, N.E., Jiang, H., Watson, B.,Madlung, A., Osborn, T.C., Doerge, R.W., Comai, L., and Chen,Z.J. (2006). Genomewide nonadditive gene regulation in Arabidopsisallotetraploids. Genetics 172: 507–517.
Warner, D.A., and Edwards, G.E. (1993). Effects of polyploidy onphotosynthesis. Photosynth. Res. 35: 135–147.
Wood, T.E., Takebayashi, N., Barker, M.S., Mayrose, I., Greenspoon,P.B., and Rieseberg, L.H. (2009). The frequency of polyploidspeciation in vascular plants. Proc. Natl. Acad. Sci. USA 106:13875–13879.
Yao, H., Kato, A., Mooney, B., and Birchler, J.A. (2011). Phenotypicand gene expression analyses of a ploidy series of maize inbredOh43. Plant Mol. Biol. 75: 237–251.
150 The Plant Cell

DOI 10.1105/tpc.113.119966; originally published online January 31, 2014; 2014;26;136-150Plant Cell
Jeremy E. Coate, Haim Bar and Jeff J. Doyle)Glycine dolichocarpaExtensive Translational Regulation of Gene Expression in an Allopolyploid (
This information is current as of May 7, 2018
Supplemental Data /content/suppl/2014/01/24/tpc.113.119966.DC1.html
References /content/26/1/136.full.html#ref-list-1
This article cites 80 articles, 26 of which can be accessed free at:
Permissions https://www.copyright.com/ccc/openurl.do?sid=pd_hw1532298X&issn=1532298X&WT.mc_id=pd_hw1532298X
eTOCs http://www.plantcell.org/cgi/alerts/ctmain
Sign up for eTOCs at:
CiteTrack Alerts http://www.plantcell.org/cgi/alerts/ctmain
Sign up for CiteTrack Alerts at:
Subscription Information http://www.aspb.org/publications/subscriptions.cfm
is available at:Plant Physiology and The Plant CellSubscription Information for
ADVANCING THE SCIENCE OF PLANT BIOLOGY © American Society of Plant Biologists