Extensive Pile Testing of Auger Pressure Grouted ... · acceptance of auger pressure grouted...
15
EXTENSIVE PILE TESTING OF AUGER PRESSURE GROUTED DISPLACEMENT (APGD) PILES, LOS ANGELES, CALIFORNIA Michael D. Reader, RCE, GE, Principal Engineer, Group Delta Consultants, Inc., Torrance, CA Todd W. Armstrong, RCE, Project Engineer, Group Delta Consultants, Inc., Torrance, CA INTRODUCTION The Playa Vista Development is the largest urban in- fill development in the history of the United States. Overall, it encompasses about 1100 acres in the City of Los Angeles and is situated north of Los Angeles International Airport near the Pacific Ocean. The development taking place on the project consists primarily of high-density residential condominiums with 1 to 2 levels of subterranean parking. The geotechnical conditions are typified by high groundwater, soft clays, and liquefaction, in addition to environmental issues such as methane. Due to a combination of the geotechnical factors and noise restrictions, both driven and drilled piles were not feasible once the initial phase of the project was occupied. As a result, the project developer undertook a testing program that consisted of the installation and load testing of 9 piles in order to obtain City of Los Angeles acceptance of a pile installation system that met the site constraints. The testing program was divided between two separate contractors operating on sites set on opposite sides on the street (Figure 1). Contractors working in Test Areas A & B employed the “dry dip” and “wet dip” methods of auger pressure grouted displacement (APGD) pile installation, respectively. This paper summarizes the extraordinary program undertaken to install, document, test, and examine auger pressure grouted displacement piles at this site. The program ultimately resulted in City acceptance of auger pressure grouted displacement piles, a historically difficult challenge given the City’s resistance of acceptance of “new” technologies. A summary of elements included in the test program are: (1) quality control; (2) load testing; (3) long-term testing; (4) non-destructive testing; and (5) pile exhumation. GEOTECHNICAL CONDITIONS The test areas were located within excavations into compacted fill at the sites of two future buildings. The working surfaces for Test Areas A and B were at roughly El. +7 feet and El. +1.4 feet, respectively. Exploration borings encountered fill materials (referred to as Layer 1) extending from the working surface to depths generally ranging from about 2 to 5 feet. The fill at Test Area A was comprised of silty to clayey sand and sandy clay fill, while Test Area B was topped with 2 feet of poorly graded gravel fill. The native alluvial soils found below the compacted fill consisted of alternating layers of clays, silts and sands of variable density/consistency. A generalized geotechnical cross section representative of the two sites is shown in Figure 2. The cross-section shows the proposed building location, pre-excavation grade and load-testing grade. Groundwater levels were measured at approximately 3 feet and 1 foot below the working surfaces of Test Areas A and B, respectively. Each of the alluvial soil layers is discussed in the following sections. Figure 1. Playa Vista Development, circa 2002. Test Area A Test Area B
Transcript of Extensive Pile Testing of Auger Pressure Grouted ... · acceptance of auger pressure grouted...
EXTENSIVE PILE TESTING OF AUGER PRESSURE GROUTED DISPLACEMENT (APGD) PILES, LOS ANGELES, CALIFORNIA Michael D. Reader, RCE, GE, Principal Engineer, Group Delta Consultants, Inc., Torrance, CA Todd W. Armstrong, RCE, Project Engineer, Group Delta Consultants, Inc., Torrance, CA
INTRODUCTION The Playa Vista Development is the largest urban in-fill development in the history of the United States. Overall, it encompasses about 1100 acres in the City of Los Angeles and is situated north of Los Angeles International Airport near the Pacific Ocean. The development taking place on the project consists primarily of high-density residential condominiums with 1 to 2 levels of subterranean parking. The geotechnical conditions are typified by high groundwater, soft clays, and liquefaction, in addition to environmental issues such as methane. Due to a combination of the geotechnical factors and noise restrictions, both driven and drilled piles were not feasible once the initial phase of the project was occupied. As a result, the project developer undertook a testing program that consisted of the installation and load testing of 9 piles in order to obtain City of Los Angeles acceptance of a pile installation system that met the site constraints. The testing program was divided between two separate contractors operating on sites set on opposite sides on the street (Figure 1). Contractors working in Test Areas A & B employed the “dry dip” and “wet dip” methods of auger pressure grouted displacement (APGD) pile installation, respectively. This paper summarizes the extraordinary program undertaken to install, document, test, and examine auger pressure grouted displacement piles at this site. The program ultimately resulted in City acceptance of auger pressure grouted displacement piles, a historically difficult challenge given the City’s resistance of acceptance of “new” technologies. A summary of elements included in the test program are: (1) quality control; (2) load testing; (3) long-term testing; (4) non-destructive testing; and (5) pile exhumation.
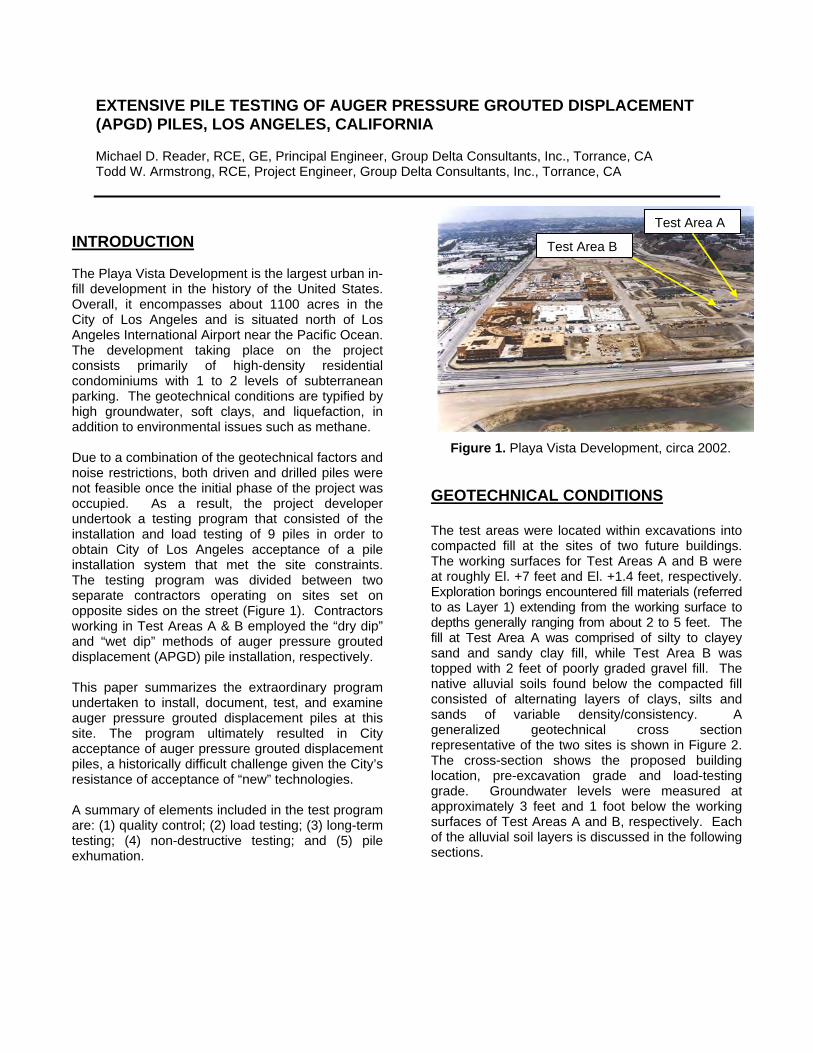
GEOTECHNICAL CONDITIONS The test areas were located within excavations into compacted fill at the sites of two future buildings. The working surfaces for Test Areas A and B were at roughly El. +7 feet and El. +1.4 feet, respectively. Exploration borings encountered fill materials (referred to as Layer 1) extending from the working surface to depths generally ranging from about 2 to 5 feet. The fill at Test Area A was comprised of silty to clayey sand and sandy clay fill, while Test Area B was topped with 2 feet of poorly graded gravel fill. The native alluvial soils found below the compacted fill consisted of alternating layers of clays, silts and sands of variable density/consistency. A generalized geotechnical cross section representative of the two sites is shown in Figure 2. The cross-section shows the proposed building location, pre-excavation grade and load-testing grade. Groundwater levels were measured at approximately 3 feet and 1 foot below the working surfaces of Test Areas A and B, respectively. Each of the alluvial soil layers is discussed in the following sections.
Figure 1. Playa Vista Development, circa 2002.
Test Area A
Test Area B
Native Clays and Silts (CL-CH-ML) Layer 2 is comprised of firm to stiff, fat to lean clays and low plastic silts, extending from below the fill to about El. -3 feet. The natural moisture content ranges from 36 to 48 percent for the clay. The liquid limits ranging between 43 and 58 and plastic limits between 22 and 32. The CPT tip resistance ranges between 7 and 57 tsf. The undrained shear strength ranged 0.25 to 2.5 tsf. Highly Compressible Clays (CH-MH) Interbedded with Silty Sand (SM) Layer 3 extends from El. -3 to El. -38 feet. These soils consist of soft to firm, high plasticity clays and silts having liquid limits ranging between 51 and 85 and plastic limits between 22 and 43. Several interbeds of silty sand, 1 to 3 feet thick, were identified within Layer 3. The natural moisture
contents are between 34 and 79 percent for the
clays and silts, and between 24 to 27 percent for the silty sands. The CPT tip resistance ranges between 6 and 12 tsf for the clays and silts, and between 30 and 255 tsf for the silty sands. The minimum undrained shear strength for design was selected from CPT data as 400 psf. The undrained shear strength of the clays and silts ranged 0.1 to 1.0 tsf. The silty sand beds generally comprise 10% to 45% fines. Medium Dense Sand (SP-SM) Layer 4 is comprised of medium dense sand and silty sand ranging from El. –38 to El. –41 feet. The cone tip resistance in this layer ranges from 40 to 190 tsf. The SPT blow counts recorded in this layer ranged 11 to 54 and this layer comprises approximately 10% fines.
Figure 2. Typical geotechnical cross section for Test Areas A and B.
V. DENSE SP/GP (LAYER 5)
TEST PILE (TYP.)
Dense Sands and Gravels (SP-GP) Layer 5 is comprised of very dense sands and gravels with some cobbles, extending below El. –41 feet. The SPT blow counts in this layer are generally greater than 50. The cone tip resistance in this layer generally ranges well above 250 tsf. Cone penetration testing in this layer is made difficult due to a concentration of gravel and cobbles often found at the top of this layer, resulting in a cone tip resistance often exceeding 700 to 1000 tsf. CPT refusal often occurred in such conditions, but those soundings that managed to penetrate this “armored” upper surface of Layer 5 indicated cone tip resistance dropping to 250 to 400 tsf. INSTALLATION OF AUGER PRESSURE GROUTED DISPLACEMENT (APGD) PILES APGD pile construction involves advancing a displacement auger into the ground using a track-mounted, fixed-mast, hydraulic drilling machine. Two different drilling machines were used for each site at the Playa Vista Development: a Delmag RH 18 (D) at Test Area A and a Bauer BG25 at Test Area B, capable of delivering up to 132,800 and 182,000 ft-lbs of torque, respectively. Prior to installing test piles, four reaction piles were installed around each test pile location. The piles are comprised of 12-sack cement grout with steel reinforcing. Grout was pumped through a port near the bottom of the displacement auger as it was withdrawn from the ground. The displacing element on the casing provided protection against caving soil while the casing was withdrawn. The pressure of the grout also maintained the stability of the shaft. The test piles at the two locations, Test Areas A and B, can be distinguished by a few characteristics such as differences in configuration of steel reinforcing, method of steel reinforcing installation, number of access tubes for non-destructive testing, make/model of drilling equipment used and the configuration of the drilling tool (auger, displacing element and stem). The configuration of steel reinforcing varied among the test piles from 15 feet long to full-length cages. Steel reinforcing cages were either installed before or after withdrawal of the drill tool, known as “dry dip” and “wet dip” methods, respectively.
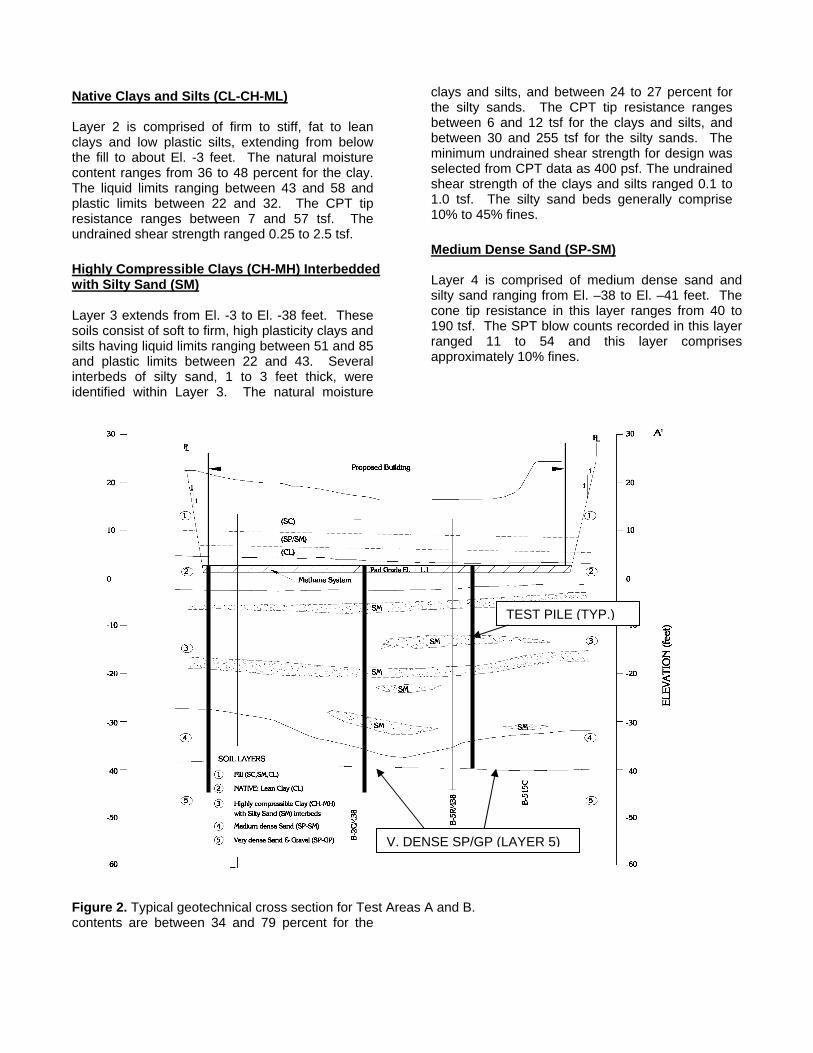
Test Area A, “Dry Dipped” Method Four piles were installed in this area from about Elevation +7.0 feet. The pile tips extended to a depth of about 50 feet, which penetrated 1 foot into the dense sand and gravel layer that underlies the site at an Elevation of about –42.0 feet. During the first stage of installation the displacement auger was drilled into the ground to the desired depth. The drilling process produces minimal cuttings at the surface because the reverse flight augers above the displacing element push the soil cuttings laterally into the wall of the shaft. The resulting shaft was smooth-walled and about 16 inches in diameter (equivalent to the outside diameter of the displacing element). Figure 3 illustrates APGD pile installation by Dry Dip method. The second stage of pile installation involved placing reinforcing steel. After the target elevation was reached, the top of the displacement auger was opened and the reinforcing steel was inserted inside with access tubes attached for non-destructive testing. Two piles in this area were designed for axial tension testing and the other two for axial compression, so different configurations of reinforcing steel and access tubes were necessary. Spacers kept the reinforcement positioned within the shaft. In the third stage of installation, the grout pump was connected to the top of the casing via a flexible hose. The casing was primed with 12-sack cement grout and then pumped through the tip of the displacement auger into the annulus area at the
Drill head detached from
Casing
Inserting Rebar Cage with Inspection Tubes
Figure 3. Installation of APGD pile by Dry Dip Method.
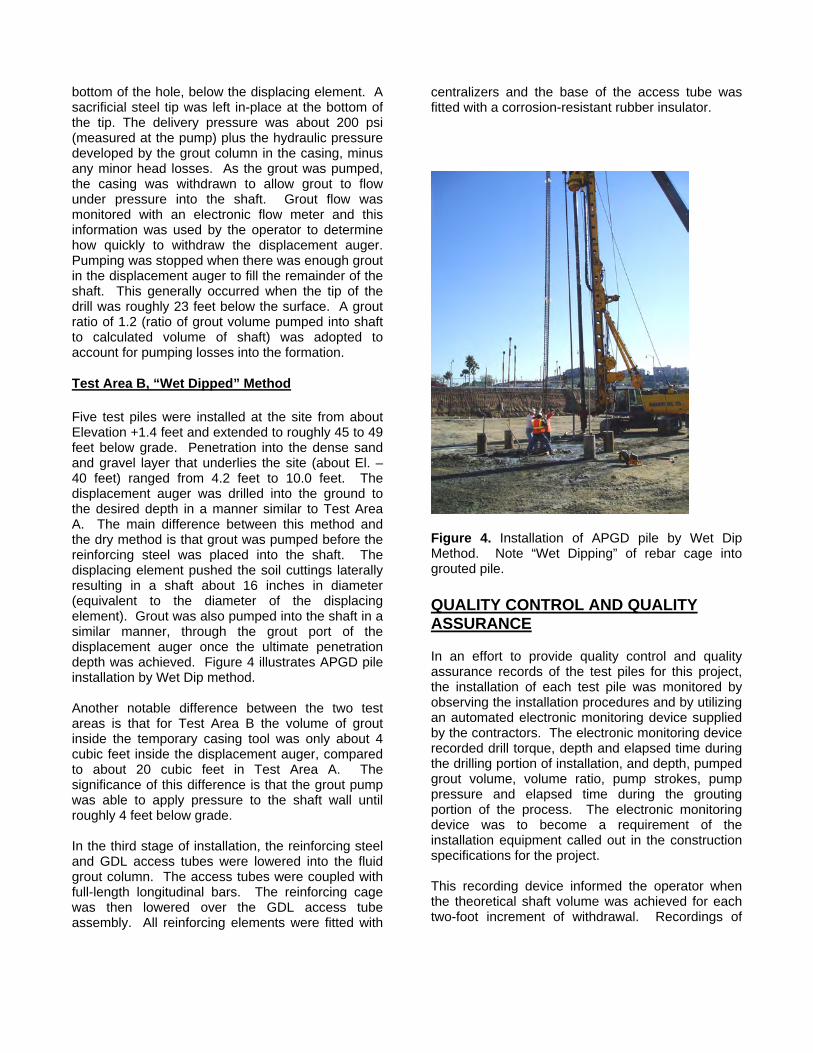
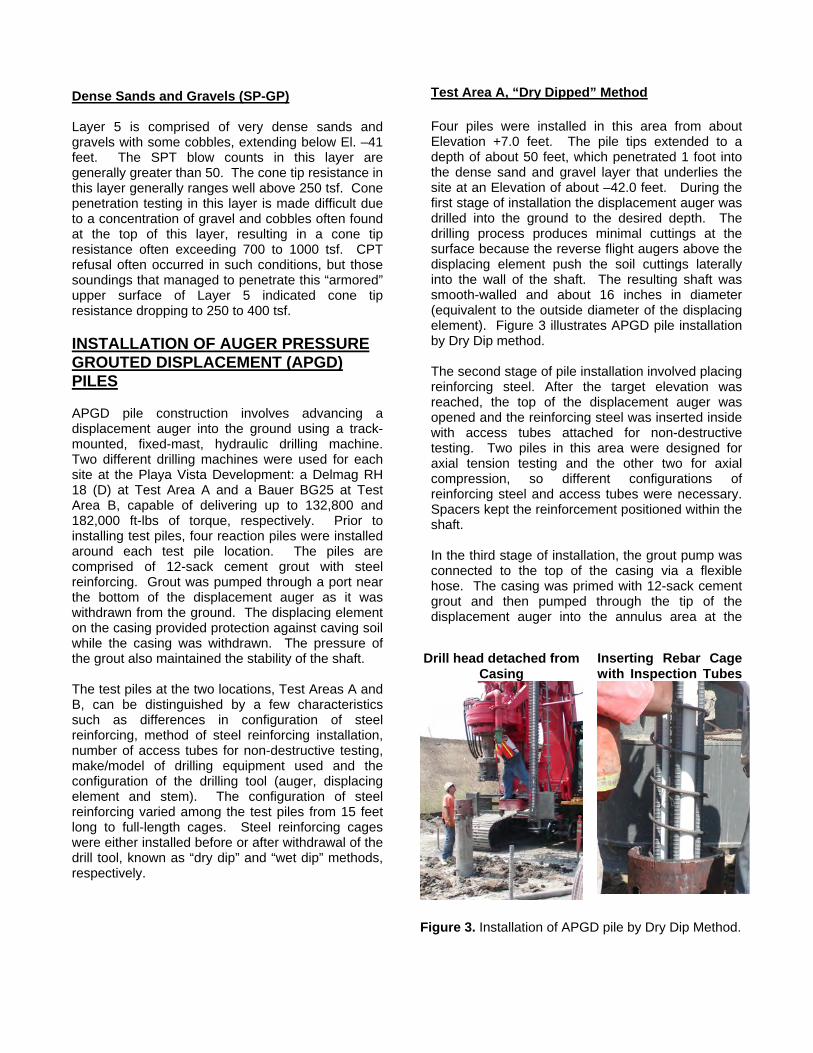
bottom of the hole, below the displacing element. A sacrificial steel tip was left in-place at the bottom of the tip. The delivery pressure was about 200 psi (measured at the pump) plus the hydraulic pressure developed by the grout column in the casing, minus any minor head losses. As the grout was pumped, the casing was withdrawn to allow grout to flow under pressure into the shaft. Grout flow was monitored with an electronic flow meter and this information was used by the operator to determine how quickly to withdraw the displacement auger. Pumping was stopped when there was enough grout in the displacement auger to fill the remainder of the shaft. This generally occurred when the tip of the drill was roughly 23 feet below the surface. A grout ratio of 1.2 (ratio of grout volume pumped into shaft to calculated volume of shaft) was adopted to account for pumping losses into the formation. Test Area B, “Wet Dipped” Method Five test piles were installed at the site from about Elevation +1.4 feet and extended to roughly 45 to 49 feet below grade. Penetration into the dense sand and gravel layer that underlies the site (about El. –40 feet) ranged from 4.2 feet to 10.0 feet. The displacement auger was drilled into the ground to the desired depth in a manner similar to Test Area A. The main difference between this method and the dry method is that grout was pumped before the reinforcing steel was placed into the shaft. The displacing element pushed the soil cuttings laterally resulting in a shaft about 16 inches in diameter (equivalent to the diameter of the displacing element). Grout was also pumped into the shaft in a similar manner, through the grout port of the displacement auger once the ultimate penetration depth was achieved. Figure 4 illustrates APGD pile installation by Wet Dip method. Another notable difference between the two test areas is that for Test Area B the volume of grout inside the temporary casing tool was only about 4 cubic feet inside the displacement auger, compared to about 20 cubic feet in Test Area A. The significance of this difference is that the grout pump was able to apply pressure to the shaft wall until roughly 4 feet below grade. In the third stage of installation, the reinforcing steel and GDL access tubes were lowered into the fluid grout column. The access tubes were coupled with full-length longitudinal bars. The reinforcing cage was then lowered over the GDL access tube assembly. All reinforcing elements were fitted with
centralizers and the base of the access tube was fitted with a corrosion-resistant rubber insulator.
QUALITY CONTROL AND QUALITY ASSURANCE In an effort to provide quality control and quality assurance records of the test piles for this project, the installation of each test pile was monitored by observing the installation procedures and by utilizing an automated electronic monitoring device supplied by the contractors. The electronic monitoring device recorded drill torque, depth and elapsed time during the drilling portion of installation, and depth, pumped grout volume, volume ratio, pump strokes, pump pressure and elapsed time during the grouting portion of the process. The electronic monitoring device was to become a requirement of the installation equipment called out in the construction specifications for the project. This recording device informed the operator when the theoretical shaft volume was achieved for each two-foot increment of withdrawal. Recordings of
Figure 4. Installation of APGD pile by Wet Dip Method. Note “Wet Dipping” of rebar cage into grouted pile.
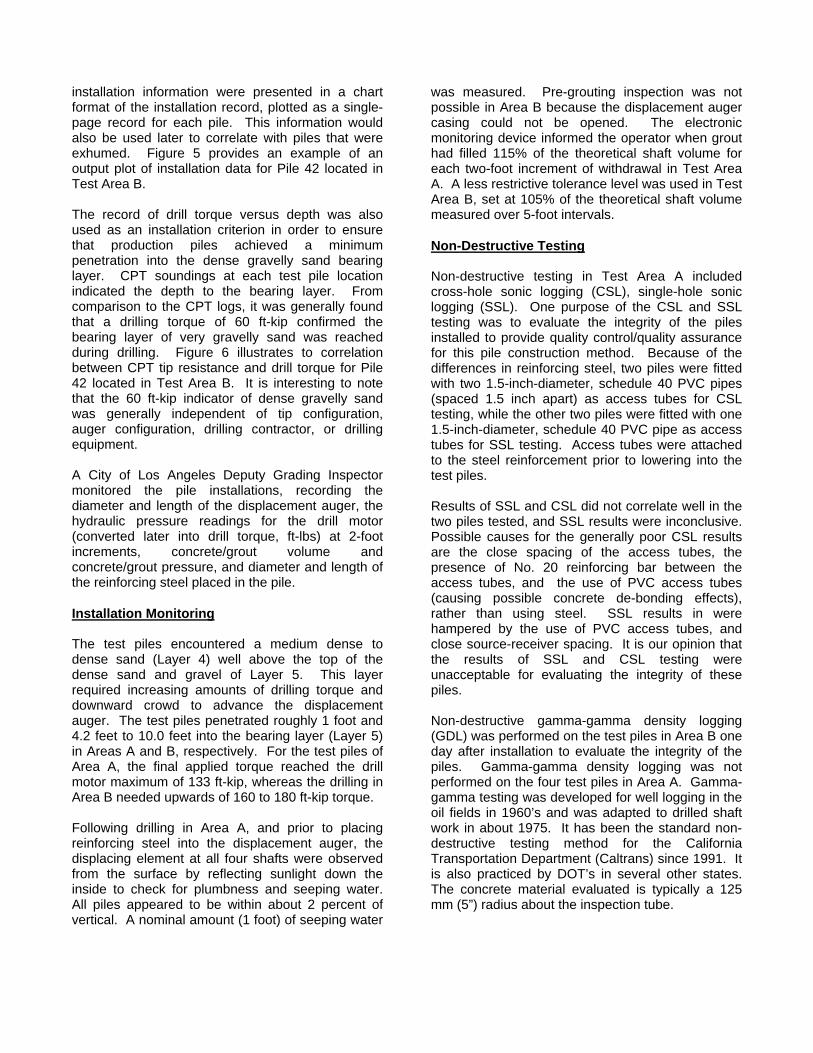
installation information were presented in a chart format of the installation record, plotted as a single-page record for each pile. This information would also be used later to correlate with piles that were exhumed. Figure 5 provides an example of an output plot of installation data for Pile 42 located in Test Area B. The record of drill torque versus depth was also used as an installation criterion in order to ensure that production piles achieved a minimum penetration into the dense gravelly sand bearing layer. CPT soundings at each test pile location indicated the depth to the bearing layer. From comparison to the CPT logs, it was generally found that a drilling torque of 60 ft-kip confirmed the bearing layer of very gravelly sand was reached during drilling. Figure 6 illustrates to correlation between CPT tip resistance and drill torque for Pile 42 located in Test Area B. It is interesting to note that the 60 ft-kip indicator of dense gravelly sand was generally independent of tip configuration, auger configuration, drilling contractor, or drilling equipment. A City of Los Angeles Deputy Grading Inspector monitored the pile installations, recording the diameter and length of the displacement auger, the hydraulic pressure readings for the drill motor (converted later into drill torque, ft-lbs) at 2-foot increments, concrete/grout volume and concrete/grout pressure, and diameter and length of the reinforcing steel placed in the pile. Installation Monitoring The test piles encountered a medium dense to dense sand (Layer 4) well above the top of the dense sand and gravel of Layer 5. This layer required increasing amounts of drilling torque and downward crowd to advance the displacement auger. The test piles penetrated roughly 1 foot and 4.2 feet to 10.0 feet into the bearing layer (Layer 5) in Areas A and B, respectively. For the test piles of Area A, the final applied torque reached the drill motor maximum of 133 ft-kip, whereas the drilling in Area B needed upwards of 160 to 180 ft-kip torque. Following drilling in Area A, and prior to placing reinforcing steel into the displacement auger, the displacing element at all four shafts were observed from the surface by reflecting sunlight down the inside to check for plumbness and seeping water. All piles appeared to be within about 2 percent of vertical. A nominal amount (1 foot) of seeping water
was measured. Pre-grouting inspection was not possible in Area B because the displacement auger casing could not be opened. The electronic monitoring device informed the operator when grout had filled 115% of the theoretical shaft volume for each two-foot increment of withdrawal in Test Area A. A less restrictive tolerance level was used in Test Area B, set at 105% of the theoretical shaft volume measured over 5-foot intervals. Non-Destructive Testing Non-destructive testing in Test Area A included cross-hole sonic logging (CSL), single-hole sonic logging (SSL). One purpose of the CSL and SSL testing was to evaluate the integrity of the piles installed to provide quality control/quality assurance for this pile construction method. Because of the differences in reinforcing steel, two piles were fitted with two 1.5-inch-diameter, schedule 40 PVC pipes (spaced 1.5 inch apart) as access tubes for CSL testing, while the other two piles were fitted with one 1.5-inch-diameter, schedule 40 PVC pipe as access tubes for SSL testing. Access tubes were attached to the steel reinforcement prior to lowering into the test piles. Results of SSL and CSL did not correlate well in the two piles tested, and SSL results were inconclusive. Possible causes for the generally poor CSL results are the close spacing of the access tubes, the presence of No. 20 reinforcing bar between the access tubes, and the use of PVC access tubes (causing possible concrete de-bonding effects), rather than using steel. SSL results in were hampered by the use of PVC access tubes, and close source-receiver spacing. It is our opinion that the results of SSL and CSL testing were unacceptable for evaluating the integrity of these piles. Non-destructive gamma-gamma density logging (GDL) was performed on the test piles in Area B one day after installation to evaluate the integrity of the piles. Gamma-gamma density logging was not performed on the four test piles in Area A. Gamma-gamma testing was developed for well logging in the oil fields in 1960’s and was adapted to drilled shaft work in about 1975. It has been the standard non-destructive testing method for the California Transportation Department (Caltrans) since 1991. It is also practiced by DOT’s in several other states. The concrete material evaluated is typically a 125 mm (5”) radius about the inspection tube.
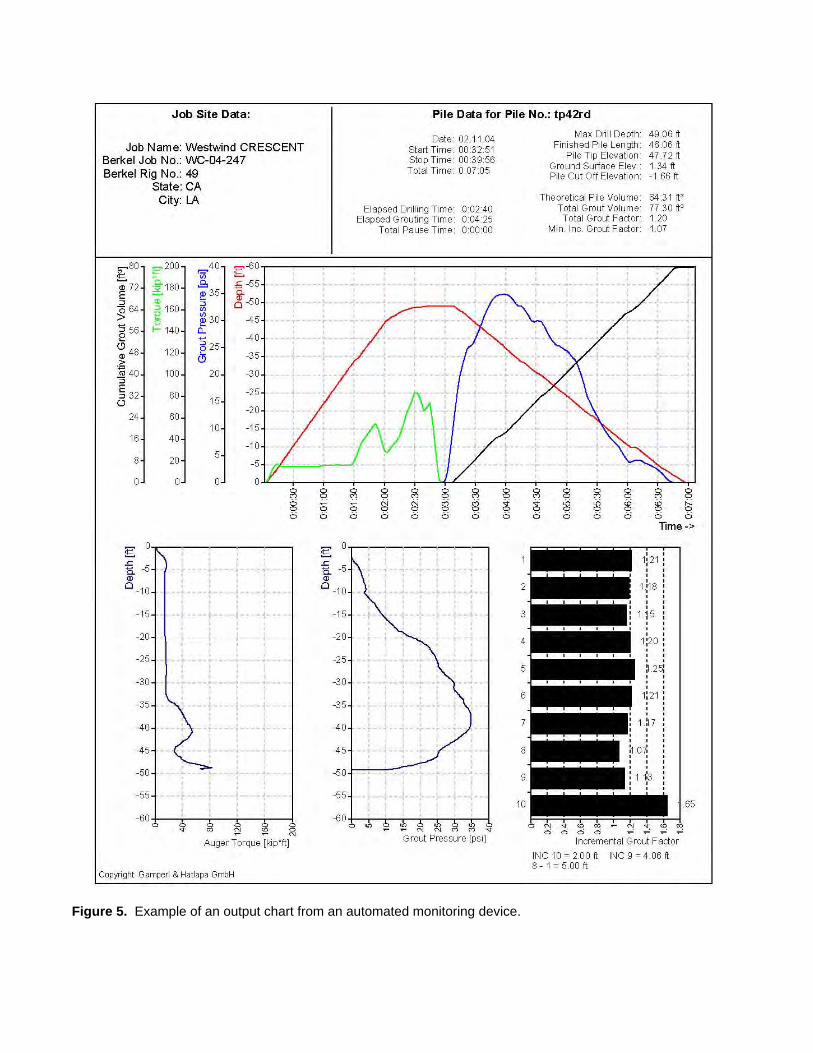
Figure 5. Example of an output chart from an automated monitoring device.
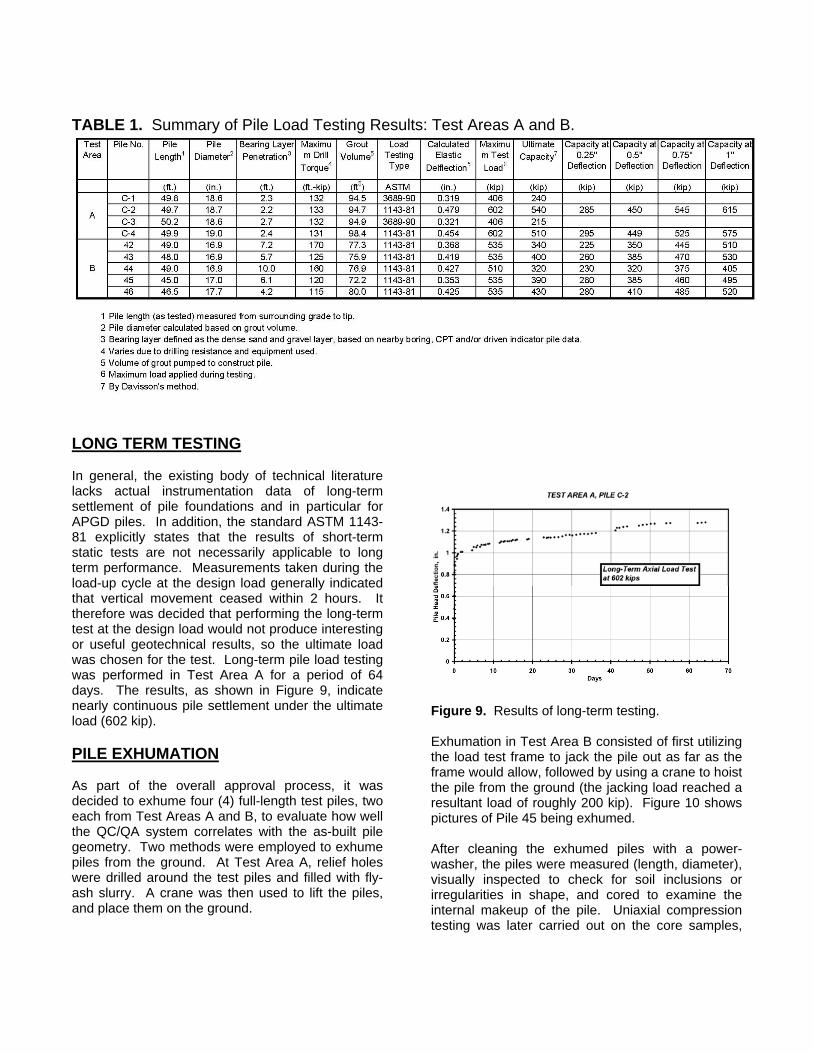
Results of GDL testing indicated some minor anomalies (e.g. above 5 feet depth in Piles TP-42, TP-43 and TP-45), however no significant defects were indicated from the anomalies. Given the 5-inch inspection radius (10-inch diameter) of GDL testing, it was concluded that no voids or soil inclusions were present within the 9-inch-diameter reinforcing cage. PILE LOAD TESTING The primary goal of the load-testing program was to establish a design capacity of the piles, which considered how potential liquefaction affects down-drag under seismic conditions. In Test Area A, the four test piles were divided into two axial compression tests and two axial tension tests. The five test piles in Test Area B involved axial compression testing only. Figure 7 shows a typical axial load testing apparatus setup. Load Testing Procedures Axial load testing of the piles was performed in
general conformance with the procedure described in ASTM 1143-81, Standard Test Method for Piles Under Static Axial Compressive Load. The axial compressive load, pile head deflection (using two dial indicators), clock time and elapsed time were recorded during each test. The “Standard” load testing procedure described by ASTM 1143-81 was used for testing. Two allowable loads (180 kip and 200 kip) were held for 2 hours to demonstrate that the rate of pile movement decreases to less than 0.005 inch per hour, which is a stricter constraint on the testing procedure prescribed by ASTM. Tensile testing followed the procedures of ASTM 3689-90, Standard Test Method for Individual Piles under Static Axial Tensile Load, and reached a maximum test load of 400 kip at a maximum deflection ranging 1.16 to 1.38 inch. Load Testing Results The required design capacity for this project was 180 kip. The Davisson method was used as a conservative method to examine the load-displacement curves to evaluate capacity for the test
Figure 6. Correlation of CPT tip resistance with drill torque developed during pile installation.
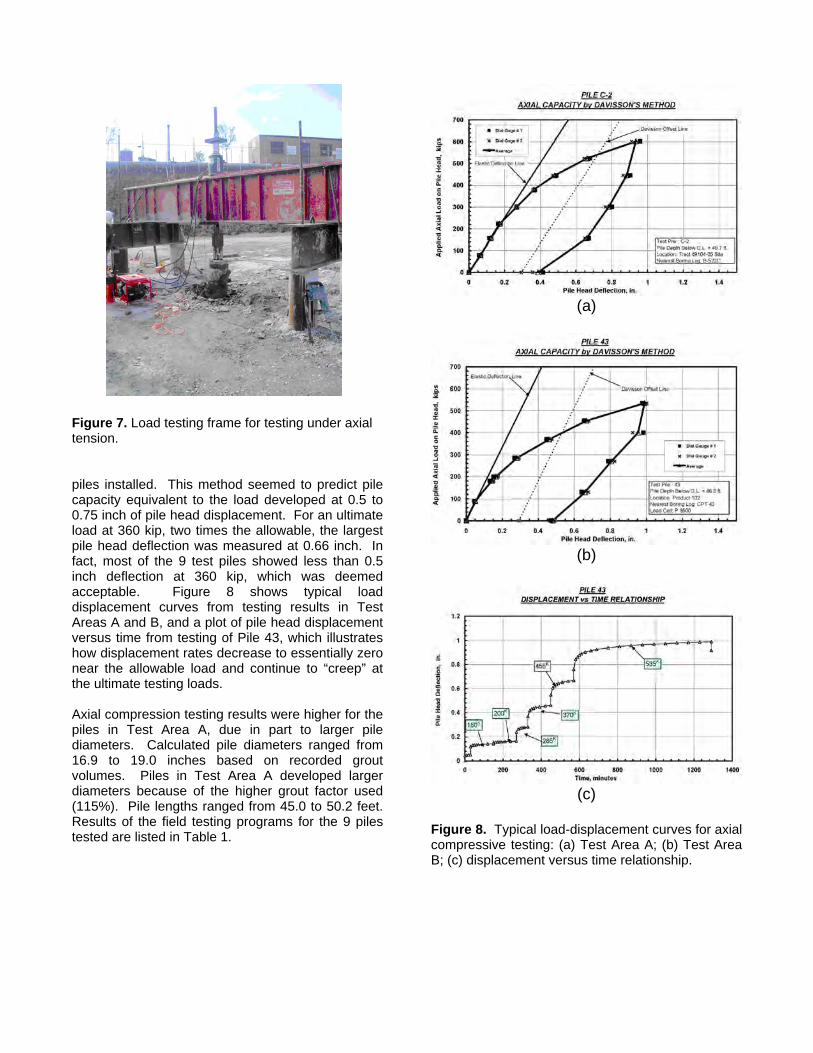
piles installed. This method seemed to predict pile capacity equivalent to the load developed at 0.5 to 0.75 inch of pile head displacement. For an ultimate load at 360 kip, two times the allowable, the largest pile head deflection was measured at 0.66 inch. In fact, most of the 9 test piles showed less than 0.5 inch deflection at 360 kip, which was deemed acceptable. Figure 8 shows typical load displacement curves from testing results in Test Areas A and B, and a plot of pile head displacement versus time from testing of Pile 43, which illustrates how displacement rates decrease to essentially zero near the allowable load and continue to “creep” at the ultimate testing loads. Axial compression testing results were higher for the piles in Test Area A, due in part to larger pile diameters. Calculated pile diameters ranged from 16.9 to 19.0 inches based on recorded grout volumes. Piles in Test Area A developed larger diameters because of the higher grout factor used (115%). Pile lengths ranged from 45.0 to 50.2 feet. Results of the field testing programs for the 9 piles tested are listed in Table 1.
(a)
(b)
(c) Figure 8. Typical load-displacement curves for axial compressive testing: (a) Test Area A; (b) Test Area B; (c) displacement versus time relationship.
Figure 7. Load testing frame for testing under axial tension.
LONG TERM TESTING In general, the existing body of technical literature lacks actual instrumentation data of long-term settlement of pile foundations and in particular for APGD piles. In addition, the standard ASTM 1143-81 explicitly states that the results of short-term static tests are not necessarily applicable to long term performance. Measurements taken during the load-up cycle at the design load generally indicated that vertical movement ceased within 2 hours. It therefore was decided that performing the long-term test at the design load would not produce interesting or useful geotechnical results, so the ultimate load was chosen for the test. Long-term pile load testing was performed in Test Area A for a period of 64 days. The results, as shown in Figure 9, indicate nearly continuous pile settlement under the ultimate load (602 kip). PILE EXHUMATION As part of the overall approval process, it was decided to exhume four (4) full-length test piles, two each from Test Areas A and B, to evaluate how well the QC/QA system correlates with the as-built pile geometry. Two methods were employed to exhume piles from the ground. At Test Area A, relief holes were drilled around the test piles and filled with fly-ash slurry. A crane was then used to lift the piles, and place them on the ground.
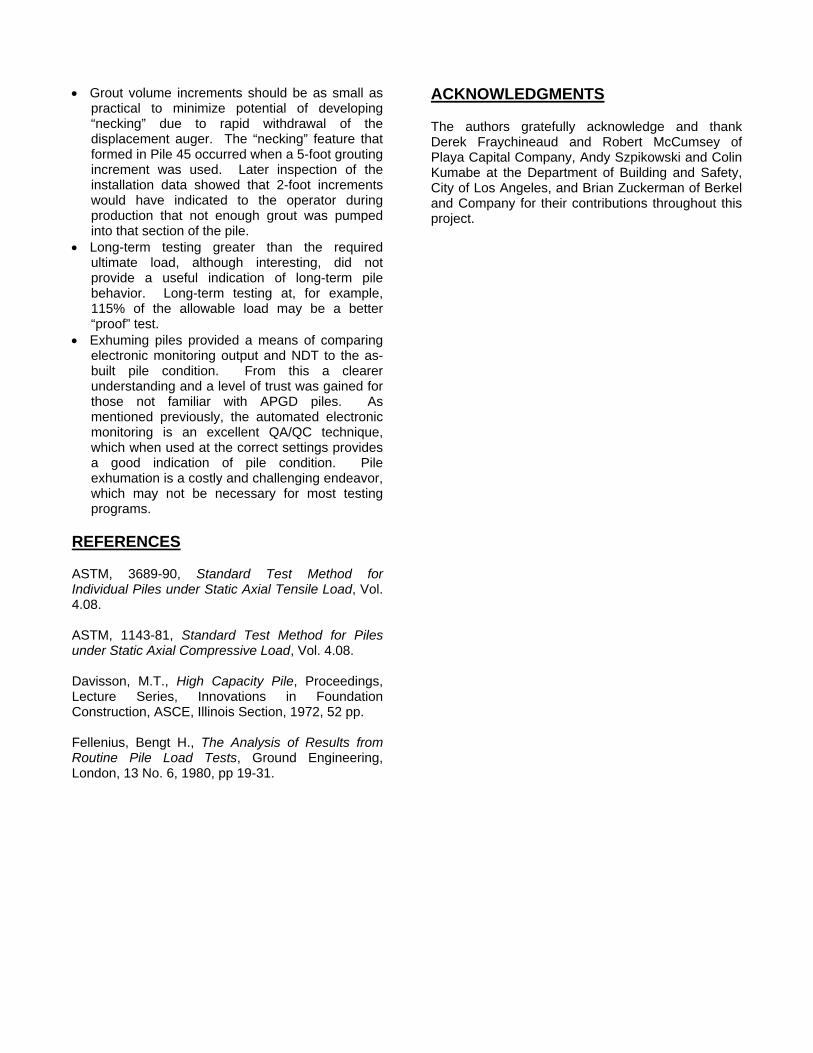
Exhumation in Test Area B consisted of first utilizing the load test frame to jack the pile out as far as the frame would allow, followed by using a crane to hoist the pile from the ground (the jacking load reached a resultant load of roughly 200 kip). Figure 10 shows pictures of Pile 45 being exhumed. After cleaning the exhumed piles with a power-washer, the piles were measured (length, diameter), visually inspected to check for soil inclusions or irregularities in shape, and cored to examine the internal makeup of the pile. Uniaxial compression testing was later carried out on the core samples,
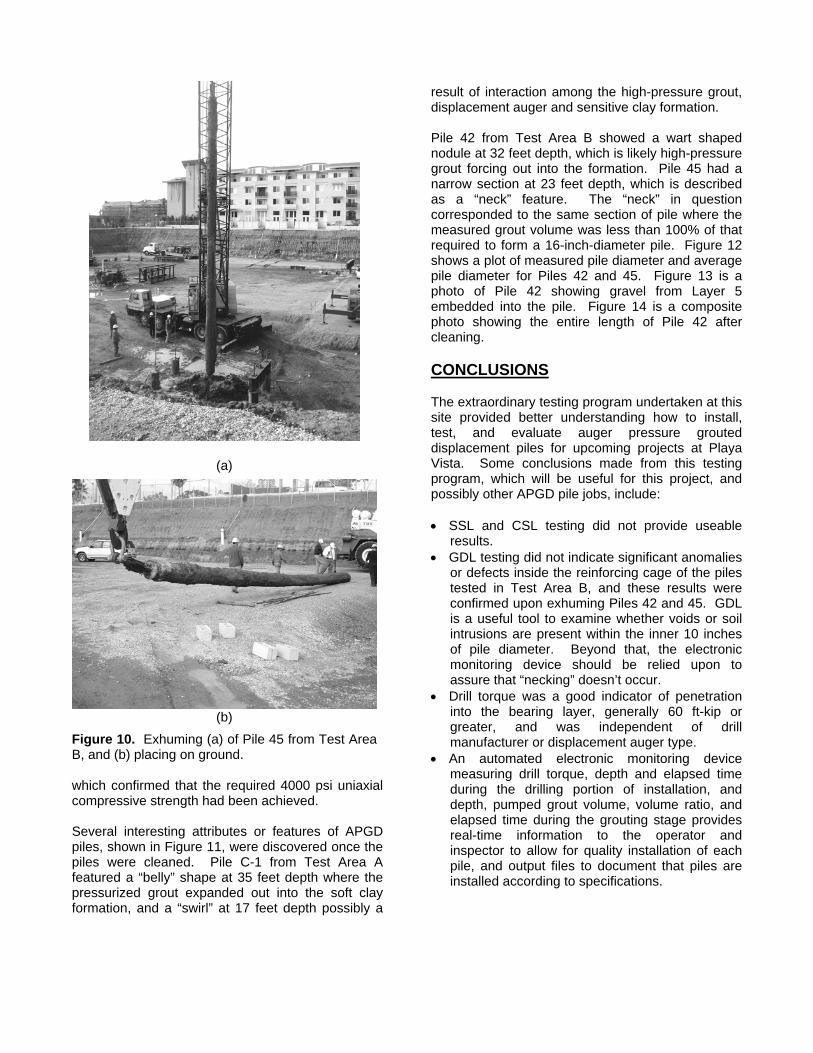
TABLE 1. Summary of Pile Load Testing Results: Test Areas A and B.
Figure 9. Results of long-term testing.
which confirmed that the required 4000 psi uniaxial compressive strength had been achieved. Several interesting attributes or features of APGD piles, shown in Figure 11, were discovered once the piles were cleaned. Pile C-1 from Test Area A featured a “belly” shape at 35 feet depth where the pressurized grout expanded out into the soft clay formation, and a “swirl” at 17 feet depth possibly a
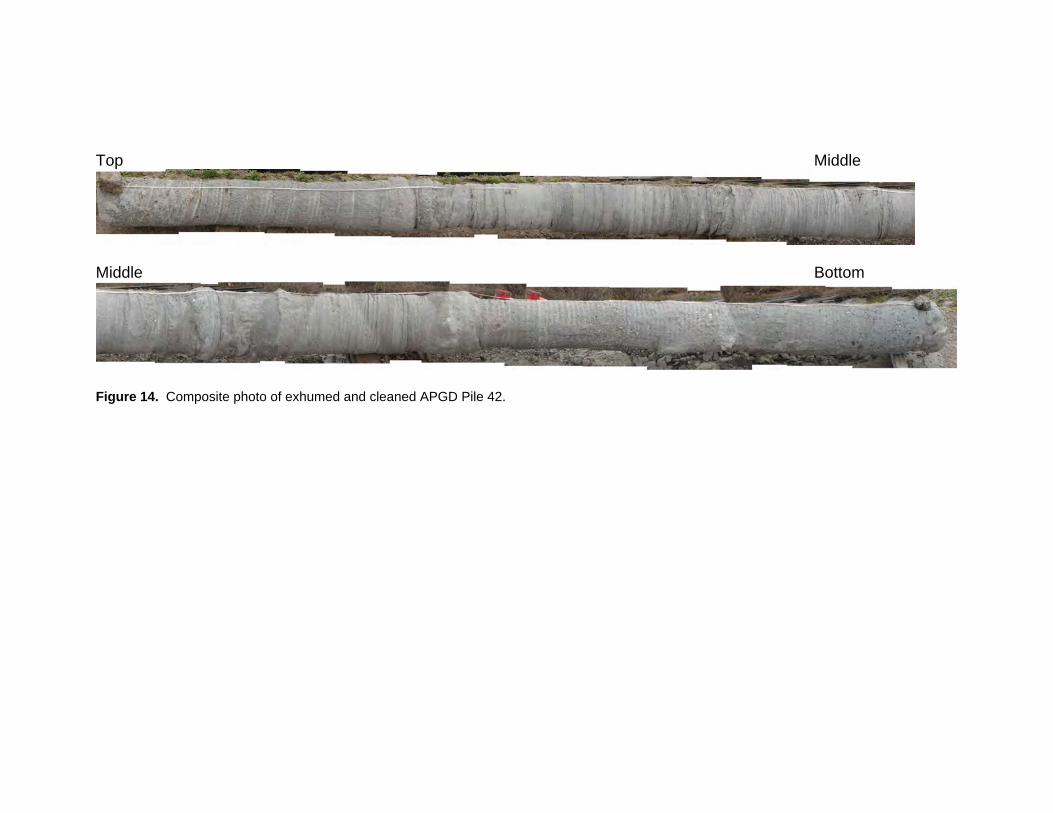
result of interaction among the high-pressure grout, displacement auger and sensitive clay formation. Pile 42 from Test Area B showed a wart shaped nodule at 32 feet depth, which is likely high-pressure grout forcing out into the formation. Pile 45 had a narrow section at 23 feet depth, which is described as a “neck” feature. The “neck” in question corresponded to the same section of pile where the measured grout volume was less than 100% of that required to form a 16-inch-diameter pile. Figure 12 shows a plot of measured pile diameter and average pile diameter for Piles 42 and 45. Figure 13 is a photo of Pile 42 showing gravel from Layer 5 embedded into the pile. Figure 14 is a composite photo showing the entire length of Pile 42 after cleaning. CONCLUSIONS The extraordinary testing program undertaken at this site provided better understanding how to install, test, and evaluate auger pressure grouted displacement piles for upcoming projects at Playa Vista. Some conclusions made from this testing program, which will be useful for this project, and possibly other APGD pile jobs, include: • SSL and CSL testing did not provide useable
results. • GDL testing did not indicate significant anomalies
or defects inside the reinforcing cage of the piles tested in Test Area B, and these results were confirmed upon exhuming Piles 42 and 45. GDL is a useful tool to examine whether voids or soil intrusions are present within the inner 10 inches of pile diameter. Beyond that, the electronic monitoring device should be relied upon to assure that “necking” doesn’t occur.
• Drill torque was a good indicator of penetration into the bearing layer, generally 60 ft-kip or greater, and was independent of drill manufacturer or displacement auger type.
• An automated electronic monitoring device measuring drill torque, depth and elapsed time during the drilling portion of installation, and depth, pumped grout volume, volume ratio, and elapsed time during the grouting stage provides real-time information to the operator and inspector to allow for quality installation of each pile, and output files to document that piles are installed according to specifications.
(a)
(b) Figure 10. Exhuming (a) of Pile 45 from Test Area B, and (b) placing on ground.
• Grout volume increments should be as small as practical to minimize potential of developing “necking” due to rapid withdrawal of the displacement auger. The “necking” feature that formed in Pile 45 occurred when a 5-foot grouting increment was used. Later inspection of the installation data showed that 2-foot increments would have indicated to the operator during production that not enough grout was pumped into that section of the pile.
• Long-term testing greater than the required ultimate load, although interesting, did not provide a useful indication of long-term pile behavior. Long-term testing at, for example, 115% of the allowable load may be a better “proof” test.
• Exhuming piles provided a means of comparing electronic monitoring output and NDT to the as-built pile condition. From this a clearer understanding and a level of trust was gained for those not familiar with APGD piles. As mentioned previously, the automated electronic monitoring is an excellent QA/QC technique, which when used at the correct settings provides a good indication of pile condition. Pile exhumation is a costly and challenging endeavor, which may not be necessary for most testing programs.
REFERENCES ASTM, 3689-90, Standard Test Method for Individual Piles under Static Axial Tensile Load, Vol. 4.08. ASTM, 1143-81, Standard Test Method for Piles under Static Axial Compressive Load, Vol. 4.08. Davisson, M.T., High Capacity Pile, Proceedings, Lecture Series, Innovations in Foundation Construction, ASCE, Illinois Section, 1972, 52 pp. Fellenius, Bengt H., The Analysis of Results from Routine Pile Load Tests, Ground Engineering, London, 13 No. 6, 1980, pp 19-31.
ACKNOWLEDGMENTS The authors gratefully acknowledge and thank Derek Fraychineaud and Robert McCumsey of Playa Capital Company, Andy Szpikowski and Colin Kumabe at the Department of Building and Safety, City of Los Angeles, and Brian Zuckerman of Berkel and Company for their contributions throughout this project.
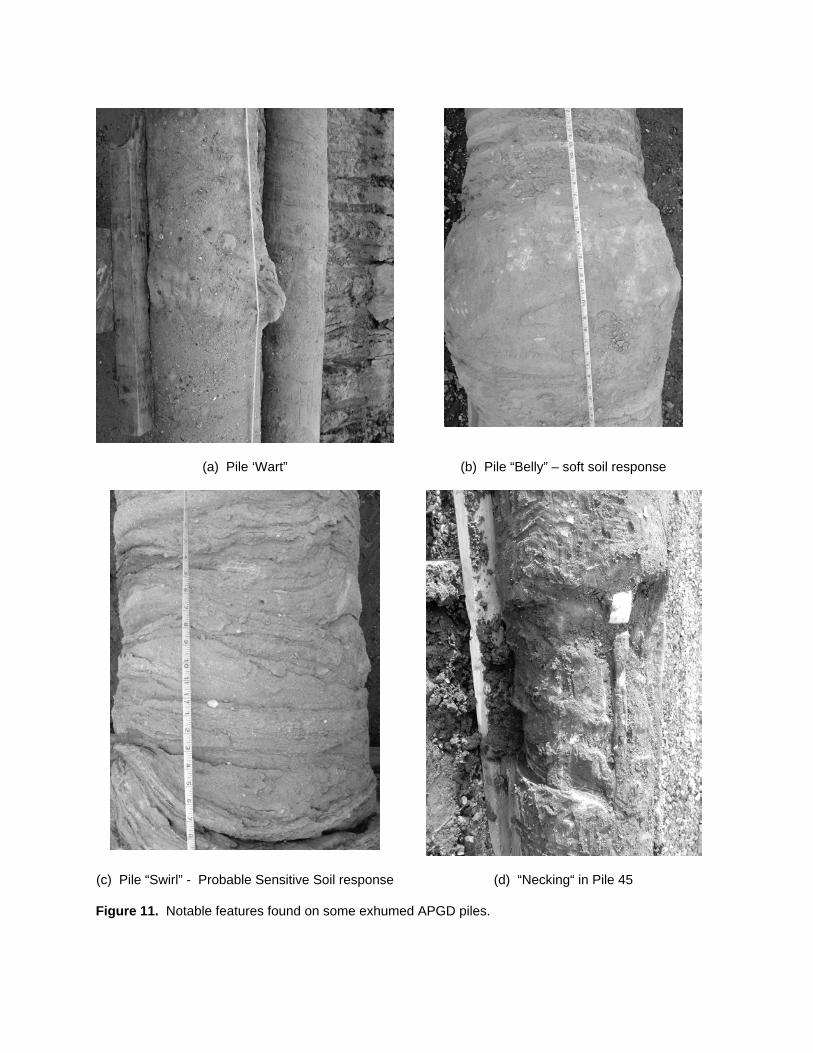
(a) Pile ‘Wart”
(b) Pile “Belly” – soft soil response
(c) Pile “Swirl” - Probable Sensitive Soil response
(d) “Necking“ in Pile 45 Figure 11. Notable features found on some exhumed APGD piles.
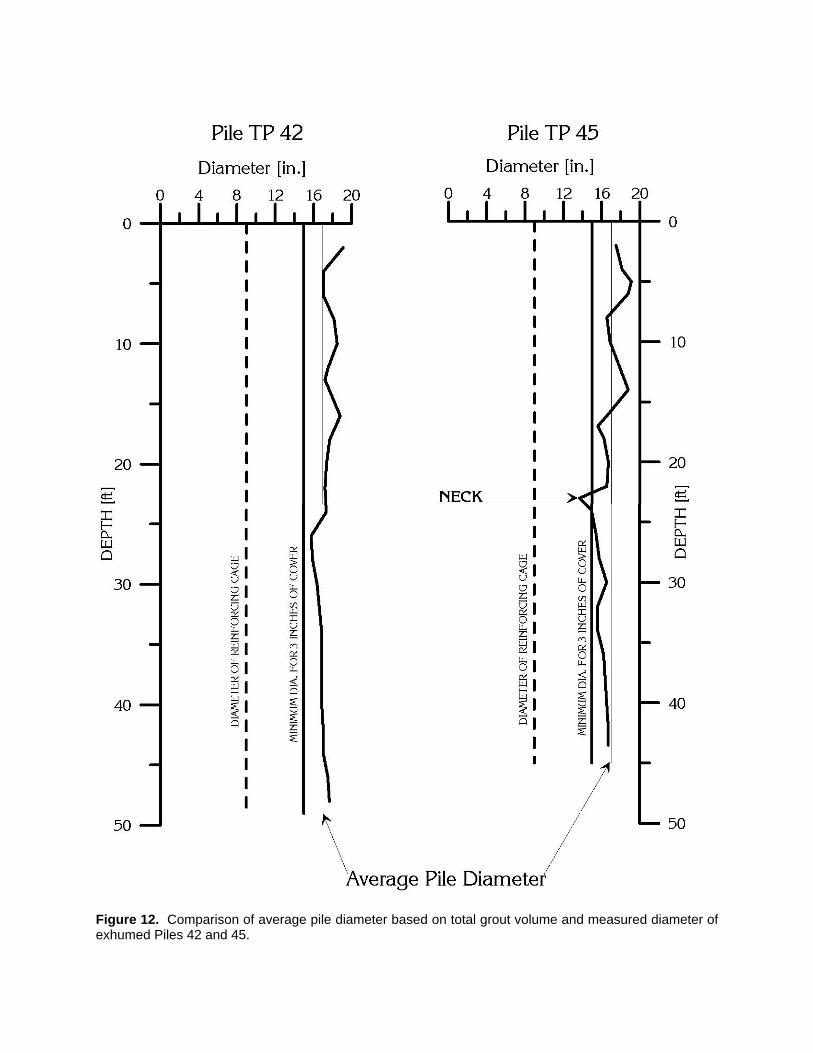
Figure 12. Comparison of average pile diameter based on total grout volume and measured diameter of exhumed Piles 42 and 45.
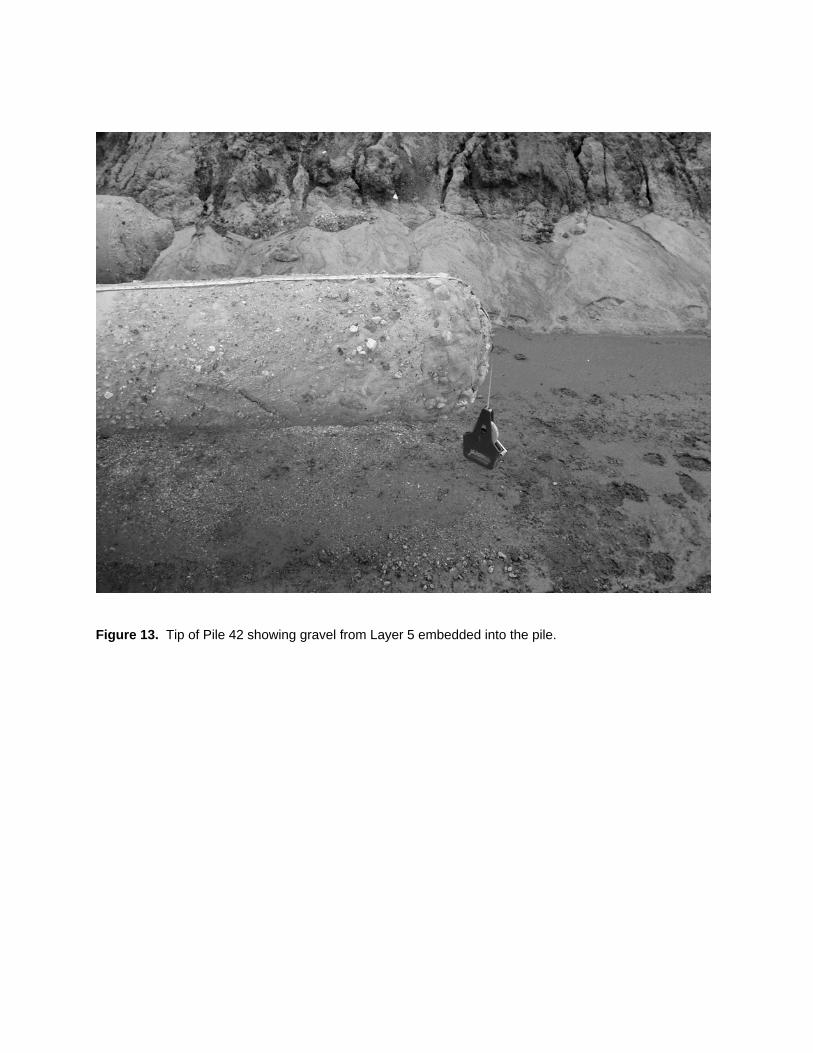
Figure 13. Tip of Pile 42 showing gravel from Layer 5 embedded into the pile.
Top Middle
Middle Bottom
Figure 14. Composite photo of exhumed and cleaned APGD Pile 42.