Extensible Statistical Software: On a Voyage to Oberon
24
Extensible Statistical Software: On a Voyage to Oberon Günther Sawitzki StatLab Heidelberg Im Neuenheimer Feld 294 D 69120 Heidelberg Abstract. Recent changes in software technology have opened new possibilities for statistical computing. Conditions for creating efficient and reliable extensible systems have been largely improved by programming languages and systems which provide dynamic loading and type-safety across module boundaries, even at run time. We introduce Voyager, an extensible data analysis system based on Oberon, which tries to exploit some of these possibilities. Keywords. Statistical Software, Software Portability, Extensibility, Object-Oriented Programming Introduction Software technology has changed over the last years, and recent changes have opened new possibilities for statistical computing. In particular, the conditions for creating efficient and reliable extensible systems have been largely improved. A basis has been established to work with software components. Main improvements come from research related to Project Oberon at ETH Zürich [Wirth & Gutknecht 1992]. To explore how these possibilities can be made fruitful in statistical computing, we have designed and implemented Voyager 1 , an extensible data analysis system [Sawitzki, 1994]. Software technology is moving from self-contained applications and programs towards software com- ponents. The challenge is to design modules for code-reuse, to define adequate abstract data types, and to give a basis of extensible types and objects. We will give some examples how these challenges are met in Voyager. The Voyager project has been driven by the need to define the directions of our own computing environment for the years to come. Although we have been guided by the specific needs at StatLab Heidelberg, the critical requirements seem to be quite common. In the view of a rapidly changing tech- nical environment, we need portable statistical systems which do not depend on specific hardware or software environments. Statistical research over the last years has shown the potential contribution of re- sampling and other data based methods. To make use of this contribution, data analysis and resampling/simulation facilities must be closely integrated. Finally, as a research institution, a main focus is on the development and application of new methods. This asks for extensible software allowing to integrate results from recent research. None of these three requirements is easy to fulfill. Porting software may be a pain when old design scars break up in new wounds, and integrating analysis and simulation may need careful considerations. But at present, the major challenge among these requirements is true extensibility. To start with the first problem, portability: our solution was to build on a portable operating system. After careful consideration, the system and language of choice was Oberon. We will give a very short 1 voyager n. person who makes a voyage (esp. of those who, in former times, explored unknown seas). - 1 - 30. Oct. 1995. Submitted to the Journal of Computational and Graphical Statistics WWW entry point: http://statlab.uni-heidelberg.de. Comments to [email protected], please.
Transcript of Extensible Statistical Software: On a Voyage to Oberon
Extensible Statistical Software: On a Voyage to Oberon
Günther SawitzkiStatLab Heidelberg
Im Neuenheimer Feld 294D 69120 Heidelberg
Abstract. Recent changes in software technology have opened new possibilities for statisticalcomputing. Conditions for creating efficient and reliable extensible systems have been largely improvedby programming languages and systems which provide dynamic loading and type-safety across moduleboundaries, even at run time. We introduce Voyager, an extensible data analysis system based onOberon, which tries to exploit some of these possibilities.
Keywords. Statistical Software, Software Portability, Extensibility, Object-Oriented Programming
Introduction
Software technology has changed over the last years, and recent changes have opened new possibilities
for statistical computing. In particular, the conditions for creating efficient and reliable extensible
systems have been largely improved. A basis has been established to work with software components.
Main improvements come from research related to Project Oberon at ETH Zürich [Wirth & Gutknecht
1992]. To explore how these possibilities can be made fruitful in statistical computing, we have designed
and implemented Voyager1, an extensible data analysis system [Sawitzki, 1994].
Software technology is moving from self-contained applications and programs towards software com-
ponents. The challenge is to design modules for code-reuse, to define adequate abstract data types, and
to give a basis of extensible types and objects. We will give some examples how these challenges are
met in Voyager.
The Voyager project has been driven by the need to define the directions of our own computing
environment for the years to come. Although we have been guided by the specific needs at StatLab
Heidelberg, the critical requirements seem to be quite common. In the view of a rapidly changing tech-
nical environment, we need portable statistical systems which do not depend on specific hardware or
software environments. Statistical research over the last years has shown the potential contribution of re-
sampling and other data based methods. To make use of this contribution, data analysis and
resampling/simulation facilities must be closely integrated. Finally, as a research institution, a main
focus is on the development and application of new methods. This asks for extensible software
allowing to integrate results from recent research. None of these three requirements is easy to fulfill.
Porting software may be a pain when old design scars break up in new wounds, and integrating analysis
and simulation may need careful considerations. But at present, the major challenge among these
requirements is true extensibility.
To start with the first problem, portability: our solution was to build on a portable operating system.
After careful consideration, the system and language of choice was Oberon. We will give a very short
1 voyager n. person who makes a voyage (esp. of those who, in former times, explored unknown seas).
- 1 -30. Oct. 1995. Submitted to the Journal of Computational and Graphical Statistics
WWW entry point: http://statlab.uni-heidelberg.de. Comments to [email protected], please.
impression of the Oberon system in the next section. Then we show how Voyager, our system, is built
upon Oberon, and show some basic components of Voyager. Finally we discuss how extensibility is
achieved by Voyager making use of the Oberon environment. But before proceeding, we have to take a
closer look at some problems related extensibility.
Extensibility
There are several reasons to ask for extensibility. For example, your software may do nearly the right
thing, and you just want to add the missing bit. Or it does the right thing, and you want to wrap it up to
provide easier handling and integration into reports. Or, as usual in our case, you want to add new
functionalities which make use of the services already provided. Several methods are available to provide
extensibility. If your system is a closed system, you have to modify the code and recompile it - there are
no other possibilities in a closed system. You may get a similar effect by controlling your system by a
script - be it a script for some macro language integrated with the system, or controlled by an external
script system. Or your system may allow for external functions and back calls. If the requirements are
modest, these means may be sufficient. If you want to use typical tools of data analysis, like interactive
graphical methods, these means may fall short: for interactive graphics, you need a tight feedback loop
from user input to system response. Timing behaviour may become critical. Other methods come into
play, like message passing or process-to-process communication. These methods however require that
your system is open for communication.
A key requirement is that extensibility should not compromise system stability. Guaranteeing for
stability cannot be based on good hopes, but must be built into the system. Consistency must be assured
even for non-anticipated extensions, and compatibility of versions must be checked. Extensions may be
added at any time, even long after the design of the original systems, and by any user, not necessarily
informed about all assumptions of the original implementer. It must be guaranteed that memory usage
and parameter conventions of the extension and the original program coincide, and that any mismatches
are detected. There are well known techniques to help maintaining system stability, such as modular
design, control of import/export, type checking. The common questions of maintainability and
portability reoccur in a more demanding form for extensible systems.
Strategy: Modularity and Separation of Concerns
Modular programming is a basic strategy for the development of stable programs. A module is a pro-
gram unit with a well defined function, communicating with other program units only via well defined
inputs and outputs. To achieve modular programming, you must adhere to a modular programming
style, and you need a language and programming environment which support working with modules and
can shield the internal information of a module from external access.
Modularity is a formal concept. It must be accompanied by a strategy how to decide upon the decompo-
sition into modules or components. A leading idea is separation of concerns. Each component should
fulfil the task it is designed to do, and it should withhold from other tasks. Defining the proper concerns
is the first step, and the design of corresponding components or modules has to follow.
Separation of concerns is a general principle. It should hold for all components of the statistical appli-
- 2 -30. Oct. 1995. Submitted to the Journal of Computational and Graphical Statistics
WWW entry point: http://statlab.uni-heidelberg.de. Comments to [email protected], please.
cation, but also for the relation between statistical application and the embedding system programs. De-
fining the proper concerns often goes hand in hand with identifying a certain level, or layer responsible
for some task.
As an example, memory management is a common task, and garbage collection - the identification and
release of no longer used computing resources - is a necessary, but most annoying aspect of this. A
decision has to be taken who is responsible for garbage collection. You cannot identify all clients of
objects if the system continues to "grow" and clients have their own memory management. So to
maintain system stability, you either can keep garbage collection on the application level, implying that
you deny the rights to do memory management to the extension - an unrealistic restriction -, or you need
a system wide garbage collection. We prefer an operating or run time system to handle it. We try to be
cooperative and arrange our memory allocation in a way which makes garbage collection easier. But no
computational statistician should be required to spend time on these things which would be better
handled by computational scientists - garbage collection should be a system service, not handled by the
application or extensions.
Oberon
The Oberon operating system [Reiser 1991, Wirth and Gutknecht, 1992], and the Oberon language
[Wirth 1988, Reiser and Wirth 1992, Wirth and Mössenböck, 1993], have been developed at ETH
Zürich. Both are intimately related: The Oberon operating system is written in Oberon, and many Oberon
language constructs find most convincing applications in the Oberon operating system. Oberon is a
single tasking operating system. It does allow for background tasks, but the usual processes are
executions of a single command and return to a common base level as soon as the command is executed.
Garbage collection is provided by the Oberon system.
The Oberon operating system is extremely economical. A basic Oberon system takes about 300K (with-
out extensions, of course; extensions can add an arbitrary amount). This count includes a compiler and
an editor. As a consequence, you can implement a full Oberon operating system on top of another
operating system, with full functionality, and still use less resources than some of todays editor
extensions would use [Franz 1993]. The designed economy is one of the bases for Oberon’s portability.
The Oberon operating system is available as a native operating system (on the Ceres workstations or
IBM PCs, for example). But what is more interesting is that it is available as an emulation on top of most
of the common operating systems (UNIX, MS-Dos, MS-Dos&Windows, LINUX, MacOS etc.) and for
most of the common hardware architectures (Intel x86, Motorola 68xxx, PowerPC, MIPS Risc, SPARC
etc.). As with all evolving systems, variants of Oberon do exist. Unless stated otherwise, we will use
Oberon in the sense of Oberon operating system Version 4. This is a deliberate decision. Other variants
(Oberon System 3, Oberon/F) offer interesting perspectives. The System 3 variant introduces support of
persistent objects and libraries as a system service [Gutknecht 1993, Marais 1994]. Augmented by the
Gadgets system [Marais 1995] it offers a desktop model and a document oriented interface. Oberon/F is
a cross-platform development system based on Oberon providing a platform-specific look-and-feel and
- 3 -30. Oct. 1995. Submitted to the Journal of Computational and Graphical Statistics
WWW entry point: http://statlab.uni-heidelberg.de. Comments to [email protected], please.
heading towards an integrated document model [Pfister et al., 1994]. But at present Oberon version 4 is
the base version if you consider portability over a wide range of platforms. It is implemented on most
platforms, and all critical components are available in source form.
The Oberon language is a strongly typed language in the tradition of Algol and Pascal. In comparison to
Pascal (or Modula), Oberon is cleaned-up and streamlined. Some features have been removed or
modified to allow for an efficient compilation, others have been added, mostly to increase the safety of
the language, and support for object oriented programming is integrated.
Oberon allows modular programming with export control on module level. It encourages a very fine
grained modularity. Type safety is guaranteed across module boundaries and includes type safety for run
time extensions. Once loaded, modules stay resident and their status is preserved unless the module is
explicitly unloaded. Memory is shared, and access to variables is controlled on a per module basis. The
definition of a module contains a description of exported data structures and permissions to access
variables. A calling module explicitly imports the called module. Since the definition of exported data
structures is preserved during compilation, consistency can be checked without need to access the source
code. Moreover, the compiled code contains keys which can help to identify version mismatches at
load/run time.
This contrasts drastically with the situation you would encounter in C/C++, say. With C/C++, you can
access any memory cell once you have an appropriate starting pointer - there is no true modularity with
C/C++. And with C/C++, you, the programmer, are responsible that header files, source files, compiled
object code and libraries are synchronized. If you allow for call-back functions, you are responsible to
take all consistency checks. You may use tools to help you, but there is no compile-time or run time
consistency check in C/C++, while type safety (and module version consistency) is supported by
Oberon even at run time.
There is no separation between system and application programs in Oberon. In particular, all system
modules are accessible as a free library of shared components. The Oberon system includes support for
high level abstractions. For example, Oberon has an abstract data type Text, which knows about
attributes (like colour and style) and has methods like append or insert, write to file, read from file.
Moreover, the Text data type allows for “text elements” which may be represented by anything, not only
letters. Active programmed elements can be an integral part of an Oberon Text, flowing with the text and
modifiable by the same methods as any other components of the text (for example a “life” clock can be
imbedded in a running text). A graphical display system is an integral part of Oberon. By default, he
Oberon system includes a tiled graphical window system.
The original design of Oberon tries to avoid modes. By convention, text fragments of the form M.P are
considered commands. They can be executed and yield a call to procedure P in Module M. Execution is
associated to one of the mouse buttons. Any text in any display is active. It may be input text entered by
the user, or output of previous commands, or any text accessible to Oberon. In the basic Oberon system,
text is presented in frames and can be selected using a mouse. Thus commands may be executed by
entering commands in any display frame, or by activating any command which may be visible in the
display frames. There is no special command line or menu bar. Menus are only special in that they have
other attributes, showing text in inverted colours. In all other respects they are display frames like any
- 4 -30. Oct. 1995. Submitted to the Journal of Computational and Graphical Statistics
WWW entry point: http://statlab.uni-heidelberg.de. Comments to [email protected], please.
other frame and are under full control of the user. In particular, the user can add or remove entries in
menus like in any other text, and can execute commands in menus like in any other position.
Voyager
Voyager adds a layer on top of the general Oberon system. The task of Voyager is to provide the basis
for statistical computing in an Oberon environment. It provides data management, proper statistical
computing, and display services. Of course as far as the proper statistical computing component is
concerned Voyager like any other statistical program, draws upon the usual resources, such as
BLAS/LAPACK etc. for linear algebra, or the Applied Statistics series and other commonly available
sources for statistical algorithms.
The display components have to go own ways. To guarantee the usual interactions of data analysis, like
selection, brushing, slicing [Becker et al. 1987] in a portable way, you need a graphic environment
which is prepared for interaction. The Voyager display system supports these actions. Following the
principle of separation of concerns, Voyager restricts itself to the proper task of statistical graphics.
Instead of providing one more presentation system or one more application system, Voyager provides
components which can be used even with previously existing application programs - like some editor of
the user’s choice. This works using the usual message passing mechanism of Oberon [Marais 1995].
The Voyager graphics are provided as specific text elements, which, as mentioned before, can be part of
any text. When seen by an editor, Voyager graphics are just some text elements flowing with the text like
letters or other elements. As long as any of the usual text actions (insert, cut, paste etc.) is required, it is
handled by the editor. If the editor encounters any action message it cannot handle and if the input is
focussed on a text element, a corresponding message is forwarded to the text element to take the
appropriate action. If the text element is one of Voyager’s displays, Voyager takes over. This message
passing mechanism allows Voyager to respond and provide dynamic plots.
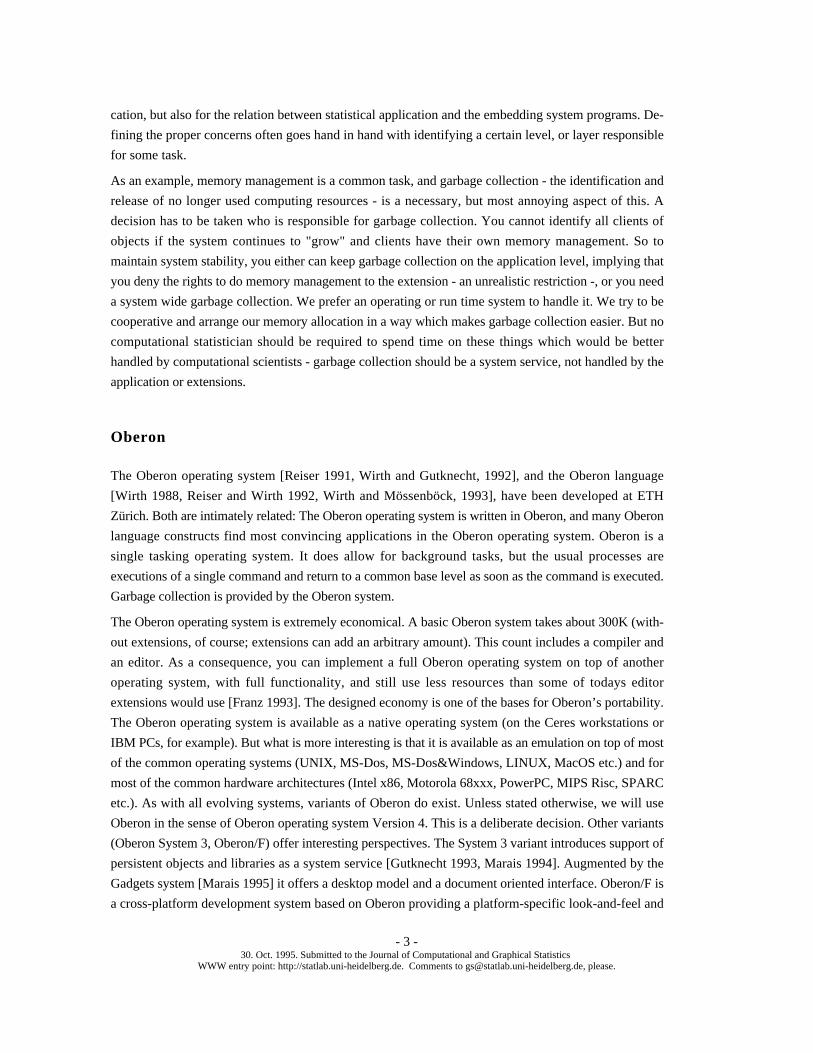
By convention, Voyager output takes a form which can be used as Voyager input again. Of course it
need not be typed in again - following the Oberon conventions, all commands allow references to text
selections either by redirecting input (using an arrow character) or by imbedding it in a command (using
“@” as a reference mark). So the output of a regression yields a regression equation which can be used
as input to specify a model, which in turn can be used to draw new samples, thus allowing the required
close integration of data analysis and resampling or simulation. [Figure 1]
- 5 -30. Oct. 1995. Submitted to the Journal of Computational and Graphical Statistics
WWW entry point: http://statlab.uni-heidelberg.de. Comments to [email protected], please.
Application: Oberon Edit
Voyager: version 0.a1
Oberon: MacOberon 4.1F
Host System: MacOS System 7
Figure 1. Integration of Voyager in a layered architecture. Voyager elements in aneditor environment. By convention, the Oberon screen is divided into tracks. The track on the leftshows a default Oberon editor window with Voyager in- and output: graphics are imbedded as textelements. Interaction, like brushing, is handled by these text elements, whereas in all other aspectsthey behave like any other text element or character.
Building upon the generic Oberon graphic system, Voyager provides the necessary graphical basis for
data analysis. One- two and tree dimensional plots, including rotating 3d-plots, are included in Voyager.
All plots can be linked and support the usual action such as brushing, identification etc. [Figure 2]
- 6 -30. Oct. 1995. Submitted to the Journal of Computational and Graphical Statistics
WWW entry point: http://statlab.uni-heidelberg.de. Comments to [email protected], please.
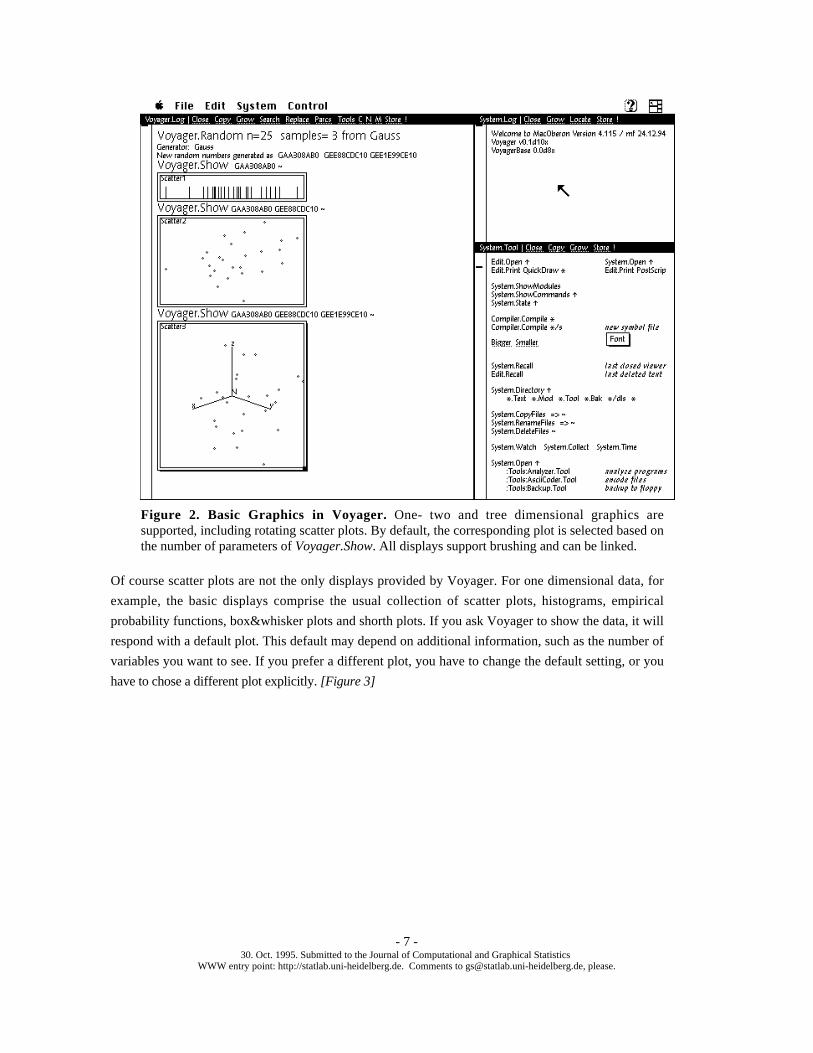
Figure 2. Basic Graphics in Voyager. One- two and tree dimensional graphics aresupported, including rotating scatter plots. By default, the corresponding plot is selected based onthe number of parameters of Voyager.Show. All displays support brushing and can be linked.
Of course scatter plots are not the only displays provided by Voyager. For one dimensional data, for
example, the basic displays comprise the usual collection of scatter plots, histograms, empirical
probability functions, box&whisker plots and shorth plots. If you ask Voyager to show the data, it will
respond with a default plot. This default may depend on additional information, such as the number of
variables you want to see. If you prefer a different plot, you have to change the default setting, or you
have to chose a different plot explicitly. [Figure 3]
- 7 -30. Oct. 1995. Submitted to the Journal of Computational and Graphical Statistics
WWW entry point: http://statlab.uni-heidelberg.de. Comments to [email protected], please.
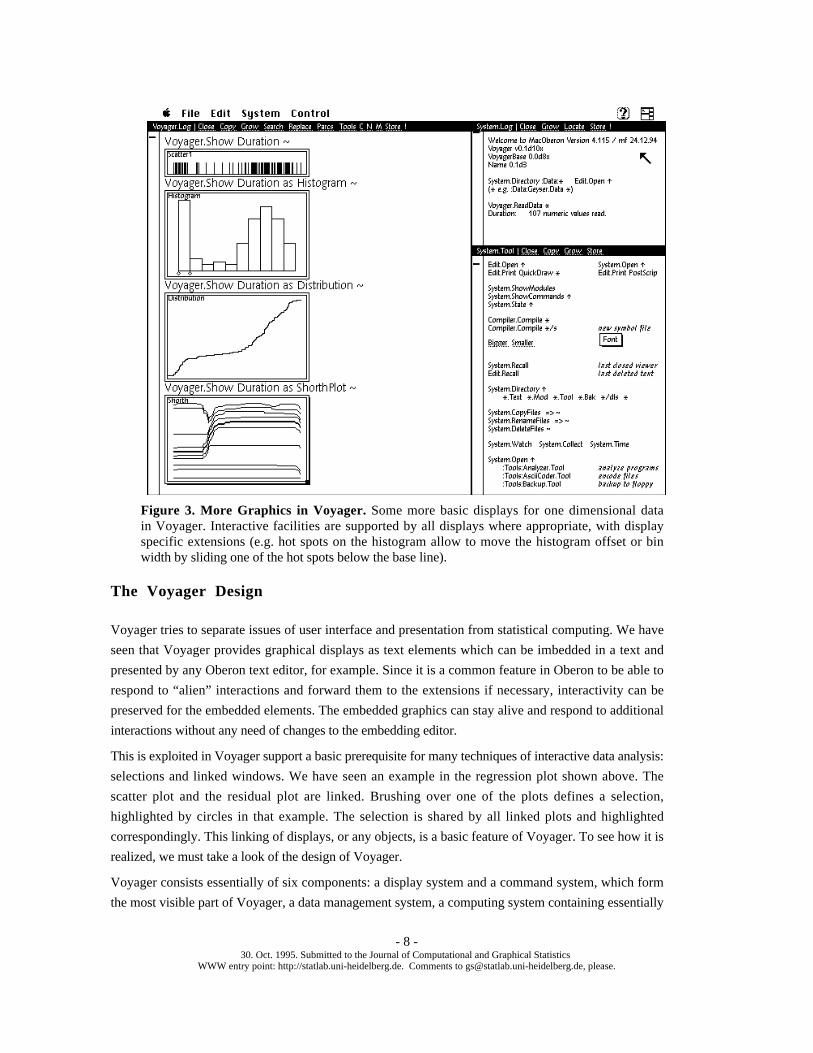
Figure 3. More Graphics in Voyager. Some more basic displays for one dimensional datain Voyager. Interactive facilities are supported by all displays where appropriate, with displayspecific extensions (e.g. hot spots on the histogram allow to move the histogram offset or binwidth by sliding one of the hot spots below the base line).
The Voyager Design
Voyager tries to separate issues of user interface and presentation from statistical computing. We have
seen that Voyager provides graphical displays as text elements which can be imbedded in a text and
presented by any Oberon text editor, for example. Since it is a common feature in Oberon to be able to
respond to “alien” interactions and forward them to the extensions if necessary, interactivity can be
preserved for the embedded elements. The embedded graphics can stay alive and respond to additional
interactions without any need of changes to the embedding editor.
This is exploited in Voyager support a basic prerequisite for many techniques of interactive data analysis:
selections and linked windows. We have seen an example in the regression plot shown above. The
scatter plot and the residual plot are linked. Brushing over one of the plots defines a selection,
highlighted by circles in that example. The selection is shared by all linked plots and highlighted
correspondingly. This linking of displays, or any objects, is a basic feature of Voyager. To see how it is
realized, we must take a look of the design of Voyager.
Voyager consists essentially of six components: a display system and a command system, which form
the most visible part of Voyager, a data management system, a computing system containing essentially
- 8 -30. Oct. 1995. Submitted to the Journal of Computational and Graphical Statistics
WWW entry point: http://statlab.uni-heidelberg.de. Comments to [email protected], please.
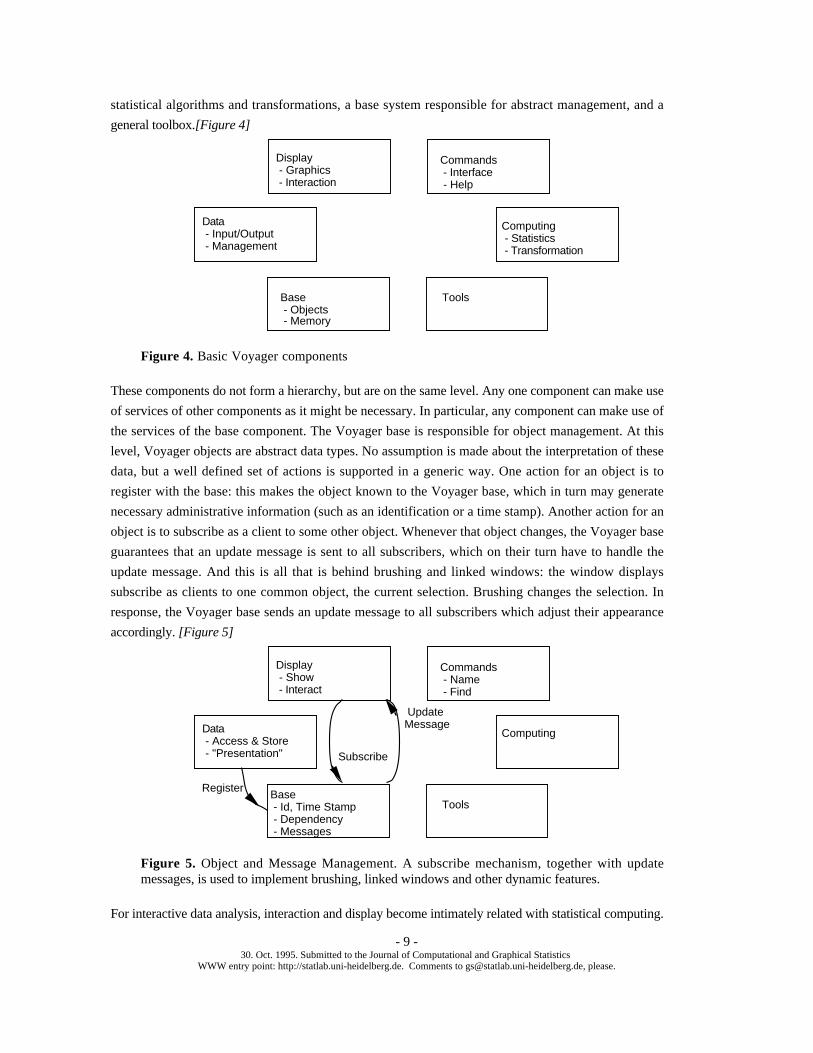
statistical algorithms and transformations, a base system responsible for abstract management, and a
general toolbox.[Figure 4]
Base - Objects - Memory
Display - Graphics - Interaction
Computing - Statistics - Transformation
Tools
Commands - Interface - Help
Data - Input/Output - Management
Figure 4. Basic Voyager components
These components do not form a hierarchy, but are on the same level. Any one component can make use
of services of other components as it might be necessary. In particular, any component can make use of
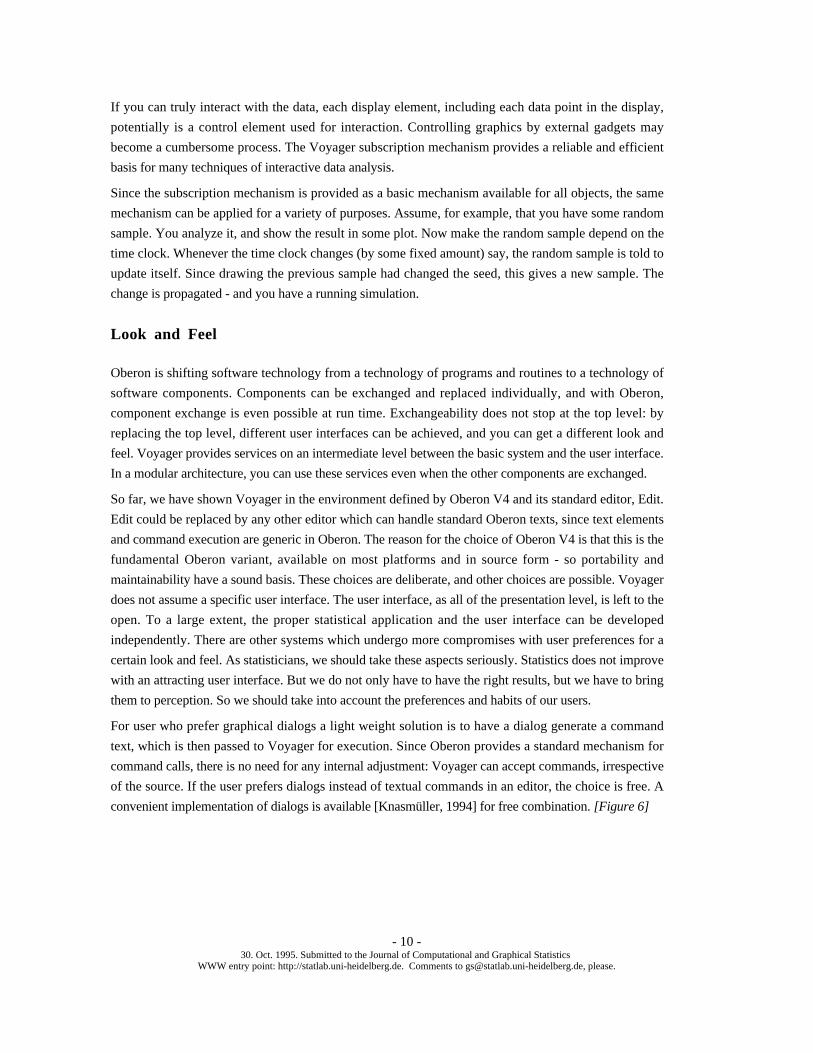
the services of the base component. The Voyager base is responsible for object management. At this
level, Voyager objects are abstract data types. No assumption is made about the interpretation of these
data, but a well defined set of actions is supported in a generic way. One action for an object is to
register with the base: this makes the object known to the Voyager base, which in turn may generate
necessary administrative information (such as an identification or a time stamp). Another action for an
object is to subscribe as a client to some other object. Whenever that object changes, the Voyager base
guarantees that an update message is sent to all subscribers, which on their turn have to handle the
update message. And this is all that is behind brushing and linked windows: the window displays
subscribe as clients to one common object, the current selection. Brushing changes the selection. In
response, the Voyager base sends an update message to all subscribers which adjust their appearance
accordingly. [Figure 5]
Base - Id, Time Stamp - Dependency - Messages
Display - Show - Interact
Computing
Tools
Commands - Name - Find
Data - Access & Store - "Presentation"
Register
Subscribe
Update Message
Figure 5. Object and Message Management. A subscribe mechanism, together with updatemessages, is used to implement brushing, linked windows and other dynamic features.
For interactive data analysis, interaction and display become intimately related with statistical computing.
- 9 -30. Oct. 1995. Submitted to the Journal of Computational and Graphical Statistics
WWW entry point: http://statlab.uni-heidelberg.de. Comments to [email protected], please.
If you can truly interact with the data, each display element, including each data point in the display,
potentially is a control element used for interaction. Controlling graphics by external gadgets may
become a cumbersome process. The Voyager subscription mechanism provides a reliable and efficient
basis for many techniques of interactive data analysis.
Since the subscription mechanism is provided as a basic mechanism available for all objects, the same
mechanism can be applied for a variety of purposes. Assume, for example, that you have some random
sample. You analyze it, and show the result in some plot. Now make the random sample depend on the
time clock. Whenever the time clock changes (by some fixed amount) say, the random sample is told to
update itself. Since drawing the previous sample had changed the seed, this gives a new sample. The
change is propagated - and you have a running simulation.
Look and Feel
Oberon is shifting software technology from a technology of programs and routines to a technology of
software components. Components can be exchanged and replaced individually, and with Oberon,
component exchange is even possible at run time. Exchangeability does not stop at the top level: by
replacing the top level, different user interfaces can be achieved, and you can get a different look and
feel. Voyager provides services on an intermediate level between the basic system and the user interface.
In a modular architecture, you can use these services even when the other components are exchanged.
So far, we have shown Voyager in the environment defined by Oberon V4 and its standard editor, Edit.
Edit could be replaced by any other editor which can handle standard Oberon texts, since text elements
and command execution are generic in Oberon. The reason for the choice of Oberon V4 is that this is the
fundamental Oberon variant, available on most platforms and in source form - so portability and
maintainability have a sound basis. These choices are deliberate, and other choices are possible. Voyager
does not assume a specific user interface. The user interface, as all of the presentation level, is left to the
open. To a large extent, the proper statistical application and the user interface can be developed
independently. There are other systems which undergo more compromises with user preferences for a
certain look and feel. As statisticians, we should take these aspects seriously. Statistics does not improve
with an attracting user interface. But we do not only have to have the right results, but we have to bring
them to perception. So we should take into account the preferences and habits of our users.
For user who prefer graphical dialogs a light weight solution is to have a dialog generate a command
text, which is then passed to Voyager for execution. Since Oberon provides a standard mechanism for
command calls, there is no need for any internal adjustment: Voyager can accept commands, irrespective
of the source. If the user prefers dialogs instead of textual commands in an editor, the choice is free. A
convenient implementation of dialogs is available [Knasmüller, 1994] for free combination. [Figure 6]
- 10 -30. Oct. 1995. Submitted to the Journal of Computational and Graphical Statistics
WWW entry point: http://statlab.uni-heidelberg.de. Comments to [email protected], please.
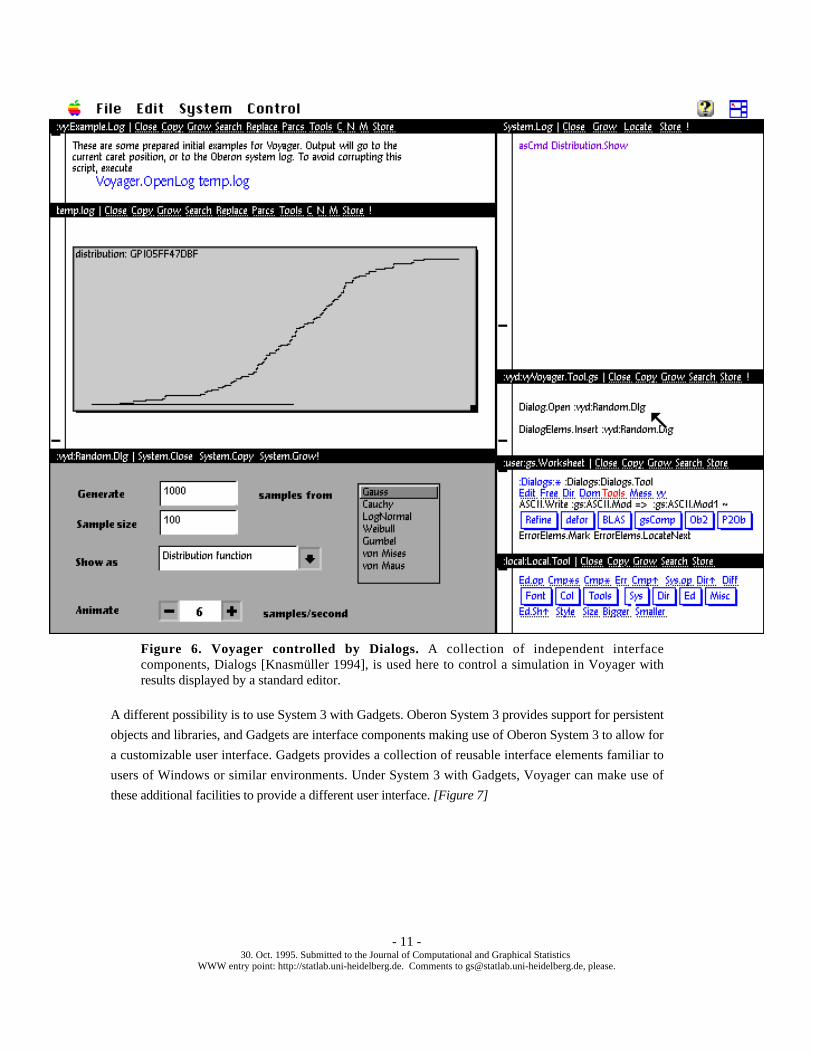
Figure 6. Voyager controlled by Dialogs. A collection of independent interfacecomponents, Dialogs [Knasmüller 1994], is used here to control a simulation in Voyager withresults displayed by a standard editor.
A different possibility is to use System 3 with Gadgets. Oberon System 3 provides support for persistent
objects and libraries, and Gadgets are interface components making use of Oberon System 3 to allow for
a customizable user interface. Gadgets provides a collection of reusable interface elements familiar to
users of Windows or similar environments. Under System 3 with Gadgets, Voyager can make use of
these additional facilities to provide a different user interface. [Figure 7]
- 11 -30. Oct. 1995. Submitted to the Journal of Computational and Graphical Statistics
WWW entry point: http://statlab.uni-heidelberg.de. Comments to [email protected], please.
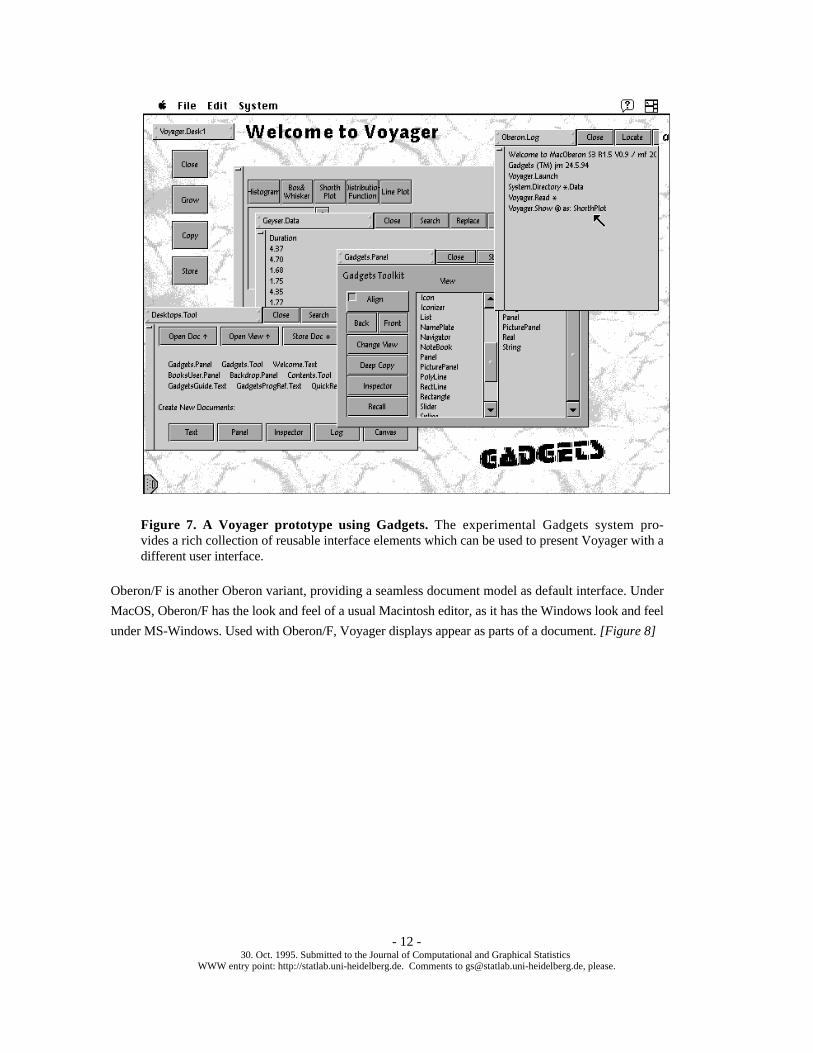
Figure 7. A Voyager prototype using Gadgets. The experimental Gadgets system pro-vides a rich collection of reusable interface elements which can be used to present Voyager with adifferent user interface.
Oberon/F is another Oberon variant, providing a seamless document model as default interface. Under
MacOS, Oberon/F has the look and feel of a usual Macintosh editor, as it has the Windows look and feel
under MS-Windows. Used with Oberon/F, Voyager displays appear as parts of a document. [Figure 8]
- 12 -30. Oct. 1995. Submitted to the Journal of Computational and Graphical Statistics
WWW entry point: http://statlab.uni-heidelberg.de. Comments to [email protected], please.
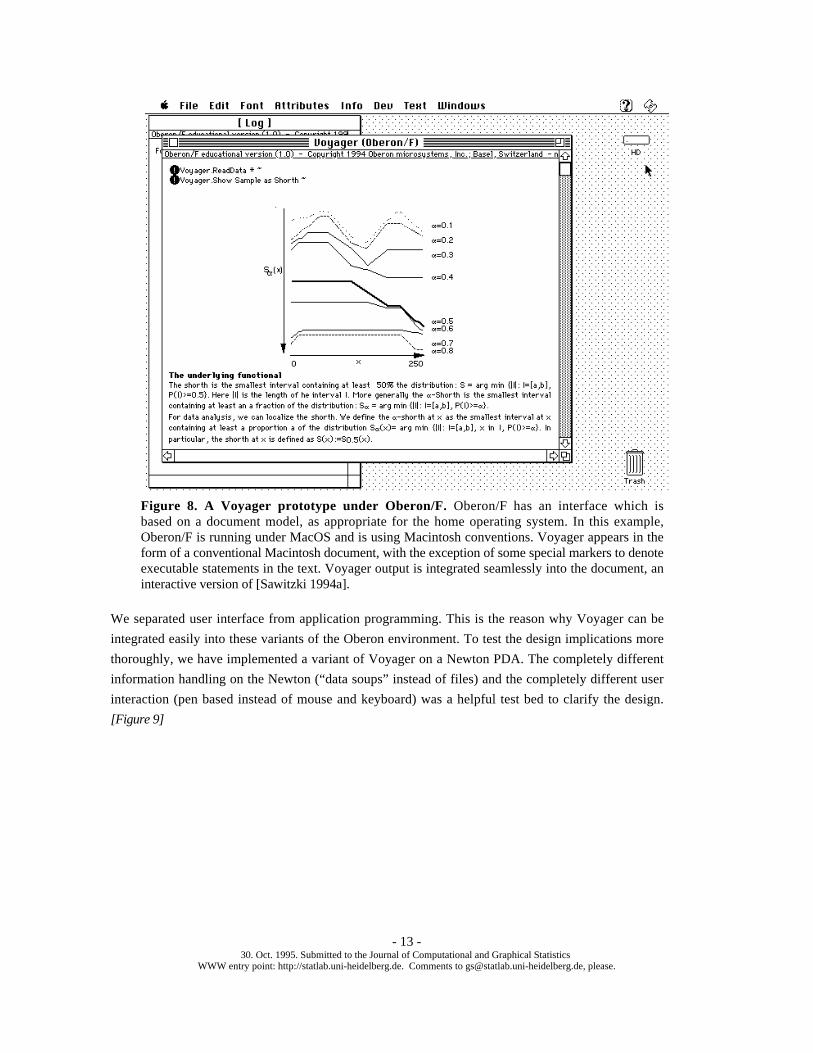
Figure 8. A Voyager prototype under Oberon/F. Oberon/F has an interface which isbased on a document model, as appropriate for the home operating system. In this example,Oberon/F is running under MacOS and is using Macintosh conventions. Voyager appears in theform of a conventional Macintosh document, with the exception of some special markers to denoteexecutable statements in the text. Voyager output is integrated seamlessly into the document, aninteractive version of [Sawitzki 1994a].
We separated user interface from application programming. This is the reason why Voyager can be
integrated easily into these variants of the Oberon environment. To test the design implications more
thoroughly, we have implemented a variant of Voyager on a Newton PDA. The completely different
information handling on the Newton (“data soups” instead of files) and the completely different user
interaction (pen based instead of mouse and keyboard) was a helpful test bed to clarify the design.
[Figure 9]
- 13 -30. Oct. 1995. Submitted to the Journal of Computational and Graphical Statistics
WWW entry point: http://statlab.uni-heidelberg.de. Comments to [email protected], please.
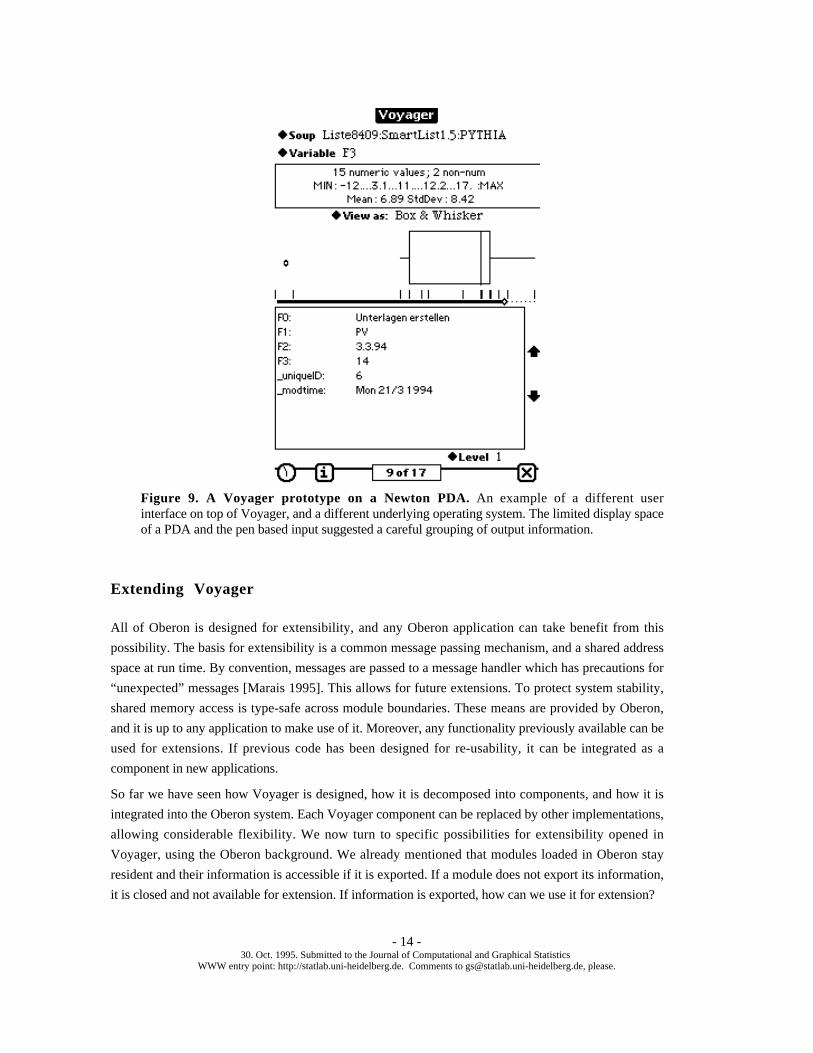
Figure 9. A Voyager prototype on a Newton PDA. An example of a different userinterface on top of Voyager, and a different underlying operating system. The limited display spaceof a PDA and the pen based input suggested a careful grouping of output information.
Extending Voyager
All of Oberon is designed for extensibility, and any Oberon application can take benefit from this
possibility. The basis for extensibility is a common message passing mechanism, and a shared address
space at run time. By convention, messages are passed to a message handler which has precautions for
“unexpected” messages [Marais 1995]. This allows for future extensions. To protect system stability,
shared memory access is type-safe across module boundaries. These means are provided by Oberon,
and it is up to any application to make use of it. Moreover, any functionality previously available can be
used for extensions. If previous code has been designed for re-usability, it can be integrated as a
component in new applications.
So far we have seen how Voyager is designed, how it is decomposed into components, and how it is
integrated into the Oberon system. Each Voyager component can be replaced by other implementations,
allowing considerable flexibility. We now turn to specific possibilities for extensibility opened in
Voyager, using the Oberon background. We already mentioned that modules loaded in Oberon stay
resident and their information is accessible if it is exported. If a module does not export its information,
it is closed and not available for extension. If information is exported, how can we use it for extension?
- 14 -30. Oct. 1995. Submitted to the Journal of Computational and Graphical Statistics
WWW entry point: http://statlab.uni-heidelberg.de. Comments to [email protected], please.
As an example, let us return to regression. We have shown a simple default regression output of
Voyager in Figure #. Suppose you want to illustrate the consequences of the choice of the level in a
classroom or consulting situation. Wouldn’t it be nice to have a means to vary the confidence level and
see how the confidence bands change? If you have the original code, of course you can change the
program. Let us for the sake of the example assume that this has been written long ago by someone else,
and you do not have access to the code. The standard Oberon command Browser.ShowDef lets you
inspect the exported types, variables and commands of a module. For the simple linear regression
module for example, you get
DEFINITION vyRegress;
IMPORT
vyTypes, Texts, Fonts, Files, vyBase;
CONST
idversion*="vyRegress v0r0a2";
TYPE
tConfidence*=PROCEDURE(Estimation: vyTypes.tData;
VAR ConfidenceSet: vyTypes.tData);
tEstimator*=PROCEDURE(Regressor, Response: vyTypes.tData;
VAR Estimation: vyTypes.tData);
VAR
level*: REAL;
PROCEDURE DoRegress*(response, regressor: vyTypes.tVector);
PROCEDURE Regress*;
PROCEDURE SetEstimator*(Estimator: tEstimator; Confidence: tConfidence);
END vyRegress.
Once you have identified that “level” in the regression module may be the variable of interest for you,
you can write a small program to modify it:
MODULE vyDemo;
IMPORT vyScanners, vyRegress;
VAR sc:vyScanners.Scanner;
PROCEDURE SetLevel*;
VAR x: REAL;
BEGIN vyScanners.OpenParScanner(sc);
IF vyScanners.ExpectReal(sc,x) THEN vyRegress.level := x;
vyRegress.Regress END;
END SetLevel;
BEGIN
END vyDemo.
This is a small Oberon module which can be written and compiled even while the regression is up -
remember that once an Oberon module is loaded, it is persistent unless explicitely unloaded. So the
regression module persists and all its information is preserved even while an editor or a compiler is
invoked. The second line declares that the module may make use of services of other previously existing
- 15 -30. Oct. 1995. Submitted to the Journal of Computational and Graphical Statistics
WWW entry point: http://statlab.uni-heidelberg.de. Comments to [email protected], please.
modules (vyTexts, In, vyRegress). [By convention, we use the prefix vy... for all Voyager modules at
the current state of development]. The fourth line contains the declaration of a procedure, SetLevel. The
star marks this procedure as exported, so it can be accessed from the outside. Since the procedure has no
explicit parameters, by convention it defines a command which can be called by executing
“vyDemo.SetLevel” in any text. It opens a scanner on the command text and tries to read a real number.
If it succeeds, it uses the number to set a new level for the imported module vyRegress, writes a
message reporting the new level, and redoes the regression. So the command SetLevel 0.99 may be just
what you want. If you want more, you may want a slider to control the level. Grab into the bag of
prepared components, take a slider and link it to the SetLevel command and you have taught the old
regression program new tricks, namely to have confidence bands at a level which can be controlled
dynamically by a slider.
If you want to have a different kind of simple regression, you can use SetEstimator to install a different
regression algorithm. The Oberon type support covers procedures as first class members, and the
Browser information shows the calling convention used for regression. If you supply a different
regression algorithm, you can plug it in. You get the scatter plot for response versus regressor with
overlaid regression curve and the residual plot for free. This is a generic display which comes with any
simple regression. Of course you do not get confidence sets for free - the Scheffé confidence bands of
the simple Gaussian model do not apply any longer, and you have to provide your own algorithm for
confidence sets - or a NIL value if you don’t have it. It would be risky to allow modification of the
regression algorithm without adapting the confidence sets algorithm. Hence no direct access to these is
allowed, but you are forced to use the installation procedure SetEstimator.
We have walked through this little examples in some detail to show how an extension can be made,
using Voyager and Oberon. These are simple examples, but they should convey the idea. If you can
augment a regression display to have controllable confidence bands, you get an idea what you can do in
other situations. Since the state of the modules is preserved and memory is shared, extensions can access
information from other modules, even if an extension is added at run time. Since the system is strictly
modular, all previously available functionalities can be used in the extension.
As a more complex illustration, we use some examples from work in progress, communicated by M.
Diller [Diller 1995], who is working on a system for the simulation of locally stationary time series using
Voyager. Since all the components used here are extension of Voyager objects, and Voyager has
knowledge of the dependency structure, we can use Voyager to get some insight in the structure of the
simulation: Voyager can display the dependency structure as a list, or as a graph. [Figure 10]
- 16 -30. Oct. 1995. Submitted to the Journal of Computational and Graphical Statistics
WWW entry point: http://statlab.uni-heidelberg.de. Comments to [email protected], please.
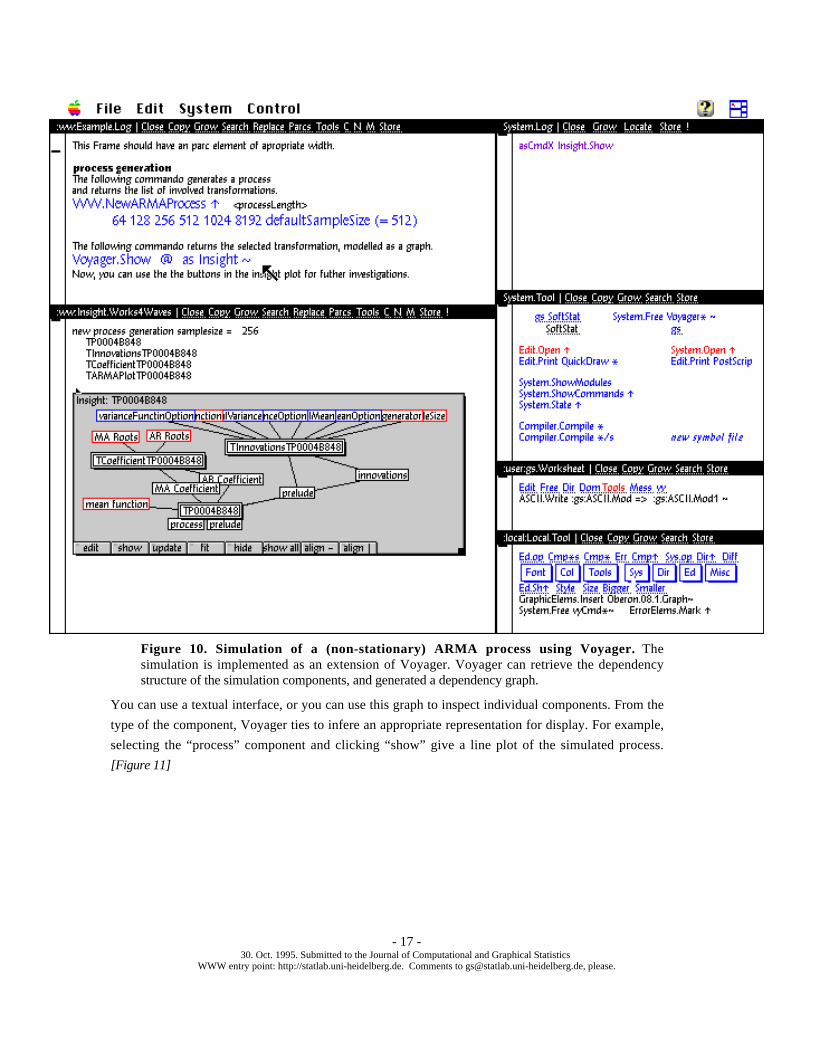
Figure 10. Simulation of a (non-stationary) ARMA process using Voyager. Thesimulation is implemented as an extension of Voyager. Voyager can retrieve the dependencystructure of the simulation components, and generated a dependency graph.
You can use a textual interface, or you can use this graph to inspect individual components. From the
type of the component, Voyager ties to infere an appropriate representation for display. For example,
selecting the “process” component and clicking “show” give a line plot of the simulated process.
[Figure 11]
- 17 -30. Oct. 1995. Submitted to the Journal of Computational and Graphical Statistics
WWW entry point: http://statlab.uni-heidelberg.de. Comments to [email protected], please.
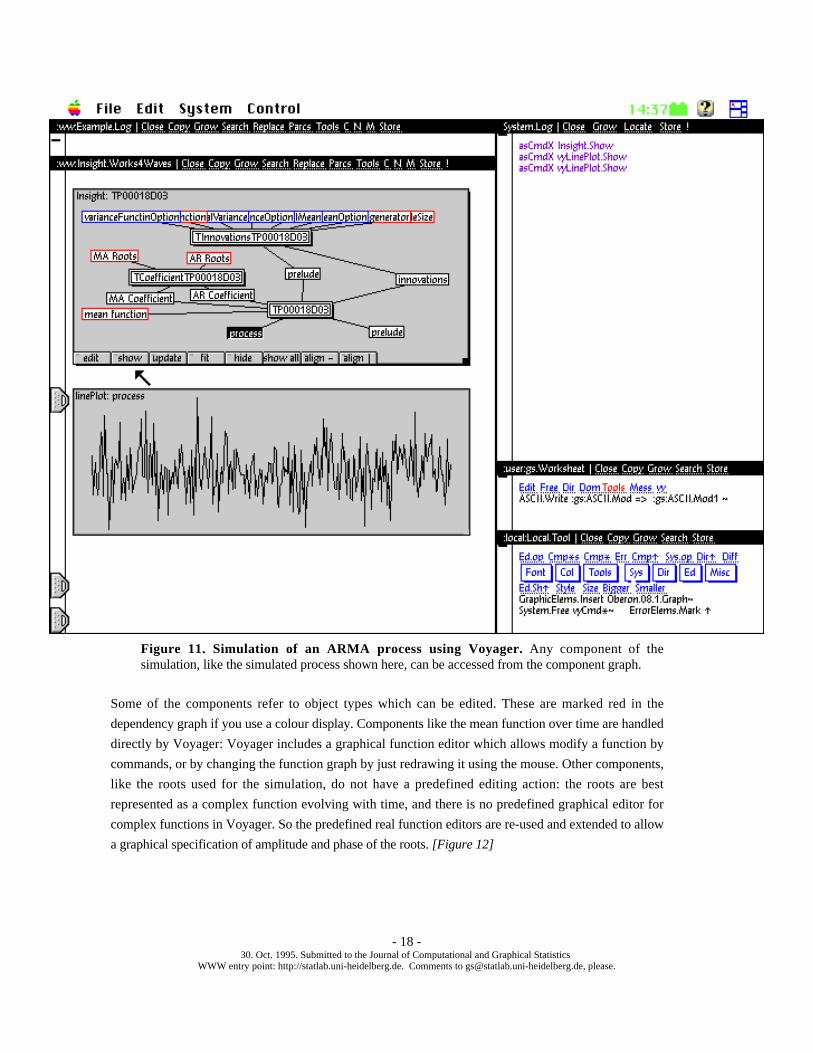
Figure 11. Simulation of an ARMA process using Voyager. Any component of thesimulation, like the simulated process shown here, can be accessed from the component graph.
Some of the components refer to object types which can be edited. These are marked red in the
dependency graph if you use a colour display. Components like the mean function over time are handled
directly by Voyager: Voyager includes a graphical function editor which allows modify a function by
commands, or by changing the function graph by just redrawing it using the mouse. Other components,
like the roots used for the simulation, do not have a predefined editing action: the roots are best
represented as a complex function evolving with time, and there is no predefined graphical editor for
complex functions in Voyager. So the predefined real function editors are re-used and extended to allow
a graphical specification of amplitude and phase of the roots. [Figure 12]
- 18 -30. Oct. 1995. Submitted to the Journal of Computational and Graphical Statistics
WWW entry point: http://statlab.uni-heidelberg.de. Comments to [email protected], please.
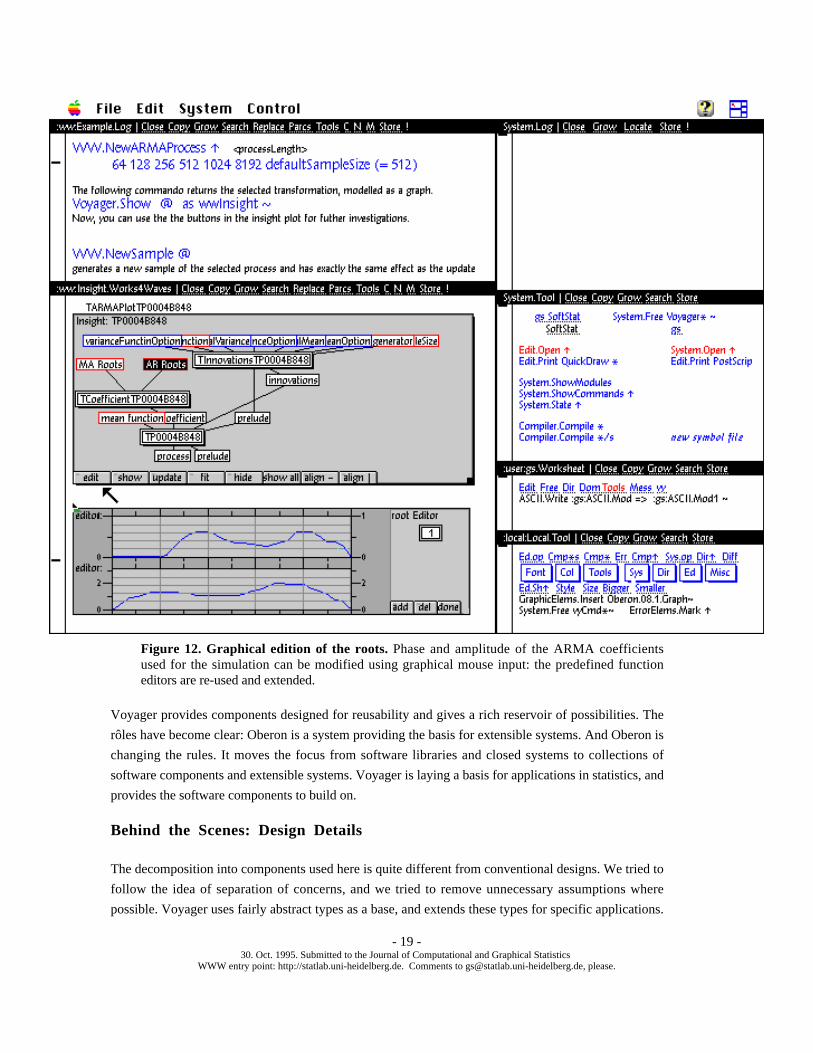
Figure 12. Graphical edition of the roots. Phase and amplitude of the ARMA coefficientsused for the simulation can be modified using graphical mouse input: the predefined functioneditors are re-used and extended.
Voyager provides components designed for reusability and gives a rich reservoir of possibilities. The
rôles have become clear: Oberon is a system providing the basis for extensible systems. And Oberon is
changing the rules. It moves the focus from software libraries and closed systems to collections of
software components and extensible systems. Voyager is laying a basis for applications in statistics, and
provides the software components to build on.
Behind the Scenes: Design Details
The decomposition into components used here is quite different from conventional designs. We tried to
follow the idea of separation of concerns, and we tried to remove unnecessary assumptions where
possible. Voyager uses fairly abstract types as a base, and extends these types for specific applications.
- 19 -30. Oct. 1995. Submitted to the Journal of Computational and Graphical Statistics
WWW entry point: http://statlab.uni-heidelberg.de. Comments to [email protected], please.
Although the design is object oriented, all computational routines are provided with a procedural
interface to invite migration from conventional procedural models to Voyager: if you prefer classical
procedural programming, you can use Voyager as a software library.
The Voyager object hierarchy is based on Items. An Item is a queuable object reference. It has an
administrative slot, called next, which may be used to link to the next Item in a queue, and it has two
informative slots, called o (for object) and handle.The “o” field is used to reference an object, and the
handle field is a generic slot to hold a message handling procedure. Items can be queued - various types
of queue handling are supported and actions can be iterated in an abstract way throughout queues. Items
are abstract objects. All functional semantics is to be defined by extensions. The Items type is defined to
have a convenient common base for the administration of objects.
Everything which needs administration is implemented as an instance of Item. Everything which is
worth an identity of its own is implemented as a Voyager Object. Voyager Objects are special cases of
Items. As descendants, or sub-classes, of the Item class Voyager Objects support all queuing and
housekeeping facilities by inheritance. Beyond this, Voyager Objects have an identity. They carry a
unique identification mark, they have a creation and modification time, and they may have a name and a
reference to dependent Object. The subscription mechanism described above is founded on the Voyager
Object level. So it is possible to say “mark this Object as updated, and notify all other objects depending
on this one”. Elementary actions like “clone”, “write yourself to a file”, “load from file” are defined for
all Object. However Objects, like items, are abstract classes. Functional semantics is still to be defined.
Usually, names are considered essential for the identification of objects. We have separated names from
object identification. In Voyager, a name is but a user-defined reference to an object. Object
identifications are handled by Voyager base, which has to guarantee unique identification. Names are
handled by the names and command component, which has to do its best to resolve names and to find a
corresponding object, possibly asking the user for more specific indications. It has to resolve possible
ambiguities in a cooperative way and to inform the user if a name cannot be resolved reliably. But it may
not try to control the user’s preferences how to assign or use names. You can have various naming
systems, even concurrently, operating on the same basic object management. This allows to have a
generic naming system (such as using Var[5]) along with various explicit naming systems (v, speed,
speed [km/h]) for the same data. In particular, it is possible to “anonymize” data by using a randomized
data base instead of the true name data base.
Data are special objects. The Data type is a descendant of the Voyager Objects type. It inherits all the
administrative possibilities of Objects, and indirectly all the housekeeping facilities available for Items.
Beyond this, logical and arithmetic operations are defined for Data. Following the Oberon conventions,
this does not imply that Data actually execute this operations. A status field reflects any error code
which may have occurred, such as “operation not implemented” or “type inappropriate”. Data are
abstract objects. One particular concrete extension is Vectors. Vectors hold an ordered list of entries
(data) of one type. The public interface includes set/get operations for elements, and a variety of
arithmetic operations. The storage representation of Vectors is kept internal, allowing for sparse
representations, external storage and other variants. Data need not always be imported to some internal
- 20 -30. Oct. 1995. Submitted to the Journal of Computational and Graphical Statistics
WWW entry point: http://statlab.uni-heidelberg.de. Comments to [email protected], please.
format, and sometimes may not even be on your local machine. A critical burden may be to assume that
you know where your data are, and how they are stored. Assumptions of this kind should be avoided.
Part of the data may be best represented by some generating rule (like for design matrices), or just by a
reference on how to fetch the data if you really need them. The idea that all data are always present on
your local machine as a table is obsolete - think of a distributed computing environment, where the data
may come in from remote sources, possibly not synchronized.
A special component of Voyager is dedicated to the access and presentation of data. An obvious variant
of this is a reader/writer which handles ASCII files with tables, but this is just one special variant. An
agent cooperating with a data base management system may be a more natural replacement in other
situations. Introducing data access as a separate component and delaying representation in a specific
format as late as possible imposes some overhead, but it is prone to reveal some information which
otherwise is easily hidden. For example, it was a natural consequence to introduce a scanner module
which can be accessed directly: For the implementation of an ASCII reader/writer for example we had to
make some scanner information accessible in a well defined way. The information comes in as patterns
in an ASCII stream first. As a consequence, detailed information about the input stream is available from
the scanner.
To illustrate the benefit, we take the well-known stack loss data set, which has been widely used as an
illustration in robust statistics [Dodge 1994]. The data set has been useful to illustrate that the result of an
analysis may critically depend on some few data cases (as well as on the choice of method). Most
published analysis of this data set rely on a model with a continuous error distribution. The first
information about this data set returned by Voyager is a mere reflection of the rectangular structure of the
data file. Next, ahead of any statistical analysis, Voyager can give more detailed information about this
data set. In this example, Voyager draws the attention to the fact that all variables – including the loss,
which is the response in this example – are heavily discretized, and that the rate follows a pattern which
suggests that a systematic experiment has taken place. For any data analysis, this is essential initial
information which should be taken into account in the analysis. Any statistical system could supply this
information, but in most systems considerable effort is necessary to get it. We do not know how many
references to the stack loss data set have taken into account the simple fact that all values in this data set
are strongly discretized or rounded. [Figure 13]
- 21 -30. Oct. 1995. Submitted to the Journal of Computational and Graphical Statistics
WWW entry point: http://statlab.uni-heidelberg.de. Comments to [email protected], please.
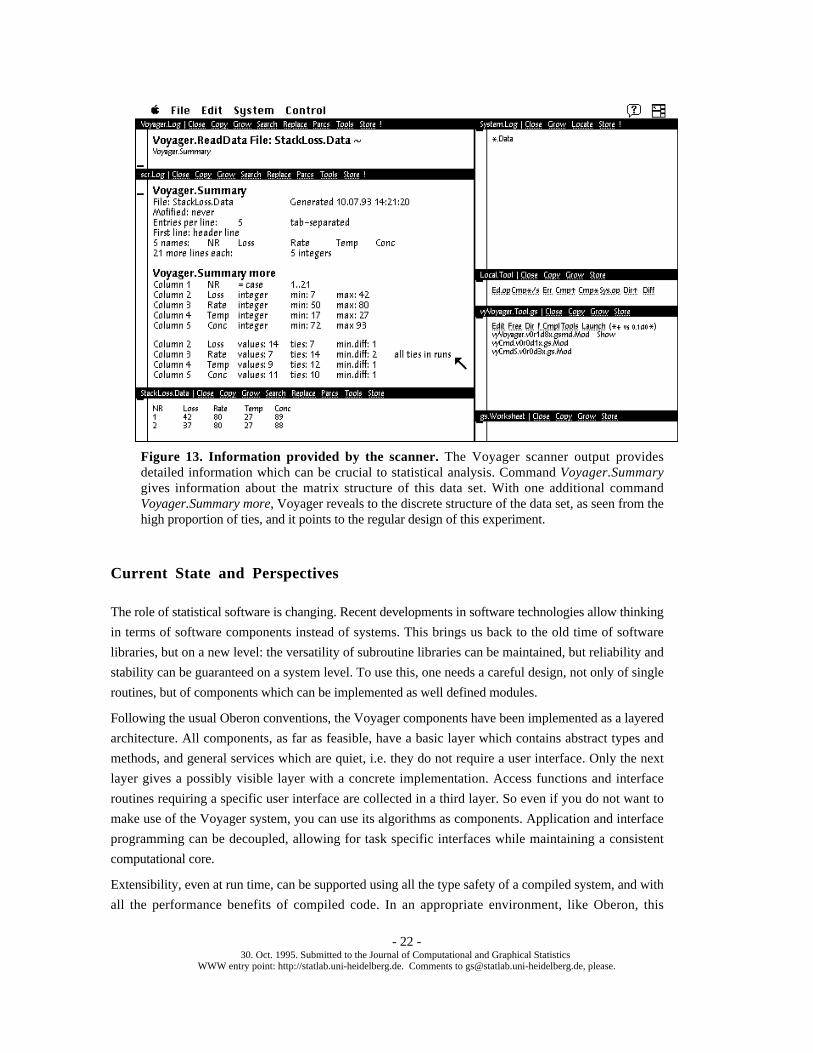
Figure 13. Information provided by the scanner. The Voyager scanner output providesdetailed information which can be crucial to statistical analysis. Command Voyager.Summarygives information about the matrix structure of this data set. With one additional commandVoyager.Summary more, Voyager reveals to the discrete structure of the data set, as seen from thehigh proportion of ties, and it points to the regular design of this experiment.
Current State and Perspectives
The role of statistical software is changing. Recent developments in software technologies allow thinking
in terms of software components instead of systems. This brings us back to the old time of software
libraries, but on a new level: the versatility of subroutine libraries can be maintained, but reliability and
stability can be guaranteed on a system level. To use this, one needs a careful design, not only of single
routines, but of components which can be implemented as well defined modules.
Following the usual Oberon conventions, the Voyager components have been implemented as a layered
architecture. All components, as far as feasible, have a basic layer which contains abstract types and
methods, and general services which are quiet, i.e. they do not require a user interface. Only the next
layer gives a possibly visible layer with a concrete implementation. Access functions and interface
routines requiring a specific user interface are collected in a third layer. So even if you do not want to
make use of the Voyager system, you can use its algorithms as components. Application and interface
programming can be decoupled, allowing for task specific interfaces while maintaining a consistent
computational core.
Extensibility, even at run time, can be supported using all the type safety of a compiled system, and with
all the performance benefits of compiled code. In an appropriate environment, like Oberon, this
- 22 -30. Oct. 1995. Submitted to the Journal of Computational and Graphical Statistics
WWW entry point: http://statlab.uni-heidelberg.de. Comments to [email protected], please.
extensibility can be system wide, allowing a seamless integration of statistical software into a general
computing environment.
Todays software technologies gives a basis to develop extensible and portable systems for statistics and
data analysis. Reliability in an extensible environment is the major challenge. How this challenge can be
met depends on the software tools and environment chosen in a first step. The choice of tools and
environment is free first, but to guarantee stability and extensibility, the implementer has to pay after-
wards for the choice taken. In an Oberon environment, system wide garbage collection, fine grained
modularity and type safety across module boundary take care of many tasks which otherwise have to
handled ad hoc. This gives a sound foundation for an extensible system.
Acknowledgements
Like all software products, Voyager is a result of many contributions. In particular, comments by R.
Becker, B. Cleveland, L. Dümbgen, J. Marais, A. Unwin and A. Wilks have been helpful. Voyager has
been inspired by ideas and examples seen in Data Desk [Velleman 1992], Regard [Unwin 1994],
Diamond Fast [Unwin and Wills 1988] and in the Medas proposal [Biehler 1994]. The Voyager graphics
system has been developed by M. Diller with support of F. Friedrich.
Literature:
Becker, R.A., Cleveland, W.S., Wilks, A.R. (1987), “Dynamic Graphics for Data Analysis,” (with
discussion), Statistical Science, 2, 355-395.
Biehler, R. (1994), “Towards Requirements for More Adequate Software Tools That Support Both:
Learning and Doing Statistics,” presented at the Fourth International Conference on
Teaching Statistics (ICOTS 4) Marrakech, Morocco, 25-30 July 1994. Manuscript.
Bielefeld.
Diller, M. (1995), personal communication.
Dodge, Y (1995), “The Guinea Pig of Multiple Regression” in: H. Rieder (ed.). The Huber
Festschrift.To Appear:. Springer: Heidelberg 1995
Franz, M. (1993), “Emulating an Operating System on Top of Another,” Software–Practice and
Experience, 23, 677-691.
Gutknecht, J. (1993), Oberon System 3 - A realm of Persistent Objects, preprint, ETH Zürich
<ftp://ftp.inf.ethz.ch/pub/Oberon/System3>.
Knasmüller, M. (1994), Oberon Dialogs, technical report, Universität Linz.
Marais, J. (1994), “Oberon System 3,” Dr.Dobb’s Journal, 220, 42-50.
Marais, J. (1995) The Gadgets Guide, ETH Zürich.
Marais, J. (1995a), “Extensible Software Systems in Oberon,” manuscript, ETH Zürich, submitted to
- 23 -30. Oct. 1995. Submitted to the Journal of Computational and Graphical Statistics
WWW entry point: http://statlab.uni-heidelberg.de. Comments to [email protected], please.
JCGS
Mössenböck, H.; Wirth, N. (1991), “The Programming Language Oberon-2,” Structured
Programming, 12.
Pfister, C. et al. (1994), Oberon/F, Basel: Oberon microsystems.
Reiser, M. (1991), The Oberon System, Reading: Addison-Wesley.
Reiser, M.; Wirth, N. (1992), Programming in Oberon, Reading: Addison-Wesley.
Sawitzki, G. (1994), “A Portable, Object-Oriented Extensible Statistical Programming Environment
based on Oberon,” in: R. Dutter, W. Grossmann (eds.) Proceedings in Computational
Statistics (Compstat 1994) pp. 158-159. Complete manuscript available as
<file://statlab.uni–heidelberg.de/pub/Voyager/Compstat.ps> or <... .ps.gz>.
Sawitzki, G. (1994a), “Diagnostic Plots for One-Dimensional Data,” in: P.Dirschedl & R.Ostermann
(eds.) Computational Statistics, Papers collected on the Occasion of the 25th Conference
on Statistical Computing at Schloss Reisensburg. Heidelberg, Physica, 1994, ISBN 3-
7908-0813-X, pp. 234-258.
Unwin, A.R., and Wills, G. (1988), “Eyeballing Time Series,” Proceedings of the 1988 ASA
Statistical Computing Section, 263-268.
Unwin, A.R. (1994), “REGARDing Geographic Data,” in: P.Dirschedl & R.Ostermann (eds.)
Computational Statistics, Papers collected on the Occasion of the 25th Conference on
Statistical Computing at Schloss Reisensburg. Heidelberg, Physica, 1994, ISBN 3-
7908-0813-X, 345-354.
Velleman, P.F. (1992), Data Desk, Ithaka New York: Data Description.
Wirth, N.; Gutknecht, J. (1989), “The Oberon System,” Software–Practice and Experience, 19,
857–893.
Wirth, N.; Gutknecht, J. (1992), Project Oberon, Reading: Addison-Wesley.
Wirth, N. (1988), “The Programming Language Oberon,” Software–Practice and Experience, 18, 671-
690.
- 24 -30. Oct. 1995. Submitted to the Journal of Computational and Graphical Statistics
WWW entry point: http://statlab.uni-heidelberg.de. Comments to [email protected], please.