Extending the Aquarius Data Acquisition, Analysis & Notification Systems
25
Aquarius Insider Event October 2015 Vancouver, BC, Canada. © Hatfield Consultants. All Rights Reserved. Extending the Aquarius Data Acquisition, Analysis & Notification Systems
-
Upload
hatfield-consultants -
Category
Science
-
view
374 -
download
0
Transcript of Extending the Aquarius Data Acquisition, Analysis & Notification Systems

Aquarius Insider EventOctober 2015
Vancouver, BC, Canada.
© Hatfield Consultants. All Rights Reserved.
Extending the Aquarius Data Acquisition, Analysis & Notification Systems

› Hatfield has provided environmental and geo-informatics services to industry and government for over 40 years
› 3,000 projects completed in over 40 countries
› 150 professional staff in offices in Canada, Southeast Asia, and Africa
› Recipient of awards for:› Corporate Social Responsibility› International Development Services› Linear Development Services
› ISO 9001:2000 certified
© Hatfield Consultants. All Rights Reserved. 2
About Hatfield

About Hatfield

Slide 4© Hatfield Consultants. All Rights Reserved.
Sectors of Focus
Hatfield has experience in multiple sectors related to natural resource
development and environmental management.

Selected Service Areas› Water Resources Management
– Hydrometric, water quality and climate data integration systems
– Design and installation of climate and hydrometric station networks
– All-season streamflow and lake-level monitoring
– Hydrological data management and analysis
– Flood mapping, historical analysis and model integration
– Water-resource assessment and reporting
– Basin-level environmental monitoring & management
› Geo-informatics– Decision support systems (land, ice, snow,
aquatic)– Satellite Remote Sensing – GIS and mapping– Community based monitoring platforms– Environmental data interoperability and
exchange systems– Stakeholder engagement platforms– Web-GIS mapping and analysis systems– Satellite data integration and analysis
platforms

EXTENDING THE AQUARIUS DATA ACQUISITION, ANALYSIS & NOTIFICATION SYSTEMS
© Hatfield Consultants. All Rights Reserved. 6
Motivations
› Long-time users of AQUARIUS (since 2009)› Aquarius does a lot of wonderful things, we just
want it to do more!› We are integrators and love APIs
© Hatfield Consultants. All Rights Reserved. 7

Motivations› Data acquisition:
– AQUARIUS hot folders previously had performance issues with large amounts of data
– EnviroSCADA was too heavy– Needed something as easy as hot-folders
that provided higher performance and could be configured by non-IT staff
© Hatfield Consultants. All Rights Reserved. 8

Motivations› Data Analysis:
– Needed to go beyond the aggregate and statistical functions that are available in Aquarius
– Inter-station comparisons
› Notifications:– Needed to send notifications based on values
calculated on-the-fly without needing to store intermediate timeseries
– Needed SMS notifications sent-to field staff for immediate action
– Tie notifications to events/results in the extended data analysis system
© Hatfield Consultants. All Rights Reserved. 9

System Architecture
© Hatfield Consultants. All Rights Reserved. 10

Extended Data Acquisition System
Provides a configurable, easy to manage user interface to allow users to set up data import profile for various external data sources›High frequency data import capabilities›Various external data sources, including web services, FTP sites, network file shares
– Sutron, GOES, Optimum, etc
›Easy to extend for new data providers/sources›End-user configurable through web-interface
© Hatfield Consultants. All Rights Reserved. 11

© Hatfield Consultants. All Rights Reserved. 12
› Example web-interface for managing data importer

Extended Analysis and NotificationSystemsAllow users to set up “Analysis chains” to manage analysis functions and resulting notifications›Managed via a web interface›Triggered by user commands, or run periodically (a scheduled task)
– Not run on data append
›Can result in a notification›Chaining allow for multiple analysis to be run sequentially
© Hatfield Consultants. All Rights Reserved. 13

Extended Analysis & Notification System Functions› Aggregate calculations
– If 24 hours cumulative precipitation is greater-than 10mm, send an alert
› Cross station calculations– Compare TSS at station A to baseline station. Send alert if
difference is > X
› Generic Excel-like calculations– If “Max(12 Hour(s) pH.pH - 15 minute@APC) < 8” send a
notification
Alerts and notification:– Send out different notifications according to calculation results– Email and SMS notifications
© Hatfield Consultants. All Rights Reserved. 14

© Hatfield Consultants. All Rights Reserved. 15
› Example web-interface for managing a data analysis chain

© Hatfield Consultants. All Rights Reserved. 16
› Example web-interface for managing a data analysis chain

© Hatfield Consultants. All Rights Reserved. 17
› Example web-interface for managing a data analysis chain

© Hatfield Consultants. All Rights Reserved. 18
› Example web-interface for managing a data analysis chain

Example Implementations
› These extended tools currently manage:– Over 150 stations– Over 600 data series – Data series duration between 1-20 years
› Oil sands, oil and gas, mining, power generation, government clients
© Hatfield Consultants. All Rights Reserved. 19

Example Implementation
Alberta Oil Sands Construction Monitoring Project›Collect turbidity data from three telemetry-connected stations
– 100m upstream (reference)– 50m downstream, – 100m downstream
›Data received initially by Sutron›Extended data acquisition system retrieves data via web-service calls, imports data into Aquarius via API
© Hatfield Consultants. All Rights Reserved. 20

Example Implementation
© Hatfield Consultants. All Rights Reserved. 21

Example Implementation› Convert Turbidity to TSS in AQUARIUS Server
– Convert by rating curve– Send out notification
› Applied extended analysis– for clear flow – TSS should not increase by more than 25 mg/L
over background levels for any short-term exposure (i.e., 24-hour period) or 5 mg/L for longer term exposures (i.e., between 1 and 30 days);
– for high flows – maximum TSS increase of 25 mg/L above reference levels at any time when reference levels are between 25 and 250 mg/L and should not increase more than 10% when background levels are more than 250 mg/L
© Hatfield Consultants. All Rights Reserved. 22

Example Implementation – End result
› Near real-time data available on custom web-portal– Both raw data and analysis data available online in near
real time– Data could be visualized as graph or exported as Excel file
› Notifications:– Field crews able to respond within 15 minutes when water
quality excess of regulatory standards– Station support staff received no-data alerts when data
stations went down
© Hatfield Consultants. All Rights Reserved. 23
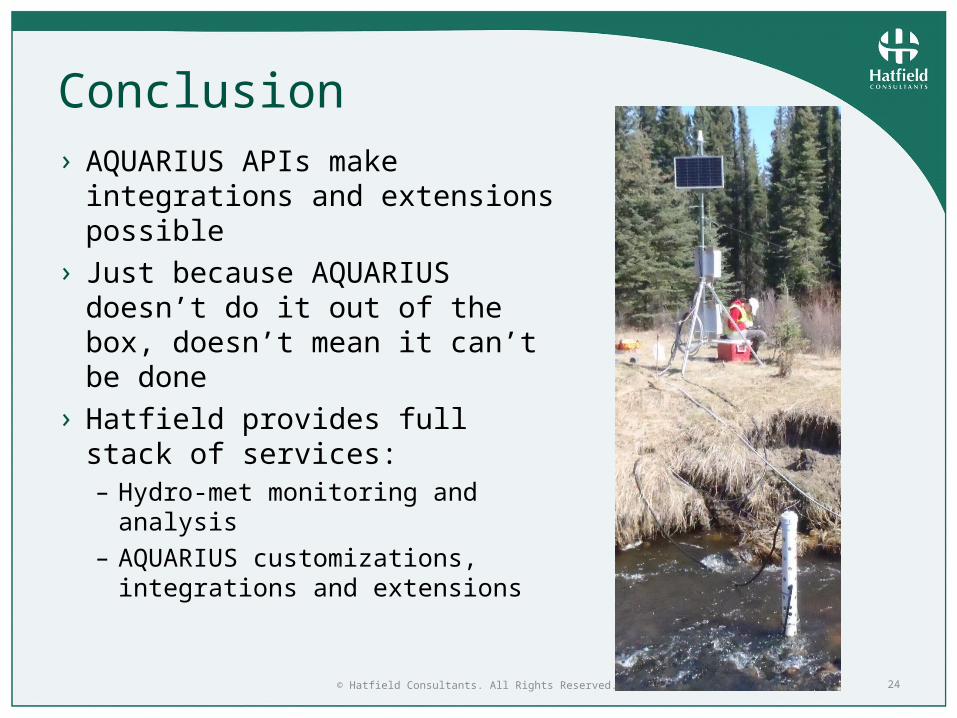
Conclusion› AQUARIUS APIs make integrations
and extensions possible› Just because AQUARIUS doesn’t
do it out of the box, doesn’t mean it can’t be done
› Hatfield provides full stack of services:– Hydro-met monitoring and analysis– AQUARIUS customizations,
integrations and extensions
© Hatfield Consultants. All Rights Reserved. 24