Responsiveness to Intervention (RTI): Identifying - RTIm Direct

Learning Disabilities Research & Practice, 22(1), 13–24C© 2007 The Division for Learning Disabilities of the Council for Exceptional Children
Extending Responsiveness to Intervention to Mathematicsat First and Third Grades
Lynn S. Fuchs, Douglas Fuchs, and Kurstin N. Hollenbeck
Vanderbilt University
Responsiveness to intervention (RTI) is an innovative approach to the identification of learningdisabilities (LD). The central assumption is that RTI can differentiate between two explanationsfor low achievement: poor instruction versus disability. If the child responds poorly to validatedinstruction, then the assessment eliminates instructional quality as a viable explanation for pooracademic growth and instead provides evidence of a disability. For children who do respondnicely, RTI serves a critical prevention function. Most of RTI research has been focused onearly reading. In this article, we describe two ongoing programs of research on RTI in the areaof mathematics: one on a comprehensive mathematics curriculum at first grade and the otherfocused on word problems at third grade. For each research program, we describe the sample,explain how students are identified as at risk for mathematics disability, provide an overviewof the interventions to which responsiveness is gauged, and describe some results to date.
Since it first became an official category of disability in the1975 federal law, the number of students with learning dis-abilities (LD) has been steadily increasing. At the presenttime, approximately 6 percent of the school-age populationis identified as having LD. This represents an increase ofmore than 1.6 million children so identified between 1979and 2000 (U.S. Department of Education, 2000). Given thecosts of providing special education services, concern hasgrown over increasing prevalence, and attention has focusedon the method for identifying these students. In fact, the dom-inant approach involving a discrepancy between intelligenceand achievement has been discredited by some professionalsdue to a variety of conceptual and technical difficulties (seeVaughn & Fuchs, 2003, for a summary).
For this reason, in 1999, the Office of Special EducationPrograms in the U.S. Department of Education initiated aprocess for reconsidering LD identification. White papersrepresenting alternative perspectives on identification werecommissioned, and an LD Summit was convened. Based onthe Summit papers, formal responses, and stakeholder input,a panel of prominent thinkers in the field of LD issued aconsensus statement expressing support for reorienting LDidentification to “responsiveness to intervention” (RTI) (seeBradley, Danielson, & Hallahan, 2002). As a result, the 2004reauthorization of the Individuals with Disabilities EducationAct formally permits the use of RTI as an alternative to adiscrepancy between intelligence and achievement.
As a framework for identifying students with LD, RTI wasconceptualized originally by Heller, Holtzman, and Messick(1982). As subsequently operationalized (e.g., Fuchs, 1995;Fuchs & Fuchs, 1998; Vellutino et al., 1996), the premise isthat students are identified as learning disabled when their
Requests for reprints should be sent to Lynn S. Fuchs, 328 Peabody,Vanderbilt University, Nashville, TN 37203. Electronic inquiries may besent to [email protected].
response to validated educational intervention is dramati-cally inferior to that of peers. The inference is that childrenwho respond poorly to generally effective interventions havea disability that requires specialized treatment. In this way,a central assumption is that RTI can differentiate betweentwo explanations for low achievement: poor instruction ver-sus disability. If the child responds poorly to instruction thatbenefits most students, then the assessment eliminates in-structional quality as a viable explanation for poor academicgrowth and, instead, provides evidence of a disability. Be-cause most children respond positively to validated interven-tion, RTI also serves a critical prevention function. In thisarticle, we adopt these assumptions with the recognition thatresearch on the RTI process is only beginning and, as mightbe expected, some researchers and practitioners subscribe tothese assumptions; others do not. In fact, many believe thatRTI is only one part of a viable identification procedure, andthe federal law requires a comprehensive evaluation.
Most RTI models of LD identification are embeddedwithin a multitier prevention system. General education isconsidered primary prevention, and students who enter theRTI LD identification process must first show evidence offailing to respond to the universal core program. When suchfailure is documented, secondary prevention occurs, whichin most research studies involves the administration of scien-tifically validated small-group tutoring. Students who showpoor response to this second and more intensive form of in-tervention are considered to have demonstrated “unexpectedfailure” to the validated intervention. They then undergo thecomprehensive evaluation, designed to answer questions thatarose during primary and secondary prevention and to elimi-nate other forms of disability as a cause for failure (if anotherdisability is suspected). Tertiary prevention is the most inten-sive form of instruction and involves individualized program-ming, along with progress monitoring to determine whenadequate response warrants a return to secondary or primary
14 SPECIAL ISSUE: MATHEMATICS INSTRUCTION
prevention. In this way, RTI has two goals: (1) to identify riskearly so that students may participate in prevention servicesprior to the onset of severe deficits, which can be difficult toremediate and (2) to identify the subset of students who areunresponsive to validated intervention at secondary preven-tion and instead require an individualized form of instructionthat can be provided via special education.
For reading disability, RTI as a method of identificationhas undergone study. Vellutino and colleagues (1996) identi-fied children with early signs of reading problems, as judgedby their first-grade teachers, and provided individual dailytutoring to a subset of these poor readers for 16 weeks. Theresearchers estimated each child’s reading growth and, on thatbasis, classified the tutored children by degree of responsive-ness. Describing one group of children as difficult to remedi-ate, Vellutino et al. argued that treatment response provides ameans for distinguishing between disabled and nondisabledlearners. This research, together with related studies (e.g.,Speece & Case, 2001), lends tentative support to an RTI ap-proach to identifying LD in reading.
In mathematics, less work has been conducted, and thefocus has been narrow. That is, studies have addressed onlybasic facts or simple computation, using drill and practicefor brief intervention. VanDerHeyden and Witt (2005), forexample, screened first and second graders in one school us-ing basic fact assessments. With the subset of children whoscored poorly, the researchers conducted nine practice ses-sions with feedback and reinforcement to increase basic factfluency. On this basis, they identified nonresponders and ex-amined decision utility with respect to final outcomes. In asimilar manner, Ardoin, Witt, Connell, and Koenig (2001)conducted screening and brief classwide practice on basicfacts and simple computation in two fourth-grade classrooms.At the end of practice, they identified five students whoseperformance remained discrepant from classmates, and thenclassified nonresponders to another, similar intervention thatwas administered individually.
These studies are important, but they are also restrictedin terms of the scope of the mathematics curriculum (i.e.,fact fluency and simple computation), and they rely on a nar-row approach to math intervention (i.e., practice). Researchis needed that incorporates other major components of themathematics curriculum, a sustained approach to interven-tion that addresses the development of new skills, randomassignment to explore the efficacy of the intervention to whichresponsiveness is gauged, and more classrooms to representthe varying quality of classroom math instruction.
With this in mind, we have designed and conducted tworesearch programs. The first targets RTI at first grade, withfour purposes: (1) to assess the efficacy of secondary preven-tative small-group tutoring, (2) to explore the utility of variousscreening and progress-monitoring procedures for forecast-ing math disability through fourth grade, (3) to examine theprevalence, severity, sensitivity, and specificity of RTI meth-ods for designating lack of response to secondary prevention(and thereby designating math disability), and (4) to inves-tigate the cognitive predictors of math development acrossfirst grade and then predicting out through fourth grade.The second program of research focuses on RTI at thirdgrade, this time exclusively with respect to word-problem
skill. The aims of the second program are: (1) assessing theefficacy of validated primary intervention, with and with-out secondary preventative small-group tutoring, (2) deter-mining whether word-problem skill is the same constructas calculation competence or instead represents a separateaspect of mathematical cognition, (3) examining the preva-lence of math problem-solving disability, with and withoutdisability in the area of calculations and as a function of in-tervention, and (4) investigating the cognitive predictors ofword-problem and calculation skill at third, fourth, and fifthgrades.
In this article, we describe these programs of researchon RTI in the area of mathematics, both of which are on-going. For each research program, we describe the sample,explain how students were identified as at risk for mathe-matics disability, provide an overview of the interventions towhich responsiveness is gauged, and describe some results todate.
RTI IN MATHEMATICS AT FIRST GRADE
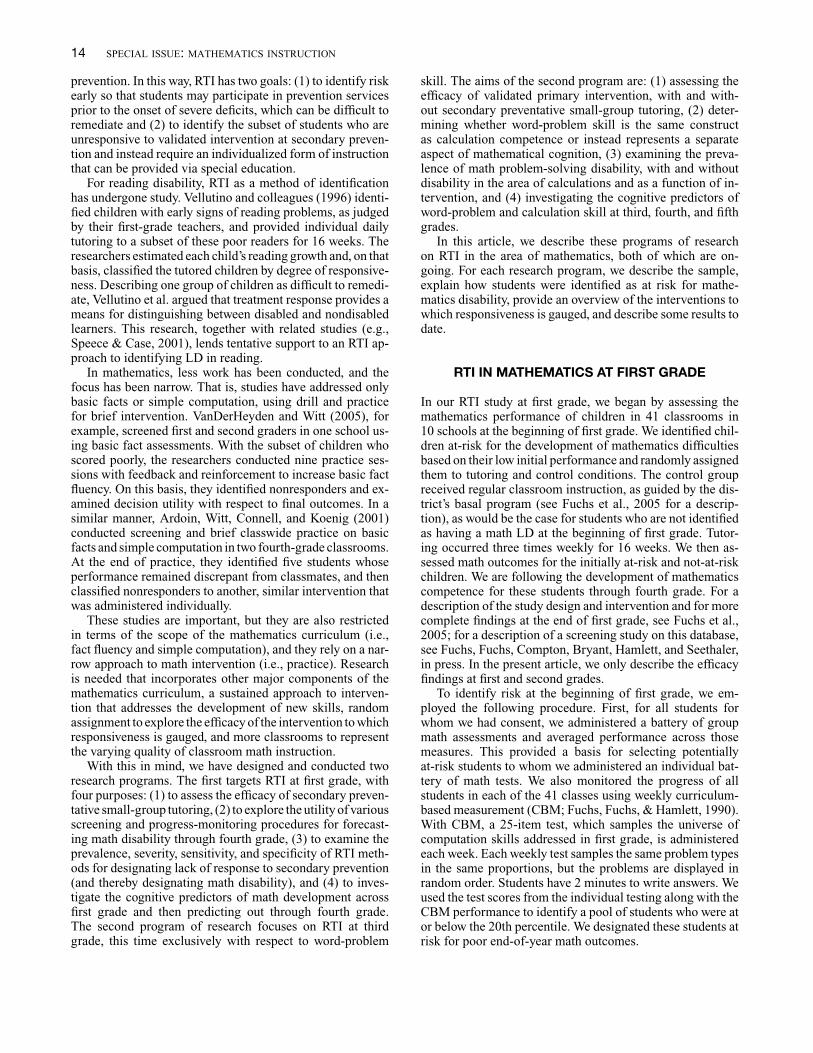
In our RTI study at first grade, we began by assessing themathematics performance of children in 41 classrooms in10 schools at the beginning of first grade. We identified chil-dren at-risk for the development of mathematics difficultiesbased on their low initial performance and randomly assignedthem to tutoring and control conditions. The control groupreceived regular classroom instruction, as guided by the dis-trict’s basal program (see Fuchs et al., 2005 for a descrip-tion), as would be the case for students who are not identifiedas having a math LD at the beginning of first grade. Tutor-ing occurred three times weekly for 16 weeks. We then as-sessed math outcomes for the initially at-risk and not-at-riskchildren. We are following the development of mathematicscompetence for these students through fourth grade. For adescription of the study design and intervention and for morecomplete findings at the end of first grade, see Fuchs et al.,2005; for a description of a screening study on this database,see Fuchs, Fuchs, Compton, Bryant, Hamlett, and Seethaler,in press. In the present article, we only describe the efficacyfindings at first and second grades.
To identify risk at the beginning of first grade, we em-ployed the following procedure. First, for all students forwhom we had consent, we administered a battery of groupmath assessments and averaged performance across thosemeasures. This provided a basis for selecting potentiallyat-risk students to whom we administered an individual bat-tery of math tests. We also monitored the progress of allstudents in each of the 41 classes using weekly curriculum-based measurement (CBM; Fuchs, Fuchs, & Hamlett, 1990).With CBM, a 25-item test, which samples the universe ofcomputation skills addressed in first grade, is administeredeach week. Each weekly test samples the same problem typesin the same proportions, but the problems are displayed inrandom order. Students have 2 minutes to write answers. Weused the test scores from the individual testing along with theCBM performance to identify a pool of students who were ator below the 20th percentile. We designated these students atrisk for poor end-of-year math outcomes.

FUCHS, FUCHS, AND HOLLENBECK: MATH RTI 15
Secondary prevention involved tutoring and computerpractice for a total of 40 minutes per session. Tutoring oc-curred in groups of two to three students, three times perweek for 20 weeks, each time for 30 minutes. At the end ofeach session, students worked individually for an additional10 minutes on software designed to promote automatic re-trieval of math facts.
Small-group tutoring (Paulsen & Fuchs, 2003) was basedon the concrete-representational-abstract method for teach-ing math (Butler, Miller, Crehan, Babbitt, & Price, 2003;Cass, Cates, Smith, & Jackson, 2003; Mercer, Jordan, &Miller, 1996). This model relies on concrete objects to pro-mote conceptual learning. Lessons followed a sequence of17 scripted topics, and each topic included activities that re-lied on worksheets and manipulatives (e.g., base-10 blocksfor place value instruction). Thirteen topics were each ad-dressed with three lessons; the remaining four topics wereeach addressed with six lessons. Mastery of the topic wasassessed each day. If every student in the group achievedmastery prior to the last day on the topic, the group moved tothe next topic (a few topics required completion of all days).For mastery assessment, students completed worksheets in-dependently during the session; percentage of correct answersdetermined mastery (for most topics, 90 percent accuracy).After the last day on a topic, the group progressed to the nexttopic regardless of mastery status. On the first day of eachtopic, students completed a cumulative review worksheetcovering previous topics. Throughout each tutoring session,tutors awarded points to students for appropriate behavior.As point sheets were completed, students traded points forprizes.
During the final 10 minutes of each intervention session,students used software, Math FLASH (Fuchs, Hamlett, &Powell, 2003), designed to promote automatic retrieval ofmath facts. With FLASH, the computer briefly shows a mathfact. After the fact disappears, the student types the fact intothe computer. When the student types the fact correctly, (1)the student’s typed fact remains on the screen, (2) the com-puter says the fact aloud, and (3) the computer applauds andawards points. Every five points translates into a prize (e.g.,image of a puppy, candy, sun), which accumulate in a treasurebox at the bottom of the screen. When the student types thefact incorrectly, the student’s typed fact disappears, and thecomputer shows and says the correct fact; then, the studenttypes it correctly. No applause or point is awarded. When afact is completed, another flashes. The duration of the flashdepends on the student’s performance during the session (ifthe student fails several items, the duration increases). Atthe session’s end, the computer shows the number of correctitems for the session and the highest level of mastery attainedacross sessions.
The program targets fact families (e.g., 1 + 2 = 3, 2 + 1 =3, 3 − 1 = 2, 3 − 2 = 1), beginning with smaller familiesand becoming more difficult as families are mastered. Factsalready classified as mastered reappear periodically for cu-mulative review. Each student’s level of mastery is saved, andthe student continues the next session where the previous ses-sion left off. In this study, addition and subtraction facts withanswers to nine were included. (Math FLASH has undergonea series of revisions since this first-grade study.)
To date, findings supported the efficacy of the secondarypreventative tutoring on computation, concepts and appli-cations, and story problems, where the improvement of theat-risk tutored students exceeded that of the at-risk controlgroup. Moreover, depending on the measure (e.g., commer-cial achievement tests that assess across grade levels vs.first-grade measures that sample more behavior; computationvs. problem solving; see Fuchs et al., 2005, for a completeset of measures), the growth of the at-risk tutored studentswas either comparable or superior to that of their not-at-riskclassmates. These results support the premise that first-gradeintervention can be effective in promoting stronger math out-comes. This suggests the promise of first-grade RTI to reducemathematics difficulty on key aspects of performance and toserve as a test within an RTI framework for identifying LDin mathematics.
Importantly, however, we also assessed math LD preva-lence (i.e., the percentage of students who met various defini-tions of LD) and severity (i.e., the magnitude of performancedifferences between at-risk students who were versus at-riskstudents who were not identified as having an LD), as it devel-ops with and without preventive tutoring and as a function ofalternative ways of defining the phenomenon, including RTIoptions, on a variety of math outcomes. Findings demon-strated that secondary prevention did in fact reduce the rateof identifying math LD at the end of first grade. Across the 16methods we employed to determine math LD (e.g., traditionalIQ-achievement discrepancy at the end of first grade; lowachievement at the end of first grade; poor rate of improve-ment during first grade; see Fuchs et al., 2005, for a descrip-tion of the 16 methods), secondary prevention reduced mathLD by a mean of 35.64 percent. For example, take one RTImethod for designating math LD, where students are consid-ered to have a math LD if their achievement at the end of firstgrade in concepts and applications falls below the 10th per-centile. For this identification procedure, prevalence fell from9.75 percent without secondary preventive tutoring to 5.14percent with secondary preventive tutoring. With 53.3 millionschool-age children (http://www.census.gov/Press-Release/www/releases/archives/population/001703.html; March 10,2004), this translates into approximately 2.5 million fewerchildren identified as having a math LD. It is also importantto note that the prevalence of math LD at the end of sec-ond grade remained significantly lower among the group ofstudents who had received secondary prevention during firstgrade (i.e., 4.7 percent), compared to the control group (i.e.,8.3 percent), even though no additional tutoring occurred dur-ing second grade. We are continuing to follow this samplethrough fourth grade.
Separate from the issue of how prevention affects theprevalence of math LD, results also show how identifica-tion procedure, which systematically incorporates interven-tion, affects both the prevalence and severity of math LD.Looking across the various methods for designating mathLD, we formulated three conclusions. First, IQ-achievementdiscrepancy using commercial achievement tests, where be-havior sampling within any given grade level is lean, resultsin few identifications at the end of first grade. However, IQ-achievement discrepancies that rely on achievement measureswith thorough grade-level behavior sampling may sensitize

16 SPECIAL ISSUE: MATHEMATICS INSTRUCTION
detection of math LD in first grade. Second, RTI for iden-tifying math LD is a promising alternative to the tradi-tional IQ-achievement discrepancy approach. Third, withinan RTI framework for identifying math LD at first grade, twomethods appear promising: final low achievement on con-cepts/applications (sampling the entire first-grade curricu-lum to increase the spread of scores) and computation CBMdual discrepancy (where students demonstrate a poor rate ofgrowth and a poor final achievement level).
Follow-up data beyond second grade still need to be con-sidered. Absent those findings, however, we find the lowerprevalence through the end of second grade to be notable.We conclude that secondary prevention, comprising approxi-mately 24 hours of small-group tutoring and 8 hours of com-puter drill and practice on math facts, can substantially en-hance first-grade students’ end-of-year performance on mathcomputation, concepts/applications, and story problems. Ourcontrolled experimentation also indicates that RTI on a com-prehensive mathematics curriculum at first grade, which in-corporates sustained intervention (here, operationalized as 16weeks), represents a promising alternative for preventing andidentifying math LD relatively early in a child’s school ex-perience. Identifying nonresponders for special education inthis way, by the end of first grade, would permit highly skilledspecial educators to intervene in math more intensively andearlier than has occurred to date. The goal would be to en-hance outcomes for students with math LD and exit studentsfrom tertiary intervention as soon as their performance in-dicates the potential for success with primary or secondaryprevention.
MATHEMATICS PROBLEM SOLVING AT THIRDGRADE: THE PROMISE OF RTI
We have also been conducting work on math RTI at thirdgrade, this time with a specific focus on problem solving, witha deliberate look at how validated primary and secondary pre-vention may work in isolation and in combination to affectthe prevalence of math LD. Into this multitier prevention sys-tem, we incorporate a math problem-solving intervention forthird graders, which relies on schema-broadening instructionand self-regulated learning strategies. Referred to as “HotMath,” this intervention has been validated in a series of ran-domized controlled trials, with effect disaggregated for high-,average-, and low-performing third-grade students (e.g.,Fuchs et al., 2003; Fuchs et al., 2004a; Fuchs et al., 2004b).Primary prevention occurs in general education with HotMath lessons delivered in whole-class format. Secondary pre-vention involves small-group Hot Math tutoring of childrendeemed at risk for poor problem-solving outcomes. Our goalis to extend RTI to third-grade math problem solving and toexamine how two levels of prevention may work synergisti-cally. This multiyear study is still in progress. Thirty class-rooms participate each year for a total of 120 classroomsof third-grade students. In this article, we focus on findingsthrough the end of Year 2.
To find the study sample across these first 2 years, weworked in 13 schools. In each school, we randomly assignedclassrooms to primary prevention (so that Hot Math and
control classrooms occurred in roughly proportional numberswithin each school), and we then randomly assigned at-riskstudents within each classroom to receive secondary preven-tion or not (regardless of whether the classroom had beenassigned to Hot Math or control). For primary prevention, werandomly assigned 20 general education classrooms to con-ventional methods for teaching math problem solving and theother 40 general education classrooms to primary preventionHot Math whole-class instruction, which occurred 2–3 timesper week for 16 weeks for 25–40 minutes per session. Toidentify children at risk for poor outcomes, we assessed stu-dents in these 60 classrooms at the beginning of the schoolyear and used a low-performance criterion on arithmetic factsand procedural computation to designate risk. Stratifying byprimary prevention condition (Hot Math vs. control), we ran-domly assigned two-thirds of the 144 lowest-scoring studentsto Hot Math tutoring and one-third to no Tier 2 tutoring (sothat Hot Math and control secondary prevention students oc-curred in roughly proportional numbers within each class-room). Tier 2 Hot Math tutoring occurred three times weeklyfor 13 weeks. In this way, we could estimate the effects of eachtier of Hot Math intervention separately and in combination,because students participated in these four conditions: (1) noHot Math at primary or secondary prevention, (2) Hot Mathat only primary prevention, (3) Hot Math at only secondaryprevention, and (4) Hot Math at both primary and secondaryprevention.
Hot Math at the primary (whole-class) level integrates twopractices to promote mathematical problem solving: explicitschema-broadening instruction and self-regulation learningstrategies. The first 3-week unit is dedicated to basic problem-solving information: making sure answers make sense, liningup numbers from text correctly to perform math operations,and labeling work with words and mathematics symbols.Each of the next four 3-week units focuses on one prob-lem type, grouped by similar solution processes: “buyingbags” problems, “shopping list” problems, “half” problems,and “pictograph” problems (see Fuchs et al., 2002, for sam-ple problems). The instructional principles can be applied toother problem types as well.
Each of the four 3-week units provides instruction on skillacquisition and transfer. In each unit, the first four sessions fo-cus on skill acquisition (i.e., what the problem is asking andhow to solve the problem), with cumulative review acrossunits incorporated. During the third week of each unit, thenext two lessons focus on transfer, designed to broaden stu-dents’ schemas to recognize novel problems as belonging toa problem type for which they know a solution process. Ineach unit, the first acquisition lesson (Session 1) and the firsttransfer lesson (Session 5) last 40 minutes; the others last 25–30 minutes.
To teach rules for problem solution, all problems are struc-tured in the same way, but cover stories and quantities vary.A poster listing the steps of the solution method is displayed.In Session 1 of each 3-week unit, teachers present a workedexample and, as they refer to the poster, explain each step ofthe solution method. After presenting several worked exam-ples in this way, teachers move to partially worked examples,where students work in pairs to apply steps of the solution andreport answers. Eventually, in each lesson, students complete

FUCHS, FUCHS, AND HOLLENBECK: MATH RTI 17
several problems entirely in pairs, with stronger students help-ing weaker students, and each lesson ends with students com-pleting one problem independently and checking answersagainst scoring keys. Students then complete problems en-tirely in dyads, checking their work with answer keys. Finally,students are assigned a homework problem, which they returnthe next morning to a competent student in the class desig-nated as the homework collector for checking. Sessions 2–4of each unit are structured similarly to Session 1 except thata more time is allocated to dyadic practice than to directedinstruction.
Then, in Sessions 5–6, schema-broadening instruction ad-dresses transfer in two ways. First, teachers explicitly teachthe concept of transfer. Then, they present five types of prob-lem features that can change a problem without altering itsstructure or solution: A familiar problem type, which thechild knows how to solve, can be formatted so that the prob-lem looks novel, use an unfamiliar key word, pose an addi-tional question, present irrelevant information, or combineproblem types. A poster lists the four “Ways Problems CanChange” (see Figure 1 for poster). In Session 5, teachers ex-plain the poster. Then, students classify problems (of thatunit’s problem structure) according to which problem featurehas changed and explain how problems seem different butstill represent the problem type. Teachers next have studentswork in pairs to solve transfer problems, which systematicallyvary one feature at a time. Students complete and check onetransfer problem independently, and homework is assigned.
FIGURE 1 Transfer poster.
Session 6 is structured to similarly to Session 5, except thatit also incorporates cumulative review across units.
As reflected in the content of the transfer lessons, math-ematical problem solving requires metacognition, wherebychildren regulate the selection and use of skills and strate-gies (Zimmerman, 1990). For this reason, we also incor-porate self-regulated learning strategies of goal setting tohelp motivate children to focus their effort and work hardand self-monitor to facilitate goal attainment. These self-regulated learning strategies are incorporated into each ses-sion with three additional activities. First, students score eachsession’s final, independent problem using an answer key,which provides credit for the process by which work wascompleted and the accuracy of the answer. Second, studentsgraph these daily scores on their personal thermometer chart,which shows consecutive thermometers (one for each ses-sion) with each thermometer going from zero to the maxi-mum score for that problem type. Third, at the beginning ofthe next session, students inspect their charts and set a goalto beat their highest score on the day’s independent problem.(All of the Tier 1 whole-class sessions are scripted to helpteachers master the instructional format and content. For aHot Math whole-class [primary prevention] manual, [email protected].)
At the secondary prevention level, Hot Math tutoring oc-curs in groups of two to four students, three times per week for13 weeks, for 20–30 minutes each time. The instruction in-corporates a stronger self-regulated learning component withtangible reinforcers, which we have found to be important ineffecting learning outcomes for at-risk learners at third (andfirst) grade. The content of Hot Math tutoring mirrors the ma-terial covered in the whole-class sessions, except that moredifficult concepts are targeted for instruction, with additionaluse of concrete manipulatives and extra prompts to supportstudent learning. Additionally, only the four problem-typeunits are covered. See Table 1 for information for one unit(Half) on how the content of the secondary preventative tu-toring aligns with, supports, and supplements the materialcovered in primary prevention, whole-class instruction. (Allof the secondary preventative tutoring sessions are scripted.For a manual, contact [email protected].)
With respect to findings for these first 2 years of the study,we examined improvement from the beginning to the end ofthird grade on three mathematical problem-solving measures.The students had never before seen any of the problems onany of the measures. The first measure, which we call “imme-diate transfer,” asks students to complete problems that arestructured like the problems used for teaching the problemtype, but with novel cover stories. An example immediatetransfer problem is “Danny needs money to buy things forhis science project. He needs two batteries, five wires, andfour magnets. The batteries cost $6 each, the wires cost $3each, and the magnets cost $2 each. How much money doesDanny need for his science project?” The second measure,which we call “near transfer,” asks students to complete prob-lems that include novel cover stories as well as one or morenovel transfer features. An example near-transfer measure is“Lance is going to camp. He has $40 to spend on supplies. Heneeds two lamps and five tents. Lamps cost $10 each. Tentscost $3 each. After he buys his camp supplies, how much

18 SPECIAL ISSUE: MATHEMATICS INSTRUCTION
TABLE 1Key Similarities and Differences Between Hot Math Whole Class (WC) and Hot Math Tutoring (T) for One Unit: Half (H)
WholeComponent Class Tutoring WC Example T Example
Reminder about being on
task/timer
X -Students are reminded of three rules about
being “on task”: listening carefully, working
hard, and following directions. A timer is
set to go off at three random times and all
students must be “on task” when the timer
goes off.
Reminder about earning
dollars
X -Students earn “Hot Math Dollars” that they
use to buy prizes from the “Hot Math
Store.” They earn dollars by being on task
when the timer goes off, doing problems
correctly, and “making their thermometer
go up” (meeting or beating their scores on
the Hot Math “Problem of the Day”).
Concrete example X X -Teachers use manipulatives (e.g., plastic
cubes) to show what we mean by splitting
something into two equal parts
-Tutors use manipulatives to show what we
mean by splitting a group of things into two
equal parts (e.g., paper clips) and splitting
one thing into two equal parts (e.g., graham
cracker).
Concept: What “half” means X X -Teachers explain that 1/2 symbolizes “one of
two equal parts”
-Teachers explain that 1/2 symbolizes “one of
two equal parts.”
Concept: Using the symbol 1/2
as part of your answer
X X -Teachers explain that the symbol 1/2 is only
part of the answer when you’re splitting an
odd number of items in half
-Tutors explain that the symbol 1/2 is only part
of the answer when you’re splitting an odd
number of items in half.
Procedure: Drawing circles on
half chart
X X -Instruction occurs on correct way to draw
circles in pairs on the half chart and, for odd
numbers, splitting the last circle between
the sides. Students are taught how to count
to make sure each side of the half chart has
an equal number of circles
-Instruction occurs on correct way to draw
circles in pairs on the half chart and, for odd
numbers, splitting the last circle between
the sides. Students are taught how to count
to make sure each side of the half chart has
an equal number of circles.
Procedure: Using half chart to
find answer
X X -Students are taught to write the total below
each side of the half chart, cross out one
side, and use the remaining number and its
word label as their answer
-Students are taught to write the total below
each side of the half chart, cross out one
side, and use the remaining number and its
word label as their answer.
Tool: Problem solving visual X -Students are taught to proceed through steps
before solving a problem (pick a problem
type; pick a picture; find the question) and
after they solve a problem (make sure
you’ve answered the question; check your
work to make sure it makes sense, lines up,
and uses correct labels, signs and math).
Tool: Picture template X -Students are taught to pick a picture that
shows the format of a finished half problem.
Aid: Half poster X X -Students are taught to follow specific steps to
solve a half problem. Steps are reviewed
each session.
-Students are taught to follow specific steps to
solve a half problem. Steps are reviewed
each session.
1. Draw your half chart.
2. Write the number you are
splitting in half at the top
of the half chart
3. Draw your circles neatly
in pairs down the page.
4. If you have an odd circle,
put it between the two
sides of the half chart
5. Did I draw the right
number? Count circles
6. If you split a circle in half
write 1/2 on each side
(Continued)

FUCHS, FUCHS, AND HOLLENBECK: MATH RTI 19
TABLE 1(Continued)
WholeComponent Class Tutoring WC Example T Example
7. Count to make sure the
sides are equal. Write the
total under each side
8. Cross out one side
9. Write the answer with a
word label
Guided practice: Worked
example(s)/group worksheet
X X -Teacher displays worked example(s) followed
by students working problem(s) along with
teacher
-Students work practice problems on
worksheet together as a group with tutor.
Partner work X -Teacher reminds students how to be a good
partner. Students work in pairs to complete
problems, followed by self-checking of
problems using an answer sheet
Independent practice X X - Students complete two problems, called
earning points, that are scored (20-point
scale) by the teacher according to specific
guidelines. Students are encouraged to meet
or beat their previous day’s score
- Students complete one problem, called Hot
Math Problem of the Day, that is scored
(20-point scale) by tutors according to
specific guidelines. Students are encouraged
to meet or beat their previous day’s score.
Self monitoring and goal
setting
X X -Following earning points, students shade
thermometers with the number of points
they earned. They use thermometers to set
goal for next day
-Following Hot Math Problem of the Day,
students shade thermometers with the
number of points they earned. They use
thermometers to set goal for next day.
Reward X X -Each day, one dyad is selected as “Partners of
the Day” based on partner behavior;
partners are rewarded with partner of the
Day pencil
-Students earn Hot Math Dollars if they meet
the Earning Dollars criteria (see above).
Homework X -Two problems are completed as homework
and turned in the following day
money will Lance have left?” The third measure, which wecall “far transfer,” asks students to answer four questionsabout a problem narrative, which required students to useall four problem types addressed during Hot Math (as well assix additional math skills embedded in the typical third-gradecurriculum) and calls for students to apply all transfer fea-tures taught during Hot Math. See Figure 2 for one alternateform of the far-transfer measure. We found evidence for in-tervention efficacy on the first two types of measures. On thefar-transfer test, which mirrored complex, real-life problem-solving situations, results were in the direction favoring HotMath efficacy, but did not reach statistical significance.
In terms of RTI, we designated “lack of responsiveness”as scoring more than one standard deviation (i.e., the 16thpercentile) below the growth of a normative sample (closeto 600 students) who received primary prevention (whole-class) Hot Math instruction. Using this cut-point for growthas a way of defining lack of response, we documented ratesof unresponsiveness as a function of the tiers of Hot Math in-tervention at-risk students received. On the immediate- andnear-transfer measures, respectively, 86 percent and 100 per-cent of control at-risk students (who did not receive primaryor secondary Hot Math prevention) were unresponsive inmath problem solving when they received the conventionalmath problem-solving instruction designed by their teachers.This high rate of failure is disconcerting, and it is reassur-
ing that, with at least one tier of validated instruction withHot Math, the rate of failure decreased substantially. Amongat-risk students who received primary prevention’s Hot Mathwhole-class instruction but without secondary prevention’sHot Math tutoring, nonresponsiveness dropped to 29 per-cent (vs. 86 percent) on immediate transfer and to 54 percent(vs. 100 percent) on near transfer. Among students who re-ceived secondary prevention’s Hot Math tutoring but withoutprimary prevention’s Hot Math whole-class instruction, non-responsiveness dropped to 55 percent (vs. 86 percent) onimmediate transfer and to 62 percent (vs. 100 percent) onnear transfer. Rates of unresponsiveness were, however, mostimpressive when at-risk students received both tiers of HotMath intervention: 12 percent (vs. 86 percent) on immedi-ate transfer and 26 percent (vs. 100 percent) on near trans-fer. These findings illustrate how two tiers of intervention,designed strategically to work in supplementary and coordi-nated fashion, may operate synergistically to decrease mathproblem-solving difficulties for children who are otherwiseat risk for poor outcomes.
We are following the third-grade students to the end offifth grade, even as we accumulate two additional cohortsof third graders. Of course, even with two tiers of interven-tion, rates of LD in the area of math problem solving in-dicate the need for additional research on methods for suc-cessful intervention. With the first two cohorts of third-grade

20 SPECIAL ISSUE: MATHEMATICS INSTRUCTION
FIGURE 2 Continued.

FUCHS, FUCHS, AND HOLLENBECK: MATH RTI 21
FIGURE 2 Continued.

22 SPECIAL ISSUE: MATHEMATICS INSTRUCTION
FIGURE 2 Continued.

FUCHS, FUCHS, AND HOLLENBECK: MATH RTI 23
students’ data in hand, however, we do conclude that twotiers of validated, coordinated math problem-solving inter-vention can substantially reduce third-grade failure in mathproblem solving, over what one tier of validated interven-tion and certainly over conventional math problem-solvinginstruction. Our controlled experimentation also indicatesthat RTI, which incorporates validated Hot Math interven-tion at primary and secondary prevention layers, may repre-sent a promising structure for preventing and identifying mathLD specifically for word-problem deficits. Moreover, as withfirst-grade math, identifying nonresponders for math problemsolving in this way, by the end of third grade, permits highlyskilled special educators to intervene in math problem solv-ing more intensively and earlier than typically occurs, withthe goal of enhancing long-term outcomes for students withmath LD.
ACKNOWLEDGMENT
The research described in this article was supported in part byGrant #H324U010004 from the U.S. Department of Educa-tion, Office of Special Education Programs, as well as GrantRO1 #HD46154-01 and Core Grant #HD15052 from the Na-tional Institute of Child Health and Human Developmentto Vanderbilt University. Statements do not reflect agencyposition or policy, and no official endorsement should beinferred.
REFERENCES
Ardoin, S. P., Witt, J. C., Connell, J. E., & Koenig, J. L. (2001). Application ofa three-tiered response to intervention model for instructional planning,decision making, and the identification of children in need of services.Unpublished manuscript.
Bradley, R., Danielson, L., & Hallahan, D. P. (2002). Identification of learn-ing disabilities: Research to practice. Mahwah, NJ: Erlbaum.
Butler, F. M., Miller, S. P., Crehan, K., Babbitt, B., & Pierce, T. (2003). Frac-tion instruction for students with mathematics disabilities: Comparingtwo teaching sequences. Learning Disabilities Research & Practice,18, 99–111.
Cass, M., Cates, D., Smith, M., & Jackson, C. (2003). Effects of manipulativeinstruction on solving area and perimeter problems by students withlearning disabilities. Learning Disabilities Research & Practice, 18,112–120.
Fuchs, L. S. (1995). Curriculum-based measurement and eligibility decisionmaking: An emphasis on treatment validity and growth. Washington,DC: National Academy of Sciences.
Fuchs, L. S., Compton, D. L., Fuchs, D., Paulsen, K., Bryant, J. D., & Hamlett,C. L. (2005). The prevention, identification, and cognitive determinantsof math difficulty. Journal of Educational Psychology, 97, 493–513.
Fuchs, L. S., & Fuchs, D. (1998). Treatment validity: A unifying concept forreconceptualizing the identification of learning disabilities. LearningDisabilities Research & Practice, 13, 204–219.
Fuchs, L. S., Fuchs, D., Compton, D. L., Bryant, J. D., Hamlett, C. L., &Seethaler, P. M. (in press). Mathematics screening and progress mon-itoring at first grade: Implications for responsiveness-to-intervention.Exceptional Children.
Fuchs, L. S., Fuchs, D., Finelli, R., Courey, S. J., & Hamlett, C. L. (2004b).Expanding schema-based transfer instruction to help third graders solvereal-life mathematical problems. American Educational Research Jour-nal, 41, 419–445.
Fuchs, L. S., Fuchs, D., & Hamlett, C. L. (1990). Curriculum-based mea-surement math computation at first grade. Available from L. S. Fuchs,328 Peabody, Vanderbilt University, Nashville, TN 37203.
Fuchs, L. S., Hamlett, C. L., & Powell, S. R. (2003). Math Flash [com-puter program]. Available from L. S. Fuchs, 328 Peabody, VanderbiltUniversity, Nashville, TN 37203.
Fuchs, L. S., Fuchs, D., Prentice, K., Burch, M., & Paulsen, K. (2002).Hot Math: Promoting mathematical problem solving among third-gradestudents with disabilities. Teaching Exceptional Children, 31(1), 70–73.
Fuchs, L. S., Fuchs, D., Prentice, K., Hamlett, C. L., Finelli, R., & Courey,S. J. (2004a). Enhancing mathematical problem solving among third-grade students with schema-based instruction. Journal of EducationalPsychology, 96, 635–647.
Fuchs, L. S., Fuchs, D., Prentice, K., Burch, M., Hamlett, C. L., Owen, R.,et al. (2003a). Enhancing third-grade students’ mathematical problemsolving with self-regulated learning strategies. Journal of EducationalPsychology, 95(2), 306–315.
Heller, K. A., Holtzman, W. H., & Messick, S. (Eds.). (1982). Placing chil-dren in special education: A strategy for equity. Washington, DC: Na-tional Academy Press.
Mercer, C. D., Jordan, L., & Miller, S. P. (1996). Constructivistic math in-struction for diverse learners. Learning Disabilities Research & Prac-tice, 11, 147–156.
Paulsen, K., & Fuchs, L. S. (2003). Secondary preventative tutoring at firstgrade: A manual. Available from [email protected].
Paulsen, K., & Fuchs, L. S. (2006). Preventing mathematics difficulties infirst grade with small-group tutoring. Available from [email protected].
Speece, D. L., & Case, L. P. (2001). Classification in context: An alternativeapproach to identifying early reading disability. Journal of EducationalPsychology, 93, 735–749.
VanDerHeyden, A. M., & Witt, J. C. (2005). Quantifying the context ofassessment: Capturing the effect of base rates on teacher referral anda problem-solving model of identification. School Psychology Review,34, 161–183.
Vaughn, S., & Fuchs, L. S. (2003). Redefining learning disabilities as in-adequate response to instruction: The promise and potential problems.Learning Disabilities Research & Practice, 18, 137–146.
U.S. Department of Education. (2000). Twenty-second annual report toCongress on the implementation of the Individuals with DisabilitiesEducation Act. Washington, DC: Government Printing Office.
Vellutino, F., Scanlon, D. M., Sipay, E. R., Small, S. G., Pratt, A.,Chen, R., et al. (l996). Intervention as a vehicle for distinguishingbetween cognitive and experiential deficits as basic cause of spe-cific reading disability. Journal of Educational Psychology, 88, 601–838.
Zimmerman, B. J. (l990). Self-regulated learning and academic achievement:An overview. Educational Psychologist, 25, 3–18.
About the Authors
Lynn S. Fuchs, Department of Special Education at Vanderbilt University, is the Nicholas Hobbs Professor of Special Educationand Human Development, where she also directs the Vanderbilt Kennedy Center Reading Clinic. She earned her Ph.D. at theUniversity of Minnesota. Her research interests include reading and math instructional methods for students with learningdisabilities as well as classroom-based assessment.

24 SPECIAL ISSUE: MATHEMATICS INSTRUCTION
Douglas Fuchs, Department of Special Education at Vanderbilt University, is the Nicholas Hobbs Professor of Special Educationand Human Development, where he also directs the Vanderbilt Kennedy Center Reading Clinic. He earned his Ph.D. at theUniversity of Minnesota. His research interests include classification issues in learning disabilities and reading instructionalmethods.
Kurstin N. Hollenbeck, Department of Special Education at Vanderbilt University, is a doctoral student. Her research interestsinclude reading and math instructional methods for students with learning disabilities and large-scale assessment.