Extended Range Electric Vehicle Powertrain Simulation and ...
103
Extended Range Electric Vehicle Powertrain Simulation and Comparison with Consideration of Fuel Cell and Metal-air Battery by Caixia Wang A thesis presented to the University of Waterloo in fulfillment of the thesis requirement for the degree of Masters of Applied Science in Chemical Engineering Waterloo, Ontario, Canada, 2016 © Caixia Wang 2016
Transcript of Extended Range Electric Vehicle Powertrain Simulation and ...
Extended Range Electric Vehicle Powertrain Simulation and
Comparison with Consideration of Fuel Cell and Metal-air Battery
by
Caixia Wang
A thesis
presented to the University of Waterloo
in fulfillment of the
thesis requirement for the degree of
Masters of Applied Science
in
Chemical Engineering
Waterloo, Ontario, Canada, 2016
© Caixia Wang 2016

ii
Author’s Declaration
I hereby declare that I am the sole author of this thesis. This is a true copy of the thesis, including any required final
revisions, as accepted by my examiners.
I understand that my thesis may be made electronically available to the public.
iii
Abstract
The automotive industry has been in a period of energy transformation from fossil fuels to a clean energy economy
due to the economic pressures resulting from the energy crisis and the need for stricter environmental protection
policies. Among various clean energy systems are electric vehicles, with lithium-ion batteries have the largest
market share because of their stable performance and they are a relatively mature technology. However, two
disadvantages limit the development of electric vehicles: charging time and energy density. In order to mitigate
these challenges, vehicle Original Equipment Manufacturers (OEMs) have developed different vehicle architectures
to extend the vehicle range, including the Hybrid Electric Vehicle (HEV), Plug-in Hybrid Electric Vehicle (PHEV),
and Extended Range Electric Vehicle (EREV).
In this project, two advanced EREV powertrains have been modeled and simulated by using a lithium-ion battery as
the primary energy source, with the combination of a fuel cell (FCV) or zinc-air battery as the range extenders.
These two technologies were chosen as potential range extenders because of their high energy density and low life
cycle emissions. The objective of this project is to compare the combined energy system (zinc-air and lithium-ion
battery, fuel cell and lithium-ion battery) powered vehicles with gasoline powered vehicles (baseline vehicle, ICE
engine extended range electric vehicle) and battery electric vehicles (BEV) in dimensions of energy consumption,
range, emissions, cost, and customer acceptance. In order to achieve this goal, a unique zinc-air battery model was
developed in this work with consideration of research data and current market status, and a control logic of the dual
energy systems powertrain was created in the vehicle modeling software.
A 2015 Chevrolet Camaro had been chosen as the vehicle architecture platform, with modelling of the five vehicle
powertrains being built within Autonomie. This vehicle modeling software, developed by Argonne National
Laboratory, runs with MATLAB & Simulink, and contains embedded drive cycles and analysis tools needed to
perform the necessary simulations. Since the emission analysis in the Autonomie model only considers the vehicle
in energy consumption and tailpipe emissions, therefore a Well-to-Wheel analysis method is introduced to evaluate
the energy life cycle. This method takes into account the emissions from the energy production and considers the
vehicle tailpipe emission.
After finished all the simulations, a decision matrix was developed to compare these five powertrains from the
metrics of energy consumption, emissions, customer acceptance, and life cycle cost. Three substantial conclusions
were obtained from the comparison: The powertrains without use engine and gasoline as the power source have the
lower tailpipe emissions and greenhouse gas emissions. The powertrains based on battery power alone, i.e. metal air
extended range electric vehicle (MA-EREV) and battery electric vehicle (BEV) are not able to achieve the total
range target, likely because of the relative high vehicle mass caused by the weight of the battery pack. However
MA-EREV got the highest marks compared to other powertrains. However, metal-air battery is a new technology,
and there are no prototypes of the technology, thus full commercialization is expected to take some time.

iv
Acknowledgements
There are so many people to acknowledge; for I would not have completed such an endeavor alone. This thesis and
my master study have taken time, and energy from me, but I would like to appreciate to the following people and
their efforts. I can enjoy my life in Canada, and be happy.
First of all, I would like to acknowledge my family for support me pursuing my dream. Especially my mom, Lange
Wang, the most important person in my life. She has provided constant support and motivation throughout these two
years and I would not pursued my dream and have completed this thesis without her.
I would like to acknowledge Dr. Michael Fowler and Dr. Roydon Fraser for playing significant roles of my study
life in Canada. Without them, my oversea study dream may not come true. Dr. Fowler’s insight and guidance were
instrumental in completing this project. Dr. Fraser, who led me to find the right resources to advance my thesis
when I got stuck.
I would like to acknowledge Dr. Eric Croiset and Ms. Judy Caron, who helped me pass through my difficult time
when I was first arrived in Canada. Great thanks for their trust, kindness support, and continuous encouragement to
my study.
I would like to acknowledge Dr. Zhongwei Chen and his lab for the great support about zinc-air battery. Thank you
Ali for working with me together and brought innovation to my research.
I would like to thank my distant friends, Qiqige, Gavin, Renxia, Lijun, Hong, Lily, Danny, Changqing, and all my
previous colleagues in Poteivo New Energy Co., Ltd (Beijing and Shanghai). You are a constant encouragement to
pursue and insist my dream, to be a great person I can aspire to.
I would like to thank my co-workers, William, John, Ushnik, Zhiyu, Zach, Manoj, Ehsan, Dylan, Mohammad, and
my forth year group (Steven, Nathan, Julia and Betty); my friends in Canada, Guihua, Jingde, Zee and her family,
Eve and her family, Xinyao, and Kai. This was a tough journey, and without you, I would have been alone.
Specially thanks to the University of Waterloo Alternative Fuels Team (UWAFT), where I spent most of my time
during my master study. The memory of working together with the team in the garage and opportunities to join
EcoCAR3 workshop were the most precious moment in my student life. Your name: Patrick, Daniel, Ben, Brandon,
Trong, Michael, Ramin and Paul are the most beautiful painting color in my life.

v
Dedication
To all who read this work,
and find it interesting or useful.
vi
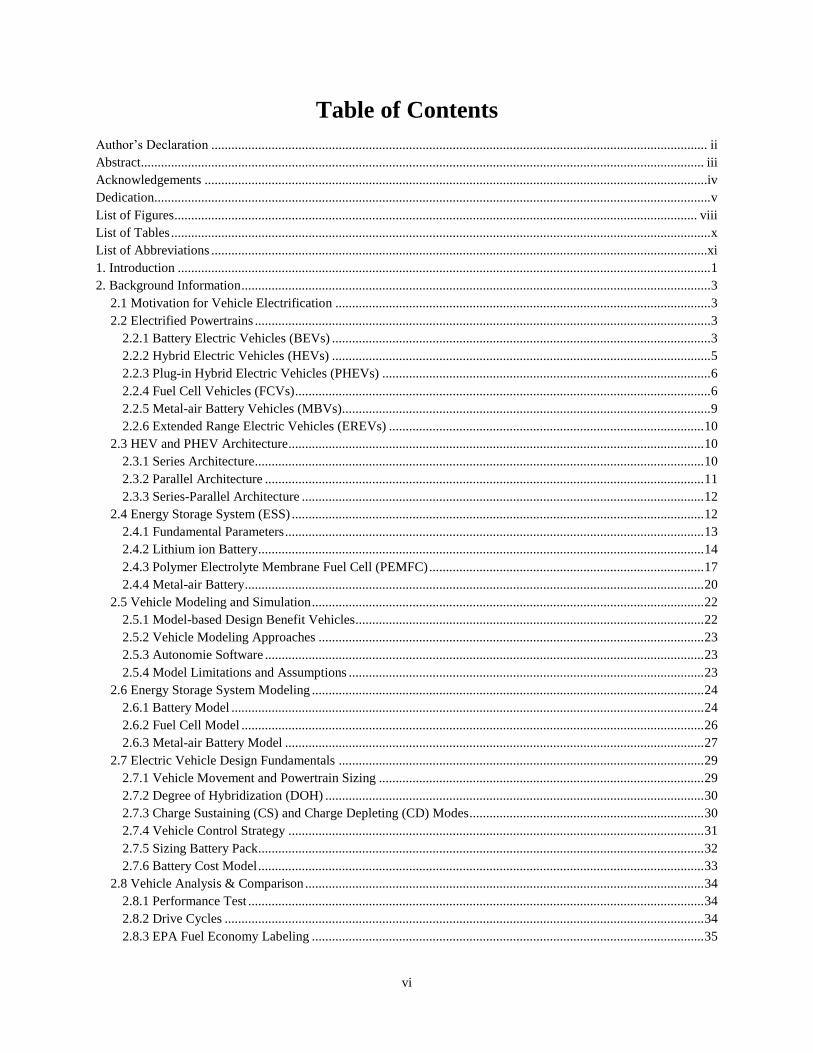
Table of Contents
Author’s Declaration .................................................................................................................................................... ii Abstract........................................................................................................................................................................ iii Acknowledgements ......................................................................................................................................................iv Dedication...................................................................................................................................................................... v List of Figures ............................................................................................................................................................ viii List of Tables ................................................................................................................................................................. x List of Abbreviations ....................................................................................................................................................xi 1. Introduction ............................................................................................................................................................... 1 2. Background Information ............................................................................................................................................ 3
2.1 Motivation for Vehicle Electrification ................................................................................................................ 3 2.2 Electrified Powertrains ........................................................................................................................................ 3
2.2.1 Battery Electric Vehicles (BEVs) ................................................................................................................. 3 2.2.2 Hybrid Electric Vehicles (HEVs) ................................................................................................................. 5 2.2.3 Plug-in Hybrid Electric Vehicles (PHEVs) .................................................................................................. 6 2.2.4 Fuel Cell Vehicles (FCVs) ............................................................................................................................ 6 2.2.5 Metal-air Battery Vehicles (MBVs).............................................................................................................. 9 2.2.6 Extended Range Electric Vehicles (EREVs) .............................................................................................. 10
2.3 HEV and PHEV Architecture ............................................................................................................................ 10 2.3.1 Series Architecture ...................................................................................................................................... 10 2.3.2 Parallel Architecture ................................................................................................................................... 11 2.3.3 Series-Parallel Architecture ........................................................................................................................ 12
2.4 Energy Storage System (ESS) ........................................................................................................................... 12 2.4.1 Fundamental Parameters ............................................................................................................................. 13 2.4.2 Lithium ion Battery..................................................................................................................................... 14 2.4.3 Polymer Electrolyte Membrane Fuel Cell (PEMFC) .................................................................................. 17 2.4.4 Metal-air Battery ......................................................................................................................................... 20
2.5 Vehicle Modeling and Simulation ..................................................................................................................... 22 2.5.1 Model-based Design Benefit Vehicles ........................................................................................................ 22 2.5.2 Vehicle Modeling Approaches ................................................................................................................... 23 2.5.3 Autonomie Software ................................................................................................................................... 23 2.5.4 Model Limitations and Assumptions .......................................................................................................... 23
2.6 Energy Storage System Modeling ..................................................................................................................... 24 2.6.1 Battery Model ............................................................................................................................................. 24 2.6.2 Fuel Cell Model .......................................................................................................................................... 26 2.6.3 Metal-air Battery Model ............................................................................................................................. 27
2.7 Electric Vehicle Design Fundamentals ............................................................................................................. 29 2.7.1 Vehicle Movement and Powertrain Sizing ................................................................................................. 29 2.7.2 Degree of Hybridization (DOH) ................................................................................................................. 30 2.7.3 Charge Sustaining (CS) and Charge Depleting (CD) Modes ...................................................................... 30 2.7.4 Vehicle Control Strategy ............................................................................................................................ 31 2.7.5 Sizing Battery Pack ..................................................................................................................................... 32 2.7.6 Battery Cost Model ..................................................................................................................................... 33
2.8 Vehicle Analysis & Comparison ....................................................................................................................... 34 2.8.1 Performance Test ........................................................................................................................................ 34 2.8.2 Drive Cycles ............................................................................................................................................... 34 2.8.3 EPA Fuel Economy Labeling ..................................................................................................................... 35
vii
2.8.4 Utility Factor (UF) ...................................................................................................................................... 35 2.8.5 Well-to-Wheel Analysis ............................................................................................................................. 36
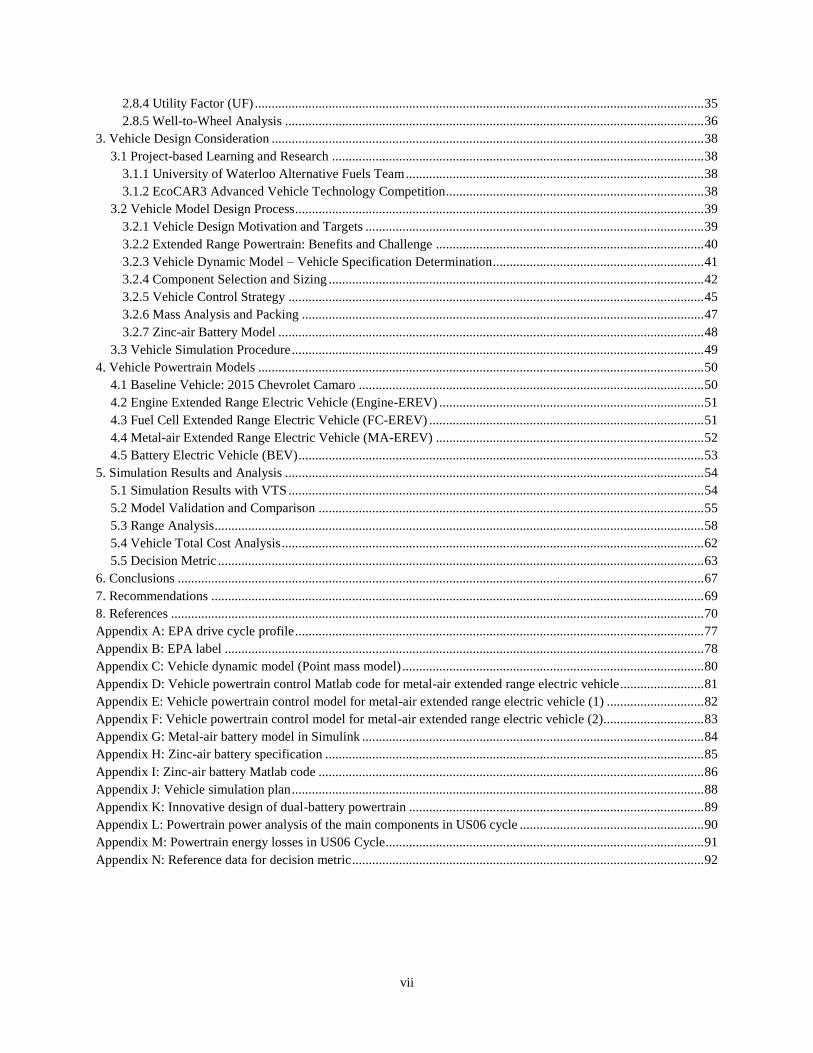
3. Vehicle Design Consideration ................................................................................................................................. 38 3.1 Project-based Learning and Research ............................................................................................................... 38
3.1.1 University of Waterloo Alternative Fuels Team ......................................................................................... 38 3.1.2 EcoCAR3 Advanced Vehicle Technology Competition ............................................................................. 38
3.2 Vehicle Model Design Process .......................................................................................................................... 39 3.2.1 Vehicle Design Motivation and Targets ..................................................................................................... 39 3.2.2 Extended Range Powertrain: Benefits and Challenge ................................................................................ 40 3.2.3 Vehicle Dynamic Model – Vehicle Specification Determination ............................................................... 41 3.2.4 Component Selection and Sizing ................................................................................................................ 42 3.2.5 Vehicle Control Strategy ............................................................................................................................ 45 3.2.6 Mass Analysis and Packing ........................................................................................................................ 47 3.2.7 Zinc-air Battery Model ............................................................................................................................... 48
3.3 Vehicle Simulation Procedure ........................................................................................................................... 49 4. Vehicle Powertrain Models ..................................................................................................................................... 50
4.1 Baseline Vehicle: 2015 Chevrolet Camaro ....................................................................................................... 50 4.2 Engine Extended Range Electric Vehicle (Engine-EREV) ............................................................................... 51 4.3 Fuel Cell Extended Range Electric Vehicle (FC-EREV) .................................................................................. 51 4.4 Metal-air Extended Range Electric Vehicle (MA-EREV) ................................................................................ 52 4.5 Battery Electric Vehicle (BEV) ......................................................................................................................... 53
5. Simulation Results and Analysis ............................................................................................................................. 54 5.1 Simulation Results with VTS ............................................................................................................................ 54 5.2 Model Validation and Comparison ................................................................................................................... 55 5.3 Range Analysis .................................................................................................................................................. 58 5.4 Vehicle Total Cost Analysis .............................................................................................................................. 62 5.5 Decision Metric ................................................................................................................................................. 63
6. Conclusions ............................................................................................................................................................. 67 7. Recommendations ................................................................................................................................................... 69 8. References ............................................................................................................................................................... 70 Appendix A: EPA drive cycle profile .......................................................................................................................... 77 Appendix B: EPA label ............................................................................................................................................... 78 Appendix C: Vehicle dynamic model (Point mass model) .......................................................................................... 80 Appendix D: Vehicle powertrain control Matlab code for metal-air extended range electric vehicle ......................... 81 Appendix E: Vehicle powertrain control model for metal-air extended range electric vehicle (1) ............................. 82 Appendix F: Vehicle powertrain control model for metal-air extended range electric vehicle (2) .............................. 83 Appendix G: Metal-air battery model in Simulink ...................................................................................................... 84 Appendix H: Zinc-air battery specification ................................................................................................................. 85 Appendix I: Zinc-air battery Matlab code ................................................................................................................... 86 Appendix J: Vehicle simulation plan ........................................................................................................................... 88 Appendix K: Innovative design of dual-battery powertrain ........................................................................................ 89 Appendix L: Powertrain power analysis of the main components in US06 cycle ....................................................... 90 Appendix M: Powertrain energy losses in US06 Cycle ............................................................................................... 91 Appendix N: Reference data for decision metric ......................................................................................................... 92
viii
List of Figures
Figure 1. Basic extended range electric vehicle architecture ......................................................................................... 2 Figure 2: Battery electric vehicle powertrain................................................................................................................. 3 Figure 3: SAE charging configurations and ratings terminology. ................................................................................. 4 Figure 4: The concept of a hybrid vehicle. .................................................................................................................... 5 Figure 5: Torque vs. speed for electric motor and ICE. ................................................................................................. 6 Figure 6: Typical operating characteristics of a fuel cell system ................................................................................... 7 Figure 7: A fuel cell hybrid powertrain with DC-DC converter. ................................................................................... 8 Figure 8. Toyota Mirai powertrain system .................................................................................................................... 8 Figure 9: Electric vehicle powered by a metal-air battery and a conventional battery ................................................ 10 Figure 10: Series Architecture ..................................................................................................................................... 11 Figure 11. Parallel architecture. ................................................................................................................................... 11 Figure 12: Motor position diagrams in parallel hybrid ................................................................................................ 12 Figure 13: Series-parallel architecture. ........................................................................................................................ 12 Figure 14: Comparison of battery technologies in terms of volumetric and gravimetric energy density ................... 13 Figure 15: Operational schematic of a lithium ion battery .......................................................................................... 15 Figure 16: Schematic drawing showing the shape and components of various li-ion batteries ................................... 15 Figure 17. Battery cell connected in series and parallel configuration ........................................................................ 16 Figure 18: Battery pack system constructions: cells-modules-packs ........................................................................... 16 Figure 19: Basic polymer electrolyte membrane fuel cell structure ............................................................................ 18 Figure 20. Polarization and power density curves of a PEMFC operating at 70 °C..................................................... 19 Figure 21. Operating efficiency and power density in a hydrogen-oxygen fuel cell ................................................... 19 Figure 22. Theoretical and practical energy densities of rechargeable batteries .......................................................... 20 Figure 23: Schematic operational principle of Zinc-air battery ................................................................................... 22 Figure 24. Metal-air battery stack from Phinergy company ........................................................................................ 22 Figure 25: DPW model components correlated with EIS results in Nyquist plot ........................................................ 26 Figure 26: Parameters that must be solved for in a mathematical model .................................................................... 26 Figure 27: Possible low frequency impedance spectra of Li-air batteries ................................................................... 27 Figure 28: Small-signal equivalent circuit of Li-air batteries ...................................................................................... 28 Figure 29. Nyquist plots obtained by EIS of Zinc-air battery ...................................................................................... 28 Figure 30: Plot of battery SOC management over CD and CS modes ........................................................................ 31 Figure 32: TCO model illustration .............................................................................................................................. 34 Figure 32: Utility factor plot based on SAE J2841 (2005 NHTS Data) ...................................................................... 36 Figure 33: Process involved in WTW efficiency calculation ...................................................................................... 37 Figure 34: Cumulative distribution curve for daily driven distance ............................................................................ 40 Figure 35. Extended range battery electric vehicle. ..................................................................................................... 40 Figure 36: Extended range electric vehicle simulation control logic. ......................................................................... 46 Figure 37: Simulated baseline vehicle configuration. .................................................................................................. 50 Figure 38: Simulated engine extended range electric vehicle powertrain. .................................................................. 51 Figure 39: Simulated fuel cell extended range electric vehicle powertrain. ................................................................ 52 Figure 40: Fuel cell efficiency map for FC-EREV with energy density efficiency vs power in US06 cycle. ............. 52 Figure 41: Innovatively simulated metal-air extended range electric vehicle powertrain. .......................................... 53 Figure 42: Simulated battery electric vehicle powertrain. ........................................................................................... 53 Figure 43: Li-ion battery SOC changes when the range extender activates at US06 cycle ......................................... 58 Figure 44: Li-ion battery SOC changes when the range extender activates at UDDS cycle. ...................................... 59 Figure 45: BEV li-ion battery SOC changes vs. range profile representative of 45 UDDS cycles. ............................ 59 Figure 46: Engine-EREV Li-ion battery SOC changes vs. range profile representative of 45 UDDS cycles. ............ 60

ix
Figure 47: FC-EREV li-ion battery SOC changes vs. range profile representative of 45 UDDS drive cycles ............ 60 Figure 48: Zinc-air EREV SOC changes vs. range profile representative of 45 UDDS drive cycles .......................... 61 Figure 49: Range modeling results comparison with different size of the energy systems ......................................... 62 Figure 51: EPA drive cycle.......................................................................................................................................... 77 Figure 52: New label--plug-in hybrid electric vehicle ................................................................................................. 78 Figure 52: Zinc-air discharge curve. ............................................................................................................................ 85
x
List of Tables
Table 1: Hydrogen storage types ................................................................................................................................... 9 Table 2. Different types of metal-air batteries ............................................................................................................. 21 Table 3. Equivalent circuit models type ...................................................................................................................... 25 Table 4: The values of the equivalent circuit elements based on the EIS analysis ...................................................... 29 Table 5: Characteristics of US EPA drive cycles ........................................................................................................ 35 Table 6. Vehicle Target Specification. ........................................................................................................................ 39 Table 7: Vehicle Model Parameters............................................................................................................................. 41 Table 8: Performance test power requirement specifications. ..................................................................................... 42 Table 9: EPA power and energy requirements. ........................................................................................................... 42 Table 10: Component specification by vehicle type. ................................................................................................... 43 Table 11: Vehicle Mass Analysis. ............................................................................................................................... 48 Table 12: Simulation results for five powertrains. ....................................................................................................... 55 Table 13: Simulation results comparison in UDDS cycle. .......................................................................................... 56 Table 14: Simulation results comparison in HWEFT cycle. ....................................................................................... 56 Table 17: Simulation results comparison in US06 cycle. ............................................................................................ 57 Table 16: Range modeling results comparison with different size of the energy systems........................................... 61 Table 19: Vehicle total cost analysis. .......................................................................................................................... 62 Table 20: Decision metric for five powertrains. .......................................................................................................... 66 Table 19: Description of EPA label. ............................................................................................................................ 78 Table 20: Zinc-air battery specification. ...................................................................................................................... 85 Table 21: Fuel material properties ............................................................................................................................... 92 Table 22: Upstream criteria emission factors ............................................................................................................. 92 Table 23: Approximate PTW and WTW GHG factors ................................................................................................ 92
xi
List of Abbreviations
AVTC Advanced Vehicle Technologies Competition
BEV Battery Electric Vehicle
BMU Battery Management Unit
BMS Battery Management System
CD Charge Depleting
CS Charge Sustaining
DOD Depth of Discharge
DOE Department of Energy
DP Dual Polarization
DPW Dual Polarization with Warburg
ECM Equivalent Circuit Model
EIS Electrochemical Impedance Spectroscopy
EPA Environmental Protection Agency
EREV Extended Range Electric Vehicle
ESS Energy Storage System
EV Electrified Vehicle
FCEV Fuel Cell Electric Vehicle
FC-EREV Fuel Cell Extended range Electric Vehicle
GUI Graphical User Interface
GM General Motors
HEV Hybrid Electric Vehicle
HWFET Highway Fuel Economy Test
ICE Internal Combustion Engine
IVM Initial Vehicle Movement
Li-ion Lithium-Ion
MA-EREV Metal-air Extended-range Electric Vehicle
MPG Miles per Gallon
MPGe Miles per Gallon Equivalent
NHTS National Household Travel Survey
OEM Original Equipment Manufacturers
PHEV Plug-in Hybrid Electric Vehicle
R|C Resistor and Capacitor in parallel
SEI Solid Electrolyte Interface
SMR Steam Methane Reforming
SOC State of Charge
SOH State of Health
Split-Parallel A hybrid electric vehicle architecture with the engine in both series and parallel with the motor
UDDS Urban Dynamometer/Domestic Driving Schedule
US06 SFTP representing engine load and emissions associated with high acceleration
UW University of Waterloo
UWAFT University of Waterloo Alternative Fuels Team
VPA Vehicle Propulsion Architecture
VPC Vehicle Propulsion Controller
VTS Vehicle Technical Specifications
1
1. Introduction
The drastic fluctuation of oil prices and the effects of air pollution on public health and climate change have pushed
academia and automotive industries to look for alternative and more economic energy storage systems. Vehicle
electrification is a key initiative by automakers to improve fleet fuel efficiencies in accordance to planned Corporate
Average Fuel Economy (CAFE) standards [1]. A vehicle electrified powertrain helps to increase overall vehicle
efficiency and reduce emissions [2] [3] [4]. As a result, Hybrid Electric Vehicles (HEVs), Plug-in Hybrid Electric
Vehicles (PHEVs), and Battery Electric Vehicles (BEVs) have seen a substantial increase in market share. By the
end of 2014, the global EV stock is around 665,000, which represents 0.08% of total passenger cars in the world [5].
Despite the glorious market growth in past years, the increase in market share of electric vehicles is still deterred by
significant barriers coming from technology, market, and policy. The most substantial technological challenges are
the cost and performance of the crucial components, particularly the battery. The current leading battery technology
in the EV market is the lithium-ion battery with the price per kilowatt hour (kWh) of a lithium-ion battery ranging
between USD 500~650, which is a significant cost considering its performance and energy density. Thus, the most
expensive component within a vehicle now becomes the battery pack. As an example, a popular battery electric
vehicle, the Nissan LEAF with its 24 kWh battery pack cost approximately USD 12,000, which is about one third of
the vehicle retail price. Plug-in hybrid electric vehicles (PHEVs) are even more expensive due to their complex
powertrain system. Even taking into account vehicle lifecycle cost and government subsidies, the uncertainty of
battery performance and vehicle maintenance during its lifetime are still not competitive compared to their petro
vehicle equivalents.
Another key concern about EVs are their range limitations. Increasing usable range of EVs is necessary to address
customers’ range anxiety, but also comes with higher retail prices, like the 85 kWh battery powered all-wheel-drive
Tesla Model-S (Range: 485 km) will cost approximately USD10, 000 more than the 70 kWh model (Range: 435km)
[6] [7]. These major concerns require the improvement of battery energy density, which relies on long-term research
to create the next generation in battery technology, such as hydrogen fuel cell, zinc-air, and lithium-sulfur.
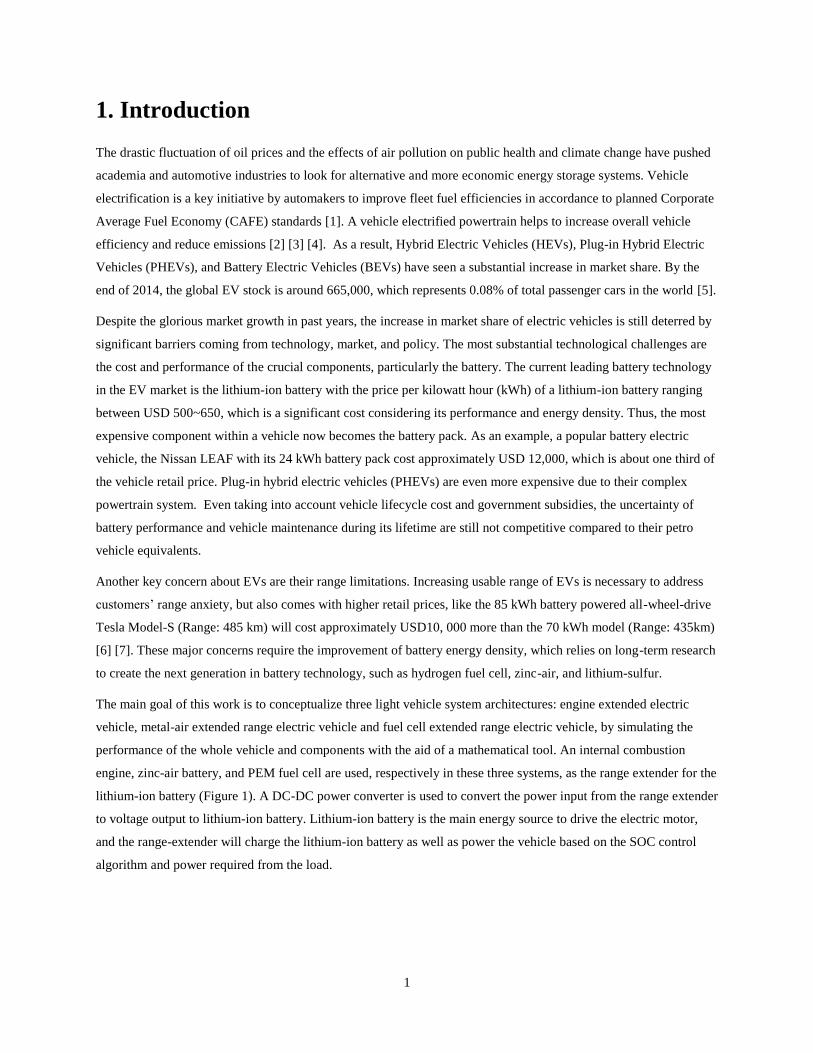
The main goal of this work is to conceptualize three light vehicle system architectures: engine extended electric
vehicle, metal-air extended range electric vehicle and fuel cell extended range electric vehicle, by simulating the
performance of the whole vehicle and components with the aid of a mathematical tool. An internal combustion
engine, zinc-air battery, and PEM fuel cell are used, respectively in these three systems, as the range extender for the
lithium-ion battery (Figure 1). A DC-DC power converter is used to convert the power input from the range extender
to voltage output to lithium-ion battery. Lithium-ion battery is the main energy source to drive the electric motor,
and the range-extender will charge the lithium-ion battery as well as power the vehicle based on the SOC control
algorithm and power required from the load.
2
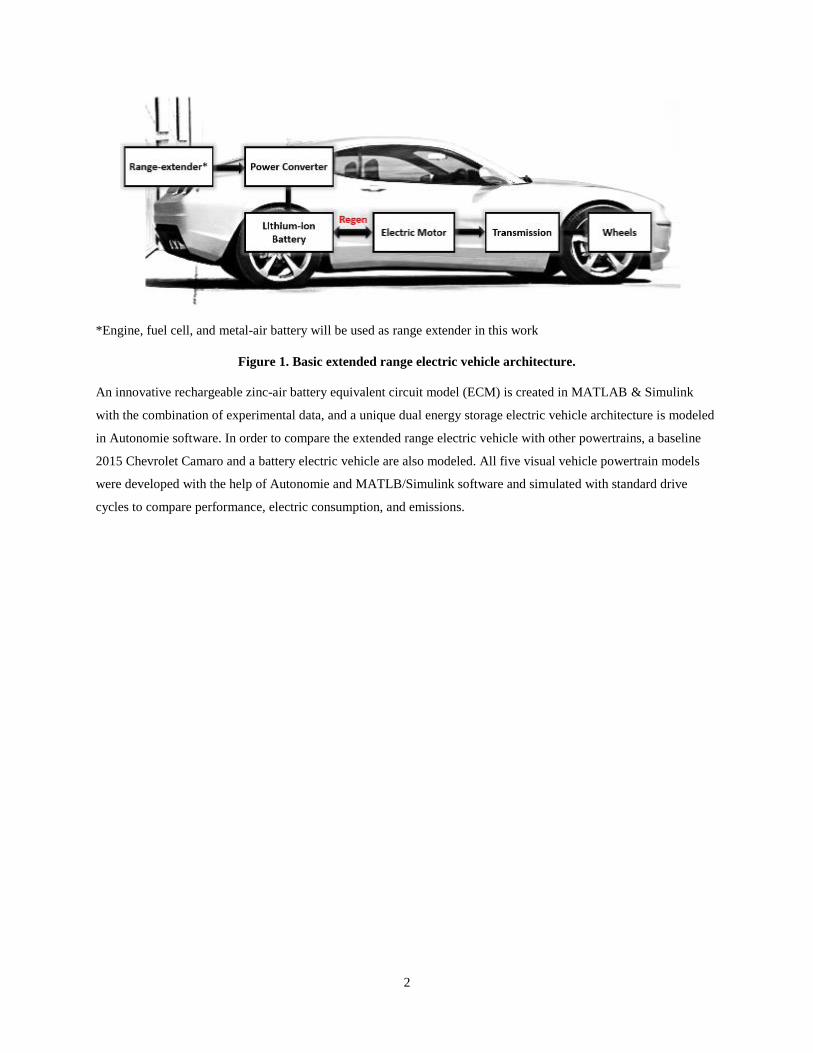
*Engine, fuel cell, and metal-air battery will be used as range extender in this work
Figure 1. Basic extended range electric vehicle architecture.
An innovative rechargeable zinc-air battery equivalent circuit model (ECM) is created in MATLAB & Simulink
with the combination of experimental data, and a unique dual energy storage electric vehicle architecture is modeled
in Autonomie software. In order to compare the extended range electric vehicle with other powertrains, a baseline
2015 Chevrolet Camaro and a battery electric vehicle are also modeled. All five visual vehicle powertrain models
were developed with the help of Autonomie and MATLB/Simulink software and simulated with standard drive
cycles to compare performance, electric consumption, and emissions.
3
2. Background Information
2.1 Motivation for Vehicle Electrification
Over the past few decades, there has been an increased desire to pursue environmental protection and awareness of
the non-renewable nature of the petroleum-based vehicles. In response the whole automotive industry has been
devoting its efforts on exploring sustainable transportation. Vehicle electrification incorporates electric powered
(compared with mechanical powered) architectures to reduce emissions and improve vehicle performance.
Motivation for developing electrified vehicles comes from the following considerations:
• Increased energy efficiency: Electric motors are more energy-efficient than internal combustion engines
(ICEs). Electric motors convert about 75% of the chemical energy in a battery into mechanical power, while
ICEs only transmit about 20% of energy stored in gasoline to transmission.
• Increased fuel economy: Increased electric power can support technologies such as Idle-Off, Launch Assist,
Regenerative Breaking, etc.
• Improved acceleration: Increased electric power can support a motor, which allows the vehicle to accelerate
immediately from an idle position – without the need to wait for the engine.
Despite the above advantages, pure electric vehicles are still facing push-back from consumers, due to concerns of
higher cost, limited range, and fewer opportunities to access charging stations from lack of infrastructure. Therefore,
hybrid powertrains, combing ICEs with batteries have been developed, as well as other innovative extended-range
vehicle designs. These include fuel cell combined with batteries, as well as, metal air batteries combined with
normal batteries.
2.2 Electrified Powertrains
2.2.1 Battery Electric Vehicles (BEVs)
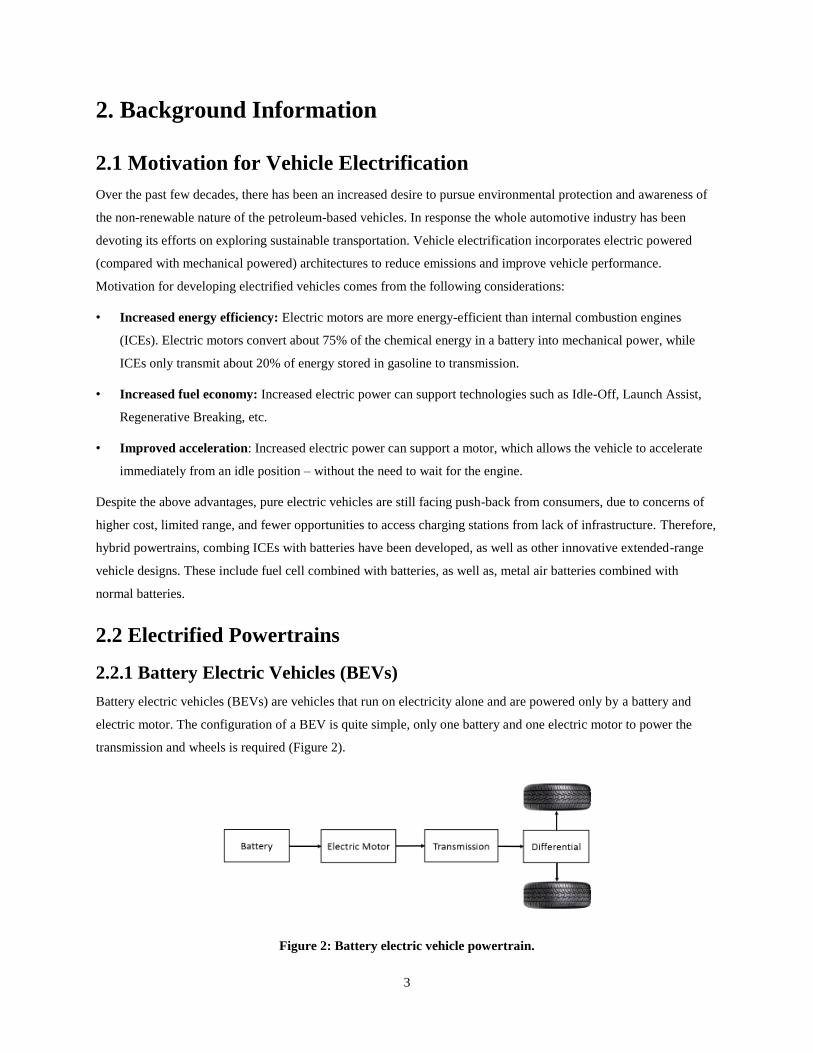
Battery electric vehicles (BEVs) are vehicles that run on electricity alone and are powered only by a battery and
electric motor. The configuration of a BEV is quite simple, only one battery and one electric motor to power the
transmission and wheels is required (Figure 2).
Figure 2: Battery electric vehicle powertrain.
4
This type of powertrain presents several advantages, including:
Zero tailpipe emissions: BEVs burn no fuel and thus they release no emissions during driving. However, when
considering the origin of the outsourced electricity, the total emission is nonzero due to emissions released
during the production of electricity.
High energy efficiency on a tank-to-wheels basis: Because of the higher efficiency of electric motors
compared to ICEs, BEVs can transfer energy more efficiently than other conventional vehicles.
Simple drivetrain design: BEVs require only a single-stage transmission rather than other complicated
powertrains, which simplifies the transmission design process.
On the other hand, several significant challenges still restrict widespread adoption of BEVs. The major three
concerns for consumers are battery cost, vehicle range, and charging time.
Cost is regarded as an important factor for the adoption of electric vehicles [8]. Although battery technology is
improving, they still remain the predominant cost (one third) of an electric vehicle [9].
Range anxiety is a fear that a vehicle has inadequate range to cover the planned trip or has unexpected energy
consumption on the road [10] [11]. This factor is considered to be the major barrier for mainstream adoption of
BEVs. The longest range of BEVs currently in the market is around 460 km [6], which is still less than that of
normal gasoline vehicles. Furthermore, BEVs with relatively long ranges result from a larger size battery
system, which directly increases the whole vehicle cost.
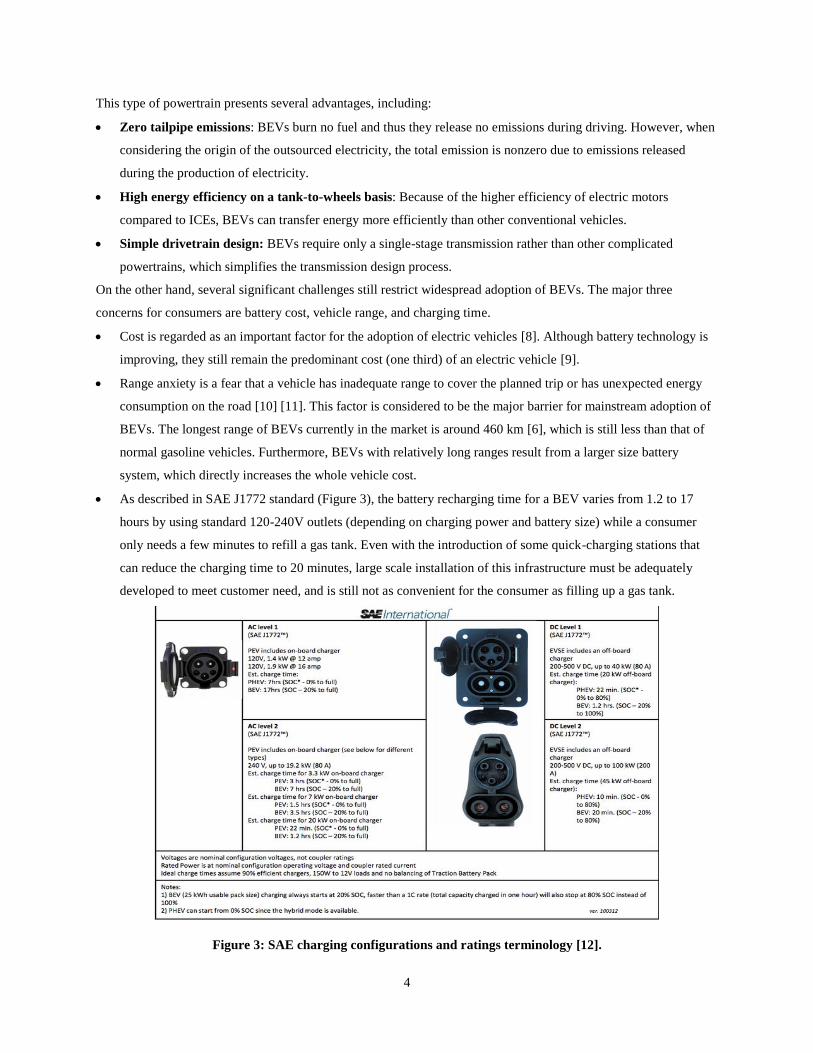
As described in SAE J1772 standard (Figure 3), the battery recharging time for a BEV varies from 1.2 to 17
hours by using standard 120-240V outlets (depending on charging power and battery size) while a consumer
only needs a few minutes to refill a gas tank. Even with the introduction of some quick-charging stations that
can reduce the charging time to 20 minutes, large scale installation of this infrastructure must be adequately
developed to meet customer need, and is still not as convenient for the consumer as filling up a gas tank.
Figure 3: SAE charging configurations and ratings terminology [12].
5
2.2.2 Hybrid Electric Vehicles (HEVs)
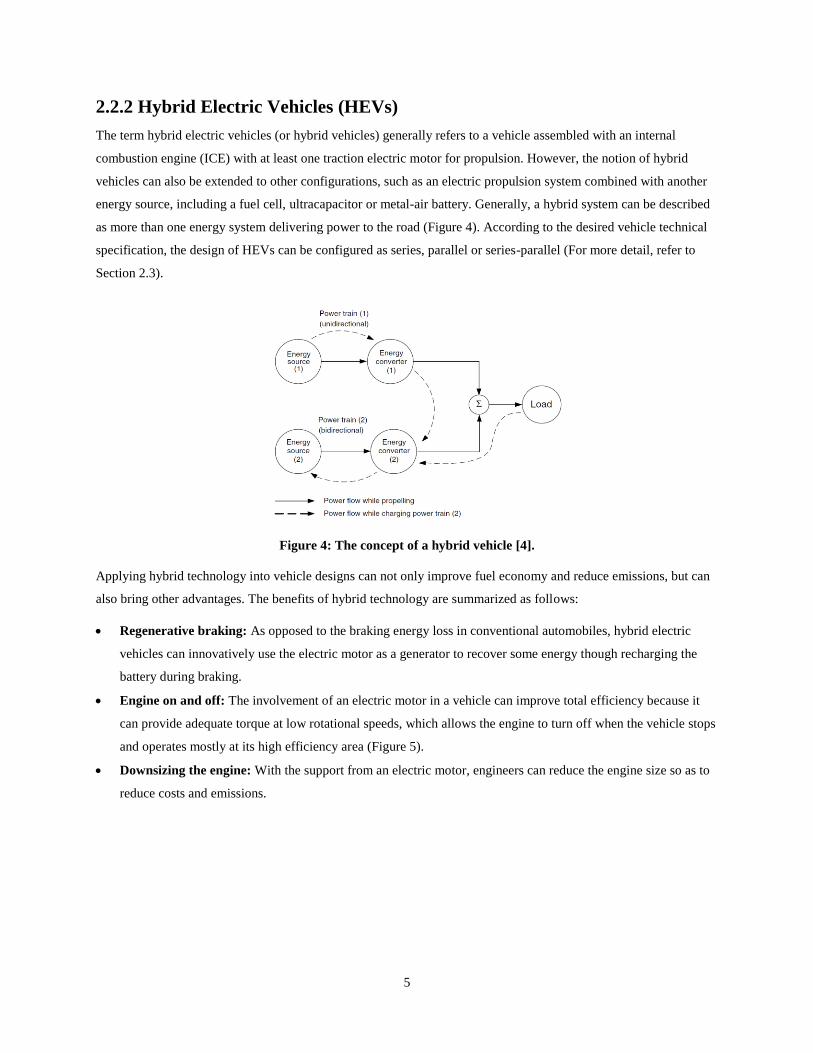
The term hybrid electric vehicles (or hybrid vehicles) generally refers to a vehicle assembled with an internal
combustion engine (ICE) with at least one traction electric motor for propulsion. However, the notion of hybrid
vehicles can also be extended to other configurations, such as an electric propulsion system combined with another
energy source, including a fuel cell, ultracapacitor or metal-air battery. Generally, a hybrid system can be described
as more than one energy system delivering power to the road (Figure 4). According to the desired vehicle technical
specification, the design of HEVs can be configured as series, parallel or series-parallel (For more detail, refer to
Section 2.3).
Figure 4: The concept of a hybrid vehicle [4].
Applying hybrid technology into vehicle designs can not only improve fuel economy and reduce emissions, but can
also bring other advantages. The benefits of hybrid technology are summarized as follows:
Regenerative braking: As opposed to the braking energy loss in conventional automobiles, hybrid electric
vehicles can innovatively use the electric motor as a generator to recover some energy though recharging the
battery during braking.
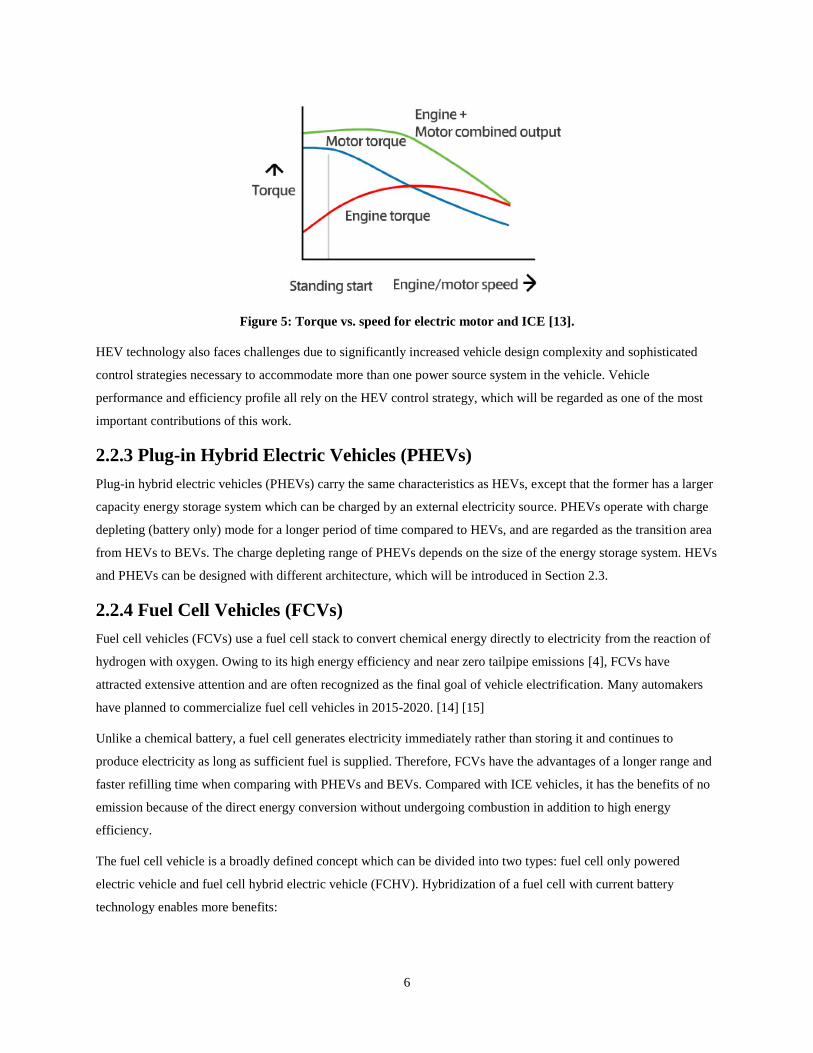
Engine on and off: The involvement of an electric motor in a vehicle can improve total efficiency because it
can provide adequate torque at low rotational speeds, which allows the engine to turn off when the vehicle stops
and operates mostly at its high efficiency area (Figure 5).
Downsizing the engine: With the support from an electric motor, engineers can reduce the engine size so as to
reduce costs and emissions.
6
Figure 5: Torque vs. speed for electric motor and ICE [13].
HEV technology also faces challenges due to significantly increased vehicle design complexity and sophisticated
control strategies necessary to accommodate more than one power source system in the vehicle. Vehicle
performance and efficiency profile all rely on the HEV control strategy, which will be regarded as one of the most
important contributions of this work.
2.2.3 Plug-in Hybrid Electric Vehicles (PHEVs)
Plug-in hybrid electric vehicles (PHEVs) carry the same characteristics as HEVs, except that the former has a larger
capacity energy storage system which can be charged by an external electricity source. PHEVs operate with charge
depleting (battery only) mode for a longer period of time compared to HEVs, and are regarded as the transition area
from HEVs to BEVs. The charge depleting range of PHEVs depends on the size of the energy storage system. HEVs
and PHEVs can be designed with different architecture, which will be introduced in Section 2.3.
2.2.4 Fuel Cell Vehicles (FCVs)
Fuel cell vehicles (FCVs) use a fuel cell stack to convert chemical energy directly to electricity from the reaction of
hydrogen with oxygen. Owing to its high energy efficiency and near zero tailpipe emissions [4], FCVs have
attracted extensive attention and are often recognized as the final goal of vehicle electrification. Many automakers
have planned to commercialize fuel cell vehicles in 2015-2020. [14] [15]
Unlike a chemical battery, a fuel cell generates electricity immediately rather than storing it and continues to
produce electricity as long as sufficient fuel is supplied. Therefore, FCVs have the advantages of a longer range and
faster refilling time when comparing with PHEVs and BEVs. Compared with ICE vehicles, it has the benefits of no
emission because of the direct energy conversion without undergoing combustion in addition to high energy
efficiency.
The fuel cell vehicle is a broadly defined concept which can be divided into two types: fuel cell only powered
electric vehicle and fuel cell hybrid electric vehicle (FCHV). Hybridization of a fuel cell with current battery
technology enables more benefits:
7
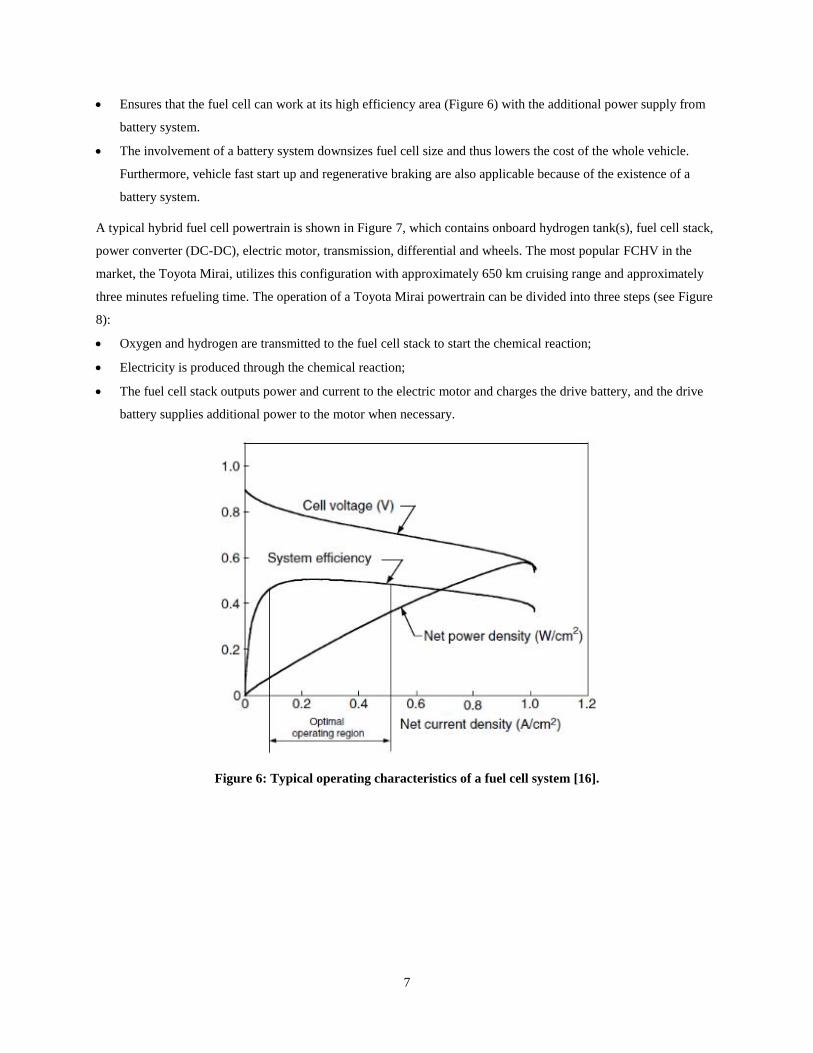
Ensures that the fuel cell can work at its high efficiency area (Figure 6) with the additional power supply from
battery system.
The involvement of a battery system downsizes fuel cell size and thus lowers the cost of the whole vehicle.
Furthermore, vehicle fast start up and regenerative braking are also applicable because of the existence of a
battery system.
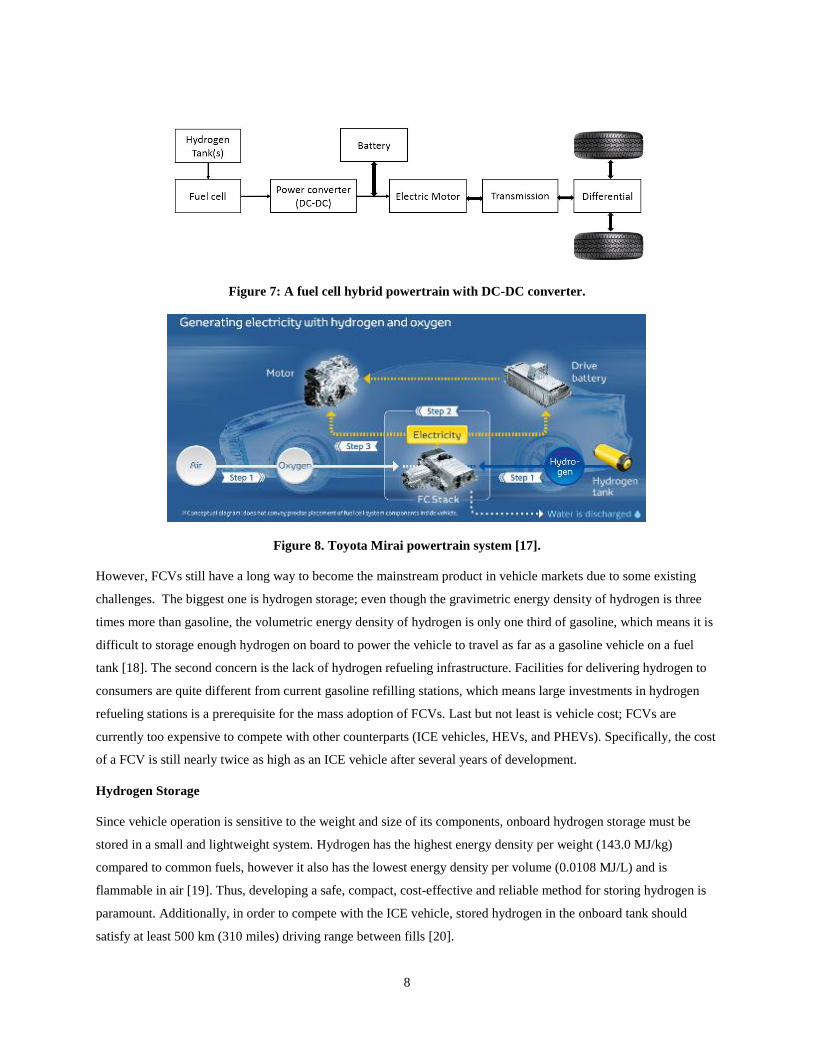
A typical hybrid fuel cell powertrain is shown in Figure 7, which contains onboard hydrogen tank(s), fuel cell stack,
power converter (DC-DC), electric motor, transmission, differential and wheels. The most popular FCHV in the
market, the Toyota Mirai, utilizes this configuration with approximately 650 km cruising range and approximately
three minutes refueling time. The operation of a Toyota Mirai powertrain can be divided into three steps (see Figure
8):
Oxygen and hydrogen are transmitted to the fuel cell stack to start the chemical reaction;
Electricity is produced through the chemical reaction;
The fuel cell stack outputs power and current to the electric motor and charges the drive battery, and the drive
battery supplies additional power to the motor when necessary.
Figure 6: Typical operating characteristics of a fuel cell system [16].
8
Figure 7: A fuel cell hybrid powertrain with DC-DC converter.
Figure 8. Toyota Mirai powertrain system [17].
However, FCVs still have a long way to become the mainstream product in vehicle markets due to some existing
challenges. The biggest one is hydrogen storage; even though the gravimetric energy density of hydrogen is three
times more than gasoline, the volumetric energy density of hydrogen is only one third of gasoline, which means it is
difficult to storage enough hydrogen on board to power the vehicle to travel as far as a gasoline vehicle on a fuel
tank [18]. The second concern is the lack of hydrogen refueling infrastructure. Facilities for delivering hydrogen to
consumers are quite different from current gasoline refilling stations, which means large investments in hydrogen
refueling stations is a prerequisite for the mass adoption of FCVs. Last but not least is vehicle cost; FCVs are
currently too expensive to compete with other counterparts (ICE vehicles, HEVs, and PHEVs). Specifically, the cost
of a FCV is still nearly twice as high as an ICE vehicle after several years of development.
Hydrogen Storage
Since vehicle operation is sensitive to the weight and size of its components, onboard hydrogen storage must be
stored in a small and lightweight system. Hydrogen has the highest energy density per weight (143.0 MJ/kg)
compared to common fuels, however it also has the lowest energy density per volume (0.0108 MJ/L) and is
flammable in air [19]. Thus, developing a safe, compact, cost-effective and reliable method for storing hydrogen is
paramount. Additionally, in order to compete with the ICE vehicle, stored hydrogen in the onboard tank should
satisfy at least 500 km (310 miles) driving range between fills [20].
9
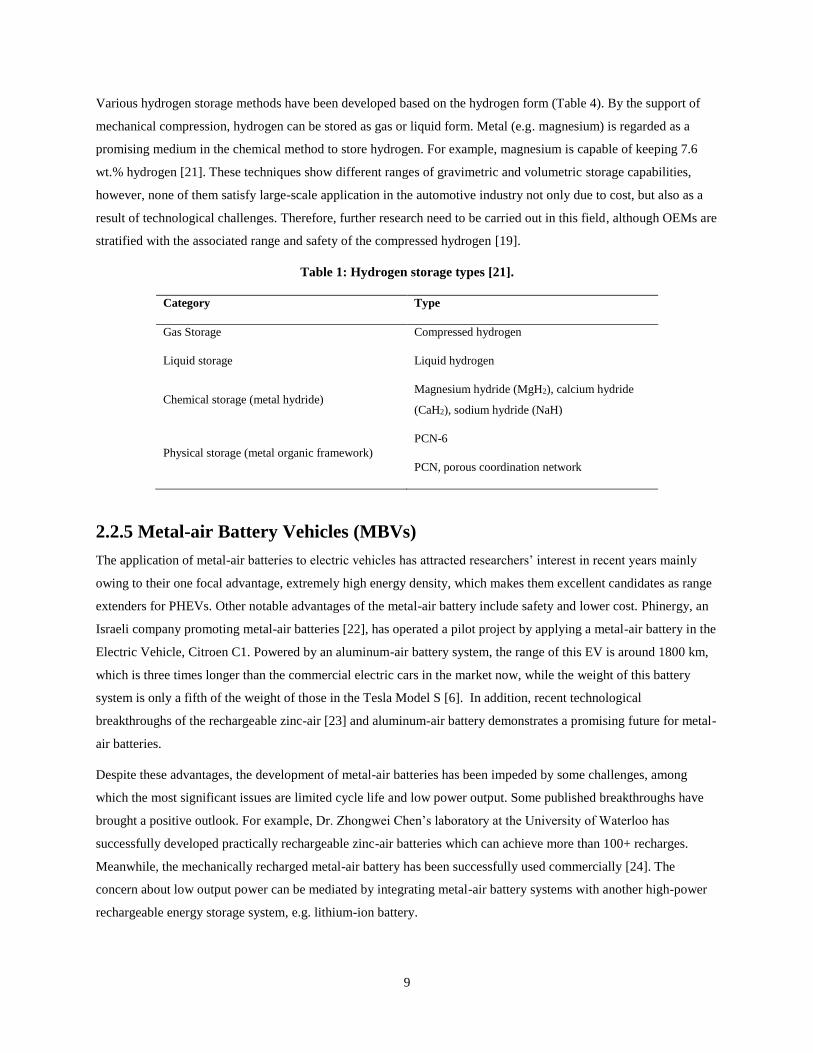
Various hydrogen storage methods have been developed based on the hydrogen form (Table 4). By the support of
mechanical compression, hydrogen can be stored as gas or liquid form. Metal (e.g. magnesium) is regarded as a
promising medium in the chemical method to store hydrogen. For example, magnesium is capable of keeping 7.6
wt.% hydrogen [21]. These techniques show different ranges of gravimetric and volumetric storage capabilities,
however, none of them satisfy large-scale application in the automotive industry not only due to cost, but also as a
result of technological challenges. Therefore, further research need to be carried out in this field, although OEMs are
stratified with the associated range and safety of the compressed hydrogen [19].
Table 1: Hydrogen storage types [21].
Category Type
Gas Storage Compressed hydrogen
Liquid storage Liquid hydrogen
Chemical storage (metal hydride) Magnesium hydride (MgH2), calcium hydride
(CaH2), sodium hydride (NaH)
Physical storage (metal organic framework)
PCN-6
PCN, porous coordination network
2.2.5 Metal-air Battery Vehicles (MBVs)
The application of metal-air batteries to electric vehicles has attracted researchers’ interest in recent years mainly
owing to their one focal advantage, extremely high energy density, which makes them excellent candidates as range
extenders for PHEVs. Other notable advantages of the metal-air battery include safety and lower cost. Phinergy, an
Israeli company promoting metal-air batteries [22], has operated a pilot project by applying a metal-air battery in the
Electric Vehicle, Citroen C1. Powered by an aluminum-air battery system, the range of this EV is around 1800 km,
which is three times longer than the commercial electric cars in the market now, while the weight of this battery
system is only a fifth of the weight of those in the Tesla Model S [6]. In addition, recent technological
breakthroughs of the rechargeable zinc-air [23] and aluminum-air battery demonstrates a promising future for metal-
air batteries.
Despite these advantages, the development of metal-air batteries has been impeded by some challenges, among
which the most significant issues are limited cycle life and low power output. Some published breakthroughs have
brought a positive outlook. For example, Dr. Zhongwei Chen’s laboratory at the University of Waterloo has
successfully developed practically rechargeable zinc-air batteries which can achieve more than 100+ recharges.
Meanwhile, the mechanically recharged metal-air battery has been successfully used commercially [24]. The
concern about low output power can be mediated by integrating metal-air battery systems with another high-power
rechargeable energy storage system, e.g. lithium-ion battery.
10
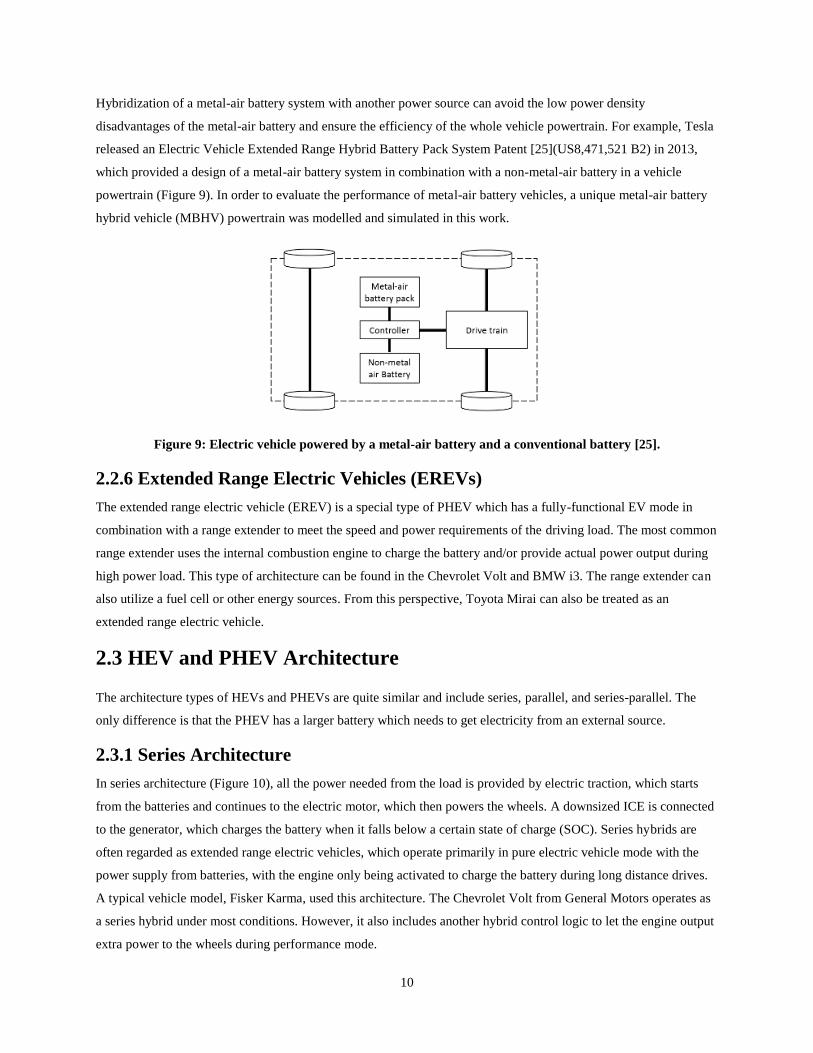
Hybridization of a metal-air battery system with another power source can avoid the low power density
disadvantages of the metal-air battery and ensure the efficiency of the whole vehicle powertrain. For example, Tesla
released an Electric Vehicle Extended Range Hybrid Battery Pack System Patent [25](US8,471,521 B2) in 2013,
which provided a design of a metal-air battery system in combination with a non-metal-air battery in a vehicle
powertrain (Figure 9). In order to evaluate the performance of metal-air battery vehicles, a unique metal-air battery
hybrid vehicle (MBHV) powertrain was modelled and simulated in this work.
Figure 9: Electric vehicle powered by a metal-air battery and a conventional battery [25].
2.2.6 Extended Range Electric Vehicles (EREVs)
The extended range electric vehicle (EREV) is a special type of PHEV which has a fully-functional EV mode in
combination with a range extender to meet the speed and power requirements of the driving load. The most common
range extender uses the internal combustion engine to charge the battery and/or provide actual power output during
high power load. This type of architecture can be found in the Chevrolet Volt and BMW i3. The range extender can
also utilize a fuel cell or other energy sources. From this perspective, Toyota Mirai can also be treated as an
extended range electric vehicle.
2.3 HEV and PHEV Architecture
The architecture types of HEVs and PHEVs are quite similar and include series, parallel, and series-parallel. The
only difference is that the PHEV has a larger battery which needs to get electricity from an external source.
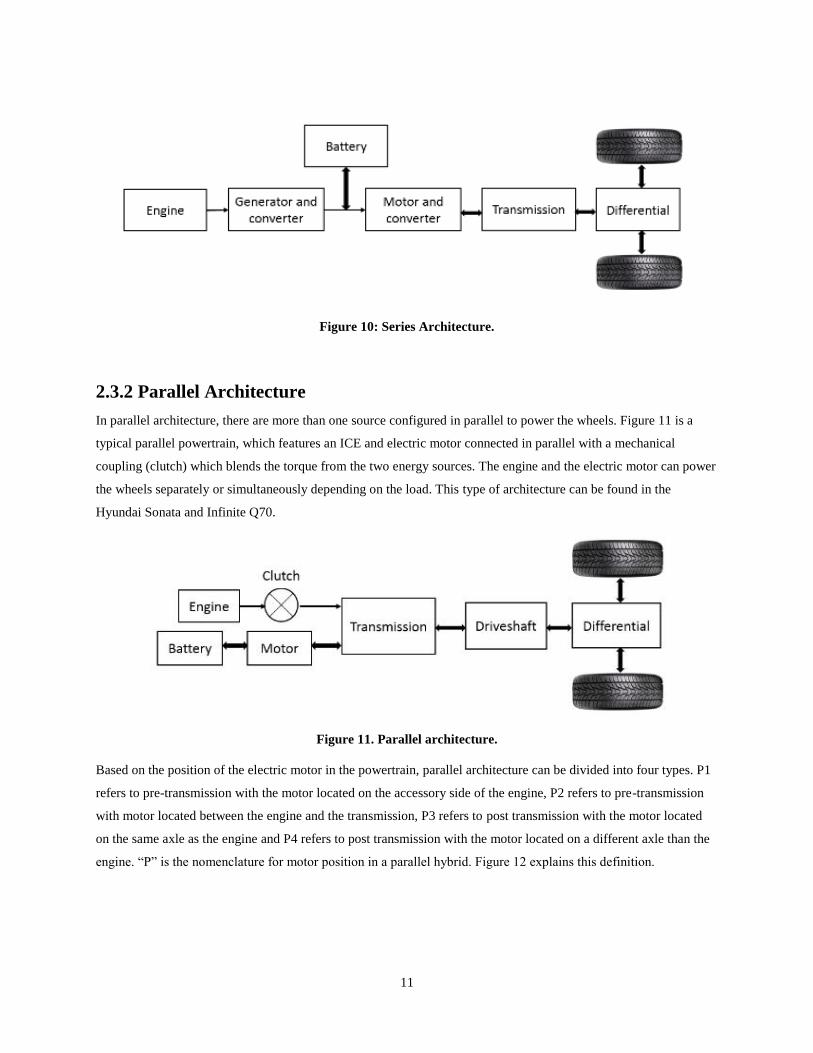
2.3.1 Series Architecture
In series architecture (Figure 10), all the power needed from the load is provided by electric traction, which starts
from the batteries and continues to the electric motor, which then powers the wheels. A downsized ICE is connected
to the generator, which charges the battery when it falls below a certain state of charge (SOC). Series hybrids are
often regarded as extended range electric vehicles, which operate primarily in pure electric vehicle mode with the
power supply from batteries, with the engine only being activated to charge the battery during long distance drives.
A typical vehicle model, Fisker Karma, used this architecture. The Chevrolet Volt from General Motors operates as
a series hybrid under most conditions. However, it also includes another hybrid control logic to let the engine output
extra power to the wheels during performance mode.
11
Figure 10: Series Architecture.
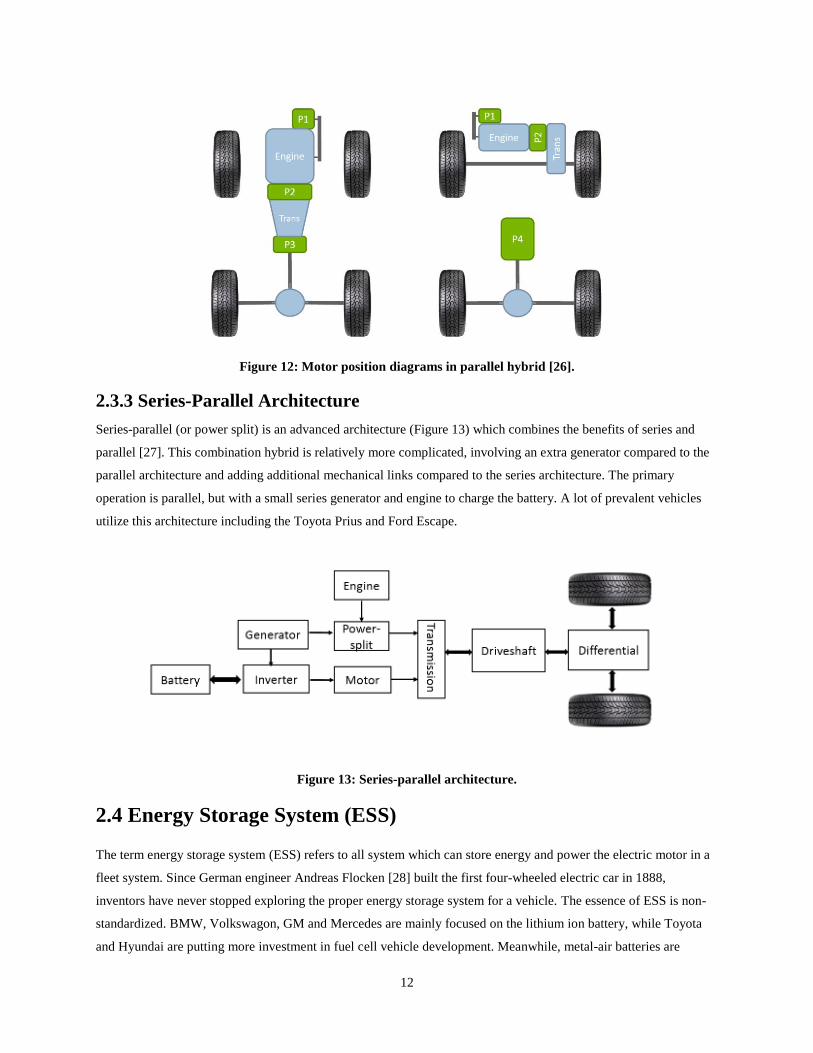
2.3.2 Parallel Architecture
In parallel architecture, there are more than one source configured in parallel to power the wheels. Figure 11 is a
typical parallel powertrain, which features an ICE and electric motor connected in parallel with a mechanical
coupling (clutch) which blends the torque from the two energy sources. The engine and the electric motor can power
the wheels separately or simultaneously depending on the load. This type of architecture can be found in the
Hyundai Sonata and Infinite Q70.
Figure 11. Parallel architecture.
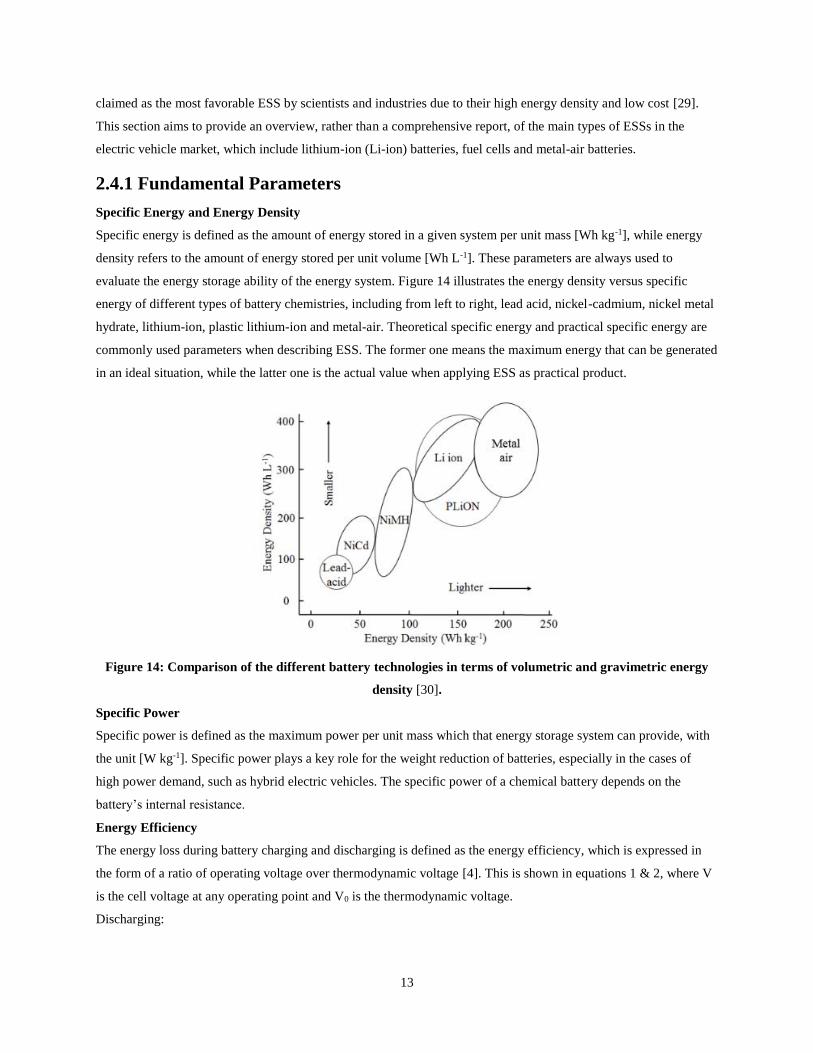
Based on the position of the electric motor in the powertrain, parallel architecture can be divided into four types. P1
refers to pre-transmission with the motor located on the accessory side of the engine, P2 refers to pre-transmission
with motor located between the engine and the transmission, P3 refers to post transmission with the motor located
on the same axle as the engine and P4 refers to post transmission with the motor located on a different axle than the
engine. “P” is the nomenclature for motor position in a parallel hybrid. Figure 12 explains this definition.
12
Figure 12: Motor position diagrams in parallel hybrid [26].
2.3.3 Series-Parallel Architecture
Series-parallel (or power split) is an advanced architecture (Figure 13) which combines the benefits of series and
parallel [27]. This combination hybrid is relatively more complicated, involving an extra generator compared to the
parallel architecture and adding additional mechanical links compared to the series architecture. The primary
operation is parallel, but with a small series generator and engine to charge the battery. A lot of prevalent vehicles
utilize this architecture including the Toyota Prius and Ford Escape.
Figure 13: Series-parallel architecture.
2.4 Energy Storage System (ESS)
The term energy storage system (ESS) refers to all system which can store energy and power the electric motor in a
fleet system. Since German engineer Andreas Flocken [28] built the first four-wheeled electric car in 1888,
inventors have never stopped exploring the proper energy storage system for a vehicle. The essence of ESS is non-
standardized. BMW, Volkswagon, GM and Mercedes are mainly focused on the lithium ion battery, while Toyota
and Hyundai are putting more investment in fuel cell vehicle development. Meanwhile, metal-air batteries are
13
claimed as the most favorable ESS by scientists and industries due to their high energy density and low cost [29].
This section aims to provide an overview, rather than a comprehensive report, of the main types of ESSs in the
electric vehicle market, which include lithium-ion (Li-ion) batteries, fuel cells and metal-air batteries.
2.4.1 Fundamental Parameters
Specific Energy and Energy Density
Specific energy is defined as the amount of energy stored in a given system per unit mass [Wh kg-1], while energy
density refers to the amount of energy stored per unit volume [Wh L-1]. These parameters are always used to
evaluate the energy storage ability of the energy system. Figure 14 illustrates the energy density versus specific
energy of different types of battery chemistries, including from left to right, lead acid, nickel-cadmium, nickel metal
hydrate, lithium-ion, plastic lithium-ion and metal-air. Theoretical specific energy and practical specific energy are
commonly used parameters when describing ESS. The former one means the maximum energy that can be generated
in an ideal situation, while the latter one is the actual value when applying ESS as practical product.
Figure 14: Comparison of the different battery technologies in terms of volumetric and gravimetric energy
density [30].
Specific Power
Specific power is defined as the maximum power per unit mass which that energy storage system can provide, with
the unit [W kg-1]. Specific power plays a key role for the weight reduction of batteries, especially in the cases of
high power demand, such as hybrid electric vehicles. The specific power of a chemical battery depends on the
battery’s internal resistance.
Energy Efficiency
The energy loss during battery charging and discharging is defined as the energy efficiency, which is expressed in
the form of a ratio of operating voltage over thermodynamic voltage [4]. This is shown in equations 1 & 2, where V
is the cell voltage at any operating point and V0 is the thermodynamic voltage.
Discharging:
14
𝛈 =𝐯𝐜𝐞𝐥𝐥 𝐯𝐨𝐥𝐭𝐚𝐠𝐞
𝐕𝟎𝐭𝐡𝐞𝐫𝐦𝐨𝐝𝐲𝐧𝐚𝐦𝐢𝐜 𝐯𝐨𝐥𝐭𝐚𝐠𝐞 (Eq. 1)
Charging:
𝛈 =𝐕𝟎𝐭𝐡𝐞𝐫𝐦𝐨 𝐝𝐲𝐧𝐚𝐦𝐢𝐜𝐯𝐨𝐥𝐭𝐚𝐠𝐞
𝐕𝐜𝐞𝐥𝐥 𝐯𝐨𝐥𝐭𝐚𝐠𝐞 (Eq. 2)
State of charge (SOC) refers to the remaining capacity in the battery. The unit of SOC are percentage points
(0%=empty; 100% = full). SOC is normally used when discussing the current state of a battery in use. The
estimation of SOC can help to decide the thresholds of each battery operation mode (i.e. charging or discharging),
and can also avoid over-charging and over-discharging.
Depth of Discharge (DOD) is the inverse of SOC (100% = empty; 0% = full), one over SOC. DOD is most often
seen when discussing the lifetime of the battery after repeated use.
State of Health (SOH) is the condition of a battery at present compared to its initial status. The units of SOH are
percent points (100% = the battery is a new one). Through SOH detection, the battery life and health status can be
estimated and the percentage of battery aging can be used to decide whether or not to replace it.
Open Circuit Voltage (OCV)
Battery open circuit voltage is the voltage across the positive and negative terminals of a battery when there is no
load connected to it. The OCV depends on the state of charge, working temperature and past charging & discharging
history (SOH).
2.4.2 Lithium ion Battery
Since Sony commercialized the first lithium-ion battery in 1991, rechargeable lithium ion batteries gradually became
the dominator in the battery market compared to other types of battery technology. This is due to its excellent
combination of high energy density, high power density, long span life and environmental friendliness. It is reported
by Navigant Research that the revenue from lithium-ion batteries in the electric vehicle industry will grow from
USD 5.7 billion in 2014 to USD 24.1 billion in 2023 [31]. This section will cover the basic knowledge of lithium-
ion batteries.
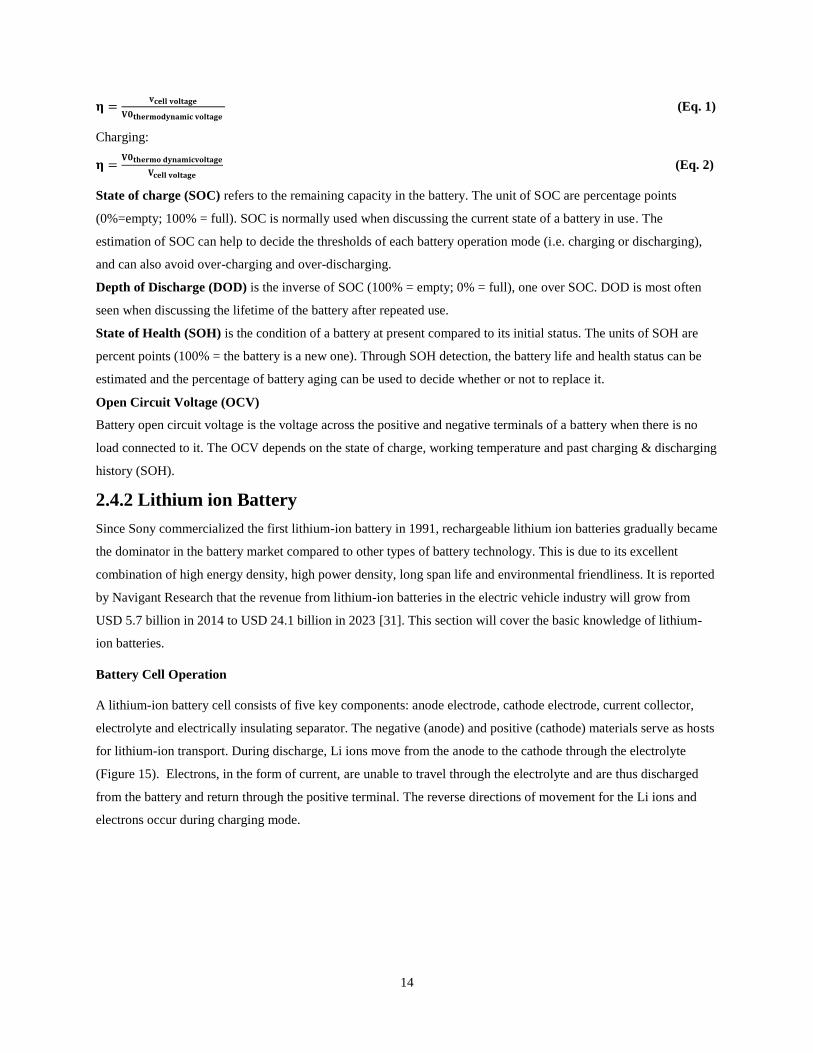
Battery Cell Operation
A lithium-ion battery cell consists of five key components: anode electrode, cathode electrode, current collector,
electrolyte and electrically insulating separator. The negative (anode) and positive (cathode) materials serve as hosts
for lithium-ion transport. During discharge, Li ions move from the anode to the cathode through the electrolyte
(Figure 15). Electrons, in the form of current, are unable to travel through the electrolyte and are thus discharged
from the battery and return through the positive terminal. The reverse directions of movement for the Li ions and
electrons occur during charging mode.
15
Figure 15: Operational schematic of a lithium ion battery [32].
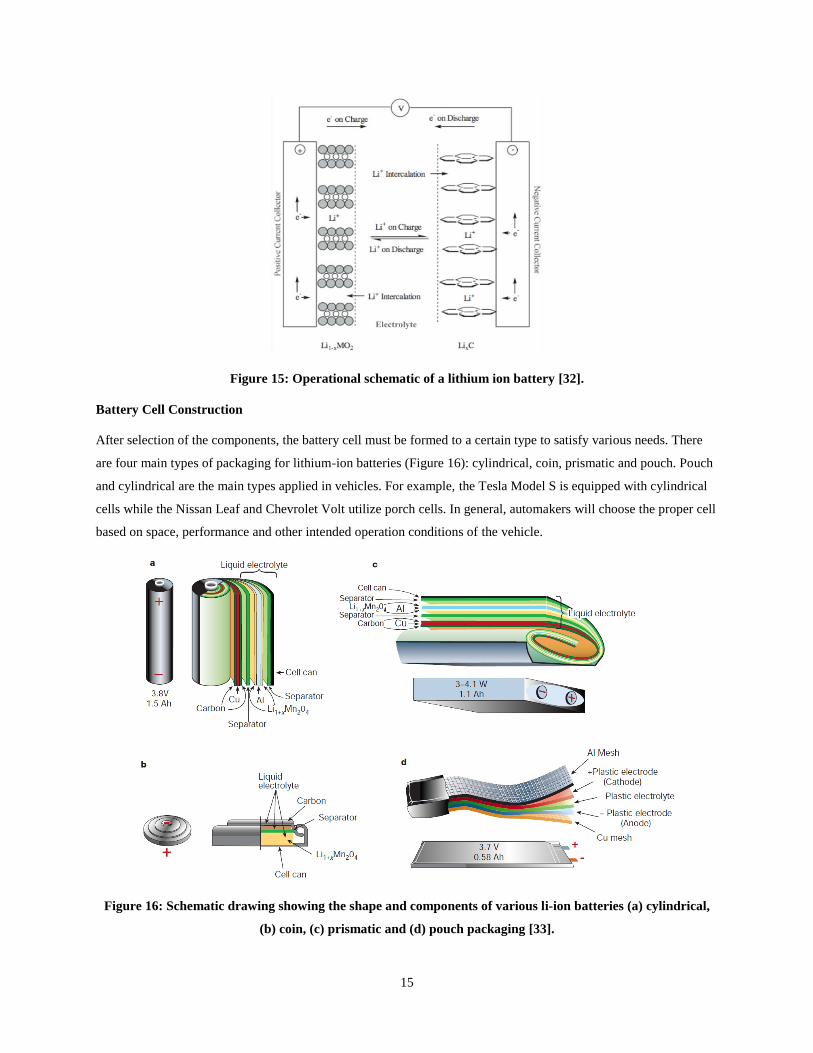
Battery Cell Construction
After selection of the components, the battery cell must be formed to a certain type to satisfy various needs. There
are four main types of packaging for lithium-ion batteries (Figure 16): cylindrical, coin, prismatic and pouch. Pouch
and cylindrical are the main types applied in vehicles. For example, the Tesla Model S is equipped with cylindrical
cells while the Nissan Leaf and Chevrolet Volt utilize porch cells. In general, automakers will choose the proper cell
based on space, performance and other intended operation conditions of the vehicle.
Figure 16: Schematic drawing showing the shape and components of various li-ion batteries (a) cylindrical,
(b) coin, (c) prismatic and (d) pouch packaging [33].
16
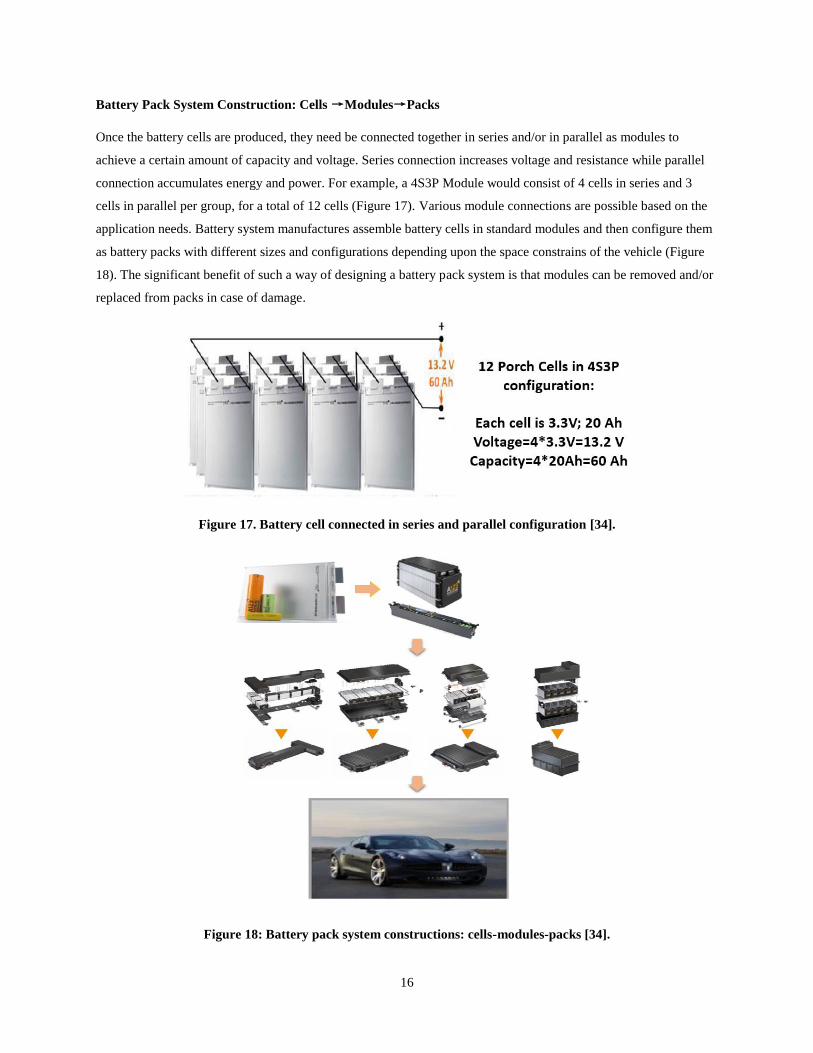
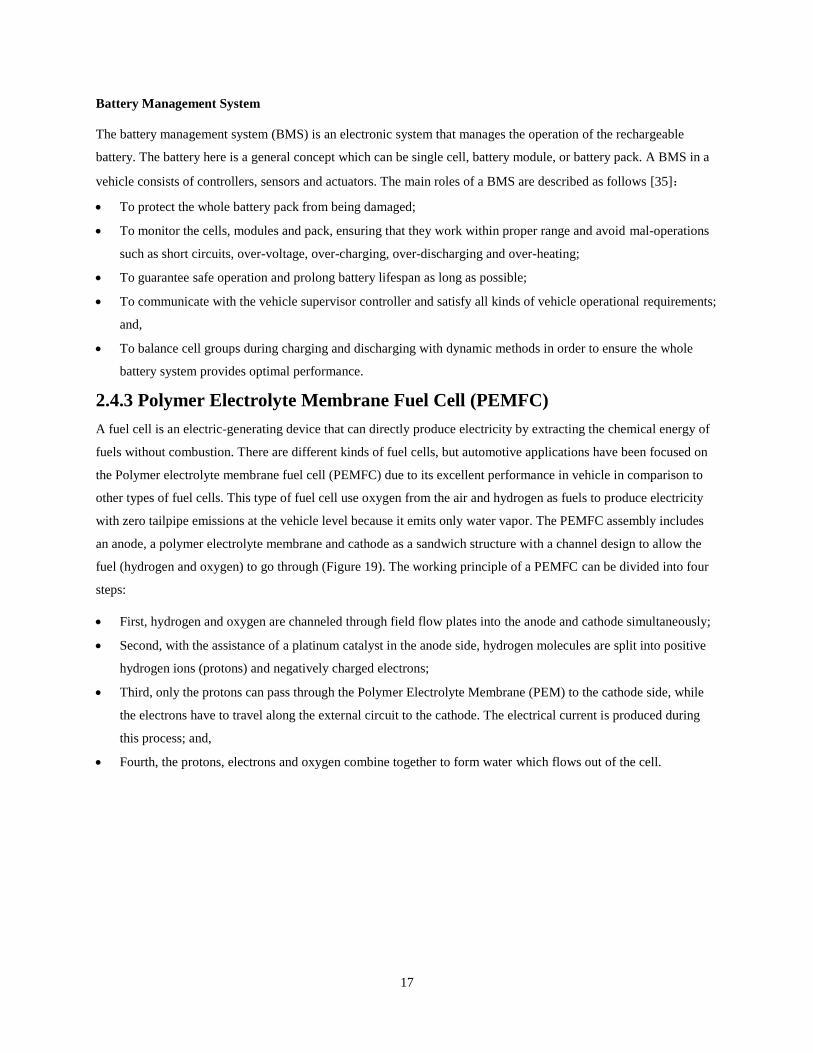
Battery Pack System Construction: Cells →Modules→Packs
Once the battery cells are produced, they need be connected together in series and/or in parallel as modules to
achieve a certain amount of capacity and voltage. Series connection increases voltage and resistance while parallel
connection accumulates energy and power. For example, a 4S3P Module would consist of 4 cells in series and 3
cells in parallel per group, for a total of 12 cells (Figure 17). Various module connections are possible based on the
application needs. Battery system manufactures assemble battery cells in standard modules and then configure them
as battery packs with different sizes and configurations depending upon the space constrains of the vehicle (Figure
18). The significant benefit of such a way of designing a battery pack system is that modules can be removed and/or
replaced from packs in case of damage.
Figure 17. Battery cell connected in series and parallel configuration [34].
Figure 18: Battery pack system constructions: cells-modules-packs [34].
17
Battery Management System
The battery management system (BMS) is an electronic system that manages the operation of the rechargeable
battery. The battery here is a general concept which can be single cell, battery module, or battery pack. A BMS in a
vehicle consists of controllers, sensors and actuators. The main roles of a BMS are described as follows [35]:
To protect the whole battery pack from being damaged;
To monitor the cells, modules and pack, ensuring that they work within proper range and avoid mal-operations
such as short circuits, over-voltage, over-charging, over-discharging and over-heating;
To guarantee safe operation and prolong battery lifespan as long as possible;
To communicate with the vehicle supervisor controller and satisfy all kinds of vehicle operational requirements;
and,
To balance cell groups during charging and discharging with dynamic methods in order to ensure the whole
battery system provides optimal performance.
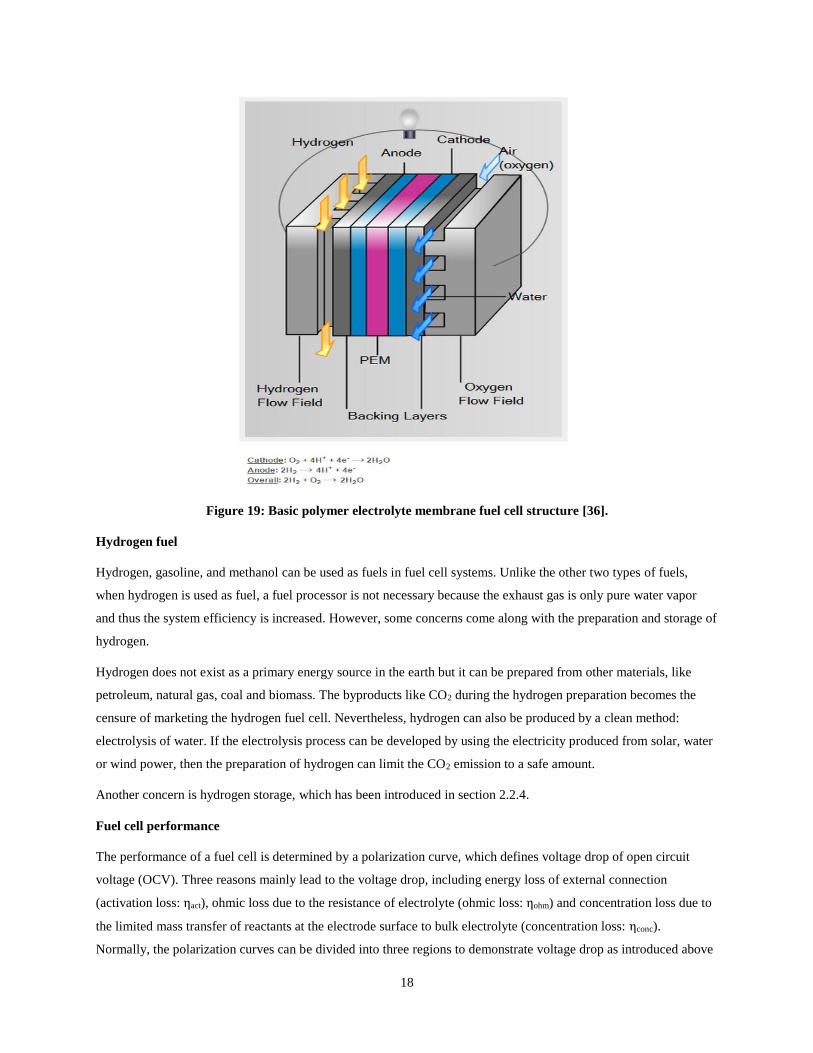
2.4.3 Polymer Electrolyte Membrane Fuel Cell (PEMFC)
A fuel cell is an electric-generating device that can directly produce electricity by extracting the chemical energy of
fuels without combustion. There are different kinds of fuel cells, but automotive applications have been focused on
the Polymer electrolyte membrane fuel cell (PEMFC) due to its excellent performance in vehicle in comparison to
other types of fuel cells. This type of fuel cell use oxygen from the air and hydrogen as fuels to produce electricity
with zero tailpipe emissions at the vehicle level because it emits only water vapor. The PEMFC assembly includes
an anode, a polymer electrolyte membrane and cathode as a sandwich structure with a channel design to allow the
fuel (hydrogen and oxygen) to go through (Figure 19). The working principle of a PEMFC can be divided into four
steps:
First, hydrogen and oxygen are channeled through field flow plates into the anode and cathode simultaneously;
Second, with the assistance of a platinum catalyst in the anode side, hydrogen molecules are split into positive
hydrogen ions (protons) and negatively charged electrons;
Third, only the protons can pass through the Polymer Electrolyte Membrane (PEM) to the cathode side, while
the electrons have to travel along the external circuit to the cathode. The electrical current is produced during
this process; and,
Fourth, the protons, electrons and oxygen combine together to form water which flows out of the cell.
18
Figure 19: Basic polymer electrolyte membrane fuel cell structure [36].
Hydrogen fuel
Hydrogen, gasoline, and methanol can be used as fuels in fuel cell systems. Unlike the other two types of fuels,
when hydrogen is used as fuel, a fuel processor is not necessary because the exhaust gas is only pure water vapor
and thus the system efficiency is increased. However, some concerns come along with the preparation and storage of
hydrogen.
Hydrogen does not exist as a primary energy source in the earth but it can be prepared from other materials, like
petroleum, natural gas, coal and biomass. The byproducts like CO2 during the hydrogen preparation becomes the
censure of marketing the hydrogen fuel cell. Nevertheless, hydrogen can also be produced by a clean method:
electrolysis of water. If the electrolysis process can be developed by using the electricity produced from solar, water
or wind power, then the preparation of hydrogen can limit the CO2 emission to a safe amount.
Another concern is hydrogen storage, which has been introduced in section 2.2.4.
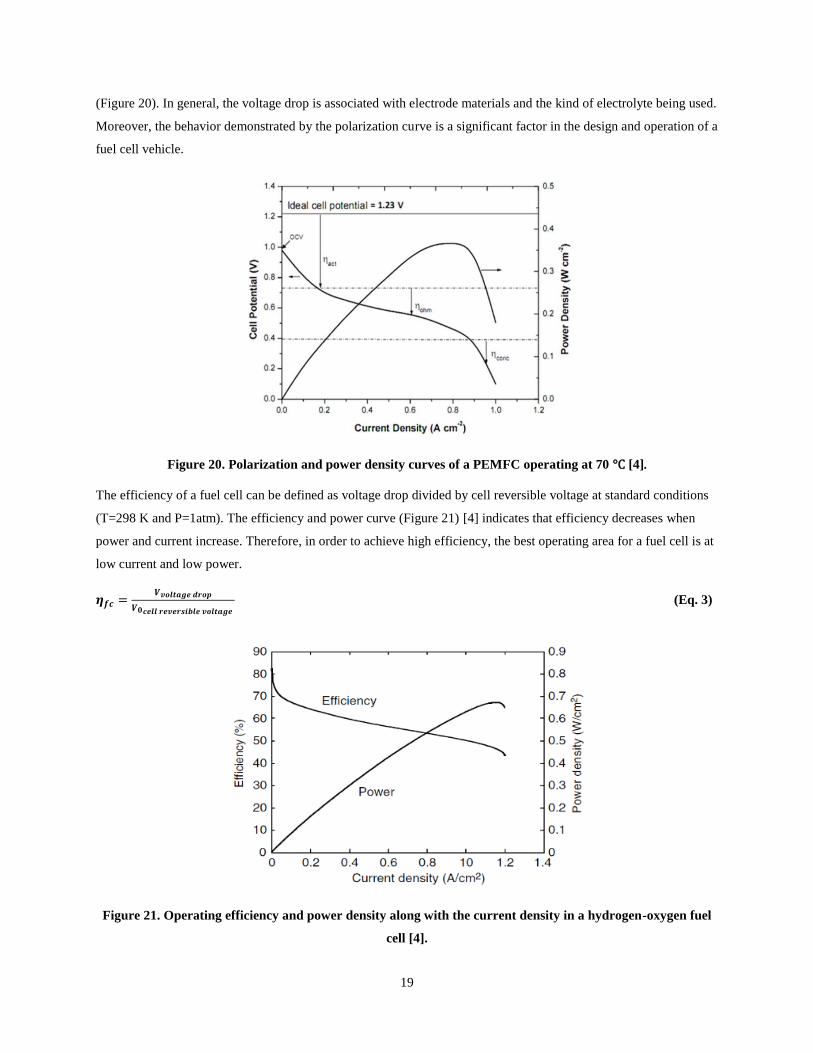
Fuel cell performance
The performance of a fuel cell is determined by a polarization curve, which defines voltage drop of open circuit
voltage (OCV). Three reasons mainly lead to the voltage drop, including energy loss of external connection
(activation loss: ηact), ohmic loss due to the resistance of electrolyte (ohmic loss: ηohm) and concentration loss due to
the limited mass transfer of reactants at the electrode surface to bulk electrolyte (concentration loss: ηconc).
Normally, the polarization curves can be divided into three regions to demonstrate voltage drop as introduced above
19
(Figure 20). In general, the voltage drop is associated with electrode materials and the kind of electrolyte being used.
Moreover, the behavior demonstrated by the polarization curve is a significant factor in the design and operation of a
fuel cell vehicle.
Figure 20. Polarization and power density curves of a PEMFC operating at 70 °C [4].
The efficiency of a fuel cell can be defined as voltage drop divided by cell reversible voltage at standard conditions
(T=298 K and P=1atm). The efficiency and power curve (Figure 21) [4] indicates that efficiency decreases when
power and current increase. Therefore, in order to achieve high efficiency, the best operating area for a fuel cell is at
low current and low power.
𝜼𝒇𝒄 =𝑽𝒗𝒐𝒍𝒕𝒂𝒈𝒆 𝒅𝒓𝒐𝒑
𝑽𝟎𝒄𝒆𝒍𝒍 𝒓𝒆𝒗𝒆𝒓𝒔𝒊𝒃𝒍𝒆 𝒗𝒐𝒍𝒕𝒂𝒈𝒆 (Eq. 3)
Figure 21. Operating efficiency and power density along with the current density in a hydrogen-oxygen fuel
cell [4].
20
Fuel cell stack
The voltage of a single fuel cell is around 1.16 volts, which is far from enough to power a vehicle. Therefore,
multiple fuel cells must be stacked together into a fuel cell stack to satisfy vehicle power and voltage requirements.
In other words, the potential power and voltage of the fuel cell output is dependent on the number of fuel cells in the
fuel cell stack as well as the surface area of the PEMFC.
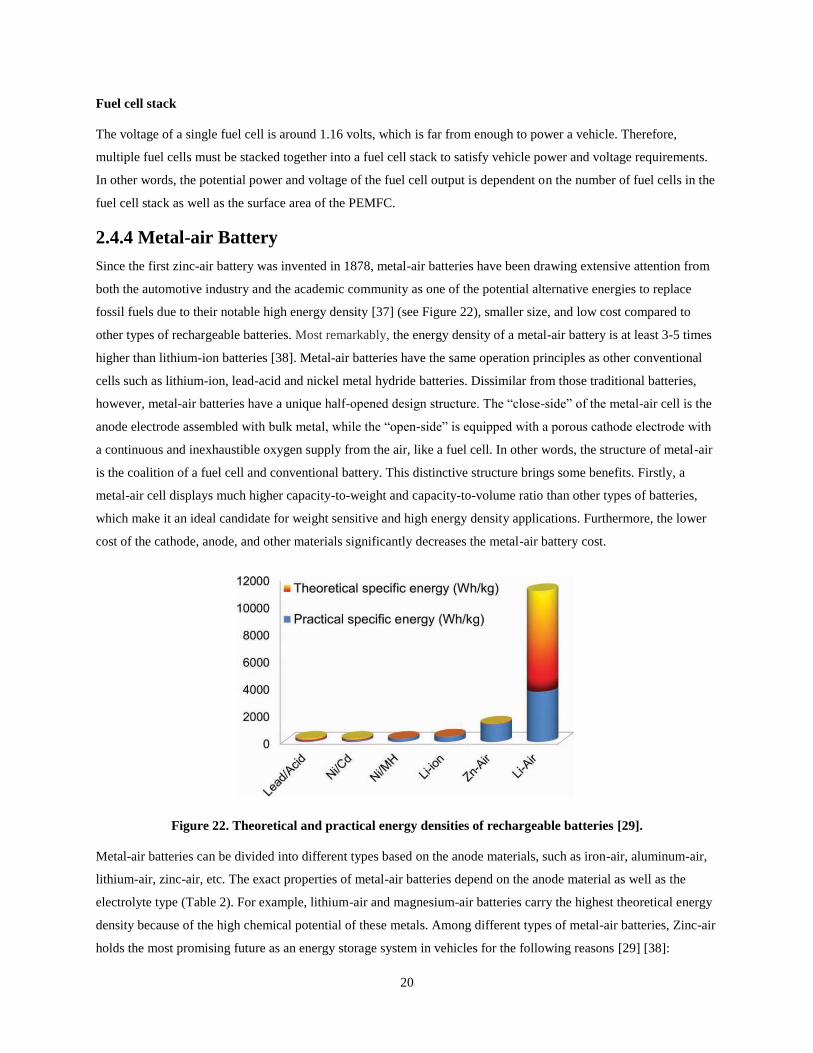
2.4.4 Metal-air Battery
Since the first zinc-air battery was invented in 1878, metal-air batteries have been drawing extensive attention from
both the automotive industry and the academic community as one of the potential alternative energies to replace
fossil fuels due to their notable high energy density [37] (see Figure 22), smaller size, and low cost compared to
other types of rechargeable batteries. Most remarkably, the energy density of a metal-air battery is at least 3-5 times
higher than lithium-ion batteries [38]. Metal-air batteries have the same operation principles as other conventional
cells such as lithium-ion, lead-acid and nickel metal hydride batteries. Dissimilar from those traditional batteries,
however, metal-air batteries have a unique half-opened design structure. The “close-side” of the metal-air cell is the
anode electrode assembled with bulk metal, while the “open-side” is equipped with a porous cathode electrode with
a continuous and inexhaustible oxygen supply from the air, like a fuel cell. In other words, the structure of metal-air
is the coalition of a fuel cell and conventional battery. This distinctive structure brings some benefits. Firstly, a
metal-air cell displays much higher capacity-to-weight and capacity-to-volume ratio than other types of batteries,
which make it an ideal candidate for weight sensitive and high energy density applications. Furthermore, the lower
cost of the cathode, anode, and other materials significantly decreases the metal-air battery cost.
Figure 22. Theoretical and practical energy densities of rechargeable batteries [29].
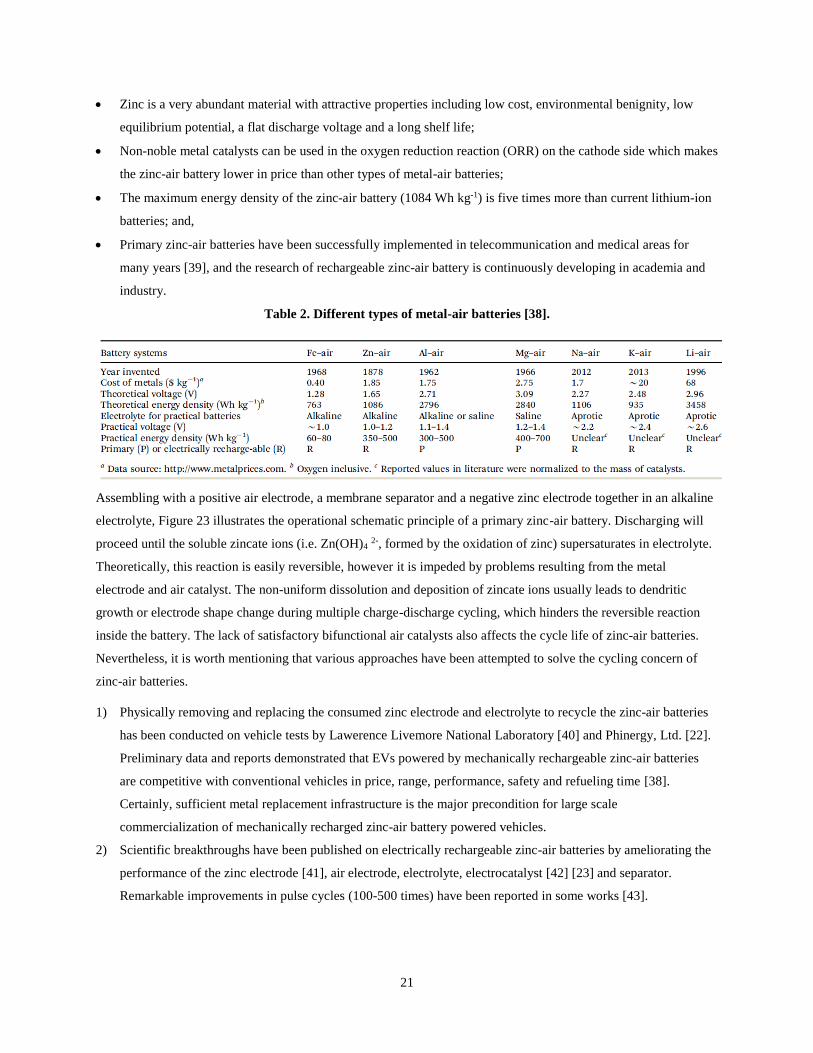
Metal-air batteries can be divided into different types based on the anode materials, such as iron-air, aluminum-air,
lithium-air, zinc-air, etc. The exact properties of metal-air batteries depend on the anode material as well as the
electrolyte type (Table 2). For example, lithium-air and magnesium-air batteries carry the highest theoretical energy
density because of the high chemical potential of these metals. Among different types of metal-air batteries, Zinc-air
holds the most promising future as an energy storage system in vehicles for the following reasons [29] [38]:
21
Zinc is a very abundant material with attractive properties including low cost, environmental benignity, low
equilibrium potential, a flat discharge voltage and a long shelf life;
Non-noble metal catalysts can be used in the oxygen reduction reaction (ORR) on the cathode side which makes
the zinc-air battery lower in price than other types of metal-air batteries;
The maximum energy density of the zinc-air battery (1084 Wh kg-1) is five times more than current lithium-ion
batteries; and,
Primary zinc-air batteries have been successfully implemented in telecommunication and medical areas for
many years [39], and the research of rechargeable zinc-air battery is continuously developing in academia and
industry.
Table 2. Different types of metal-air batteries [38].
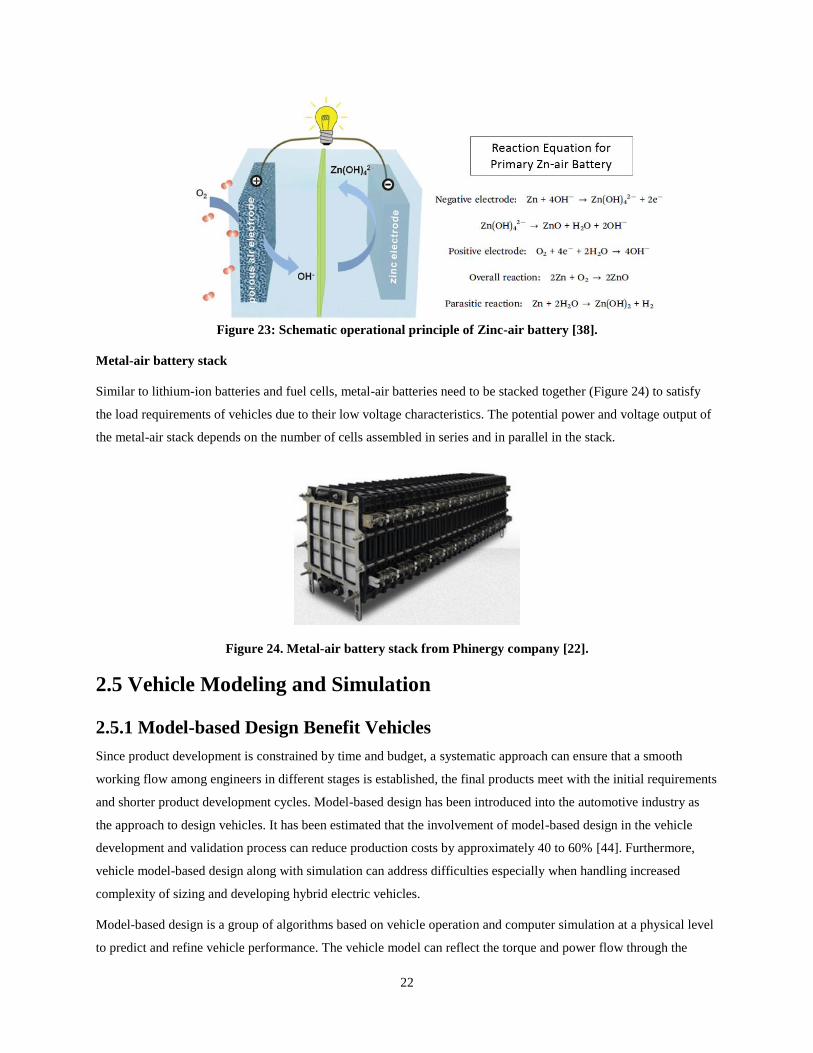
Assembling with a positive air electrode, a membrane separator and a negative zinc electrode together in an alkaline
electrolyte, Figure 23 illustrates the operational schematic principle of a primary zinc-air battery. Discharging will
proceed until the soluble zincate ions (i.e. Zn(OH)4 2-, formed by the oxidation of zinc) supersaturates in electrolyte.
Theoretically, this reaction is easily reversible, however it is impeded by problems resulting from the metal
electrode and air catalyst. The non-uniform dissolution and deposition of zincate ions usually leads to dendritic
growth or electrode shape change during multiple charge-discharge cycling, which hinders the reversible reaction
inside the battery. The lack of satisfactory bifunctional air catalysts also affects the cycle life of zinc-air batteries.
Nevertheless, it is worth mentioning that various approaches have been attempted to solve the cycling concern of
zinc-air batteries.
1) Physically removing and replacing the consumed zinc electrode and electrolyte to recycle the zinc-air batteries
has been conducted on vehicle tests by Lawerence Livemore National Laboratory [40] and Phinergy, Ltd. [22].
Preliminary data and reports demonstrated that EVs powered by mechanically rechargeable zinc-air batteries
are competitive with conventional vehicles in price, range, performance, safety and refueling time [38].
Certainly, sufficient metal replacement infrastructure is the major precondition for large scale
commercialization of mechanically recharged zinc-air battery powered vehicles.
2) Scientific breakthroughs have been published on electrically rechargeable zinc-air batteries by ameliorating the
performance of the zinc electrode [41], air electrode, electrolyte, electrocatalyst [42] [23] and separator.
Remarkable improvements in pulse cycles (100-500 times) have been reported in some works [43].
22
Figure 23: Schematic operational principle of Zinc-air battery [38].
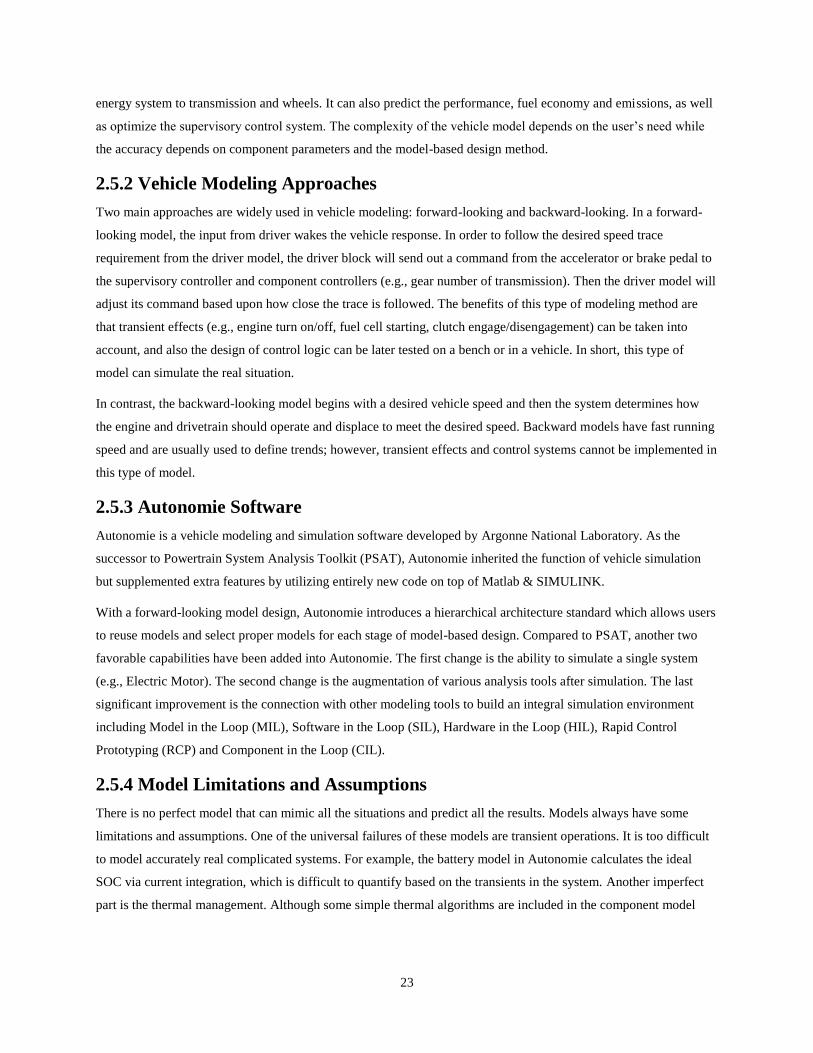
Metal-air battery stack
Similar to lithium-ion batteries and fuel cells, metal-air batteries need to be stacked together (Figure 24) to satisfy
the load requirements of vehicles due to their low voltage characteristics. The potential power and voltage output of
the metal-air stack depends on the number of cells assembled in series and in parallel in the stack.
Figure 24. Metal-air battery stack from Phinergy company [22].
2.5 Vehicle Modeling and Simulation
2.5.1 Model-based Design Benefit Vehicles
Since product development is constrained by time and budget, a systematic approach can ensure that a smooth
working flow among engineers in different stages is established, the final products meet with the initial requirements
and shorter product development cycles. Model-based design has been introduced into the automotive industry as
the approach to design vehicles. It has been estimated that the involvement of model-based design in the vehicle
development and validation process can reduce production costs by approximately 40 to 60% [44]. Furthermore,
vehicle model-based design along with simulation can address difficulties especially when handling increased
complexity of sizing and developing hybrid electric vehicles.
Model-based design is a group of algorithms based on vehicle operation and computer simulation at a physical level
to predict and refine vehicle performance. The vehicle model can reflect the torque and power flow through the
23
energy system to transmission and wheels. It can also predict the performance, fuel economy and emissions, as well
as optimize the supervisory control system. The complexity of the vehicle model depends on the user’s need while
the accuracy depends on component parameters and the model-based design method.
2.5.2 Vehicle Modeling Approaches
Two main approaches are widely used in vehicle modeling: forward-looking and backward-looking. In a forward-
looking model, the input from driver wakes the vehicle response. In order to follow the desired speed trace
requirement from the driver model, the driver block will send out a command from the accelerator or brake pedal to
the supervisory controller and component controllers (e.g., gear number of transmission). Then the driver model will
adjust its command based upon how close the trace is followed. The benefits of this type of modeling method are
that transient effects (e.g., engine turn on/off, fuel cell starting, clutch engage/disengagement) can be taken into
account, and also the design of control logic can be later tested on a bench or in a vehicle. In short, this type of
model can simulate the real situation.
In contrast, the backward-looking model begins with a desired vehicle speed and then the system determines how
the engine and drivetrain should operate and displace to meet the desired speed. Backward models have fast running
speed and are usually used to define trends; however, transient effects and control systems cannot be implemented in
this type of model.
2.5.3 Autonomie Software
Autonomie is a vehicle modeling and simulation software developed by Argonne National Laboratory. As the
successor to Powertrain System Analysis Toolkit (PSAT), Autonomie inherited the function of vehicle simulation
but supplemented extra features by utilizing entirely new code on top of Matlab & SIMULINK.
With a forward-looking model design, Autonomie introduces a hierarchical architecture standard which allows users
to reuse models and select proper models for each stage of model-based design. Compared to PSAT, another two
favorable capabilities have been added into Autonomie. The first change is the ability to simulate a single system
(e.g., Electric Motor). The second change is the augmentation of various analysis tools after simulation. The last
significant improvement is the connection with other modeling tools to build an integral simulation environment
including Model in the Loop (MIL), Software in the Loop (SIL), Hardware in the Loop (HIL), Rapid Control
Prototyping (RCP) and Component in the Loop (CIL).
2.5.4 Model Limitations and Assumptions
There is no perfect model that can mimic all the situations and predict all the results. Models always have some
limitations and assumptions. One of the universal failures of these models are transient operations. It is too difficult
to model accurately real complicated systems. For example, the battery model in Autonomie calculates the ideal
SOC via current integration, which is difficult to quantify based on the transients in the system. Another imperfect
part is the thermal management. Although some simple thermal algorithms are included in the component model
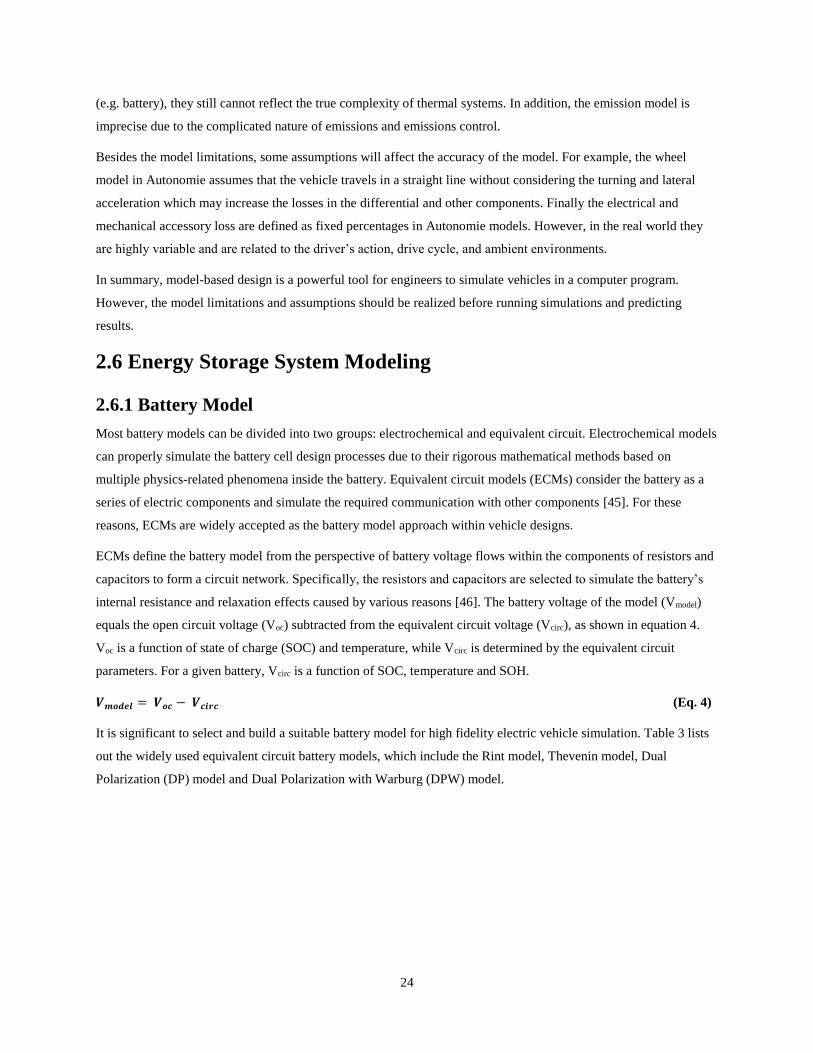
24
(e.g. battery), they still cannot reflect the true complexity of thermal systems. In addition, the emission model is
imprecise due to the complicated nature of emissions and emissions control.
Besides the model limitations, some assumptions will affect the accuracy of the model. For example, the wheel
model in Autonomie assumes that the vehicle travels in a straight line without considering the turning and lateral
acceleration which may increase the losses in the differential and other components. Finally the electrical and
mechanical accessory loss are defined as fixed percentages in Autonomie models. However, in the real world they
are highly variable and are related to the driver’s action, drive cycle, and ambient environments.
In summary, model-based design is a powerful tool for engineers to simulate vehicles in a computer program.
However, the model limitations and assumptions should be realized before running simulations and predicting
results.
2.6 Energy Storage System Modeling
2.6.1 Battery Model
Most battery models can be divided into two groups: electrochemical and equivalent circuit. Electrochemical models
can properly simulate the battery cell design processes due to their rigorous mathematical methods based on
multiple physics-related phenomena inside the battery. Equivalent circuit models (ECMs) consider the battery as a
series of electric components and simulate the required communication with other components [45]. For these
reasons, ECMs are widely accepted as the battery model approach within vehicle designs.
ECMs define the battery model from the perspective of battery voltage flows within the components of resistors and
capacitors to form a circuit network. Specifically, the resistors and capacitors are selected to simulate the battery’s
internal resistance and relaxation effects caused by various reasons [46]. The battery voltage of the model (Vmodel)
equals the open circuit voltage (Voc) subtracted from the equivalent circuit voltage (Vcirc), as shown in equation 4.
Voc is a function of state of charge (SOC) and temperature, while Vcirc is determined by the equivalent circuit
parameters. For a given battery, Vcirc is a function of SOC, temperature and SOH.
𝑽𝒎𝒐𝒅𝒆𝒍 = 𝑽𝒐𝒄 − 𝑽𝒄𝒊𝒓𝒄 (Eq. 4)
It is significant to select and build a suitable battery model for high fidelity electric vehicle simulation. Table 3 lists
out the widely used equivalent circuit battery models, which include the Rint model, Thevenin model, Dual
Polarization (DP) model and Dual Polarization with Warburg (DPW) model.
25
Table 3. Equivalent circuit models type [47].
The Department of Energy (DOE) applies an expanded Rint model for plug-in hybrid electric vehicle (PHEV)
battery testing. They modified the Rint model by adding diodes with different resistance to represent charge and
discharge currents [48]. The Rint model is the simplest battery model, but it cannot capture voltage hysteresis effects
(or time lagged response) at constant current. Other ECMs have built upon the Rint model by adding additional
circuit components which attempt to capture the hysteresis effect.
Equivalent circuit models can also be predicted by applying electrochemical impedance spectroscopy (EIS) tests
with alternating current (AC). EIS tests (or AC impedance method) is a diagnostic tool that uses equivalent electrical
circuits built from components such as resistors and capacitors to represent the electrochemical phenomenon. For
example, in the DPW model of the lithium-ion battery, R1 represents the conductivity of the electrodes, separator,
and electrolyte, R2|C1 represents double-layer resistance and faradic charge-transfer resistance and R3|Warburg part
represents the diffusion of lithium ion or faradic impedance corresponding to kinetics. These relationships can be
demonstrated by Nyquist plots fitted with the DPW model (see Figure 25), where R1, R2, R3, and Warburg
corresponds to the initial gap, first semi-circle, second semi-circle and “tail” respectively [49].
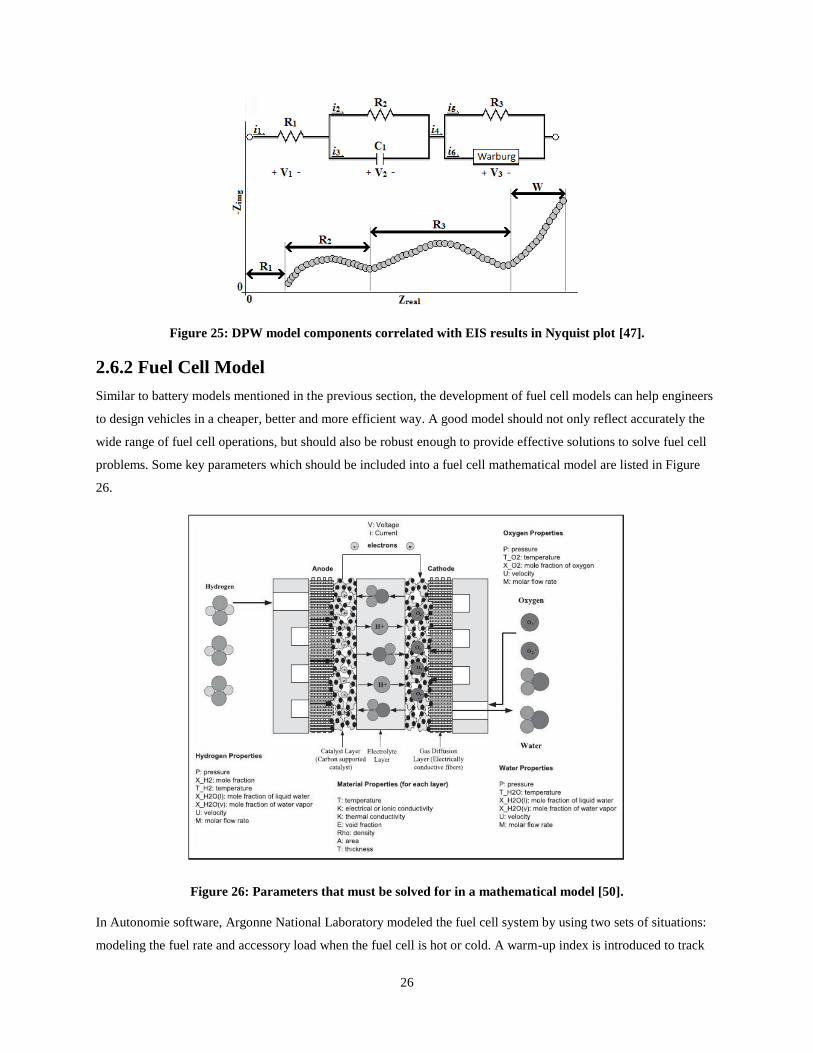
26
Figure 25: DPW model components correlated with EIS results in Nyquist plot [47].
2.6.2 Fuel Cell Model
Similar to battery models mentioned in the previous section, the development of fuel cell models can help engineers
to design vehicles in a cheaper, better and more efficient way. A good model should not only reflect accurately the
wide range of fuel cell operations, but should also be robust enough to provide effective solutions to solve fuel cell
problems. Some key parameters which should be included into a fuel cell mathematical model are listed in Figure
26.
Figure 26: Parameters that must be solved for in a mathematical model [50].
In Autonomie software, Argonne National Laboratory modeled the fuel cell system by using two sets of situations:
modeling the fuel rate and accessory load when the fuel cell is hot or cold. A warm-up index is introduced to track
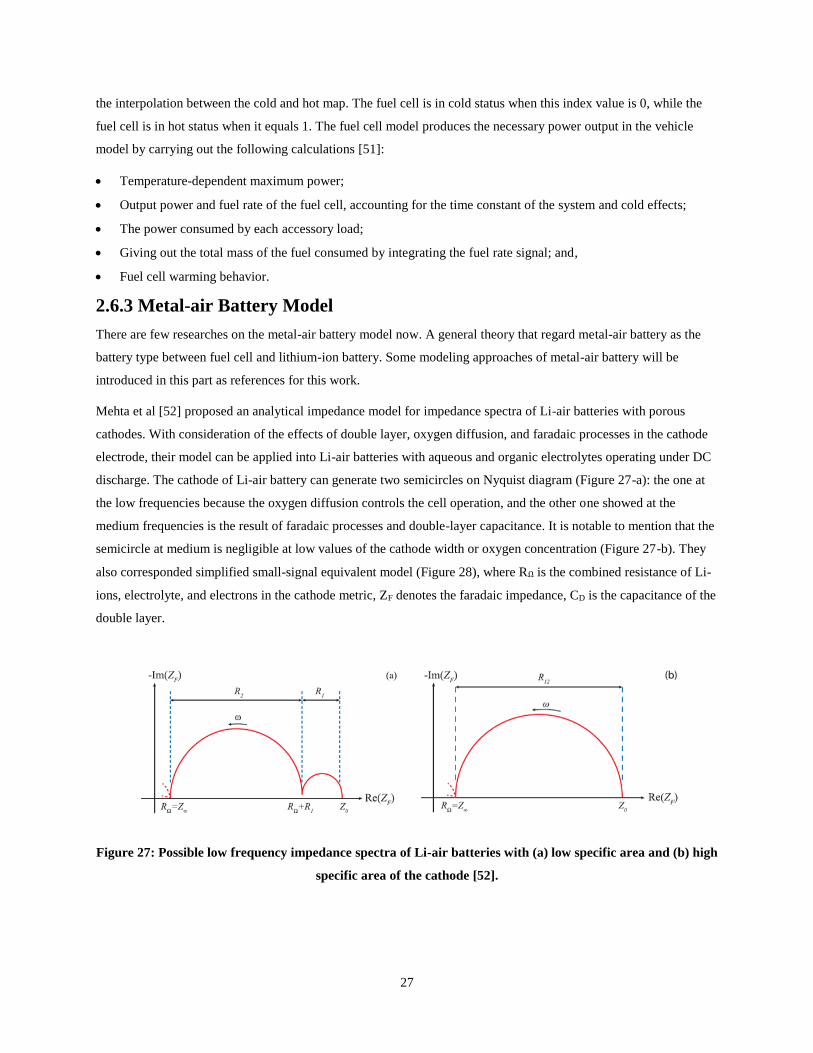
27
the interpolation between the cold and hot map. The fuel cell is in cold status when this index value is 0, while the
fuel cell is in hot status when it equals 1. The fuel cell model produces the necessary power output in the vehicle
model by carrying out the following calculations [51]:
Temperature-dependent maximum power;
Output power and fuel rate of the fuel cell, accounting for the time constant of the system and cold effects;
The power consumed by each accessory load;
Giving out the total mass of the fuel consumed by integrating the fuel rate signal; and,
Fuel cell warming behavior.
2.6.3 Metal-air Battery Model
There are few researches on the metal-air battery model now. A general theory that regard metal-air battery as the
battery type between fuel cell and lithium-ion battery. Some modeling approaches of metal-air battery will be
introduced in this part as references for this work.
Mehta et al [52] proposed an analytical impedance model for impedance spectra of Li-air batteries with porous
cathodes. With consideration of the effects of double layer, oxygen diffusion, and faradaic processes in the cathode
electrode, their model can be applied into Li-air batteries with aqueous and organic electrolytes operating under DC
discharge. The cathode of Li-air battery can generate two semicircles on Nyquist diagram (Figure 27-a): the one at
the low frequencies because the oxygen diffusion controls the cell operation, and the other one showed at the
medium frequencies is the result of faradaic processes and double-layer capacitance. It is notable to mention that the
semicircle at medium is negligible at low values of the cathode width or oxygen concentration (Figure 27-b). They
also corresponded simplified small-signal equivalent model (Figure 28), where RΩ is the combined resistance of Li-
ions, electrolyte, and electrons in the cathode metric, ZF denotes the faradaic impedance, CD is the capacitance of the
double layer.
Figure 27: Possible low frequency impedance spectra of Li-air batteries with (a) low specific area and (b) high
specific area of the cathode [52].
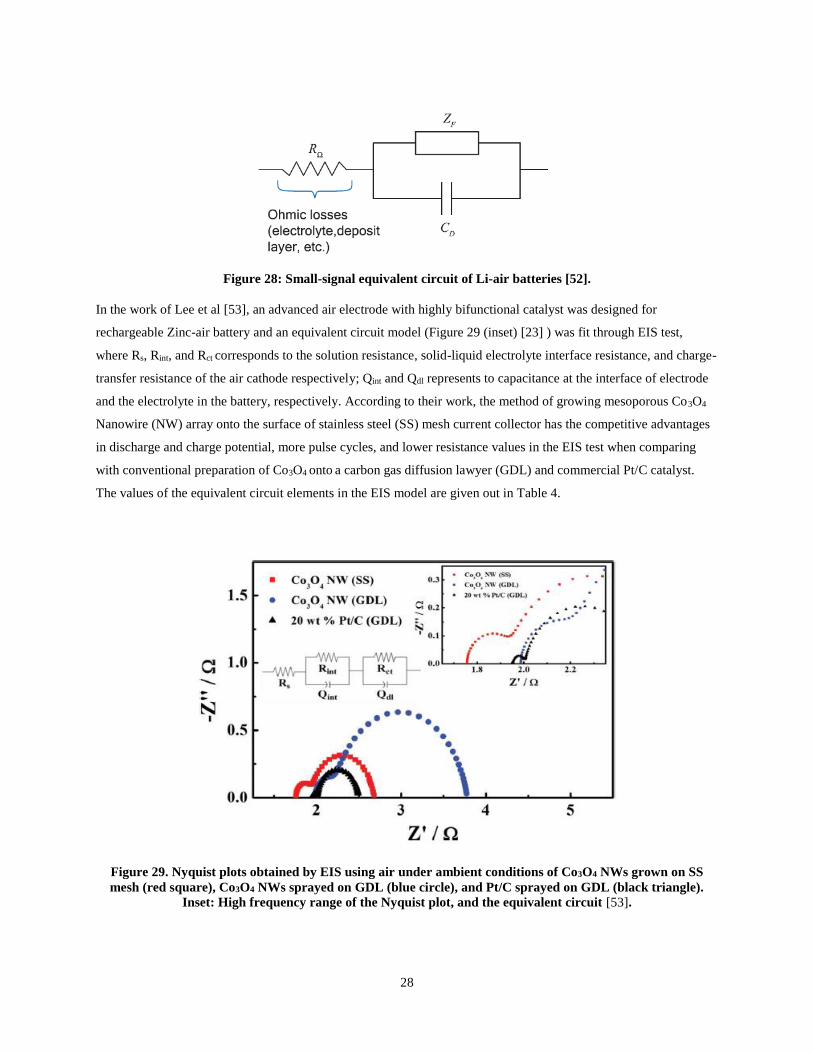
28
Figure 28: Small-signal equivalent circuit of Li-air batteries [52].
In the work of Lee et al [53], an advanced air electrode with highly bifunctional catalyst was designed for
rechargeable Zinc-air battery and an equivalent circuit model (Figure 29 (inset) [23] ) was fit through EIS test,
where Rs, Rint, and Rct corresponds to the solution resistance, solid-liquid electrolyte interface resistance, and charge-
transfer resistance of the air cathode respectively; Qint and Qdl represents to capacitance at the interface of electrode
and the electrolyte in the battery, respectively. According to their work, the method of growing mesoporous Co3O4
Nanowire (NW) array onto the surface of stainless steel (SS) mesh current collector has the competitive advantages
in discharge and charge potential, more pulse cycles, and lower resistance values in the EIS test when comparing
with conventional preparation of Co3O4 onto a carbon gas diffusion lawyer (GDL) and commercial Pt/C catalyst.
The values of the equivalent circuit elements in the EIS model are given out in Table 4.
Figure 29. Nyquist plots obtained by EIS using air under ambient conditions of Co3O4 NWs grown on SS
mesh (red square), Co3O4 NWs sprayed on GDL (blue circle), and Pt/C sprayed on GDL (black triangle).
Inset: High frequency range of the Nyquist plot, and the equivalent circuit [53].
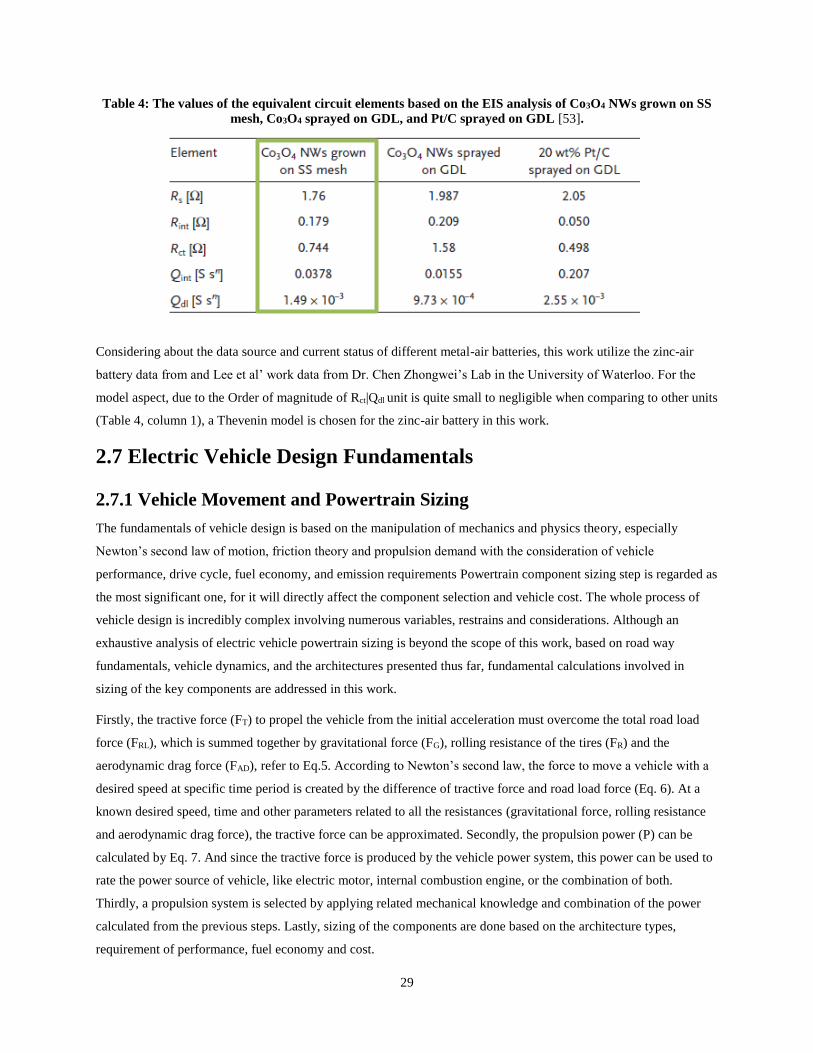
29
Table 4: The values of the equivalent circuit elements based on the EIS analysis of Co3O4 NWs grown on SS
mesh, Co3O4 sprayed on GDL, and Pt/C sprayed on GDL [53].
Considering about the data source and current status of different metal-air batteries, this work utilize the zinc-air
battery data from and Lee et al’ work data from Dr. Chen Zhongwei’s Lab in the University of Waterloo. For the
model aspect, due to the Order of magnitude of Rct|Qdl unit is quite small to negligible when comparing to other units
(Table 4, column 1), a Thevenin model is chosen for the zinc-air battery in this work.
2.7 Electric Vehicle Design Fundamentals
2.7.1 Vehicle Movement and Powertrain Sizing
The fundamentals of vehicle design is based on the manipulation of mechanics and physics theory, especially
Newton’s second law of motion, friction theory and propulsion demand with the consideration of vehicle
performance, drive cycle, fuel economy, and emission requirements Powertrain component sizing step is regarded as
the most significant one, for it will directly affect the component selection and vehicle cost. The whole process of
vehicle design is incredibly complex involving numerous variables, restrains and considerations. Although an
exhaustive analysis of electric vehicle powertrain sizing is beyond the scope of this work, based on road way
fundamentals, vehicle dynamics, and the architectures presented thus far, fundamental calculations involved in
sizing of the key components are addressed in this work.
Firstly, the tractive force (FT) to propel the vehicle from the initial acceleration must overcome the total road load
force (FRL), which is summed together by gravitational force (FG), rolling resistance of the tires (FR) and the
aerodynamic drag force (FAD), refer to Eq.5. According to Newton’s second law, the force to move a vehicle with a
desired speed at specific time period is created by the difference of tractive force and road load force (Eq. 6). At a
known desired speed, time and other parameters related to all the resistances (gravitational force, rolling resistance
and aerodynamic drag force), the tractive force can be approximated. Secondly, the propulsion power (P) can be
calculated by Eq. 7. And since the tractive force is produced by the vehicle power system, this power can be used to
rate the power source of vehicle, like electric motor, internal combustion engine, or the combination of both.
Thirdly, a propulsion system is selected by applying related mechanical knowledge and combination of the power
calculated from the previous steps. Lastly, sizing of the components are done based on the architecture types,
requirement of performance, fuel economy and cost.
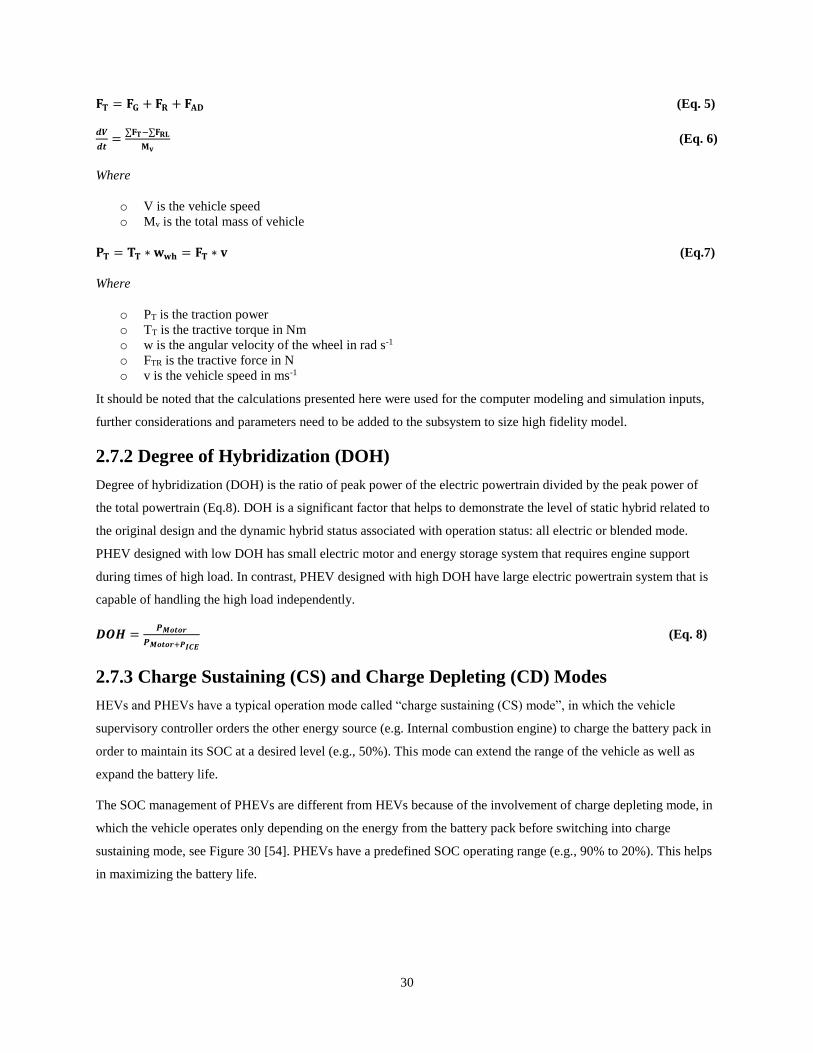
30
𝐅𝐓 = 𝐅𝐆 + 𝐅𝐑 + 𝐅𝐀𝐃 (Eq. 5)
𝒅𝑽
𝒅𝒕=
∑𝐅𝐓−∑𝐅𝐑𝐋
𝐌𝐯 (Eq. 6)
Where
o V is the vehicle speed
o Mv is the total mass of vehicle
𝐏𝐓 = 𝐓𝐓 ∗ 𝐰𝐰𝐡 = 𝐅𝐓 ∗ 𝐯 (Eq.7)
Where
o PT is the traction power
o TT is the tractive torque in Nm
o w is the angular velocity of the wheel in rad s-1
o FTR is the tractive force in N
o v is the vehicle speed in ms-1
It should be noted that the calculations presented here were used for the computer modeling and simulation inputs,
further considerations and parameters need to be added to the subsystem to size high fidelity model.
2.7.2 Degree of Hybridization (DOH)
Degree of hybridization (DOH) is the ratio of peak power of the electric powertrain divided by the peak power of
the total powertrain (Eq.8). DOH is a significant factor that helps to demonstrate the level of static hybrid related to
the original design and the dynamic hybrid status associated with operation status: all electric or blended mode.
PHEV designed with low DOH has small electric motor and energy storage system that requires engine support
during times of high load. In contrast, PHEV designed with high DOH have large electric powertrain system that is
capable of handling the high load independently.
𝑫𝑶𝑯 =𝑷𝑴𝒐𝒕𝒐𝒓
𝑷𝑴𝒐𝒕𝒐𝒓+𝑷𝑰𝑪𝑬
(Eq. 8)
2.7.3 Charge Sustaining (CS) and Charge Depleting (CD) Modes
HEVs and PHEVs have a typical operation mode called “charge sustaining (CS) mode”, in which the vehicle
supervisory controller orders the other energy source (e.g. Internal combustion engine) to charge the battery pack in
order to maintain its SOC at a desired level (e.g., 50%). This mode can extend the range of the vehicle as well as
expand the battery life.
The SOC management of PHEVs are different from HEVs because of the involvement of charge depleting mode, in
which the vehicle operates only depending on the energy from the battery pack before switching into charge
sustaining mode, see Figure 30 [54]. PHEVs have a predefined SOC operating range (e.g., 90% to 20%). This helps
in maximizing the battery life.

31
Figure 30: Plot of battery SOC management over CD and CS modes [54].
2.7.4 Vehicle Control Strategy
The control strategy of electric and hybrid electric vehicles is the process that collects drive command information
from acceleration and brake pedals and then decides how to deliver the power and torque commands to the vehicle
powertrain. Therefore the primary objective of the control strategy is to satisfy the driver’s command. The
secondary objective is to optimize the powertrain efficiency.
In battery electric vehicle, the strategy is quite straightforward and simple as there is only one power transmission
path. For a hybrid vehicle, the strategy is much more intricate as the powertrain is composed of multiple power
sources. Furthermore, the operation modes of different component orientation should also be considered as the
components can be arranged as different configurations: series, parallel, and power split. The control strategy
corresponds to the complexity of the architecture and can be divided into a two-level structure: mode selection and
modal control strategy. The former determines the mode of powertrain operation based on specific architecture,
while the latter satisfies the driver’s commands, optimizes the powertrain efficiency as well as minimizes the vehicle
emissions.
Essentially, the control strategy is a group of algorithms based on the steady-state characteristic of each component,
such as motor power/torque-speed map, battery discharge and charge map. Other deliberations include the state of
charge of the energy storage system, traffic conditions, GPS information may also be added into the more advanced
control strategy designs. The inputs of the control strategy is the driver’s commands while the outputs of the control
strategy is a series of commands sent to powertrain components to propel the vehicle in an efficient way, such as
torque and power request for internal combustion engine and electric motor, on/off commands for fuel cell and
engine.
Supervisory Controller
The whole vehicle control strategy can be divided into different levels. The top control level is the driver, who gives
out the speed and brake commands according to the road conditions and requirements. Components in the vehicle
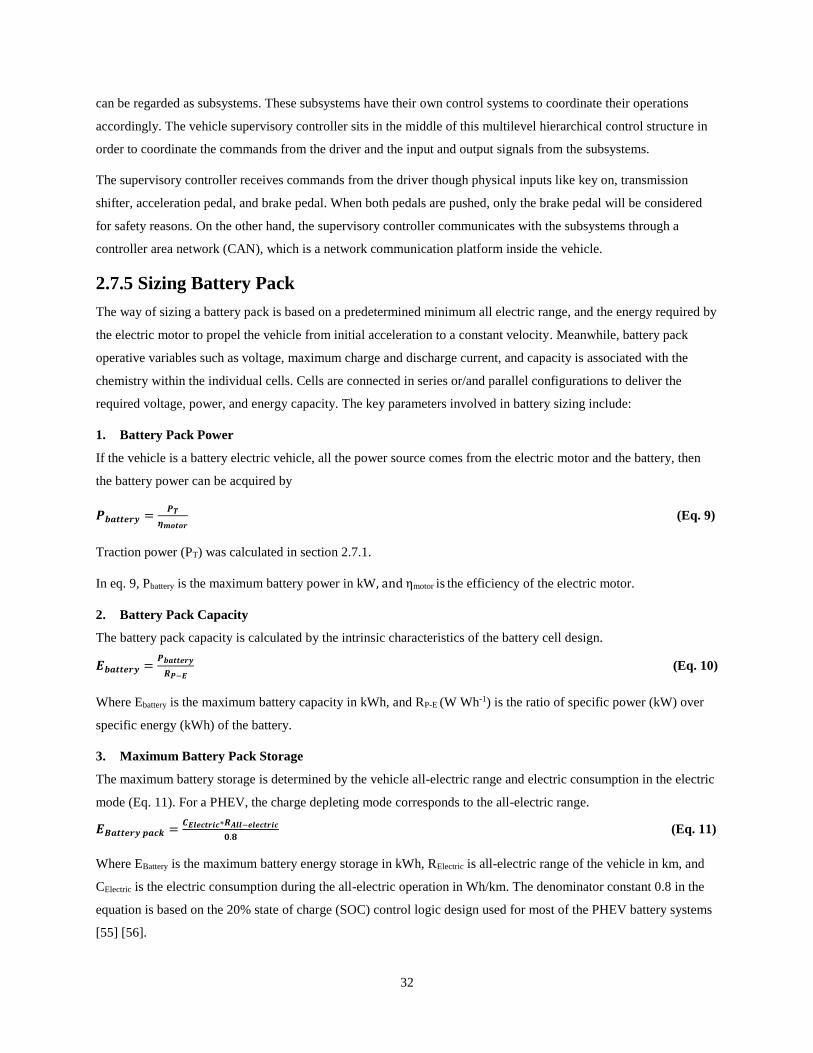
32
can be regarded as subsystems. These subsystems have their own control systems to coordinate their operations
accordingly. The vehicle supervisory controller sits in the middle of this multilevel hierarchical control structure in
order to coordinate the commands from the driver and the input and output signals from the subsystems.
The supervisory controller receives commands from the driver though physical inputs like key on, transmission
shifter, acceleration pedal, and brake pedal. When both pedals are pushed, only the brake pedal will be considered
for safety reasons. On the other hand, the supervisory controller communicates with the subsystems through a
controller area network (CAN), which is a network communication platform inside the vehicle.
2.7.5 Sizing Battery Pack
The way of sizing a battery pack is based on a predetermined minimum all electric range, and the energy required by
the electric motor to propel the vehicle from initial acceleration to a constant velocity. Meanwhile, battery pack
operative variables such as voltage, maximum charge and discharge current, and capacity is associated with the
chemistry within the individual cells. Cells are connected in series or/and parallel configurations to deliver the
required voltage, power, and energy capacity. The key parameters involved in battery sizing include:
1. Battery Pack Power
If the vehicle is a battery electric vehicle, all the power source comes from the electric motor and the battery, then
the battery power can be acquired by
𝑷𝒃𝒂𝒕𝒕𝒆𝒓𝒚 =𝑷𝑻
𝜼𝒎𝒐𝒕𝒐𝒓 (Eq. 9)
Traction power (PT) was calculated in section 2.7.1.
In eq. 9, Pbattery is the maximum battery power in kW, and ηmotor is the efficiency of the electric motor.
2. Battery Pack Capacity
The battery pack capacity is calculated by the intrinsic characteristics of the battery cell design.
𝑬𝒃𝒂𝒕𝒕𝒆𝒓𝒚 =𝑷𝒃𝒂𝒕𝒕𝒆𝒓𝒚
𝑹𝑷−𝑬 (Eq. 10)
Where Ebattery is the maximum battery capacity in kWh, and RP-E (W Wh-1) is the ratio of specific power (kW) over
specific energy (kWh) of the battery.
3. Maximum Battery Pack Storage
The maximum battery storage is determined by the vehicle all-electric range and electric consumption in the electric
mode (Eq. 11). For a PHEV, the charge depleting mode corresponds to the all-electric range.
𝑬𝑩𝒂𝒕𝒕𝒆𝒓𝒚 𝒑𝒂𝒄𝒌 =𝑪𝑬𝒍𝒆𝒄𝒕𝒓𝒊𝒄∗𝑹𝑨𝒍𝒍−𝒆𝒍𝒆𝒄𝒕𝒓𝒊𝒄
𝟎.𝟖 (Eq. 11)
Where EBattery is the maximum battery energy storage in kWh, RElectric is all-electric range of the vehicle in km, and
CElectric is the electric consumption during the all-electric operation in Wh/km. The denominator constant 0.8 in the
equation is based on the 20% state of charge (SOC) control logic design used for most of the PHEV battery systems
[55] [56].

33
4. Battery Cell Numbers
Battery cells must be placed in series and parallel in order to satisfy the voltage and energy needs. Specifically,
strings rank in series can increase the voltage and resistance while strings rank in parallel can increase the energy
capacity.
𝑵𝒔𝒆𝒓𝒊𝒆𝒔 =𝑽𝒑𝒂𝒄𝒌
𝑽𝒄𝒆𝒍𝒍 (Eq. 12)
𝑵𝒑𝒂𝒓𝒍𝒍𝒆𝒍 =𝑬𝒑𝒂𝒄𝒌
𝑬𝒄𝒆𝒍𝒍 (Eq. 13)
Where Vcell and Vpack are the voltages of battery cell and pack, respectively. Ecell and Epack are the energy capacity of
battery cell and pack, respectively. Nseries is the number of cells in series and Nparallel is the number of cells in parallel.
2.7.6 Battery Cost Model
While vehicle electrification yields lower emissions and increased energy efficiency, it brings additional concerns
such as higher cost, increased weight, and volume requirements of the powertrain [57]. The design of the battery
pack is a balance between these concerns with respect to vehicle architecture, consumer requirement, and cost. Hou
et.al developed the Total Cost of Ownership (TCO) model (Figure 34 [58] ) for PHEVs in Beijing, China. In their
work it is shown that the battery cost is linearly dependent on the battery size. Hou et al. built a model to break down
the battery cost into four sub-costs, namely: battery cost, fuel cost, electricity cost, and salvage cost. These four sub-
costs are determined by the sub-settings calculations: PHEV fuel economy, economic parameters, daily range
distribution and Utility Factor (UF) curve, and battery degradation. The fuel economy can be calculated through the
PHEV simulation model where the fuel and electricity consumption is determined in both charge depleting (CD) and
charge sustaining (CS) modes. The fuel cost is directly influenced by economic parameters comprising of fuel price,
electricity price, and charging service cost. The electric cost can approximated from daily driving range database
and the slope of the UF factor curve. The battery degradation part relies on the battery degradation test and
degradation model.
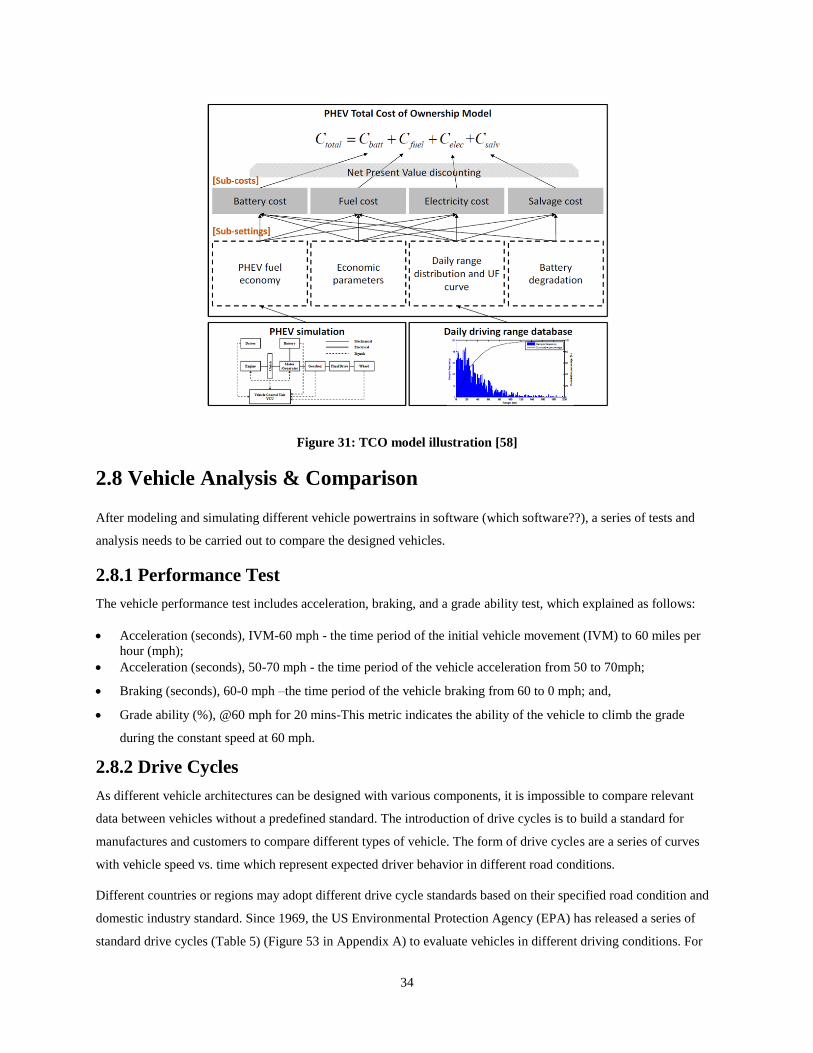
34
Figure 31: TCO model illustration [58]
2.8 Vehicle Analysis & Comparison
After modeling and simulating different vehicle powertrains in software (which software??), a series of tests and
analysis needs to be carried out to compare the designed vehicles.
2.8.1 Performance Test
The vehicle performance test includes acceleration, braking, and a grade ability test, which explained as follows:
Acceleration (seconds), IVM-60 mph - the time period of the initial vehicle movement (IVM) to 60 miles per
hour (mph);
Acceleration (seconds), 50-70 mph - the time period of the vehicle acceleration from 50 to 70mph;
Braking (seconds), 60-0 mph –the time period of the vehicle braking from 60 to 0 mph; and,
Grade ability (%), @60 mph for 20 mins-This metric indicates the ability of the vehicle to climb the grade
during the constant speed at 60 mph.
2.8.2 Drive Cycles
As different vehicle architectures can be designed with various components, it is impossible to compare relevant
data between vehicles without a predefined standard. The introduction of drive cycles is to build a standard for
manufactures and customers to compare different types of vehicle. The form of drive cycles are a series of curves
with vehicle speed vs. time which represent expected driver behavior in different road conditions.
Different countries or regions may adopt different drive cycle standards based on their specified road condition and
domestic industry standard. Since 1969, the US Environmental Protection Agency (EPA) has released a series of
standard drive cycles (Table 5) (Figure 53 in Appendix A) to evaluate vehicles in different driving conditions. For
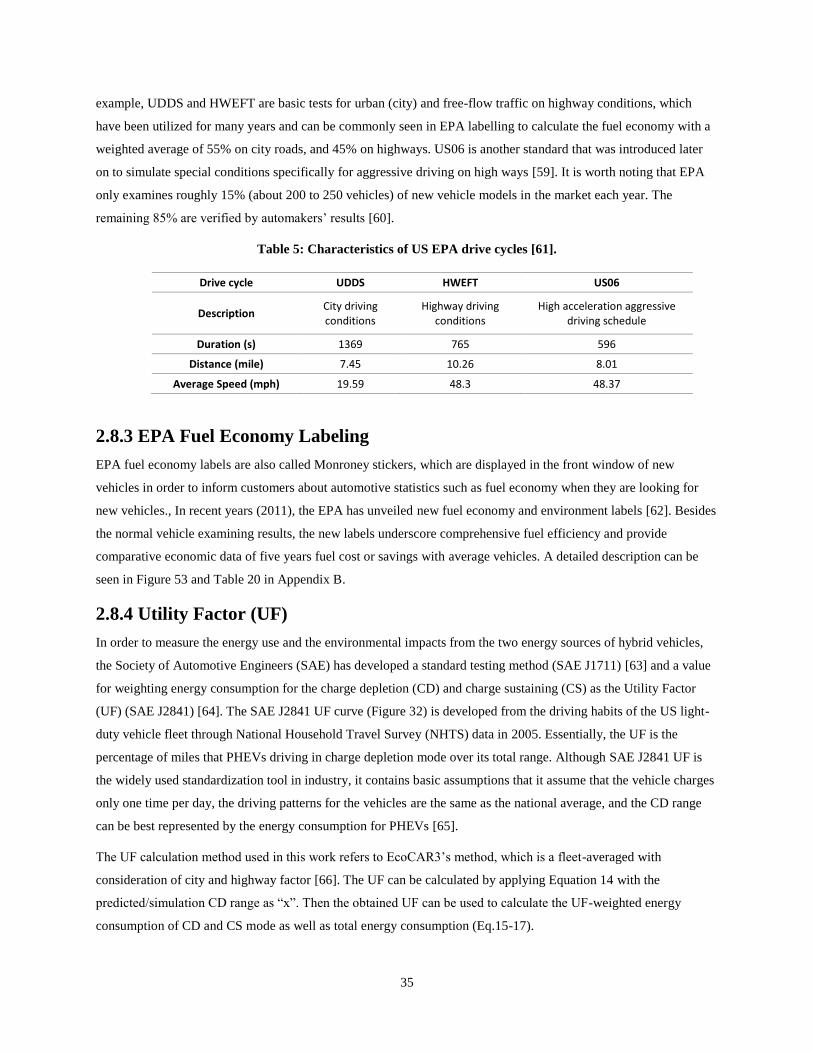
35
example, UDDS and HWEFT are basic tests for urban (city) and free-flow traffic on highway conditions, which
have been utilized for many years and can be commonly seen in EPA labelling to calculate the fuel economy with a
weighted average of 55% on city roads, and 45% on highways. US06 is another standard that was introduced later
on to simulate special conditions specifically for aggressive driving on high ways [59]. It is worth noting that EPA
only examines roughly 15% (about 200 to 250 vehicles) of new vehicle models in the market each year. The
remaining 85% are verified by automakers’ results [60].
Table 5: Characteristics of US EPA drive cycles [61].
Drive cycle UDDS HWEFT US06
Description City driving conditions
Highway driving conditions
High acceleration aggressive driving schedule
Duration (s) 1369 765 596
Distance (mile) 7.45 10.26 8.01
Average Speed (mph) 19.59 48.3 48.37
2.8.3 EPA Fuel Economy Labeling
EPA fuel economy labels are also called Monroney stickers, which are displayed in the front window of new
vehicles in order to inform customers about automotive statistics such as fuel economy when they are looking for
new vehicles., In recent years (2011), the EPA has unveiled new fuel economy and environment labels [62]. Besides
the normal vehicle examining results, the new labels underscore comprehensive fuel efficiency and provide
comparative economic data of five years fuel cost or savings with average vehicles. A detailed description can be
seen in Figure 53 and Table 20 in Appendix B.
2.8.4 Utility Factor (UF)
In order to measure the energy use and the environmental impacts from the two energy sources of hybrid vehicles,
the Society of Automotive Engineers (SAE) has developed a standard testing method (SAE J1711) [63] and a value
for weighting energy consumption for the charge depletion (CD) and charge sustaining (CS) as the Utility Factor
(UF) (SAE J2841) [64]. The SAE J2841 UF curve (Figure 32) is developed from the driving habits of the US light-
duty vehicle fleet through National Household Travel Survey (NHTS) data in 2005. Essentially, the UF is the
percentage of miles that PHEVs driving in charge depletion mode over its total range. Although SAE J2841 UF is
the widely used standardization tool in industry, it contains basic assumptions that it assume that the vehicle charges
only one time per day, the driving patterns for the vehicles are the same as the national average, and the CD range
can be best represented by the energy consumption for PHEVs [65].
The UF calculation method used in this work refers to EcoCAR3’s method, which is a fleet-averaged with
consideration of city and highway factor [66]. The UF can be calculated by applying Equation 14 with the
predicted/simulation CD range as “x”. Then the obtained UF can be used to calculate the UF-weighted energy
consumption of CD and CS mode as well as total energy consumption (Eq.15-17).
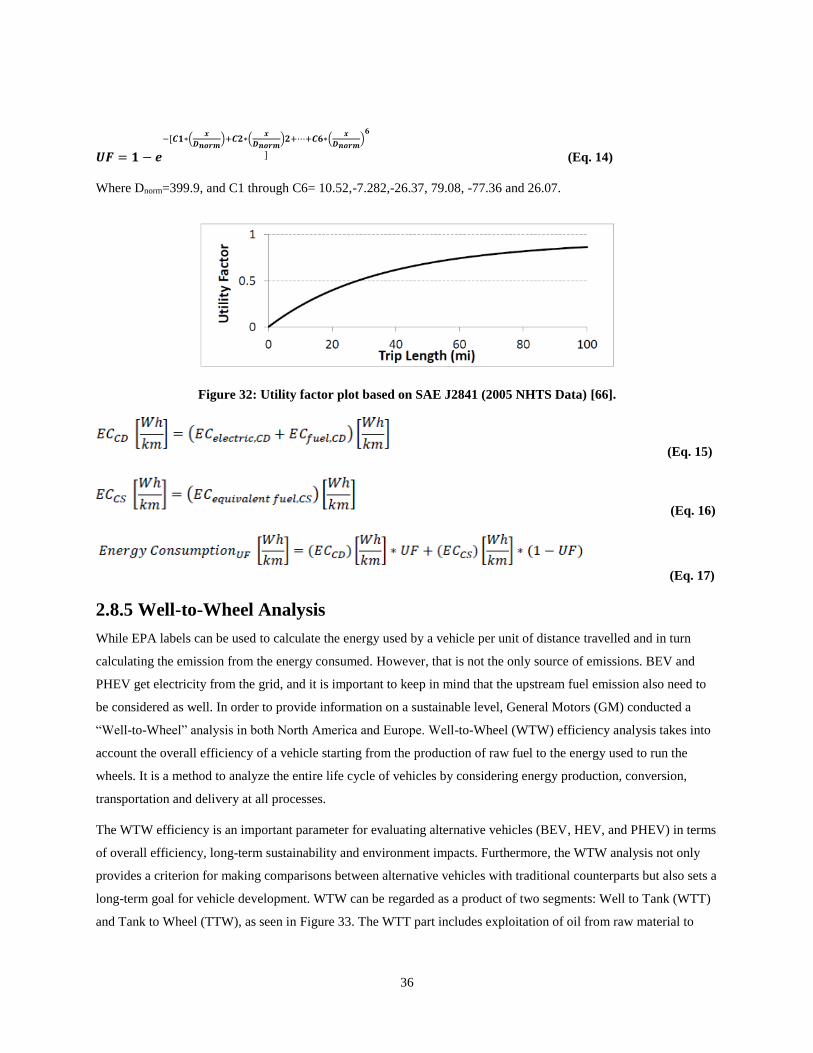
36
𝑼𝑭 = 𝟏 − 𝒆
−[𝑪𝟏∗(𝒙
𝑫𝒏𝒐𝒓𝒎)+𝑪𝟐∗(
𝒙
𝑫𝒏𝒐𝒓𝒎)𝟐+⋯+𝑪𝟔∗(
𝒙
𝑫𝒏𝒐𝒓𝒎)
𝟔
] (Eq. 14)
Where Dnorm=399.9, and C1 through C6= 10.52,-7.282,-26.37, 79.08, -77.36 and 26.07.
Figure 32: Utility factor plot based on SAE J2841 (2005 NHTS Data) [66].
(Eq. 15)
(Eq. 16)
(Eq. 17)
2.8.5 Well-to-Wheel Analysis
While EPA labels can be used to calculate the energy used by a vehicle per unit of distance travelled and in turn
calculating the emission from the energy consumed. However, that is not the only source of emissions. BEV and
PHEV get electricity from the grid, and it is important to keep in mind that the upstream fuel emission also need to
be considered as well. In order to provide information on a sustainable level, General Motors (GM) conducted a
“Well-to-Wheel” analysis in both North America and Europe. Well-to-Wheel (WTW) efficiency analysis takes into
account the overall efficiency of a vehicle starting from the production of raw fuel to the energy used to run the
wheels. It is a method to analyze the entire life cycle of vehicles by considering energy production, conversion,
transportation and delivery at all processes.
The WTW efficiency is an important parameter for evaluating alternative vehicles (BEV, HEV, and PHEV) in terms
of overall efficiency, long-term sustainability and environment impacts. Furthermore, the WTW analysis not only
provides a criterion for making comparisons between alternative vehicles with traditional counterparts but also sets a
long-term goal for vehicle development. WTW can be regarded as a product of two segments: Well to Tank (WTT)
and Tank to Wheel (TTW), as seen in Figure 33. The WTT part includes exploitation of oil from raw material to
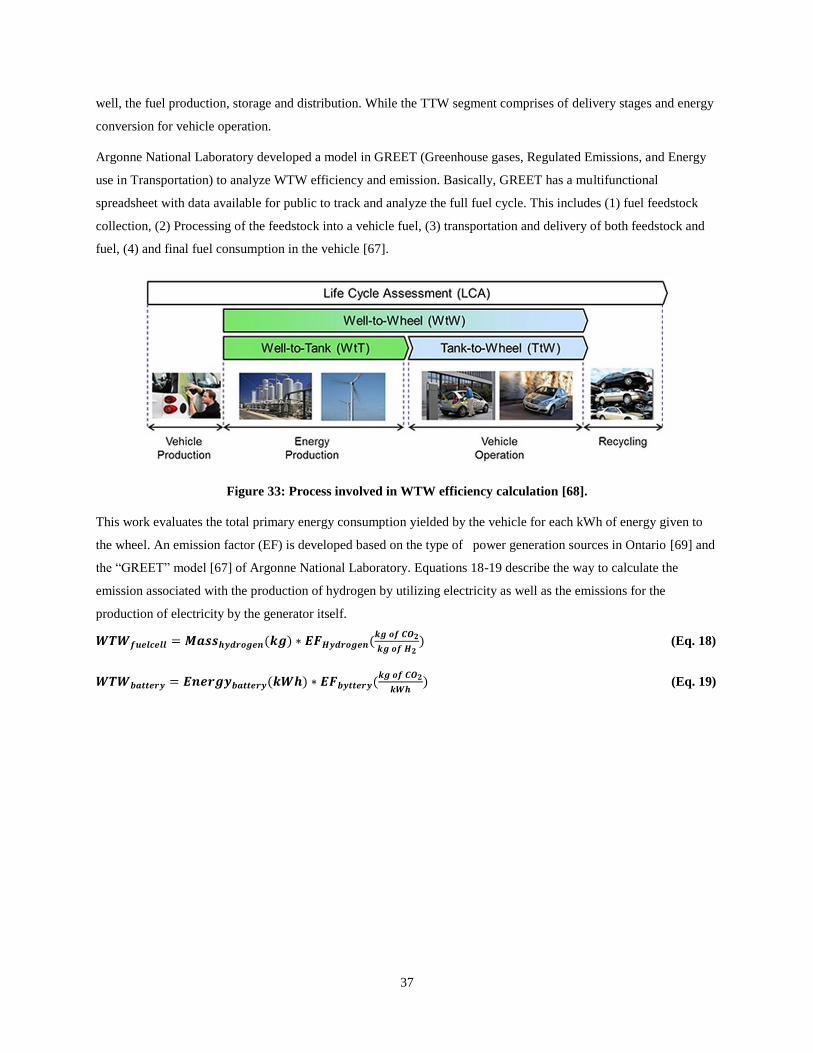
37
well, the fuel production, storage and distribution. While the TTW segment comprises of delivery stages and energy
conversion for vehicle operation.
Argonne National Laboratory developed a model in GREET (Greenhouse gases, Regulated Emissions, and Energy
use in Transportation) to analyze WTW efficiency and emission. Basically, GREET has a multifunctional
spreadsheet with data available for public to track and analyze the full fuel cycle. This includes (1) fuel feedstock
collection, (2) Processing of the feedstock into a vehicle fuel, (3) transportation and delivery of both feedstock and
fuel, (4) and final fuel consumption in the vehicle [67].
Figure 33: Process involved in WTW efficiency calculation [68].
This work evaluates the total primary energy consumption yielded by the vehicle for each kWh of energy given to
the wheel. An emission factor (EF) is developed based on the type of power generation sources in Ontario [69] and
the “GREET” model [67] of Argonne National Laboratory. Equations 18-19 describe the way to calculate the
emission associated with the production of hydrogen by utilizing electricity as well as the emissions for the
production of electricity by the generator itself.
𝑾𝑻𝑾𝒇𝒖𝒆𝒍𝒄𝒆𝒍𝒍 = 𝑴𝒂𝒔𝒔𝒉𝒚𝒅𝒓𝒐𝒈𝒆𝒏(𝒌𝒈) ∗ 𝑬𝑭𝑯𝒚𝒅𝒓𝒐𝒈𝒆𝒏(𝒌𝒈 𝒐𝒇 𝑪𝑶𝟐
𝒌𝒈 𝒐𝒇 𝑯𝟐) (Eq. 18)
𝑾𝑻𝑾𝒃𝒂𝒕𝒕𝒆𝒓𝒚 = 𝑬𝒏𝒆𝒓𝒈𝒚𝒃𝒂𝒕𝒕𝒆𝒓𝒚(𝒌𝑾𝒉) ∗ 𝑬𝑭𝒃𝒚𝒕𝒕𝒆𝒓𝒚(𝒌𝒈 𝒐𝒇 𝑪𝑶𝟐
𝒌𝑾𝒉) (Eq. 19)
38
3. Vehicle Design Consideration
3.1 Project-based Learning and Research
Engineering is a complex profession involving various knowledge and skills. Employers are pursuing more and
more competence from engineering graduates, not limited to professional skill. There is more emphasis on
innovation, problem solving, and teamwork. Project-based learning and research is an effective tool for students to
develop these skills. Researchers have also found that projects have the potential to motivate students to learn and
keep skills up-to-date to match the industry needs [70].
3.1.1 University of Waterloo Alternative Fuels Team
University of Waterloo Alternative Fuels Team (UWAFT) is a student-led team, which is comprised of both
undergraduate and graduate students from University of Waterloo and Wilfrid Laurier University. UWAFT's
mandate is to research, design, and implement advanced vehicle technologies into production vehicles to reduce fuel
consumption, well-to-wheel greenhouse gas emissions, and criteria tailpipe emissions-while maintaining safety,
performance, and consumer acceptability. Since its establishment in 1996, UWAFT has been a leader in U.S.
Department of Energy Advanced Vehicle Technology Competitions (AVTCs), and has participated in several other
competitions which include:
1996-1997: Propane Vehicle Challenge;
1996-1999: FutureCar;
1997-1999: Ethanol Vehicle Challenge;
1999-2004: FutureTruck;
2004-2008: ChallengeX: Crossover to Sustainable Mobilty;
2008-2011: EcoCAR: The NeXt Challenge; and
2011-2014: EcoCAR 2: Plugging In to the Future.
Since September 2014, UWAFT has become a member of EcoCAR3 competition. EcoCAR3 is the latest advanced
vehicle technology competition among university students held by the U.S. Department of Energy (DOE) and
General Motors (GM).
3.1.2 EcoCAR3 Advanced Vehicle Technology Competition
The EcoCAR3 competition that involves 16 North American universities trying to reengineer a conventional 2016
Chevrolet Camaro into an electric vehicle to reduce its environmental impact without compromising on its
performance. Sponsored by DOE and GM, EcoCAR3 builds an innovative platform for students to learn the cutting-
edge technologies out there in the market and incorporating their unique ideas and train next generation engineers in
automotive industry. From 2014 to 2018, teams are required to design, integrate, develop, optimize, test the vehicle
powertrain, and ultimately present their unique vehicles with competitive performance, energy-efficient, and cost.
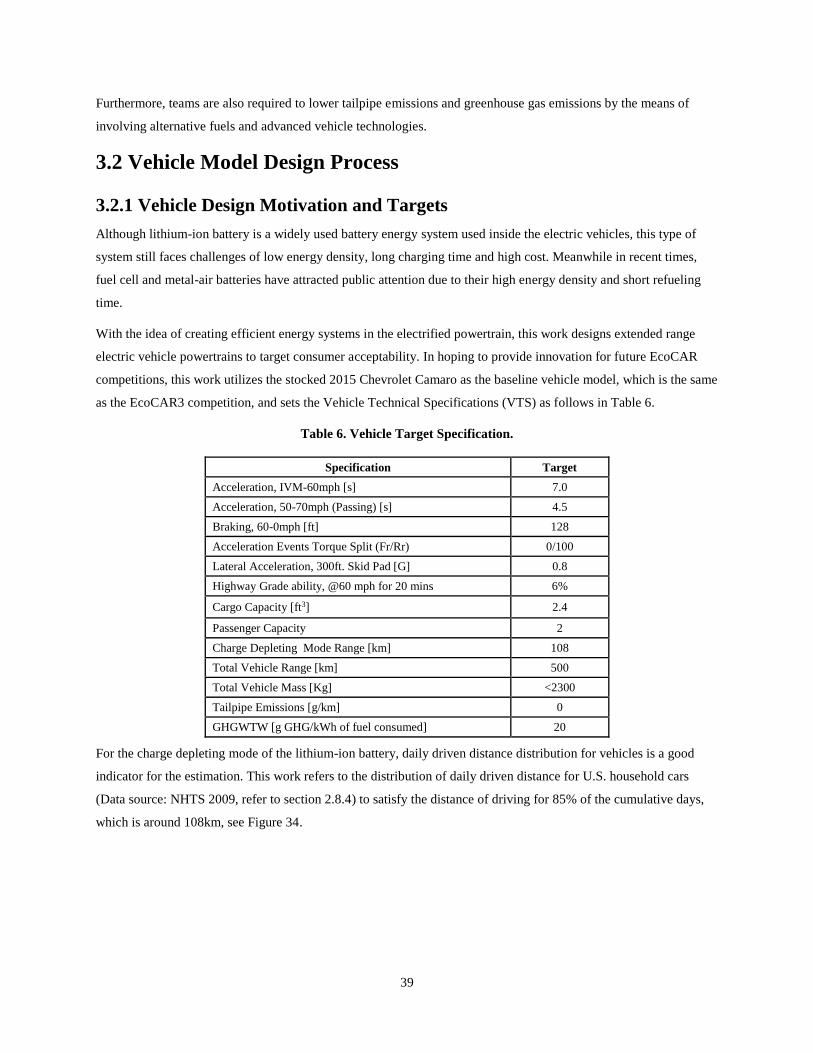
39
Furthermore, teams are also required to lower tailpipe emissions and greenhouse gas emissions by the means of
involving alternative fuels and advanced vehicle technologies.
3.2 Vehicle Model Design Process
3.2.1 Vehicle Design Motivation and Targets
Although lithium-ion battery is a widely used battery energy system used inside the electric vehicles, this type of
system still faces challenges of low energy density, long charging time and high cost. Meanwhile in recent times,
fuel cell and metal-air batteries have attracted public attention due to their high energy density and short refueling
time.
With the idea of creating efficient energy systems in the electrified powertrain, this work designs extended range
electric vehicle powertrains to target consumer acceptability. In hoping to provide innovation for future EcoCAR
competitions, this work utilizes the stocked 2015 Chevrolet Camaro as the baseline vehicle model, which is the same
as the EcoCAR3 competition, and sets the Vehicle Technical Specifications (VTS) as follows in Table 6.
Table 6. Vehicle Target Specification.
Specification Target
Acceleration, IVM-60mph [s] 7.0
Acceleration, 50-70mph (Passing) [s] 4.5
Braking, 60-0mph [ft] 128
Acceleration Events Torque Split (Fr/Rr) 0/100
Lateral Acceleration, 300ft. Skid Pad [G] 0.8
Highway Grade ability, @60 mph for 20 mins 6%
Cargo Capacity [ft3] 2.4
Passenger Capacity 2
Charge Depleting Mode Range [km] 108
Total Vehicle Range [km] 500
Total Vehicle Mass [Kg] <2300
Tailpipe Emissions [g/km] 0
GHGWTW [g GHG/kWh of fuel consumed] 20
For the charge depleting mode of the lithium-ion battery, daily driven distance distribution for vehicles is a good
indicator for the estimation. This work refers to the distribution of daily driven distance for U.S. household cars
(Data source: NHTS 2009, refer to section 2.8.4) to satisfy the distance of driving for 85% of the cumulative days,
which is around 108km, see Figure 34.
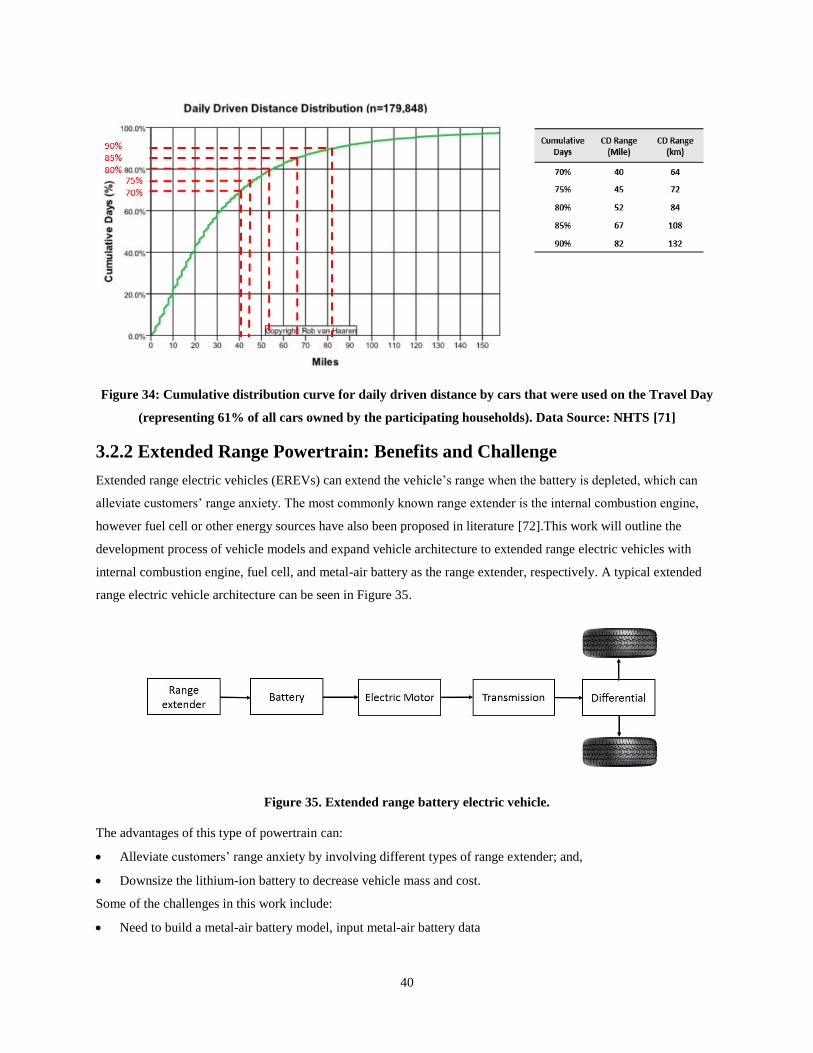
40
Figure 34: Cumulative distribution curve for daily driven distance by cars that were used on the Travel Day
(representing 61% of all cars owned by the participating households). Data Source: NHTS [71]
3.2.2 Extended Range Powertrain: Benefits and Challenge
Extended range electric vehicles (EREVs) can extend the vehicle’s range when the battery is depleted, which can
alleviate customers’ range anxiety. The most commonly known range extender is the internal combustion engine,
however fuel cell or other energy sources have also been proposed in literature [72].This work will outline the
development process of vehicle models and expand vehicle architecture to extended range electric vehicles with
internal combustion engine, fuel cell, and metal-air battery as the range extender, respectively. A typical extended
range electric vehicle architecture can be seen in Figure 35.
Figure 35. Extended range battery electric vehicle.
The advantages of this type of powertrain can:
Alleviate customers’ range anxiety by involving different types of range extender; and,
Downsize the lithium-ion battery to decrease vehicle mass and cost.
Some of the challenges in this work include:
Need to build a metal-air battery model, input metal-air battery data
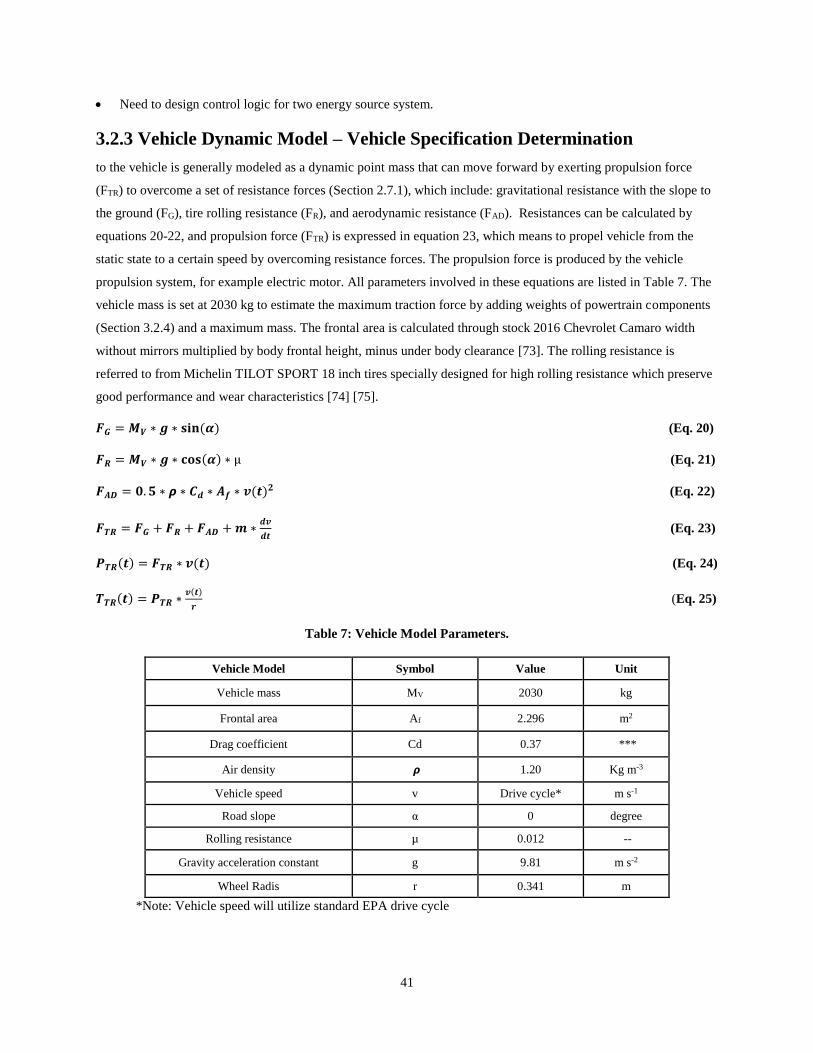
41
Need to design control logic for two energy source system.
3.2.3 Vehicle Dynamic Model – Vehicle Specification Determination
to the vehicle is generally modeled as a dynamic point mass that can move forward by exerting propulsion force
(FTR) to overcome a set of resistance forces (Section 2.7.1), which include: gravitational resistance with the slope to
the ground (FG), tire rolling resistance (FR), and aerodynamic resistance (FAD). Resistances can be calculated by
equations 20-22, and propulsion force (FTR) is expressed in equation 23, which means to propel vehicle from the
static state to a certain speed by overcoming resistance forces. The propulsion force is produced by the vehicle
propulsion system, for example electric motor. All parameters involved in these equations are listed in Table 7. The
vehicle mass is set at 2030 kg to estimate the maximum traction force by adding weights of powertrain components
(Section 3.2.4) and a maximum mass. The frontal area is calculated through stock 2016 Chevrolet Camaro width
without mirrors multiplied by body frontal height, minus under body clearance [73]. The rolling resistance is
referred to from Michelin TILOT SPORT 18 inch tires specially designed for high rolling resistance which preserve
good performance and wear characteristics [74] [75].
𝑭𝑮 = 𝑴𝑽 ∗ 𝒈 ∗ 𝐬𝐢𝐧 (𝜶) (Eq. 20)
𝑭𝑹 = 𝑴𝑽 ∗ 𝒈 ∗ 𝐜𝐨𝐬(𝜶) ∗ µ (Eq. 21)
𝑭𝑨𝑫 = 𝟎. 𝟓 ∗ 𝞺 ∗ 𝑪𝒅 ∗ 𝑨𝒇 ∗ 𝒗(𝒕)𝟐 (Eq. 22)
𝑭𝑻𝑹 = 𝑭𝑮 + 𝑭𝑹 + 𝑭𝑨𝑫 + 𝒎 ∗𝒅𝒗
𝒅𝒕 (Eq. 23)
𝑷𝑻𝑹(𝒕) = 𝑭𝑻𝑹 ∗ 𝒗(𝒕) (Eq. 24)
𝑻𝑻𝑹(𝒕) = 𝑷𝑻𝑹 ∗𝒗(𝒕)
𝒓 (Eq. 25)
Table 7: Vehicle Model Parameters.
Vehicle Model Symbol Value Unit
Vehicle mass MV 2030 kg
Frontal area Af 2.296 m2
Drag coefficient Cd 0.37 ***
Air density 𝞺 1.20 Kg m-3
Vehicle speed v Drive cycle* m s-1
Road slope α 0 degree
Rolling resistance µ 0.012 --
Gravity acceleration constant g 9.81 m s-2
Wheel Radis r 0.341 m
*Note: Vehicle speed will utilize standard EPA drive cycle
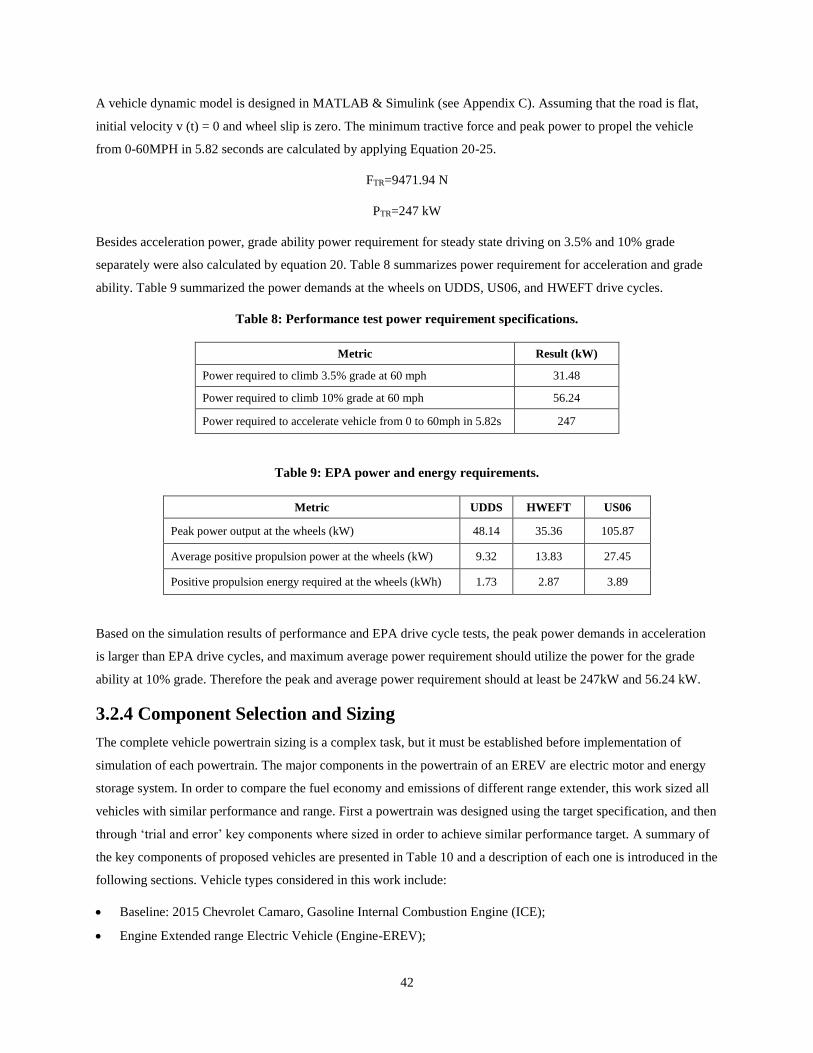
42
A vehicle dynamic model is designed in MATLAB & Simulink (see Appendix C). Assuming that the road is flat,
initial velocity v (t) = 0 and wheel slip is zero. The minimum tractive force and peak power to propel the vehicle
from 0-60MPH in 5.82 seconds are calculated by applying Equation 20-25.
FTR=9471.94 N
PTR=247 kW
Besides acceleration power, grade ability power requirement for steady state driving on 3.5% and 10% grade
separately were also calculated by equation 20. Table 8 summarizes power requirement for acceleration and grade
ability. Table 9 summarized the power demands at the wheels on UDDS, US06, and HWEFT drive cycles.
Table 8: Performance test power requirement specifications.
Metric Result (kW)
Power required to climb 3.5% grade at 60 mph 31.48
Power required to climb 10% grade at 60 mph 56.24
Power required to accelerate vehicle from 0 to 60mph in 5.82s 247
Table 9: EPA power and energy requirements.
Metric UDDS HWEFT US06
Peak power output at the wheels (kW) 48.14 35.36 105.87
Average positive propulsion power at the wheels (kW) 9.32 13.83 27.45
Positive propulsion energy required at the wheels (kWh) 1.73 2.87 3.89
Based on the simulation results of performance and EPA drive cycle tests, the peak power demands in acceleration
is larger than EPA drive cycles, and maximum average power requirement should utilize the power for the grade
ability at 10% grade. Therefore the peak and average power requirement should at least be 247kW and 56.24 kW.
3.2.4 Component Selection and Sizing
The complete vehicle powertrain sizing is a complex task, but it must be established before implementation of
simulation of each powertrain. The major components in the powertrain of an EREV are electric motor and energy
storage system. In order to compare the fuel economy and emissions of different range extender, this work sized all
vehicles with similar performance and range. First a powertrain was designed using the target specification, and then
through ‘trial and error’ key components where sized in order to achieve similar performance target. A summary of
the key components of proposed vehicles are presented in Table 10 and a description of each one is introduced in the
following sections. Vehicle types considered in this work include:
Baseline: 2015 Chevrolet Camaro, Gasoline Internal Combustion Engine (ICE);
Engine Extended range Electric Vehicle (Engine-EREV);
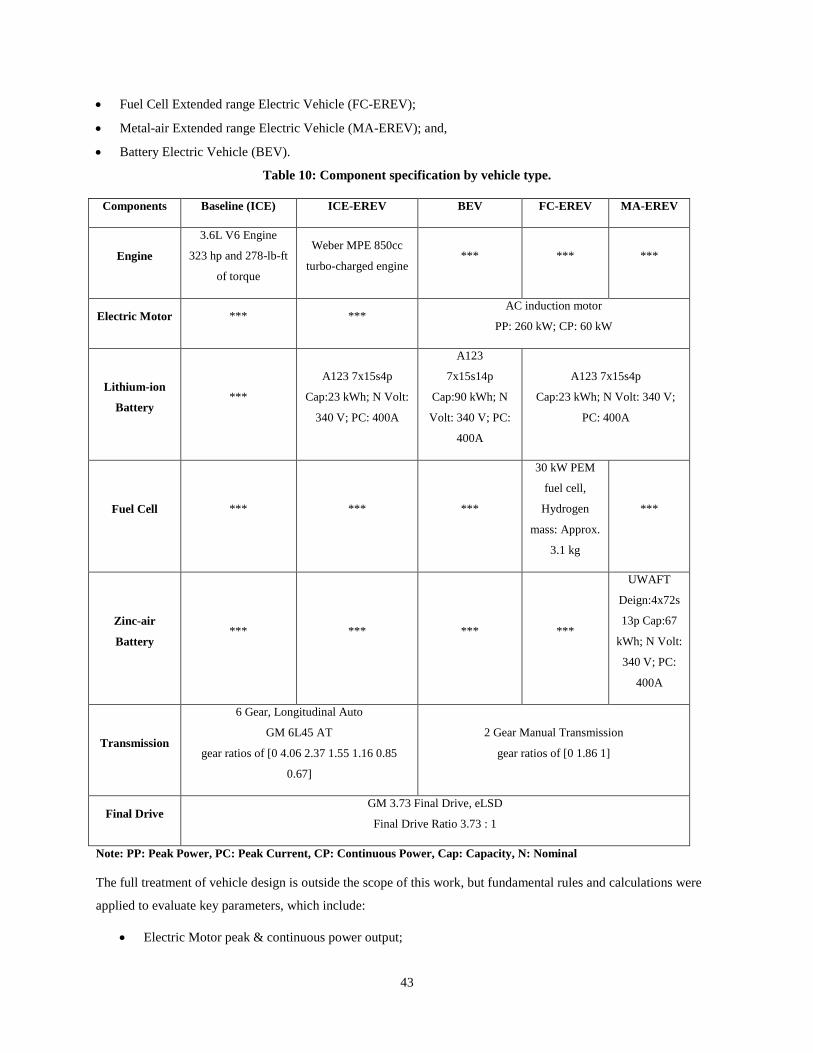
43
Fuel Cell Extended range Electric Vehicle (FC-EREV);
Metal-air Extended range Electric Vehicle (MA-EREV); and,
Battery Electric Vehicle (BEV).
Table 10: Component specification by vehicle type.
Components Baseline (ICE) ICE-EREV BEV FC-EREV MA-EREV
Engine
3.6L V6 Engine
323 hp and 278-lb-ft
of torque
Weber MPE 850cc
turbo-charged engine *** *** ***
Electric Motor *** *** AC induction motor
PP: 260 kW; CP: 60 kW
Lithium-ion
Battery ***
A123 7x15s4p
Cap:23 kWh; N Volt:
340 V; PC: 400A
A123
7x15s14p
Cap:90 kWh; N
Volt: 340 V; PC:
400A
A123 7x15s4p
Cap:23 kWh; N Volt: 340 V;
PC: 400A
Fuel Cell *** *** ***
30 kW PEM
fuel cell,
Hydrogen
mass: Approx.
3.1 kg
***
Zinc-air
Battery *** *** *** ***
UWAFT
Deign:4x72s
13p Cap:67
kWh; N Volt:
340 V; PC:
400A
Transmission
6 Gear, Longitudinal Auto
GM 6L45 AT
gear ratios of [0 4.06 2.37 1.55 1.16 0.85
0.67]
2 Gear Manual Transmission
gear ratios of [0 1.86 1]
Final Drive GM 3.73 Final Drive, eLSD
Final Drive Ratio 3.73 : 1
Note: PP: Peak Power, PC: Peak Current, CP: Continuous Power, Cap: Capacity, N: Nominal
The full treatment of vehicle design is outside the scope of this work, but fundamental rules and calculations were
applied to evaluate key parameters, which include:
Electric Motor peak & continuous power output;
44
Lithium-ion battery peak & continuous power output;
Lithium-ion battery energy;
Range extender (engine, fuel cell, or metal-air battery) peak & continuous power output;
Extended range (fuel cell or metal-air battery) energy;
Gear ratios; and,
Final drive ratio.
Engine
An 850cc turbo-charged Weber engine is chosen for its ability to be converted to use ethanol fuel. Ethanol (i.e. E85)
was selected as a fuel because it is a renewable fuel with a near to neutral CO2 life cycle. In this case this engine was
selected because it was a light weight high power engine. Also UWAFT had experience with this engine, and it is
commercially available.
Lithium-ion battery
The size of lithium-ion battery pack is directly affected by the vehicle’s all electric range and the voltage demand
from the electric motor. A123 340V 23 kWh lithium-ion battery pack is selected for meeting these requirements.
UWAFT and Dr. Fowler’s lab have worked with A123 battery for years and it is commercially available. This
warrants its use in this study.
Electric motor
Vehicle dynamic model in the section 3.2.3 provides the reference power requirement for electric motor (Peak
power: 247kW, continuous power: 56kW). The electric motor efficiency (assumed to be 95%) is also considered in
the designing process. Thus sizing the peak power of electric vehicle motor as 260 kW and nominal voltage is 340V.
YASA-400 electric motor is selected in this work due to the accessible supplier data and has been scaled to meet the
power demand.
Range extender
Three types of range extender are selected in this work: engine, fuel cell, and zinc-air battery. In order to compare
the range and energy efficiency of these three different range extenders, similar energy capacities of the three range
extenders is defined as a prerequisite for vehicle modeling. A 30 kW fuel cell stack is designed as a range extender
for FC-EREV, then by comparing weight and energy density of zin-air battery with fuel cell, a 340V67 kWh zinc-air
battery stack is sized in this work. The fuel cell model and Matlab file are coming from the default data in
Autonomie REV 14 from ANL.
Power converter
In order to transmit the power from the range extender to the lithium-ion battery and electric motor, a ‘power to
voltage’ converter is created in Autonomie Rev 4 with a 340V output voltage and 92% operating efficiency.
Gearbox and gear ratios
45
Since the electric motor can produce enough torque at low rotation speed, a simple gearbox is chosen to replace the
six speed gearbox in the EREV to save space and cost. Wager el al [76] demonstrated that using a manual
transmission in electric vehicle consumed less energy than an automatic transmission, thereby increasing the electric
vehicle range. So a simple manual gearbox (gear ratios: [0 1.86 1]) has been selected in this work.
Final drive ratio
Chosen to be similar to the final drive ratio for the 2015 Chevrolet Camaro 2LS, which is 3.73:1.
3.2.5 Vehicle Control Strategy
Since the motivation of this work is to design an extended range electric vehicle with a reasonable range and
efficiency, an innovative control strategy has been developed to compliment this design. An internal combustion
engine, a fuel cell, and a metal-air battery are chosen as the range-extenders, respectively. Three different powertrain
have been modeled in Autonomie. For the control strategy, lithium-ion battery pack is the major energy source to
power the electric vehicle, while the range extender gives out certain power output to propel the vehicle and charge
the lithium-ion battery. The range extender turns on when the SOC of the lithium-ion battery is below a given
threshold, and shuts down when the SOC is above a predefined threshold. The vehicle runs with lithium-ion battery
only when the range extender is off. The control logic is presented in Figure 36 and explained as follows.
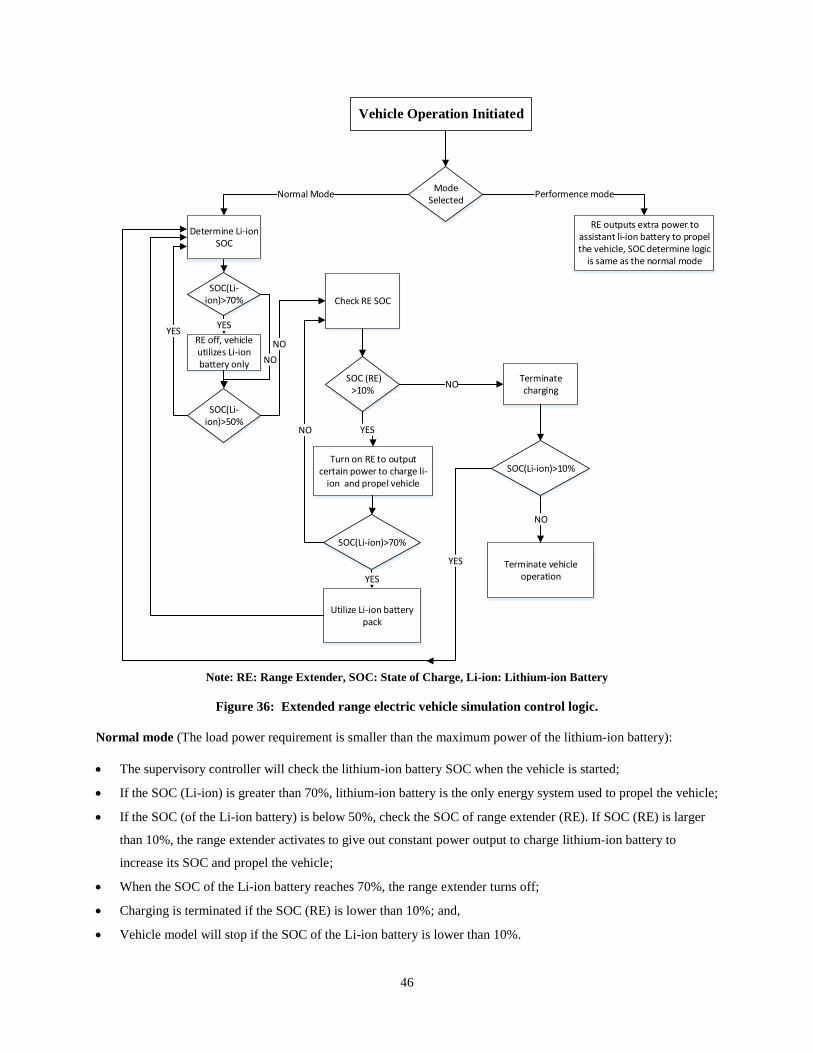
46
Vehicle Operation Initiated
SOC(Li-ion)>70%
YES
RE off, vehicle utilizes Li-ion battery only
SOC (RE) >10%
Turn on RE to output certain power to charge li-
ion and propel vehicle
SOC(Li-ion)>50%
Mode Selected
Check RE SOC
YES
Normal Mode
SOC(Li-ion)>70%
YES
Utilize Li-ion battery pack
NO
NO
NOTerminate charging
Terminate vehicle operation
NO
SOC(Li-ion)>10%
YES
RE outputs extra power to assistant li-ion battery to propel the vehicle, SOC determine logic
is same as the normal mode
Performence mode
Determine Li-ion SOC
YES
NO
Note: RE: Range Extender, SOC: State of Charge, Li-ion: Lithium-ion Battery
Figure 36: Extended range electric vehicle simulation control logic.
Normal mode (The load power requirement is smaller than the maximum power of the lithium-ion battery):
The supervisory controller will check the lithium-ion battery SOC when the vehicle is started;
If the SOC (Li-ion) is greater than 70%, lithium-ion battery is the only energy system used to propel the vehicle;
If the SOC (of the Li-ion battery) is below 50%, check the SOC of range extender (RE). If SOC (RE) is larger
than 10%, the range extender activates to give out constant power output to charge lithium-ion battery to
increase its SOC and propel the vehicle;
When the SOC of the Li-ion battery reaches 70%, the range extender turns off;
Charging is terminated if the SOC (RE) is lower than 10%; and,
Vehicle model will stop if the SOC of the Li-ion battery is lower than 10%.
47
Performance mode (The load power requirement is larger than the maximum power of the lithium-ion battery):
Lithium-ion battery is the main energy source to propel the vehicle;
Range extender will provide extra power to satisfy driver’s requirement within its maximum power output
capability; and,
The SOC thresholds of both lithium-ion battery and the range extender are the same as in the normal mode
operation.
The control logic built in Matlab & SIMULINK is presented in Appendix D, E and F with the metal-air battery
being used as the range extender. Appendix D is the parameter code for the Model. Appendix E is the top level of
the Stateflow in SIMULINK, which is composed of four blocks with the following functions:
ESS2_idling_Control: supervisory controller sends out the command to turn on/off the metal-air battery;
Timer_Min_IdlingTime_decel: a timer that is triggered by negative torque demand;
Timer_performance: evaluates whether the driver is asking for a performance mode or EV mode; and,
Power_Split: determines the operation mode based on the power required from the driver when range extender
is idling. If the power demand is in the range of lithium-ion battery capability, the vehicle runs in EV mode,
otherwise, metal-air battery activates to provide the extra power required.
3.2.6 Mass Analysis and Packing
Vehicle mass analysis is an important step when designing a hybrid vehicle. Vehicle performance, fuel economy,
and emission are negatively correlated by mass changes. However, due to the utilization of two energy sources,
hybrid systems always tend to be heavier than conventional vehicles especially when the hybrid powertrain is re-
engineered from the conventional chassis instead of designing from the ground up.
Packing of components also needs to be carefully evaluated. The best packing plan should make sure all the
components safely fit in the vehicle by choosing the least heavy materials possible and not displacing the customer
amenities. Weight reduction is a pressing development target for vehicles; and utilization of lightweight materials in
vehicle body, interior, and chassis/suspension are the three most effective ways to achieve this goal.
For vehicle modeling and simulation, precisely calculated mass will provide a reliable result. The best way to
calculate the vehicle weight is to access the accurate data from suppliers, however, not all of the data can be
obtained from the market, therefore reasonable estimations need to be made during the vehicle design process. For
example, packaging factor is commonly used to estimate the packing weight. Table 11 summarizes the vehicle mass
analysis for the powertrains that was modeled in this work.
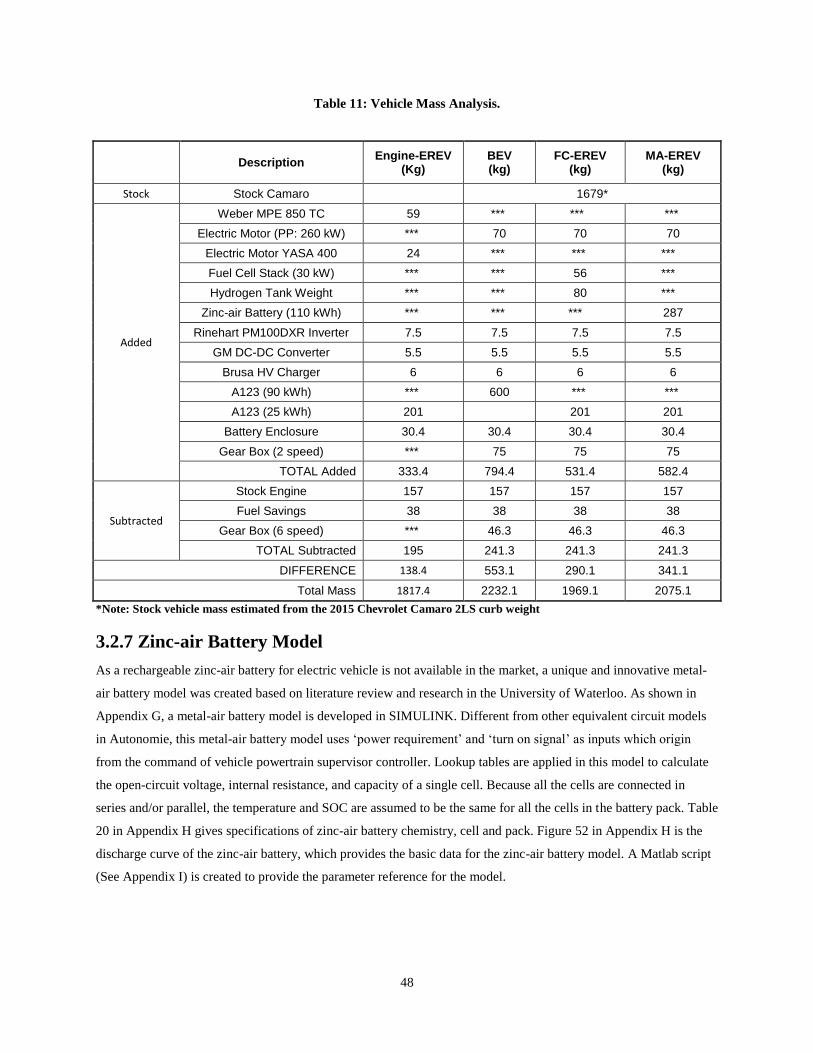
48
Table 11: Vehicle Mass Analysis.
*Note: Stock vehicle mass estimated from the 2015 Chevrolet Camaro 2LS curb weight
3.2.7 Zinc-air Battery Model
As a rechargeable zinc-air battery for electric vehicle is not available in the market, a unique and innovative metal-
air battery model was created based on literature review and research in the University of Waterloo. As shown in
Appendix G, a metal-air battery model is developed in SIMULINK. Different from other equivalent circuit models
in Autonomie, this metal-air battery model uses ‘power requirement’ and ‘turn on signal’ as inputs which origin
from the command of vehicle powertrain supervisor controller. Lookup tables are applied in this model to calculate
the open-circuit voltage, internal resistance, and capacity of a single cell. Because all the cells are connected in
series and/or parallel, the temperature and SOC are assumed to be the same for all the cells in the battery pack. Table
20 in Appendix H gives specifications of zinc-air battery chemistry, cell and pack. Figure 52 in Appendix H is the
discharge curve of the zinc-air battery, which provides the basic data for the zinc-air battery model. A Matlab script
(See Appendix I) is created to provide the parameter reference for the model.
Description Engine-EREV
(Kg) BEV (kg)
FC-EREV (kg)
MA-EREV (kg)
Stock Stock Camaro 1679*
Added
Weber MPE 850 TC 59 *** *** ***
Electric Motor (PP: 260 kW) *** 70 70 70
Electric Motor YASA 400 24 *** *** ***
Fuel Cell Stack (30 kW) *** *** 56 ***
Hydrogen Tank Weight *** *** 80 ***
Zinc-air Battery (110 kWh) *** *** *** 287
Rinehart PM100DXR Inverter 7.5 7.5 7.5 7.5
GM DC-DC Converter 5.5 5.5 5.5 5.5
Brusa HV Charger 6 6 6 6
A123 (90 kWh) *** 600 *** ***
A123 (25 kWh) 201 201 201
Battery Enclosure 30.4 30.4 30.4 30.4
Gear Box (2 speed) *** 75 75 75
TOTAL Added 333.4 794.4 531.4 582.4
Subtracted
Stock Engine 157 157 157 157
Fuel Savings 38 38 38 38
Gear Box (6 speed) *** 46.3 46.3 46.3
TOTAL Subtracted 195 241.3 241.3 241.3
DIFFERENCE 138.4 553.1 290.1 341.1
Total Mass 1817.4 2232.1 1969.1 2075.1

49
3.3 Vehicle Simulation Procedure
The primary purpose of this work is to model three extended range electric powertrains and simulate them with
performance and drive cycle test to compare them with a baseline gasoline vehicle and a battery electric vehicle. The
modeling tool in this work is Autonomie, a software wrapper which runs on top of Matlab & Simulink. The
modeling process starts from vehicle model within Autonomie, combines component data from suppliers for the
UWAFT team for the EcoCAR3 competition. A unique metal-air extended range vehicle architecture was
developed with unique design of two energy storage systems, zinc-air battery and lithium-ion battery, as the energy
source for the powertrain.
The overall procedure of the modeling and simulation in this work is explained in Appendix J, which includes
building the vehicle model in Autonomie, running performance and drive cycle tests, and carrying out result
analysis. Appendix J also lists out the key parameters that are involved in this procedure.
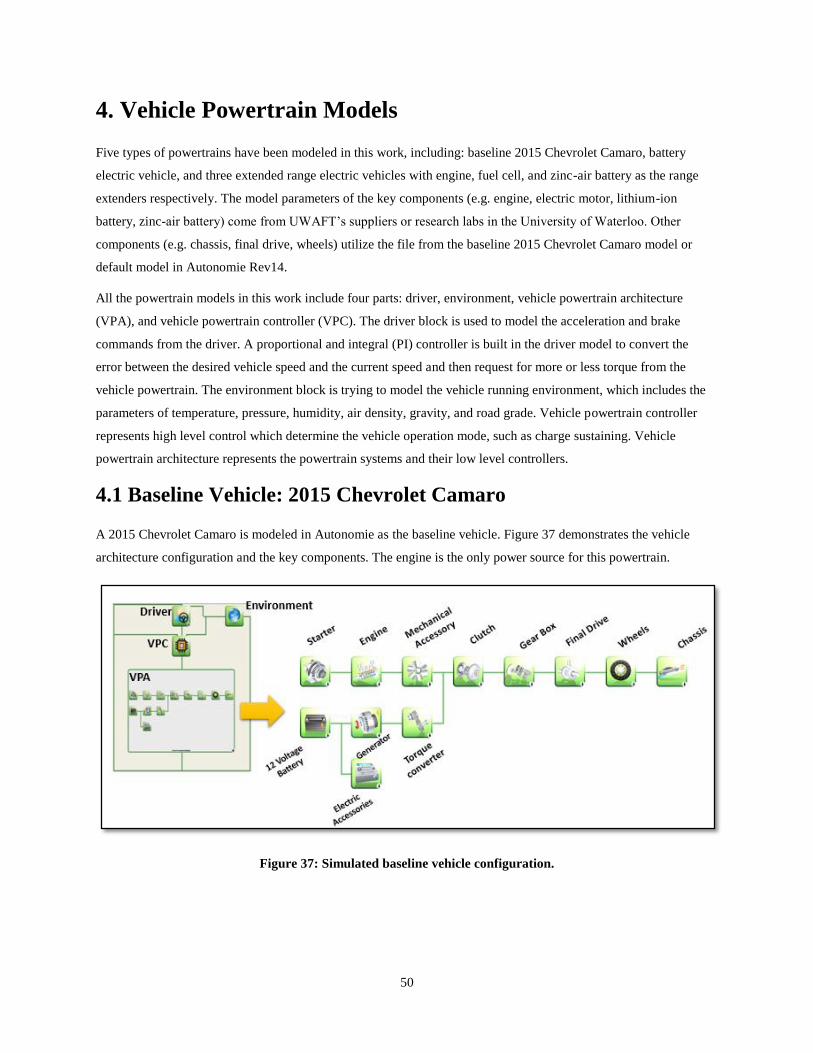
50
4. Vehicle Powertrain Models
Five types of powertrains have been modeled in this work, including: baseline 2015 Chevrolet Camaro, battery
electric vehicle, and three extended range electric vehicles with engine, fuel cell, and zinc-air battery as the range
extenders respectively. The model parameters of the key components (e.g. engine, electric motor, lithium-ion
battery, zinc-air battery) come from UWAFT’s suppliers or research labs in the University of Waterloo. Other
components (e.g. chassis, final drive, wheels) utilize the file from the baseline 2015 Chevrolet Camaro model or
default model in Autonomie Rev14.
All the powertrain models in this work include four parts: driver, environment, vehicle powertrain architecture
(VPA), and vehicle powertrain controller (VPC). The driver block is used to model the acceleration and brake
commands from the driver. A proportional and integral (PI) controller is built in the driver model to convert the
error between the desired vehicle speed and the current speed and then request for more or less torque from the
vehicle powertrain. The environment block is trying to model the vehicle running environment, which includes the
parameters of temperature, pressure, humidity, air density, gravity, and road grade. Vehicle powertrain controller
represents high level control which determine the vehicle operation mode, such as charge sustaining. Vehicle
powertrain architecture represents the powertrain systems and their low level controllers.
4.1 Baseline Vehicle: 2015 Chevrolet Camaro
A 2015 Chevrolet Camaro is modeled in Autonomie as the baseline vehicle. Figure 37 demonstrates the vehicle
architecture configuration and the key components. The engine is the only power source for this powertrain.
Figure 37: Simulated baseline vehicle configuration.
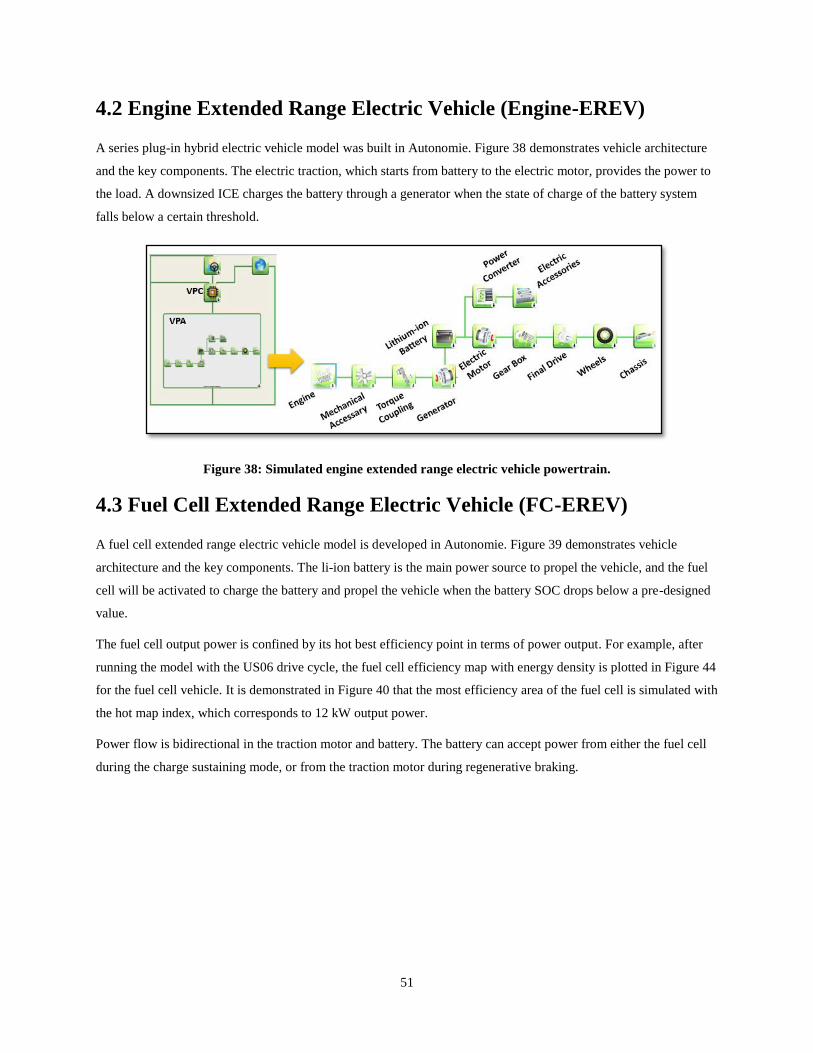
51
4.2 Engine Extended Range Electric Vehicle (Engine-EREV)
A series plug-in hybrid electric vehicle model was built in Autonomie. Figure 38 demonstrates vehicle architecture
and the key components. The electric traction, which starts from battery to the electric motor, provides the power to
the load. A downsized ICE charges the battery through a generator when the state of charge of the battery system
falls below a certain threshold.
Figure 38: Simulated engine extended range electric vehicle powertrain.
4.3 Fuel Cell Extended Range Electric Vehicle (FC-EREV)
A fuel cell extended range electric vehicle model is developed in Autonomie. Figure 39 demonstrates vehicle
architecture and the key components. The li-ion battery is the main power source to propel the vehicle, and the fuel
cell will be activated to charge the battery and propel the vehicle when the battery SOC drops below a pre-designed
value.
The fuel cell output power is confined by its hot best efficiency point in terms of power output. For example, after
running the model with the US06 drive cycle, the fuel cell efficiency map with energy density is plotted in Figure 44
for the fuel cell vehicle. It is demonstrated in Figure 40 that the most efficiency area of the fuel cell is simulated with
the hot map index, which corresponds to 12 kW output power.
Power flow is bidirectional in the traction motor and battery. The battery can accept power from either the fuel cell
during the charge sustaining mode, or from the traction motor during regenerative braking.
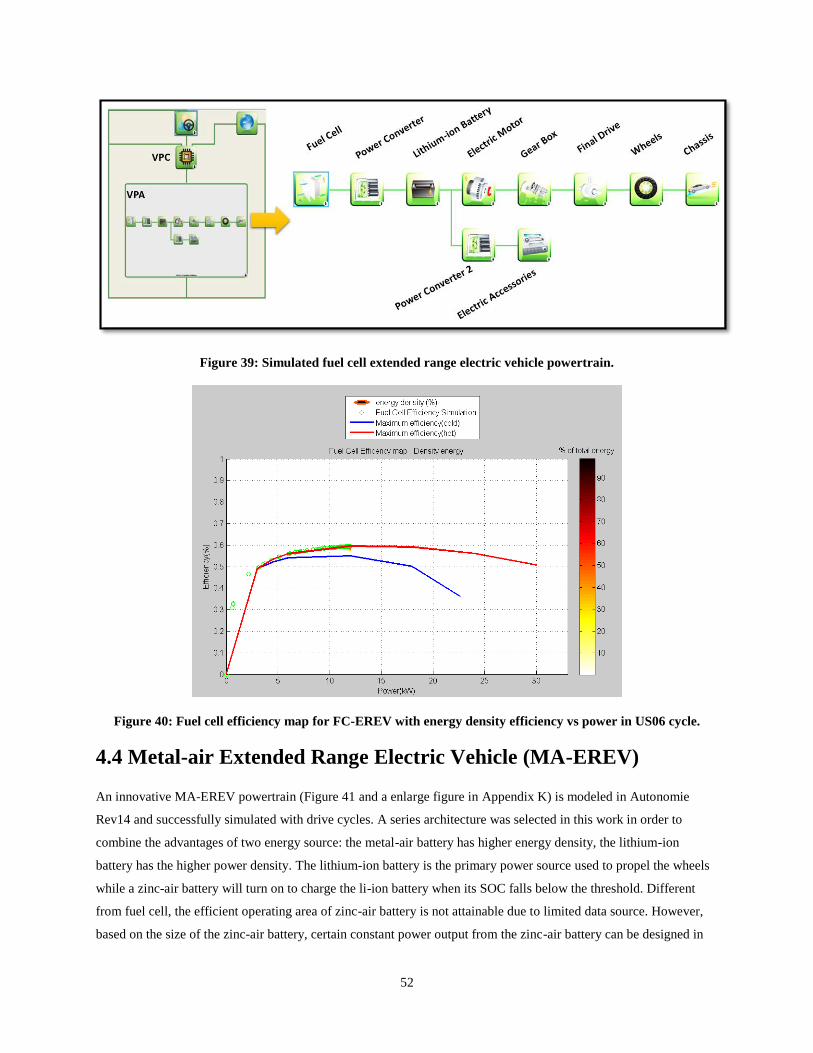
52
Figure 39: Simulated fuel cell extended range electric vehicle powertrain.
Figure 40: Fuel cell efficiency map for FC-EREV with energy density efficiency vs power in US06 cycle.
4.4 Metal-air Extended Range Electric Vehicle (MA-EREV)
An innovative MA-EREV powertrain (Figure 41 and a enlarge figure in Appendix K) is modeled in Autonomie
Rev14 and successfully simulated with drive cycles. A series architecture was selected in this work in order to
combine the advantages of two energy source: the metal-air battery has higher energy density, the lithium-ion
battery has the higher power density. The lithium-ion battery is the primary power source used to propel the wheels
while a zinc-air battery will turn on to charge the li-ion battery when its SOC falls below the threshold. Different
from fuel cell, the efficient operating area of zinc-air battery is not attainable due to limited data source. However,
based on the size of the zinc-air battery, certain constant power output from the zinc-air battery can be designed in
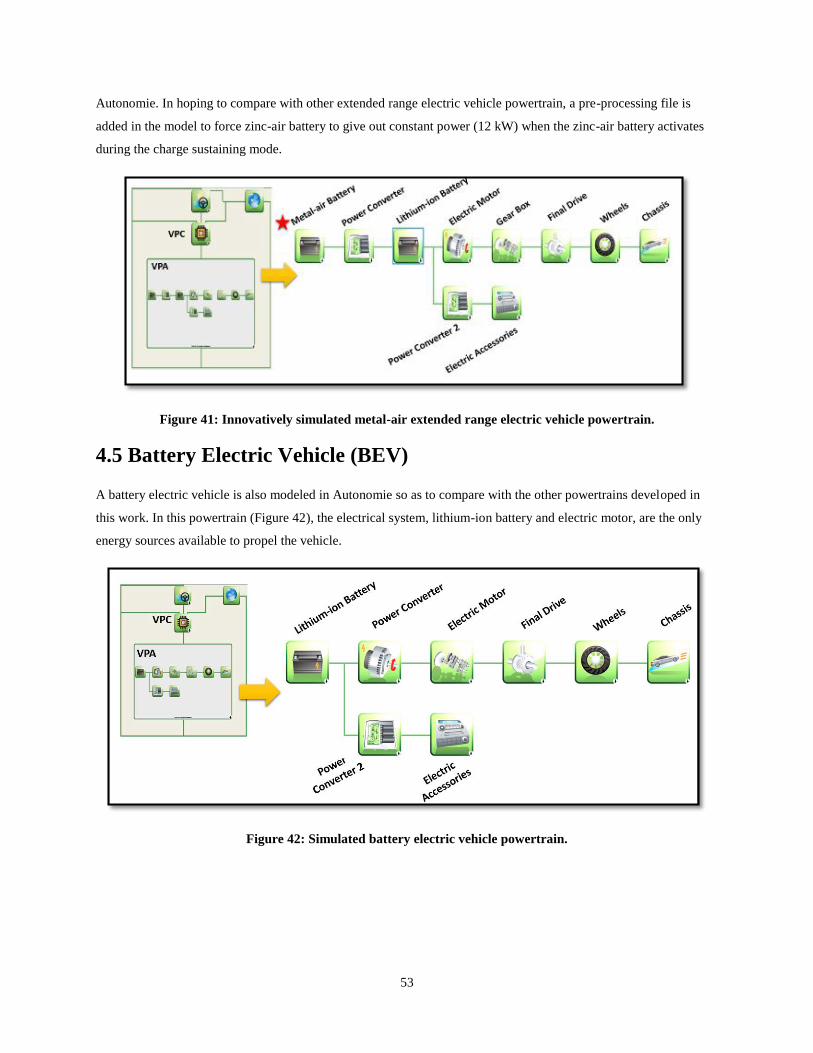
53
Autonomie. In hoping to compare with other extended range electric vehicle powertrain, a pre-processing file is
added in the model to force zinc-air battery to give out constant power (12 kW) when the zinc-air battery activates
during the charge sustaining mode.
Figure 41: Innovatively simulated metal-air extended range electric vehicle powertrain.
4.5 Battery Electric Vehicle (BEV)
A battery electric vehicle is also modeled in Autonomie so as to compare with the other powertrains developed in
this work. In this powertrain (Figure 42), the electrical system, lithium-ion battery and electric motor, are the only
energy sources available to propel the vehicle.
Figure 42: Simulated battery electric vehicle powertrain.
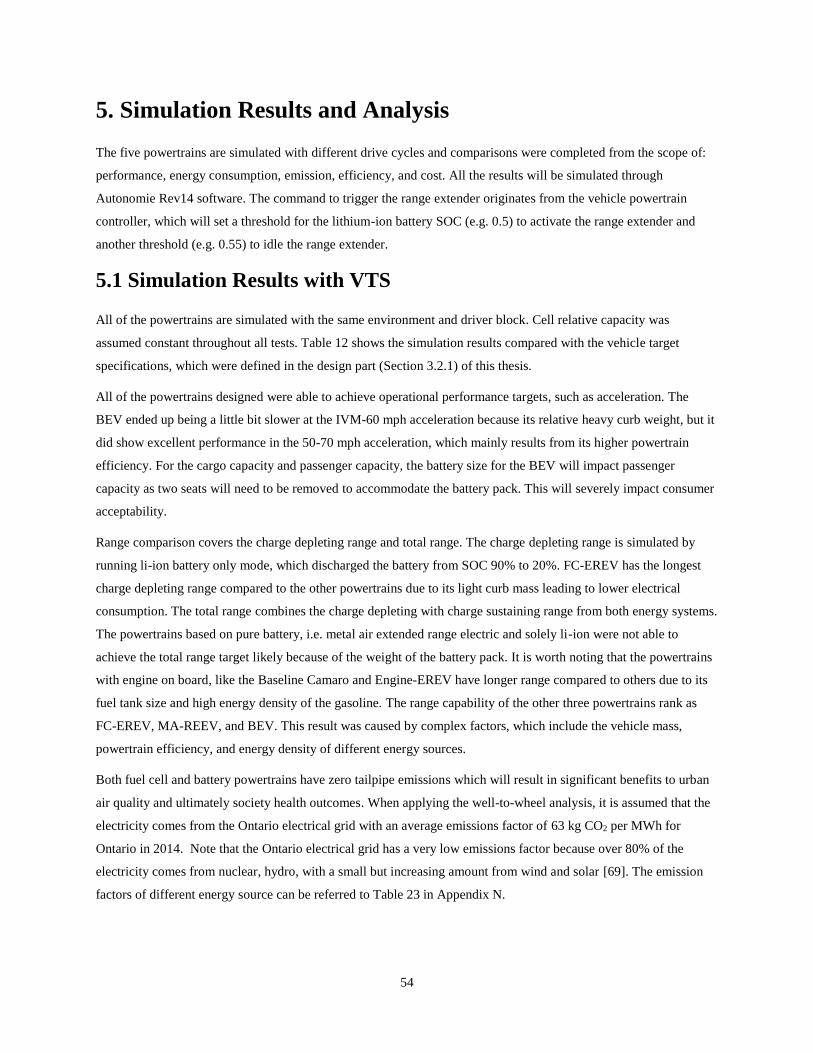
54
5. Simulation Results and Analysis
The five powertrains are simulated with different drive cycles and comparisons were completed from the scope of:
performance, energy consumption, emission, efficiency, and cost. All the results will be simulated through
Autonomie Rev14 software. The command to trigger the range extender originates from the vehicle powertrain
controller, which will set a threshold for the lithium-ion battery SOC (e.g. 0.5) to activate the range extender and
another threshold (e.g. 0.55) to idle the range extender.
5.1 Simulation Results with VTS
All of the powertrains are simulated with the same environment and driver block. Cell relative capacity was
assumed constant throughout all tests. Table 12 shows the simulation results compared with the vehicle target
specifications, which were defined in the design part (Section 3.2.1) of this thesis.
All of the powertrains designed were able to achieve operational performance targets, such as acceleration. The
BEV ended up being a little bit slower at the IVM-60 mph acceleration because its relative heavy curb weight, but it
did show excellent performance in the 50-70 mph acceleration, which mainly results from its higher powertrain
efficiency. For the cargo capacity and passenger capacity, the battery size for the BEV will impact passenger
capacity as two seats will need to be removed to accommodate the battery pack. This will severely impact consumer
acceptability.
Range comparison covers the charge depleting range and total range. The charge depleting range is simulated by
running li-ion battery only mode, which discharged the battery from SOC 90% to 20%. FC-EREV has the longest
charge depleting range compared to the other powertrains due to its light curb mass leading to lower electrical
consumption. The total range combines the charge depleting with charge sustaining range from both energy systems.
The powertrains based on pure battery, i.e. metal air extended range electric and solely li-ion were not able to
achieve the total range target likely because of the weight of the battery pack. It is worth noting that the powertrains
with engine on board, like the Baseline Camaro and Engine-EREV have longer range compared to others due to its
fuel tank size and high energy density of the gasoline. The range capability of the other three powertrains rank as
FC-EREV, MA-REEV, and BEV. This result was caused by complex factors, which include the vehicle mass,
powertrain efficiency, and energy density of different energy sources.
Both fuel cell and battery powertrains have zero tailpipe emissions which will result in significant benefits to urban
air quality and ultimately society health outcomes. When applying the well-to-wheel analysis, it is assumed that the
electricity comes from the Ontario electrical grid with an average emissions factor of 63 kg CO2 per MWh for
Ontario in 2014. Note that the Ontario electrical grid has a very low emissions factor because over 80% of the
electricity comes from nuclear, hydro, with a small but increasing amount from wind and solar [69]. The emission
factors of different energy source can be referred to Table 23 in Appendix N.
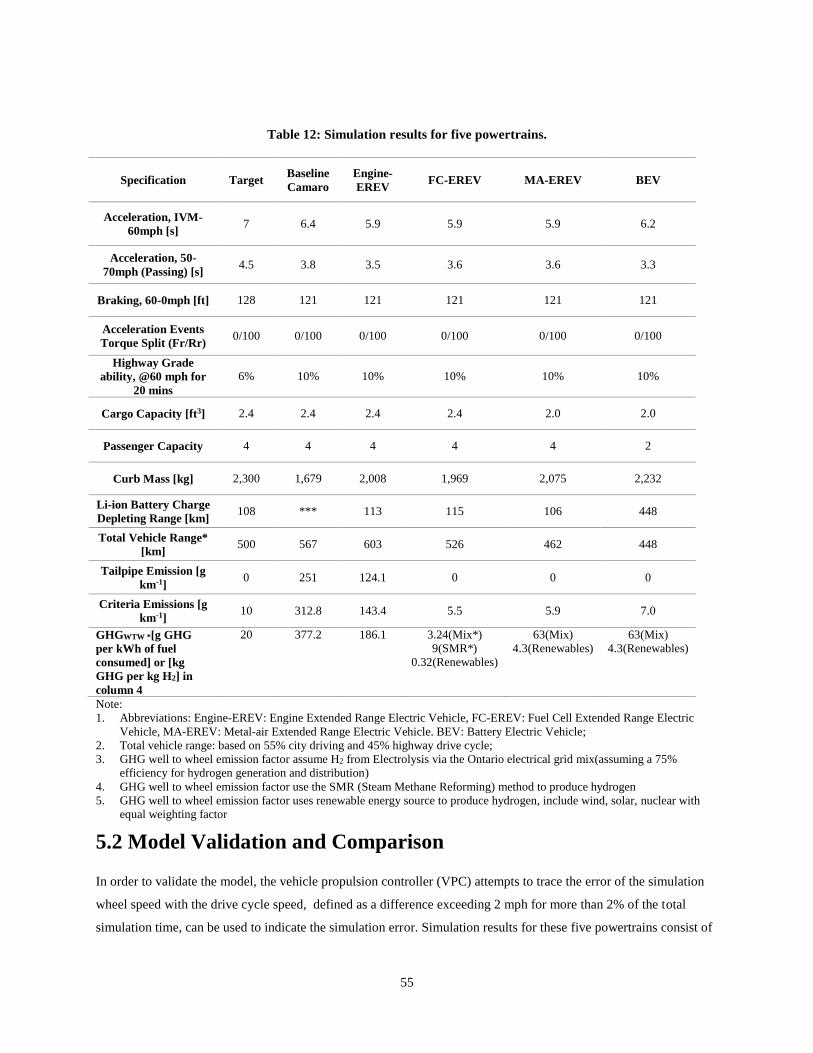
55
Table 12: Simulation results for five powertrains.
Specification Target Baseline
Camaro
Engine-
EREV FC-EREV MA-EREV BEV
Acceleration, IVM-
60mph [s] 7 6.4 5.9 5.9 5.9 6.2
Acceleration, 50-
70mph (Passing) [s] 4.5 3.8 3.5 3.6 3.6 3.3
Braking, 60-0mph [ft] 128 121 121 121 121 121
Acceleration Events
Torque Split (Fr/Rr) 0/100 0/100 0/100 0/100 0/100 0/100
Highway Grade
ability, @60 mph for
20 mins
6% 10% 10% 10% 10% 10%
Cargo Capacity [ft3] 2.4 2.4 2.4 2.4 2.0 2.0
Passenger Capacity 4 4 4 4 4 2
Curb Mass [kg] 2,300 1,679 2,008 1,969 2,075 2,232
Li-ion Battery Charge
Depleting Range [km] 108 *** 113 115 106 448
Total Vehicle Range*
[km] 500 567 603 526 462 448
Tailpipe Emission [g
km-1] 0 251 124.1 0 0 0
Criteria Emissions [g
km-1] 10 312.8 143.4 5.5 5.9 7.0
GHGWTW *[g GHG
per kWh of fuel
consumed] or [kg
GHG per kg H2] in
column 4
20 377.2 186.1 3.24(Mix*)
9(SMR*)
0.32(Renewables)
63(Mix)
4.3(Renewables)
63(Mix)
4.3(Renewables)
Note:
1. Abbreviations: Engine-EREV: Engine Extended Range Electric Vehicle, FC-EREV: Fuel Cell Extended Range Electric
Vehicle, MA-EREV: Metal-air Extended Range Electric Vehicle. BEV: Battery Electric Vehicle;
2. Total vehicle range: based on 55% city driving and 45% highway drive cycle;
3. GHG well to wheel emission factor assume H2 from Electrolysis via the Ontario electrical grid mix(assuming a 75%
efficiency for hydrogen generation and distribution)
4. GHG well to wheel emission factor use the SMR (Steam Methane Reforming) method to produce hydrogen
5. GHG well to wheel emission factor uses renewable energy source to produce hydrogen, include wind, solar, nuclear with
equal weighting factor
5.2 Model Validation and Comparison
In order to validate the model, the vehicle propulsion controller (VPC) attempts to trace the error of the simulation
wheel speed with the drive cycle speed, defined as a difference exceeding 2 mph for more than 2% of the total
simulation time, can be used to indicate the simulation error. Simulation results for these five powertrains consist of
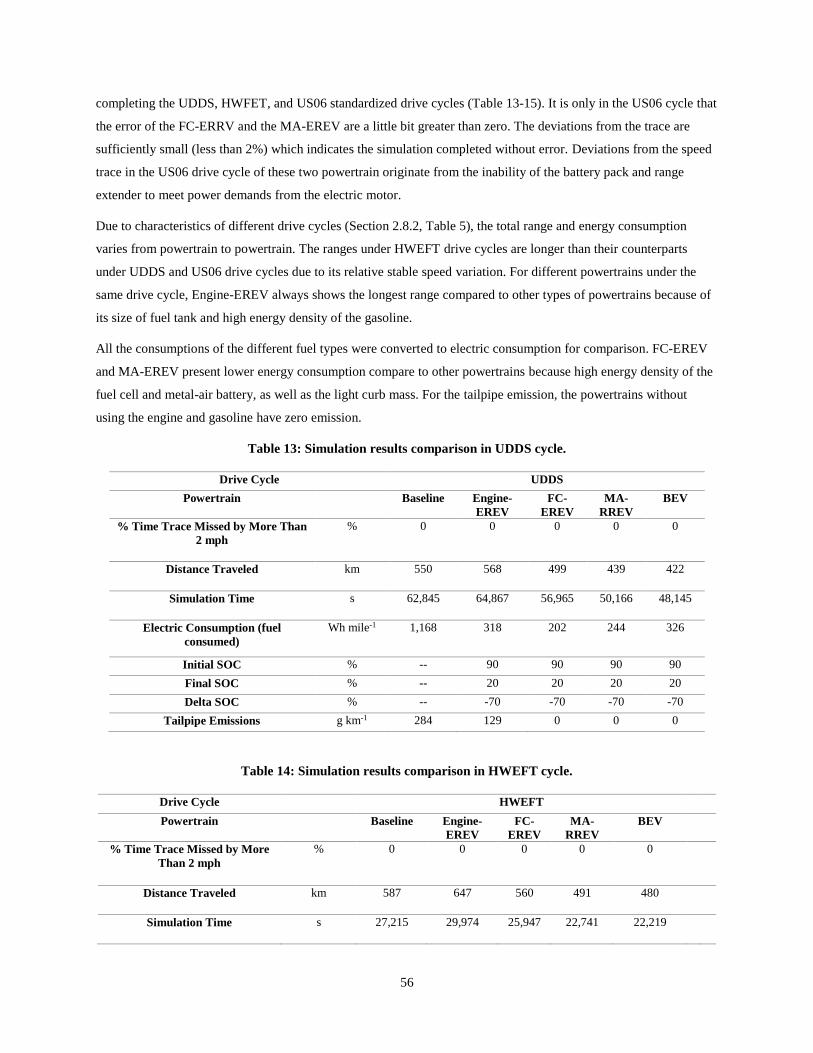
56
completing the UDDS, HWFET, and US06 standardized drive cycles (Table 13-15). It is only in the US06 cycle that
the error of the FC-ERRV and the MA-EREV are a little bit greater than zero. The deviations from the trace are
sufficiently small (less than 2%) which indicates the simulation completed without error. Deviations from the speed
trace in the US06 drive cycle of these two powertrain originate from the inability of the battery pack and range
extender to meet power demands from the electric motor.
Due to characteristics of different drive cycles (Section 2.8.2, Table 5), the total range and energy consumption
varies from powertrain to powertrain. The ranges under HWEFT drive cycles are longer than their counterparts
under UDDS and US06 drive cycles due to its relative stable speed variation. For different powertrains under the
same drive cycle, Engine-EREV always shows the longest range compared to other types of powertrains because of
its size of fuel tank and high energy density of the gasoline.
All the consumptions of the different fuel types were converted to electric consumption for comparison. FC-EREV
and MA-EREV present lower energy consumption compare to other powertrains because high energy density of the
fuel cell and metal-air battery, as well as the light curb mass. For the tailpipe emission, the powertrains without
using the engine and gasoline have zero emission.
Table 13: Simulation results comparison in UDDS cycle.
Drive Cycle UDDS
Powertrain Baseline Engine-
EREV
FC-
EREV
MA-
RREV
BEV
% Time Trace Missed by More Than
2 mph
% 0 0 0 0 0
Distance Traveled km 550 568 499 439 422
Simulation Time s 62,845 64,867 56,965 50,166 48,145
Electric Consumption (fuel
consumed)
Wh mile-1 1,168 318 202 244 326
Initial SOC % -- 90 90 90 90
Final SOC % -- 20 20 20 20
Delta SOC % -- -70 -70 -70 -70
Tailpipe Emissions g km-1 284 129 0 0 0
Table 14: Simulation results comparison in HWEFT cycle.
Drive Cycle HWEFT
Powertrain Baseline Engine-
EREV
FC-
EREV
MA-
RREV
BEV
% Time Trace Missed by More
Than 2 mph
% 0 0 0 0 0
Distance Traveled km 587 647 560 491 480
Simulation Time s 27,215 29,974 25,947 22,741 22,219
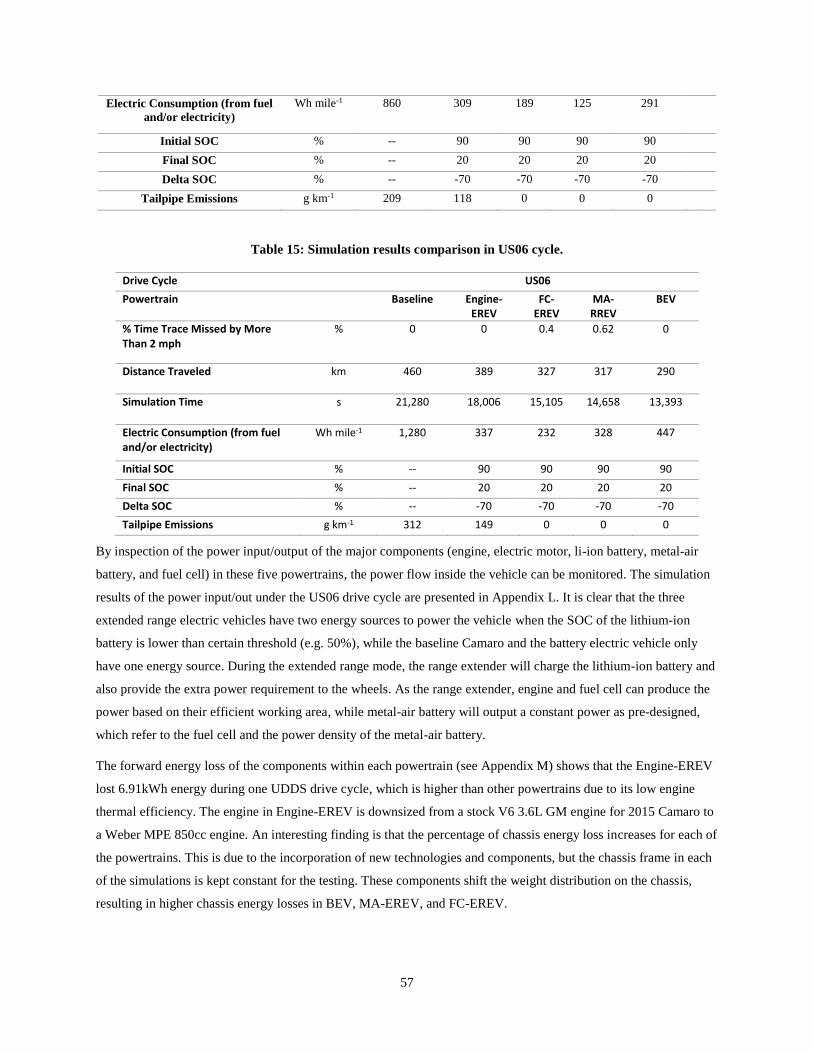
57
Electric Consumption (from fuel
and/or electricity)
Wh mile-1 860 309 189 125 291
Initial SOC % -- 90 90 90 90
Final SOC % -- 20 20 20 20
Delta SOC % -- -70 -70 -70 -70
Tailpipe Emissions g km-1 209 118 0 0 0
Table 15: Simulation results comparison in US06 cycle.
Drive Cycle US06
Powertrain Baseline Engine-EREV
FC-EREV
MA-RREV
BEV
% Time Trace Missed by More Than 2 mph
% 0 0 0.4 0.62 0
Distance Traveled km 460 389 327 317 290
Simulation Time s 21,280 18,006 15,105 14,658 13,393
Electric Consumption (from fuel and/or electricity)
Wh mile-1 1,280 337 232 328 447
Initial SOC % -- 90 90 90 90
Final SOC % -- 20 20 20 20
Delta SOC % -- -70 -70 -70 -70
Tailpipe Emissions g km-1 312 149 0 0 0
By inspection of the power input/output of the major components (engine, electric motor, li-ion battery, metal-air
battery, and fuel cell) in these five powertrains, the power flow inside the vehicle can be monitored. The simulation
results of the power input/out under the US06 drive cycle are presented in Appendix L. It is clear that the three
extended range electric vehicles have two energy sources to power the vehicle when the SOC of the lithium-ion
battery is lower than certain threshold (e.g. 50%), while the baseline Camaro and the battery electric vehicle only
have one energy source. During the extended range mode, the range extender will charge the lithium-ion battery and
also provide the extra power requirement to the wheels. As the range extender, engine and fuel cell can produce the
power based on their efficient working area, while metal-air battery will output a constant power as pre-designed,
which refer to the fuel cell and the power density of the metal-air battery.
The forward energy loss of the components within each powertrain (see Appendix M) shows that the Engine-EREV
lost 6.91kWh energy during one UDDS drive cycle, which is higher than other powertrains due to its low engine
thermal efficiency. The engine in Engine-EREV is downsized from a stock V6 3.6L GM engine for 2015 Camaro to
a Weber MPE 850cc engine. An interesting finding is that the percentage of chassis energy loss increases for each of
the powertrains. This is due to the incorporation of new technologies and components, but the chassis frame in each
of the simulations is kept constant for the testing. These components shift the weight distribution on the chassis,
resulting in higher chassis energy losses in BEV, MA-EREV, and FC-EREV.

58
5.3 Range Analysis
The range of electric vehicle is related to the size of the energy storage system, energy consumption under different
drive cycles, and driving behaviors. The process of depleting energy storage system can be presented by checking
the state of charge (SOC) of the energy storage system. For the extended range electric vehicle, the range is also
related to the time of activating the range extender. Therefore, the SOC change of the energy storage system over the
range is an interesting topic to investigate especially when activating the range extender.
Figure 43 demonstrates the lithium-ion battery SOC deviations of different powertrains in the US06 drive cycle
when the range extender is activated or idled between thresholds. The dash line is the lithium-ion battery SOC
changes without turning on the range extender, and the solid line shows the SOC changes when range extender is
activated. It can be found that the range extender can maintain lithium-ion battery SOC, i.e. Engine-EREV; or slow
its decrease, i.e. FC-EREV and MA-EREV. For the Battery Electric Vehicle, the lithium-ion SOC changes is only
related to the battery size, vehicle mass, electric consumption of certain drive cycle.
Notes: ess_soc(eng_on): Li-ion SOC changes when engine on; ess_soc (eng_off): SOC changes when engine off; ess_soc(fc_on):
SOC changes when fuel cell on; ess_soc(fc_off): SOC changes when fuel cell off; ess_soc(ma_on): SOC changes when metal-air
battery on; ess_soc(ma_off): SOC changes when metal-air battery off; ess_soc: SOC changes
Figure 43: Li-ion battery SOC changes when the range extender activates at Li-ion battery SOC below 50%
in US06 drive cycle.
Figure 44 shows the lithium-ion battery SOC changes of different powertrains in the UDDS drive cycle. Similar to
the US06 cycle, the range extender can reduce the decreasing rate of SOC in the lithium-ion battery. Dissimilar to
those plots in US06 drive cycle, the SOC changes in UDDS drive cycle have more fluctuation. Thus, the SOC of
each powertrain cane end up being higher than the results in US06 cycle. The reason for why this can occur is
because of the characteristics of the drive cycle. US06 drive cycle is an aggressive drive cycle with large power
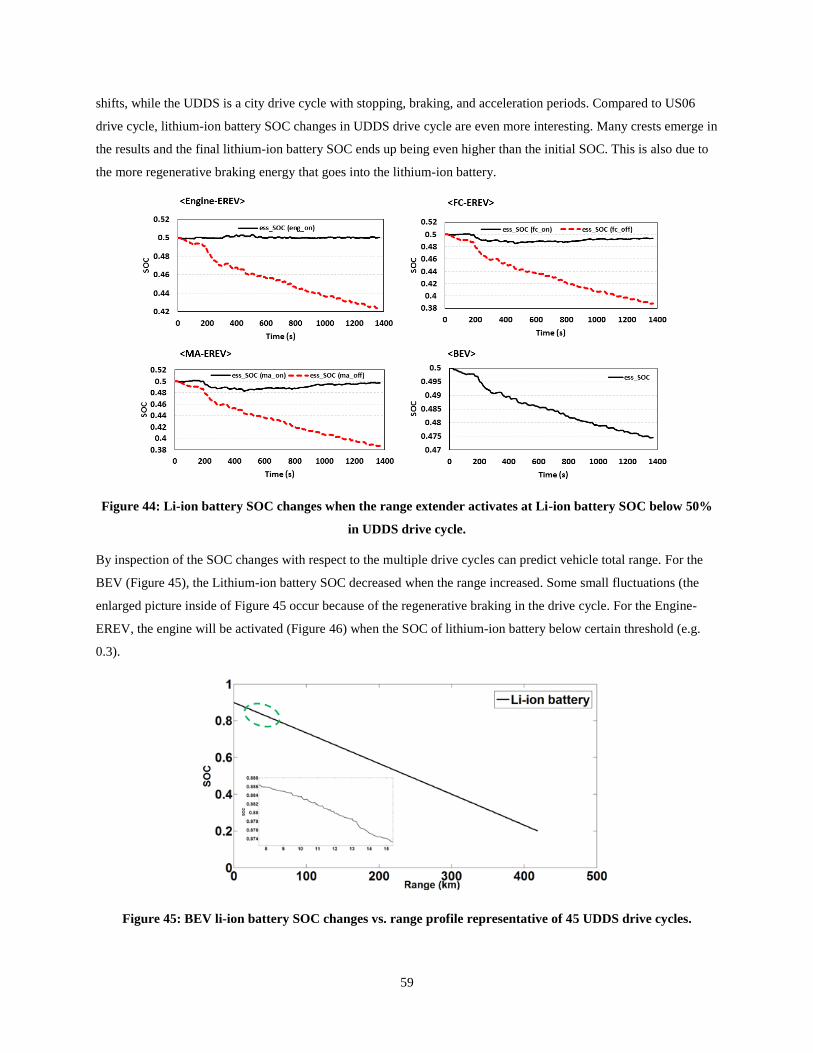
59
shifts, while the UDDS is a city drive cycle with stopping, braking, and acceleration periods. Compared to US06
drive cycle, lithium-ion battery SOC changes in UDDS drive cycle are even more interesting. Many crests emerge in
the results and the final lithium-ion battery SOC ends up being even higher than the initial SOC. This is also due to
the more regenerative braking energy that goes into the lithium-ion battery.
Figure 44: Li-ion battery SOC changes when the range extender activates at Li-ion battery SOC below 50%
in UDDS drive cycle.
By inspection of the SOC changes with respect to the multiple drive cycles can predict vehicle total range. For the
BEV (Figure 45), the Lithium-ion battery SOC decreased when the range increased. Some small fluctuations (the
enlarged picture inside of Figure 45 occur because of the regenerative braking in the drive cycle. For the Engine-
EREV, the engine will be activated (Figure 46) when the SOC of lithium-ion battery below certain threshold (e.g.
0.3).
Figure 45: BEV li-ion battery SOC changes vs. range profile representative of 45 UDDS drive cycles.
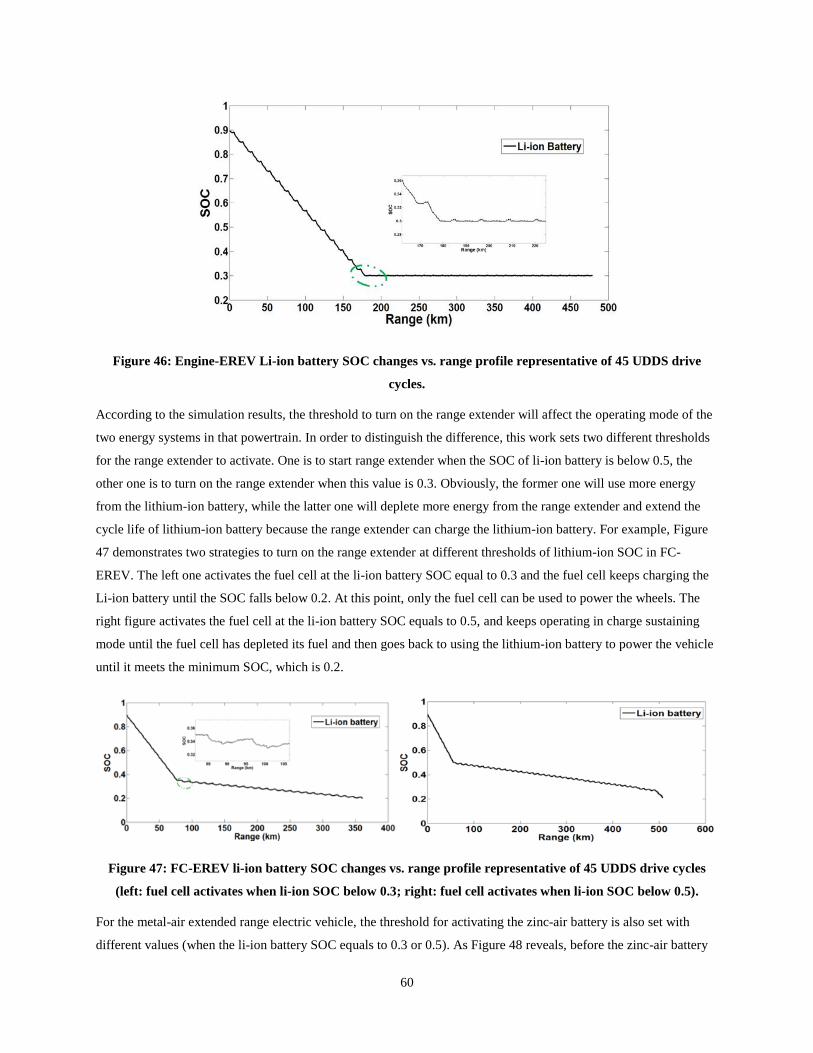
60
Figure 46: Engine-EREV Li-ion battery SOC changes vs. range profile representative of 45 UDDS drive
cycles.
According to the simulation results, the threshold to turn on the range extender will affect the operating mode of the
two energy systems in that powertrain. In order to distinguish the difference, this work sets two different thresholds
for the range extender to activate. One is to start range extender when the SOC of li-ion battery is below 0.5, the
other one is to turn on the range extender when this value is 0.3. Obviously, the former one will use more energy
from the lithium-ion battery, while the latter one will deplete more energy from the range extender and extend the
cycle life of lithium-ion battery because the range extender can charge the lithium-ion battery. For example, Figure
47 demonstrates two strategies to turn on the range extender at different thresholds of lithium-ion SOC in FC-
EREV. The left one activates the fuel cell at the li-ion battery SOC equal to 0.3 and the fuel cell keeps charging the
Li-ion battery until the SOC falls below 0.2. At this point, only the fuel cell can be used to power the wheels. The
right figure activates the fuel cell at the li-ion battery SOC equals to 0.5, and keeps operating in charge sustaining
mode until the fuel cell has depleted its fuel and then goes back to using the lithium-ion battery to power the vehicle
until it meets the minimum SOC, which is 0.2.
Figure 47: FC-EREV li-ion battery SOC changes vs. range profile representative of 45 UDDS drive cycles
(left: fuel cell activates when li-ion SOC below 0.3; right: fuel cell activates when li-ion SOC below 0.5).
For the metal-air extended range electric vehicle, the threshold for activating the zinc-air battery is also set with
different values (when the li-ion battery SOC equals to 0.3 or 0.5). As Figure 48 reveals, before the zinc-air battery
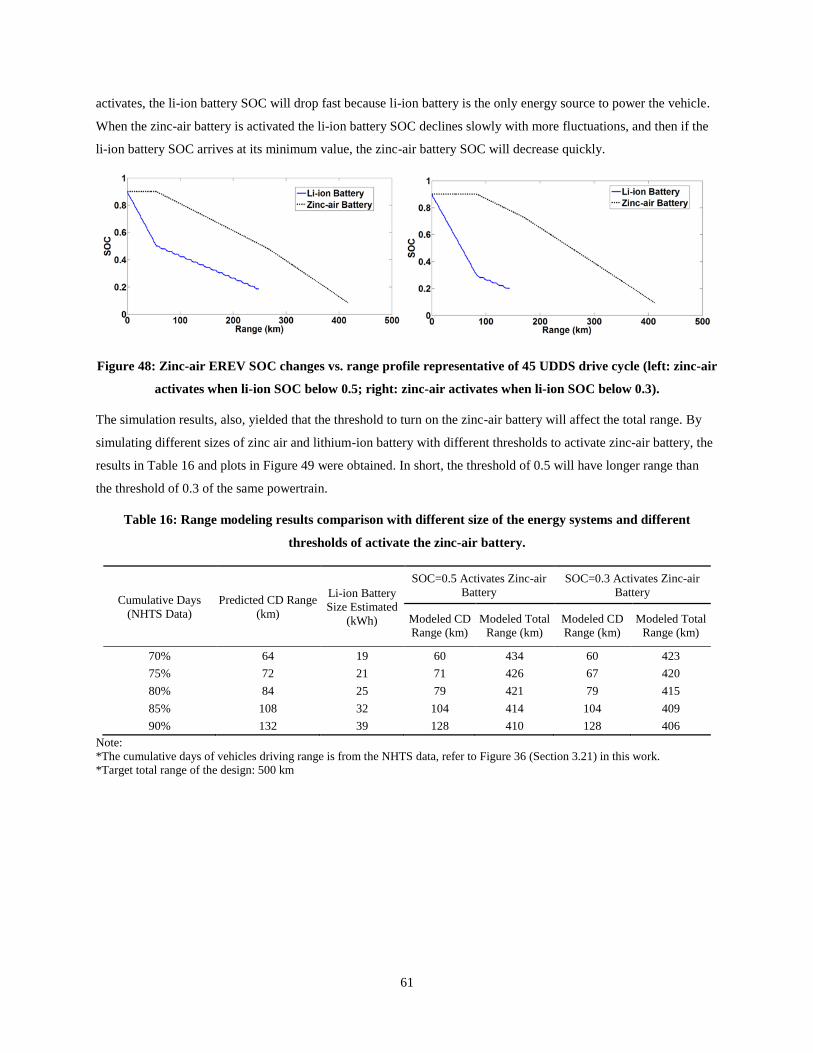
61
activates, the li-ion battery SOC will drop fast because li-ion battery is the only energy source to power the vehicle.
When the zinc-air battery is activated the li-ion battery SOC declines slowly with more fluctuations, and then if the
li-ion battery SOC arrives at its minimum value, the zinc-air battery SOC will decrease quickly.
Figure 48: Zinc-air EREV SOC changes vs. range profile representative of 45 UDDS drive cycle (left: zinc-air
activates when li-ion SOC below 0.5; right: zinc-air activates when li-ion SOC below 0.3).
The simulation results, also, yielded that the threshold to turn on the zinc-air battery will affect the total range. By
simulating different sizes of zinc air and lithium-ion battery with different thresholds to activate zinc-air battery, the
results in Table 16 and plots in Figure 49 were obtained. In short, the threshold of 0.5 will have longer range than
the threshold of 0.3 of the same powertrain.
Table 16: Range modeling results comparison with different size of the energy systems and different
thresholds of activate the zinc-air battery.
Cumulative Days
(NHTS Data)
Predicted CD Range
(km)
Li-ion Battery
Size Estimated
(kWh)
SOC=0.5 Activates Zinc-air
Battery
SOC=0.3 Activates Zinc-air
Battery
Modeled CD
Range (km)
Modeled Total
Range (km)
Modeled CD
Range (km)
Modeled Total
Range (km)
70% 64 19 60 434 60 423
75% 72 21 71 426 67 420
80% 84 25 79 421 79 415
85% 108 32 104 414 104 409
90% 132 39 128 410 128 406
Note:
*The cumulative days of vehicles driving range is from the NHTS data, refer to Figure 36 (Section 3.21) in this work.
*Target total range of the design: 500 km
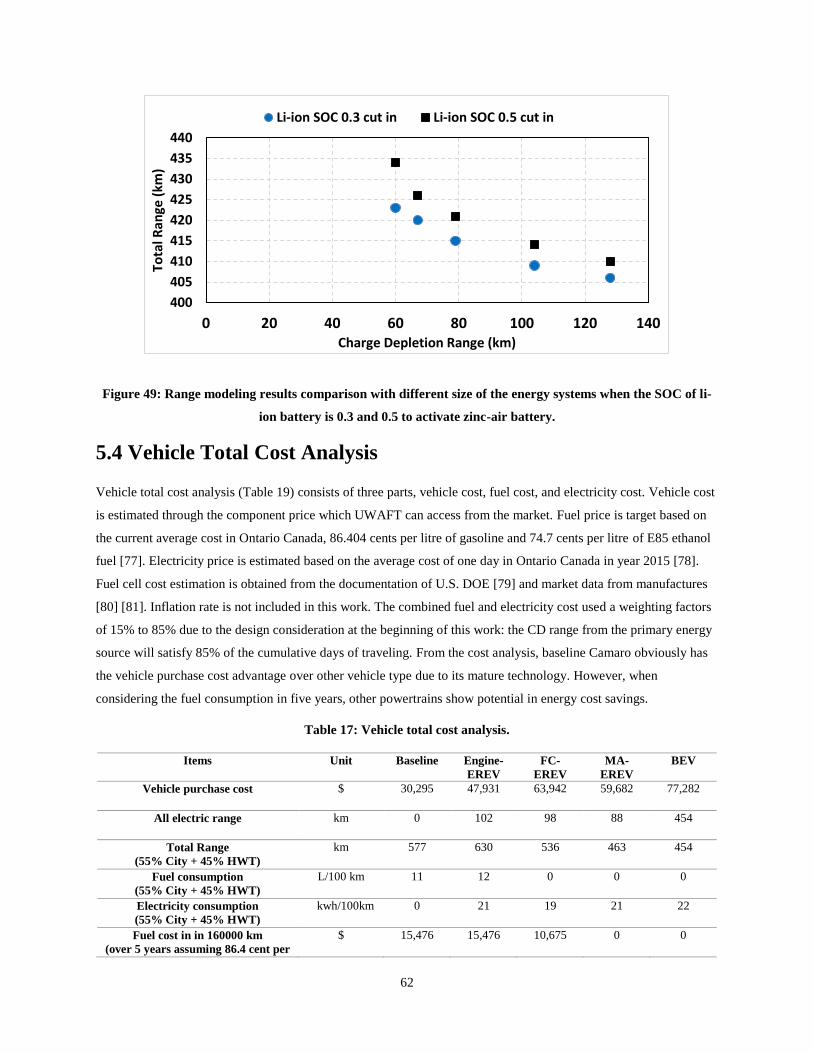
62
Figure 49: Range modeling results comparison with different size of the energy systems when the SOC of li-
ion battery is 0.3 and 0.5 to activate zinc-air battery.
5.4 Vehicle Total Cost Analysis
Vehicle total cost analysis (Table 19) consists of three parts, vehicle cost, fuel cost, and electricity cost. Vehicle cost
is estimated through the component price which UWAFT can access from the market. Fuel price is target based on
the current average cost in Ontario Canada, 86.404 cents per litre of gasoline and 74.7 cents per litre of E85 ethanol
fuel [77]. Electricity price is estimated based on the average cost of one day in Ontario Canada in year 2015 [78].
Fuel cell cost estimation is obtained from the documentation of U.S. DOE [79] and market data from manufactures
[80] [81]. Inflation rate is not included in this work. The combined fuel and electricity cost used a weighting factors
of 15% to 85% due to the design consideration at the beginning of this work: the CD range from the primary energy
source will satisfy 85% of the cumulative days of traveling. From the cost analysis, baseline Camaro obviously has
the vehicle purchase cost advantage over other vehicle type due to its mature technology. However, when
considering the fuel consumption in five years, other powertrains show potential in energy cost savings.
Table 17: Vehicle total cost analysis.
Items Unit Baseline Engine-
EREV
FC-
EREV
MA-
EREV
BEV
Vehicle purchase cost $ 30,295 47,931 63,942 59,682 77,282
All electric range km 0 102 98 88 454
Total Range
(55% City + 45% HWT)
km 577 630 536 463 454
Fuel consumption
(55% City + 45% HWT)
L/100 km 11 12 0 0 0
Electricity consumption
(55% City + 45% HWT)
kwh/100km 0 21 19 21 22
Fuel cost in in 160000 km
(over 5 years assuming 86.4 cent per
$ 15,476 15,476 10,675 0 0
400
405
410
415
420
425
430
435
440
0 20 40 60 80 100 120 140
Tota
l Ran
ge (
km)
Charge Depletion Range (km)
Li-ion SOC 0.3 cut in Li-ion SOC 0.5 cut in
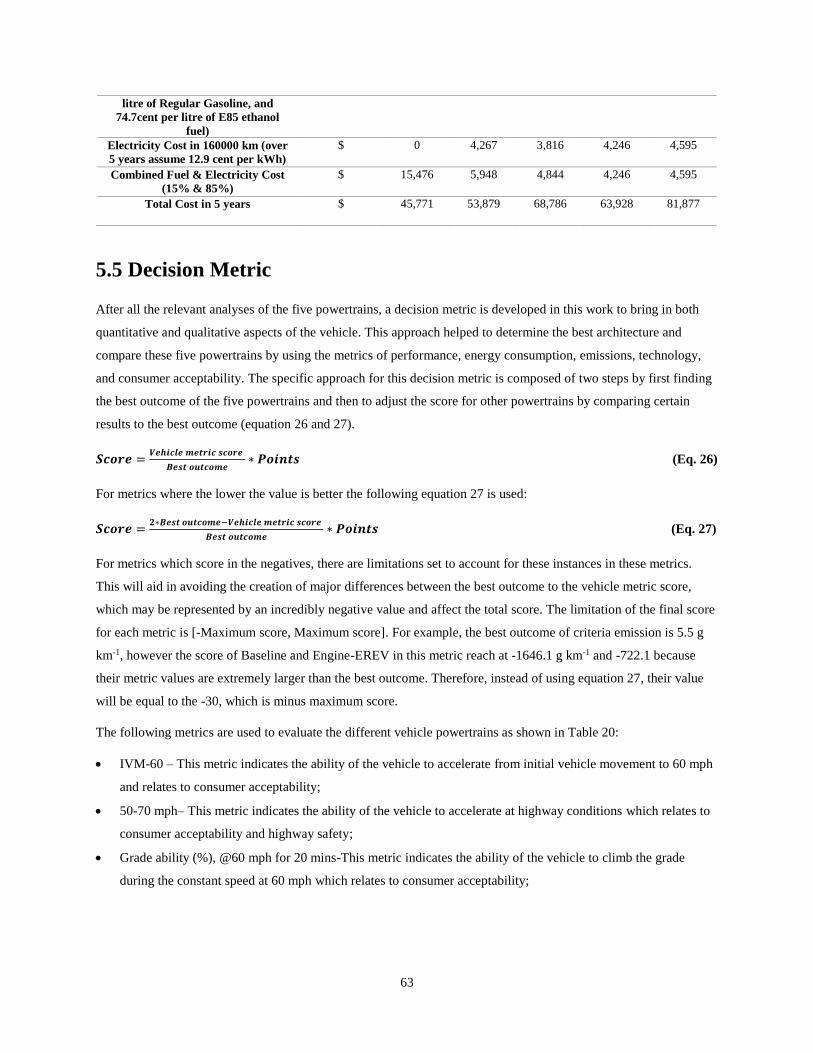
63
litre of Regular Gasoline, and
74.7cent per litre of E85 ethanol
fuel)
Electricity Cost in 160000 km (over
5 years assume 12.9 cent per kWh)
$ 0 4,267 3,816 4,246 4,595
Combined Fuel & Electricity Cost
(15% & 85%)
$ 15,476 5,948 4,844 4,246 4,595
Total Cost in 5 years $ 45,771 53,879 68,786 63,928 81,877
5.5 Decision Metric
After all the relevant analyses of the five powertrains, a decision metric is developed in this work to bring in both
quantitative and qualitative aspects of the vehicle. This approach helped to determine the best architecture and
compare these five powertrains by using the metrics of performance, energy consumption, emissions, technology,
and consumer acceptability. The specific approach for this decision metric is composed of two steps by first finding
the best outcome of the five powertrains and then to adjust the score for other powertrains by comparing certain
results to the best outcome (equation 26 and 27).
𝑺𝒄𝒐𝒓𝒆 =𝑽𝒆𝒉𝒊𝒄𝒍𝒆 𝒎𝒆𝒕𝒓𝒊𝒄 𝒔𝒄𝒐𝒓𝒆
𝑩𝒆𝒔𝒕 𝒐𝒖𝒕𝒄𝒐𝒎𝒆∗ 𝑷𝒐𝒊𝒏𝒕𝒔 (Eq. 26)
For metrics where the lower the value is better the following equation 27 is used:
𝑺𝒄𝒐𝒓𝒆 =𝟐∗𝑩𝒆𝒔𝒕 𝒐𝒖𝒕𝒄𝒐𝒎𝒆−𝑽𝒆𝒉𝒊𝒄𝒍𝒆 𝒎𝒆𝒕𝒓𝒊𝒄 𝒔𝒄𝒐𝒓𝒆
𝑩𝒆𝒔𝒕 𝒐𝒖𝒕𝒄𝒐𝒎𝒆∗ 𝑷𝒐𝒊𝒏𝒕𝒔 (Eq. 27)
For metrics which score in the negatives, there are limitations set to account for these instances in these metrics.
This will aid in avoiding the creation of major differences between the best outcome to the vehicle metric score,
which may be represented by an incredibly negative value and affect the total score. The limitation of the final score
for each metric is [-Maximum score, Maximum score]. For example, the best outcome of criteria emission is 5.5 g
km-1, however the score of Baseline and Engine-EREV in this metric reach at -1646.1 g km-1 and -722.1 because
their metric values are extremely larger than the best outcome. Therefore, instead of using equation 27, their value
will be equal to the -30, which is minus maximum score.
The following metrics are used to evaluate the different vehicle powertrains as shown in Table 20:
IVM-60 – This metric indicates the ability of the vehicle to accelerate from initial vehicle movement to 60 mph
and relates to consumer acceptability;
50-70 mph– This metric indicates the ability of the vehicle to accelerate at highway conditions which relates to
consumer acceptability and highway safety;
Grade ability (%), @60 mph for 20 mins-This metric indicates the ability of the vehicle to climb the grade
during the constant speed at 60 mph which relates to consumer acceptability;
64
Energy Consumption (Wh km-1)-This metric indicates the energy consumption of the vehicle during the UDDS
and HWEFT by the weighting factors of 55% to 45%. Note that the different type of energy, i.e. gasoline, E85
and relates to the environmental impact of resource depletion ;
Criteria Emissions (g km-1) - this metric score vehicles on upstream and downstream emissions (or tailpipe
emission) of three EPA criteria pollutants: total hydrocarbons (THC, similar to non-methane organic gases),
carbon monoxide (CO), and nitrogen oxides (NOX). The upstream criteria emissions (UCE) will use the UCE
factor from EcoCAR3 (Appendix N, Table 22), which is based on GREET 2020 model estimates for fuel
production. The downstream emission will use the simulation results of tailpipe emission from UDDS and
HWEFT drive cycle. An emission factor (EF) of electricity is developed based on the mix of electrical supply in
Ontario [69] and the “GREET” model [67] published by Argonne National Laboratory. The equations to
calculate the well-to-wheel emission are refer to Eq. 17& 18 (section 2.8.5). This criteria item is directly related
to urban air pollution which has significant impact on human health;
WTW GHG (g GHG km-1) – this metric refers to Well to Wheel analysis method to evaluate the greenhouse gas
(GHG) emissions. The emission factor of different fuels can be viewed in Appendix N, Table 23); The criteria
is related to the issue of the enhances greenhouse effect and thus climate change;
Energy system technology readiness - this metric based on the available literatures and market data. A lower
score is assigned to the metal-air battery due to its immature technology in automotive applications. It is a
subjective judgement. This criteria item relate the potential for actual commercialization in the near term ;
Whole Vehicle Technology –Same as the previous metric and relates to practical commercialization;
Drive Quality- this metric is based on the performance test result, which includes IVM-60 mph and 50-70 mph
acceleration, and the grade ability test and relates to consumer acceptability ;
Total Range (km)-this metric based on the simulation results of each powertrain depleting all the energy source.
For example, MA-EREV will consume Li-ion battery from 90% to 20% SOC, and zinc-air battery from 90% to
10% SOC, which relates to consumer acceptability - performance;
Consumer Acceptability- this metric is determined by the author and the UWFAT team’s experience, it is a
subjective judgement. The criteria items is intended to capture overall consumer acceptability, including
technology awareness and perception, safety, noise, refueling convenience.
Vehicle Cost - this metric based on the cost estimation in Section 5.4;
Life Cycle Cost of Fuel or Electricity- this metric based on the cost estimation in Section 5.4.
From the results shown in Table 20, metal-air battery extended range electric vehicle has the highest value in the
total score and thus the most desirable powertrain. It performs well in the performance, emission, and efficiency
metrics due to the sizing of the components and its ability to switch between charge sustaining and charge depleting
modes. From an objective point of view, however, the mass implementation of MA-EREVs in the vehicle industry
still needs technological improvements and expansion of infrastructure. FC-EREV places second followed by BEV,
Engine-EREV, and then baseline vehicle. Though the MA-EREV and FC-EREV did well in the initial score, they
added risk by utilizing advanced technology in the powertrain. Note that this analysis does not include other
benefits of the ‘hydrogen economy’ such as allowing for energy storage, auxiliary services, long range energy

65
transportation. This analysis does not account for the potential for vehicle to grid (V2G) services from electric
vehicles.
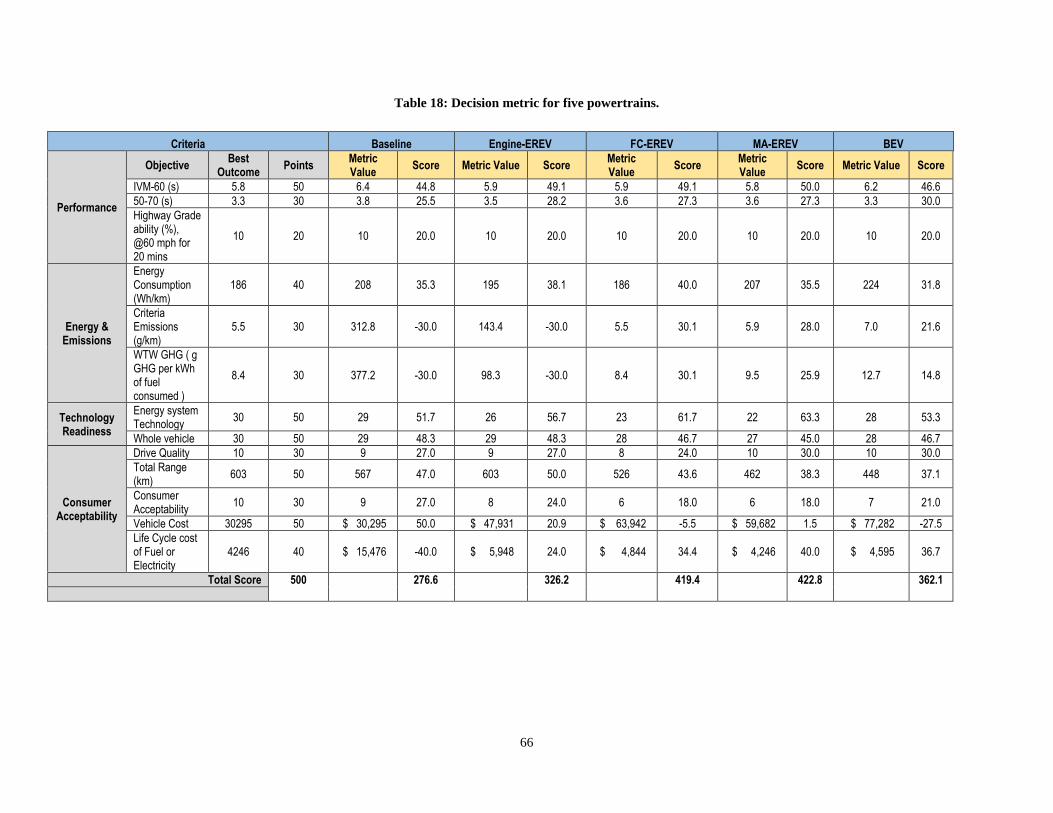
66
Table 18: Decision metric for five powertrains.
Criteria Baseline Engine-EREV FC-EREV MA-EREV BEV
Performance
Objective Best
Outcome Points
Metric Value
Score Metric Value Score Metric Value
Score Metric Value
Score Metric Value Score
IVM-60 (s) 5.8 50 6.4 44.8 5.9 49.1 5.9 49.1 5.8 50.0 6.2 46.6
50-70 (s) 3.3 30 3.8 25.5 3.5 28.2 3.6 27.3 3.6 27.3 3.3 30.0
Highway Grade ability (%), @60 mph for 20 mins
10 20 10 20.0 10 20.0 10 20.0 10 20.0 10 20.0
Energy & Emissions
Energy Consumption (Wh/km)
186 40 208 35.3 195 38.1 186 40.0 207 35.5 224 31.8
Criteria Emissions (g/km)
5.5 30 312.8 -30.0 143.4 -30.0 5.5 30.1 5.9 28.0 7.0 21.6
WTW GHG ( g GHG per kWh of fuel consumed )
8.4 30 377.2 -30.0 98.3 -30.0 8.4 30.1 9.5 25.9 12.7 14.8
Technology Readiness
Energy system Technology
30 50 29 51.7 26 56.7 23 61.7 22 63.3 28 53.3
Whole vehicle 30 50 29 48.3 29 48.3 28 46.7 27 45.0 28 46.7
Consumer Acceptability
Drive Quality 10 30 9 27.0 9 27.0 8 24.0 10 30.0 10 30.0
Total Range (km)
603 50 567 47.0 603 50.0 526 43.6 462 38.3 448 37.1
Consumer Acceptability
10 30 9 27.0 8 24.0 6 18.0 6 18.0 7 21.0
Vehicle Cost 30295 50 $ 30,295 50.0 $ 47,931 20.9 $ 63,942 -5.5 $ 59,682 1.5 $ 77,282 -27.5
Life Cycle cost of Fuel or Electricity
4246 40 $ 15,476 -40.0 $ 5,948 24.0 $ 4,844 34.4 $ 4,246 40.0 $ 4,595 36.7
Total Score 500 276.6 326.2 419.4 422.8 362.1
67
6. Conclusions
The purpose of this thesis was to design range extended electric vehicle powertrains with the most advanced
technology of energy system, metal-air battery and fuel cell, and then compare these powertrains with other
potential powertrains in the market. To achieve this goal, five vehicle powertrains were modeled in Autonomie
Rev14 software: Baseline 2015 internal combustion engine Camaro (ICE), Engine-EREV, FC-EREV, MA-EREV,
and BEV. The process of developing this project was completed in seven independent processes:
1) determining the target of the powertrain;
2) sizing and selecting the components;
3) collecting components data from UWAFT suppliers and other research groups;
4) developing vehicle architecture model vehicle sub-system model characterization;
5) importing models to software: Matlab & Simulink and Autonomie;
6) simulation with performance testing and drive cycles; and,
7) semi-quantitative decision metrics and compare powertrains.
The stepwise of designing vehicle powertrain and control logic, developing metal-air battery model and five
different vehicle powertrains, and all the key Matlab script files, models were presented in Appendix C to K. It is
worth to highlight that a unique set of dual energy storage system controls logic and metal-air battery model were
developed based on the Simulink and Autonomie software.
After finished all the Simulations, analyses, and metric score calculation, the following conclusions were found:
All powertrains have been designed and are able to achieve operational performance targets such as
acceleration;
The powertrains based on pure battery, i.e. metal air range extender and solely Li-ion battery are not able to
achieve the total range target due to the weight of the battery pack;
For the extended range powertrain, it is demonstrated that the total range of the same powertrain is longer
when starting the range extender at higher lithium-ion battery SOC threshold (see Table 16 and Figure 49),
likely because of the combined energy consumption of two energy source is lower than the operation mode
that only one energy source outputs the power to the vehicle;
Both Fuel Cell and battery power trains have zero tailpipe emissions and smaller criteria emission (<8 g/km)
which will result in significant benefits to urban air quality and ultimately society health outcomes;
Both Fuel Cell and battery powertrains have lower greenhouse gas emissions which will have positive
impact of the climate change;
Battery size for the BEV results in loss of passenger capacity which will severely impact consumer
acceptability;
Internal combustion engine vehicle has the competitive cost advantage for the vehicle purchase cost,
however when considering the lifecycle usage of the vehicle, ICE-EREV, FC-EREV, MA-EREV and BEV
show great potential in the fuel/electricity cost.

68
Although the conventional ICE vehicle has the advantages of low purchase cost and mature technology,
other powertrains present great potential considering the metrics of the vehicle life cycle cost and emission
control.
Based on this decision metric, the metal air range extender (MA-REEV) gets the highest marks compared
to other powertrains. However, metal-air battery is a new technology and there are not yet any prototypes
of the technology, thus full commercialization is expected to take some time.

69
7. Recommendations
The two most valuable contributions of this work is the comparison of different powertrains using the simulation
software and decision metric, and the development of metal-air extended range electric vehicle. The following
recommendations were suggested with reference to future researchers or innovators who wish to continue this work.
Additional research should be performed in terms of validating and expanding the metal-air battery model, and
implementing more advanced powertrain control logic into the Autonomie workspace.
Validating and expanding the metal-air battery model (and associated pack model) is the first place to start as there
are zero modifications to the current source model required. Although this work did not analyze possible simulations
of the zinc-air battery with different states of charge and temperatures, it already built the model in Simulink. Thus,
it would be wise to simulate the metal-air battery under different operating conditions when further battery data is
accessible to validate the metal-air battery model. It would also be interesting to modify the Matlab script to
simulate other metal-air battery chemistry technologies, such as the aluminum-air battery.
For the whole vehicle level, the unique vehicle architecture of the dual energy storage system is an innovative
design, which is worth to further research. This project completed the model architecture and the basic control
strategy. However, the more advanced control strategies are not achieved in this work due to the time limitation.
Refinement of the control strategy will not only benefit the efficiency of the powertrain system but also bring more
accurate prediction of the performance and total range under different operation modes (CD and CS). The
refinement should start from the research about the power output from metal-air battery and the metal-air battery
cut-in threshold. The former one is related to the metal-air battery power output capability and the power
requirement from the load. The latter one is associate with the percentage decision of using the metal-air battery and
the li-ion battery in vehicle driving mode.
Lastly a recommendation that are related to, but tangential, to this work is how the power output from the range
extender (engine, fuel cell, or metal-air battery) affects the cycle life and calendar life of the lithium-ion battery. It is
well known that the less use of li-ion battery and avoiding it from large power discharging will extend its cycle life.
However, the influence to li-ion battery life by using an onboard charging system, i.e. fuel cell or metal-air battery,
to continue charge and discharge the li-ion battery when the vehicle is running is uncertain. Therefore it would be an
interesting topic to control these two energy systems to work efficiently in the vehicle and extend their calendar life.
70
8. References
[1] National Highway Traffic Safety Administration, «CAFE - Fuel Economy,» National Highway Traffic Safety
Administration, 2015. [En ligne]. Available: http://www.nhtsa.gov/fuel-economy/. [Accès le 27 April 2015].
[2] T. E. Harpster, M. O. Harpster et P. J. Savagian, «The Electrification of the Automobile: From Conventional
Hybrid, to Plug-in Hybrids, to Extended-Range Electric Vehicles,» SAE International, vol. 1, n° %11, pp. 156-
160, 2008.
[3] A. G. Boulanger, C. A. Chu, S. Maxx et D. L. Waltz, «Vehicle Electrification: Status and Issues,» Proceedings
of the IEEE, vol. 39, n° %16, pp. 1116-1138, 2011.
[4] M. Ehsani, Y. Gao et A. Emadi, Modern Electric, hybrid Electric, and Fuel Cell Vehicles: Fundamentals,
Theory, and Design, Second Edition, Boca Raton: CRC Press, 2009.
[5] Electric Vehicles Initiative (EVI) , «Global EV Outlook 2015,» The Clean Energy Ministerial’s Electric
Vehicles Initiative (EVI) , Chicago, 2015.
[6] Tesla Motors, «Model S,» Tesla Motors, 1 Augest 2015. [En ligne]. Available:
http://www.teslamotors.com/en_CA/models. [Accès le 26 Augest 2015].
[7] TRUECar, «2015 Tesla Model S Price Report,» TRUECar, 2 Sep. 2015. [En ligne]. Available:
https://www.truecar.com/prices-new/tesla/model-s-pricing/2015/CD13B16B/?trimOptionIds=8-C-U,7-C-U,36-
C-U&exteriorColorId=1309442&interiorColorId=1308349&incentiveIds=&trimId=294094&zipcode=94305.
[Accès le 2 Sep. 2015].
[8] H. Ng, A. Vyas et D. Santini, «The Prospects for Hybrid Electric Vehicles, 2005-2020: Results of a Delphi
Study,» SAE International, Costa Mesa, 1999.
[9] C. Whaling, «Electric drive power electronics: an overview,» IEEE Transportantion Electrification, 2 Dec
2013. [En ligne]. Available: http://electricvehicle.ieee.org/2013/12/02/electric-drive-power-electronics-an-
overview/. [Accès le 16 Nov 2014].
[10] U. E. Eberle et R. V. Helmolt, «Sustainable transportation based on electric vehicle concepts: a brief
overview,» Energy & Environmental Science, vol. 3, n° %16, pp. 689-699, 2010.
[11] S. Ben, «Range Anxiety,» The New York Times, New York, 2010.
[12] BioAge Group, LLC., «SAE International releases new fast-charging combo coupler standard (SAE J1772) for
plug-in electric and electric vehicles,» BioAge Group, LLC., 12 October 2012. [En ligne]. Available:
71
http://www.greencarcongress.com/2012/10/j1772-20121015.html. [Accès le 29 October 2014].
[13] Honda, «The Honda Hybrid System,» [En ligne]. Available: http://world.honda.com/automobile-
technology/IMA/. [Accès le 17 Nov. 2015].
[14] I. Breakthrough Technologies Institute, «2013 Fuel Cell Technologies,» U.S. Department of Energy,
Washington, D.C., 2014.
[15] Pacific Northwest National Laboratory, «Pathways to Commercial Success,» U.S. Department of Energy,
Washington, D.C., 2015.
[16] Toyota, «fuelccell_vehicle,» Toyota Motor Corporation, 3 7 2015. [En ligne]. Available: http://www.toyota-
global.com/innovation/environmental_technology/fuelcell_vehicle/. [Accès le 3 7 2015].
[17] Toyota, «Toyota Innovation: Hydrogen fuel cell vehicle-Mirai,» Toyota, [En ligne]. Available:
http://www.toyota-global.com/innovation/environmental_technology/fuelcell_vehicle/. [Accès le 15 Jan 2016].
[18] U.S. Department of Energy, «Fuel cell vehicle challenges,» U.S. Department of Energy, 3 July 2015. [En
ligne]. Available: https://www.fueleconomy.gov/feg/fcv_challenges.shtml. [Accès le 4 July 2015].
[19] D. J. Durbin et C. Malardier-Jugroot, «Review of hydrogen storage techniques for on board vehicle
applications,» International Journal of Hydrogen , vol. 38, n° %134, pp. 14595-14617, 2013.
[20] S. Erman et R. Wool, «Hydrogen storage on pyrolyzed chicken feather fibers,» International journal of
hydrogen energy, vol. 36, n° %112, pp. 7122-7127, 2011.
[21] S. Louis et A. Zuttel, «Hydrogen-storage materials for mobile applications,» Nature, vol. 414, n° %16861, pp.
353-358, 2001.
[22] S. Luntz, «New metal-air battery drives car 1800 km without recharge,» IFL Science, 9 June 2014. [En ligne].
Available: http://www.iflscience.com/technology/new-metal-air-battery-drives-car-1800km-without-recharge.
[Accès le 16 Aug 2015].
[23] D. U. Lee, H. W. Park, M. G. Park, V. Ismayilov et Z. Chen, «Synergistic Bifunctional Catalyst Design based
on Perovskite Oxide Nanoparticles and Intertwined Carbon Nanotubes for Rechargeable Zinc−Air Battery
Applications,» ACS applied materials & interfaces, vol. 7, n° %11, pp. 902-910, 2014.
[24] CNW Group, «Alcoa and Phinergy Debut Electric Car With Aluminum-Air Battery at Circuit Gilles-
Villeneuve,» CNW Group, 2 Jan. 2014. [En ligne]. Available: Alcoa and Phinergy Debut Electric Car With
Aluminum-Air Battery at Circuit Gilles-Villeneuve. [Accès le 4 Mar. 2016].
[25] S. G. Stewart, K. R. Kohn et . J. B. Straubel, «ELECTRIC VEHICLE EXTENDED RANGE HYBRID
BATTERY PACK SYSTEM». United States Brevet US 8,471,521 B2, 8 December 2010.
72
[26] EcoCAR3, «EC3 Y1 FW Hybrid 101,» EcoCAR3, Columbus, 2014.
[27] I. Husain, Electric and hybrid vehicles design fundamentals, Boca Raton: CRC Press, 2010.
[28] Wikipedia, «Andreas Flocken,» Wikipedia, 1 Sept. 2015. [En ligne]. Available:
https://de.wikipedia.org/wiki/Andreas_Flocken. [Accès le 2 Sept. 2015].
[29] J.-S. Lee, T. k. Sun, R. Cao, M. Liu, L. Kyu Tae et J. Cho, «Metal-air batteries with hig energy density: Li-air
versus Zn-air,» Advanced Energy Materials, vol. 1, n° %11, pp. 34-50, 2011.
[30] J.-M. Tarascon et M. Armand, «Issues and challenges facing rechargeable lithium batteries,» Nature,
n° %1414, pp. 359-367, 2001.
[31] «Lithium Ion Batteries for Consumer Electric Vehicles Will Surpass $24 Billion in Annual Revenue by 2023,»
Navigant Research , 22 Jul. 2014. [En ligne]. Available: http://www.navigantresearch.com/newsroom/lithium-
ion-batteries-for-consumer-electric-vehicles-will-surpass-24-billion-in-annual-revenue-by-2023. [Accès le 2
Sep. 2015].
[32] D. Linden et T. Reddy, Handbook of Batteries, Third Edition éd., New York: McGraw-Hill, 2001.
[33] J. Tarascon et M. Armand, «Issues and challenges facing rechargeable lithium batteries,» Nature, vol. 414, pp.
359-367, 2001.
[34] A. Miller, «Technical Service Bulletin - Battery Handling Guidelines,» A123 Systems, Waltham, 2013.
[35] L. Lu, «A review on the key issues for lithium-ion battery management in electric vehicle,» Elsevier.
[36] «How fuel cells work,» US Department of Energy, 3 7 2015. [En ligne]. Available:
https://www.fueleconomy.gov/feg/fcv_PEM.shtml. [Accès le 3 7 2015].
[37] M. Armand et M. Taracon, «Building better batteries,» Nature, vol. 451, n° %17179, pp. 652-657, 2008.
[38] Y. Li et H. Dai, «Recent advances in zinc-air batteries,» Chemical Society Reviews, vol. 43, n° %115, pp. 5257-
5275, 2014.
[39] D. Linden et T. B. Reddy, Handbook of batteries (Third Edition), New York: McGraw-Hill, 2001.
[40] Lawerence Livemore National Labortory, «Powering future vehicles with the refuelable zinc/air battery,»
Lawerence Livemore National Labortory, 1995.
[41] J. Vatsalarani, D. C. Trivedi, K. Ragavendran et P. C. Warrier, «Effect of Polyaniline Coating on “Shape
Change” Phenomenon of Porous Zinc Electrode,» ECS, vol. 152, n° %110, pp. A1974-A1978, 2005.
[42] Y. Li, M. Gong, Y. Liang, J. Feng, J.-E. Kim, H. Wang, G. Hong, B. Zhang et D. Hongjie, «Advanced zinc-air
batteries based on high-performance hybrid electrocatalysts,» Nature Communications, vol. 4, n° %11805, p. 4,
73
2013.
[43] Y. Lei, F. Chen, Y. Jin et Z. Liu, «Ag-Cu nanoalloyed film as a high-performance cathode electrocatalytic
material for zinc-air battery,» Nanoscale research letters, vol. 10, n° %11, pp. 1-8, 2015.
[44] C. J. Murray, «Automakers Opting for Model-Based Design,» Design News, 5 11 2010.
[45] A. Seaman, T.-S. Dao et J. McPhee, «A Survey of Mathematics-Based Equivalent-Circuit and Electrochemical
Battery Models for Hybrid and Electric Vehicle Simulation,» Journal of Power Sources, vol. 256, pp. 410-423,
2014.
[46] H. He, R. Xiong, H. Guo et S. Li, «Comparison study on the battery models used for the energy management of
batteries in electrtic vehicles,» Energy Conversion and Management, vol. 64, pp. 112-121, 2012.
[47] W. Scott, «Impact of high fidelity battery models for vehicle applications,» University of waterloo, Waterloo,
2015.
[48] Department of Energy Vehicle Technologies Program, «Battery Test Manual For Plug-In Hybrid Electric
Vehicles,» The Idaho National Laboratory is a U.S. Department of Energy National Laboratory, Idaho
Operations Office, 2008.
[49] S. S. Zhang, K. Xu et T. R. Jow, «Electrochemical impedance study on the low temperature of Li-ion
batteries,» Electrochemica, vol. 49, pp. 1057-1061, 2004.
[50] C. Spiegel, PEM fuel cell modelling and simulation using matlab, Burlington, MA, USA: Elsevier Inc., 2008.
[51] Argonne National Labroatory, «Powertrain system analysis toolkit (PSAT)-Part 2 Commments,» Argonne
National Labroatory, Lemont, 2009.
[52] M. Mehta, G. Mixon, P. J. Zheng et P. Andrei, «Analytical Electrochemical Impedance Modeling of Li-Air
Batteres undder D.C. Discharge,» Journal of The Electrochemical Society, vol. 160, n° %111, pp. A2033-2045,
2013.
[53] D. U. Lee, J.-Y. Choi, K. Feng, H. W. Park et Z. Chen, «Advanced Extremely Durable 3D Bifunctional Air
Electrodes for Rechargeable Zinc-Air Batteries,» Advvanced Energy Materials, vol. 4, n° %16, pp. 1-5, 2014.
[54] N. Shidore, «PHEV ‘All electric range’ and fuel economy in charge sustaining mode for low SOC operation of
the JCS VL41M Li-ion battery using battery HIL,» Proceeding of the electric vehicle symposium, vol. 23, pp.
2-5, 2007.
[55] G. M. Bhutto, B. Bak-Jensen et P. Mahat, «Modeling of the GIGRE low Voltage test distribution network and
the development of appropriate controllers,» International Journal of Smart Grid and Clean Eenrgy, pp. 184-
191, 2012.
74
[56] J. Smart et S. Schey, «Battery Electric Vehicle Driving and Charging Behavior,» SAE International, vol. 1,
n° %11, pp. 27-33, 2012.
[57] I. Husain, Electric and Hybrid Vehicles Design Fundamentals, Boca Raton: Taylor and Francis Group, LLC,
2011.
[58] C. Hou, H. Wang et M. Ouyang, «Battery sizing for plug-in hybrid electric vehicles in Beijing: A TCO Model
Based Analysis,» Energies, vol. 7, n° %18, pp. 5374-5399, 2014.
[59] M. I. Berry, «The effects of driving style and vehicle performance on the real-world fuel consumption of U.S.
light-duty vehicles.,» Massachusetts Institute of Technology, Cambridge, MA, 2010.
[60] D. Vanderwerp, «The Truth About EPA City / Highway MPG Estimates,» Car and Driver, 1 August 2009. [En
ligne]. Available: http://www.caranddriver.com/features/the-truth-about-epa-city-highway-mpg-estimates.
[Accès le 18 July 2015].
[61] United States Environmental Protection Agency, «Dynamometer Drive Schedules,» United States
Environmental Protection Agency, 3 Jan. 2016. [En ligne]. Available:
http://www3.epa.gov/nvfel/testing/dynamometer.htm. [Accès le 2 Feb. 2016].
[62] United States Environmental Protection Agency, «New Fuel Economy and Environment labels for a New
Generation of Vehicles,» United States Environmental Protection Agency, May 2011. [En ligne]. Available:
http://epa.gov/carlabel/documents/420f11017a.pdf. [Accès le 18 July 2015].
[63] SAE International, «Recommended Practice for Measuring the Exhaust Emissions and Fuel Economy of
Hybrid-Electric Vehicles, Including Plug-in Hybrid Vehicles,» Society of Automotive Engineers, p. 63, 2010.
[64] SAE International, «Utility Factor Definitions for Plug-In Hybrid Electric Vehicles Using 2001 U.S. DOT
National Household Travel Survey Data,» Socity of Automotive Engineering , p. 15, 2009.
[65] T. H. Bradley et C. W. Quinn, «Analysis of plug-in hybrid electric vehicle utility factors,» Elsevier, vol. 195,
n° %116, pp. 5399-5408, 2010.
[66] Argonne NatIONAL Laboratory, «EcoCAR 3: Non-year-specific rules,» U.S. Department of Energy and
General Motors Advanced Vehicle Technology Competition, Chicago, 2015.
[67] Argonne National Laboratory, «"GREET," Model 2015,» Argonne National Laboratory, [En ligne]. Available:
https://greet.es.anl.gov/. [Accès le 12 Feb. 2016].
[68] Fuel CELL E-mobility, «Well-to-Wheel - Integral Efficiency Analysis,» Fuel CELL E-mobility, Dec 2013. [En
ligne]. Available: http://www.fuel-cell-e-mobility.com/h2-infrastructure/well-to-wheel-en/. [Accès le 18 July
2015].
75
[69] «Energy output by fuel type in Ontario,» The Independent Electricity System Operator (IESO), [En ligne].
Available: https://ieso-public.sharepoint.com/Pages/Power-Data/Supply.aspx. [Accès le 12 Feb. 2016].
[70] P. C. Blumenfeld, E. Soloway, R. W. Marx et J. S. Krajcik, «Motivating Project-Based Learning: Sustaining
the Doing, Supporting the Learning,» Educational Psychologist, vol. 26, n° %13-4, pp. 369-398, 2011.
[71] Solar Journey USA, «3200 miles, powered by the Sun,» Solar Journey USA, [En ligne]. Available:
http://www.solarjourneyusa.com/EVdistanceAnalysis7.php. [Accès le 20 Jan 2016].
[72] «Fuel cell and lithium iron phosphate battery hybrid powertrain with an ultracapacitor bank using direct parallel
structure,» Journal of Power Sources, vol. 279, pp. 487-494, 2015.
[73] 2015 General Motors, «2015 Camaro Models & Specs,» General Motors, 5 Sep. 2015. [En ligne]. Available:
http://www.chevrolet.com/camaro-sports-car/specs/trims.html. [Accès le 3 Sep. 2015].
[74] Michelin North America,Inc, «Michelin tires,» Michelin North America,Inc, 6 Sep. 2015. [En ligne].
Available: http://www.michelinman.com/US/en/tires._ts-vehicle.html. [Accès le 6 Sep. 2015].
[75] National Academy of Sciences, «Passenger Tire Rolling Resistance Measurements Made Available by Three
Tire Companies, September 2005 (referred to as RMA data in report),» National Academy of Sciences,
Washington, 2005.
[76] G. Wager, M. P. McHenry, J. Whale et T. Braunl, «Testing energy efficiency and driving range of electric
vehicles in relation to gear selection,» Renewable Energy, vol. 62, pp. 303 - 312, 2014.
[77] Ontario GasBuddy, «Ontario gas prices,» Ontario GasBuddy, 1 Mar. 2016. [En ligne]. Available:
http://www.ontariogasprices.com/. [Accès le 1 Mar. 2016].
[78] CBC News, «Ontario sees hydro rates jump — again,» CBC News, 11 Nov. 2015. [En ligne]. Available:
http://www.cbc.ca/news/canada/toronto/ontario-hydro-rate-increase-1.3298396. [Accès le 17 Jan. 2016].
[79] U.S. Department of Energy, «DOE Fuel Cell Technologies Office Record,» U.S. Department of Energy, 2014.
[80] U.S. Department of Energy, «2013 Fuel Cell Technologies Market Report,» Breakthrough Technologies,
Washington, D.C., 2014.
[81] U.S. Department of Energy, «Pathways to commercial Success,» Breakthrough Technologies, Washington,
D.C., 2015.
[82] U.S. Department of Energy , «Plug-in hybrid electric vehicles-learn more about the new label,» U.S.
Department of Energy , 29 July 2015. [En ligne]. Available: http://www.fueleconomy.gov/feg/label/learn-
more-PHEV-label.shtml. [Accès le 29 July 2015].
76
[83] Argonne NatIONAL Laboratory, «EcoCAR3: Non-year-specific rules,» U.S. Department of Energy and
General Motors Advanced Vehicle Technology Competition, Chicago, 2015.
[84] S. C. Davis, S. W. Diegel et R. G. Boundy, «Transportation Energy Data Book - Edition 33,» Oak Ridge
National Laboratory, Oak Ridge, 2014.
[85] S. Luntz, «New Metal-Air Battery Drives Car 1800Km Without Recharge,» IFL SCIENCE, 6 June 2014. [En
ligne]. Available: http://www.iflscience.com/technology/new-metal-air-battery-drives-car-1800km-without-
recharge. [Accès le 7 July 2015].
[86] China Central Television (CCTV.com), «Beijing to use electric vehicles for public transport and sanitation,»
China Central Television (CCTV.com), 9 March 2010. [En ligne]. Available:
http://www.cctv.com/english/special/news/20100309/103325.shtml. [Accès le 6 July 2015].
[87] A. a. P. R. Wiederer, "Policy options for electric vehicle charging infrastructure in c40 cities," 2010.
[88] J. Vatsalarani, D. C. Trivedi, K. Ragavendran et P. C. Warrier, «Effect of Polyaniline Coating on “Shape
Change” Phenomenon of Porous Zinc Electrode,» ECS, vol. 152, n° %110, pp. A1974-a1978, 2005.
[91] J. Neubauer, A. Brooker et E. Wood, «Sensitivity of plug-in hybrid electric vehicle economics to drive patterns,
electric range, energy management, and charge strategies,» Journal of Power Sciences, vol. 236, pp. 357-364,
2013.
[92] B. Gao, Q. Liang, Y. Xiang, L. Guo et H. Chen, «Gear ratio optimization and shift control of 2-speed I-AMT in
electric vehicle,» Mechanical Systems and Signal Processing, vol. 50, n° %151, pp. 615-631, 2015.
[94] EVmuseum, «EV Museum,» EV Museum, Sept. 2014. [En ligne]. Available:
http://evmuseum.com/EV1_images.html. [Accès le 21 Dec. 2015].
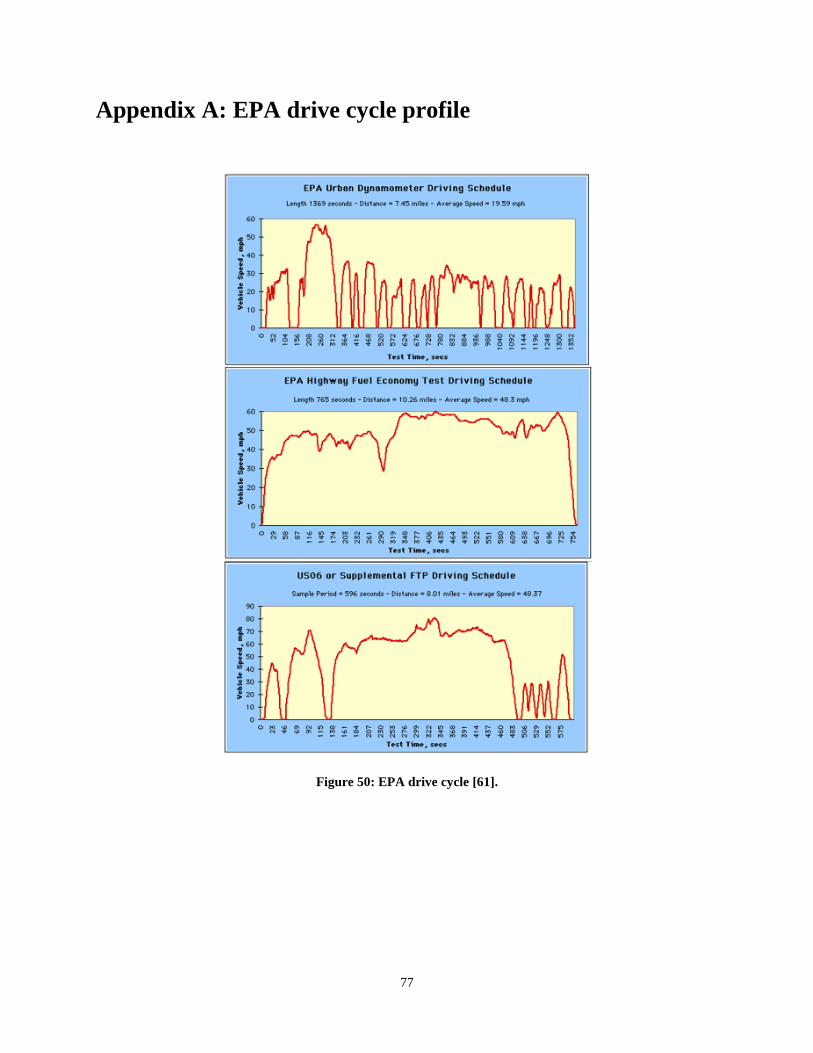
77
Appendix A: EPA drive cycle profile
Figure 50: EPA drive cycle [61].
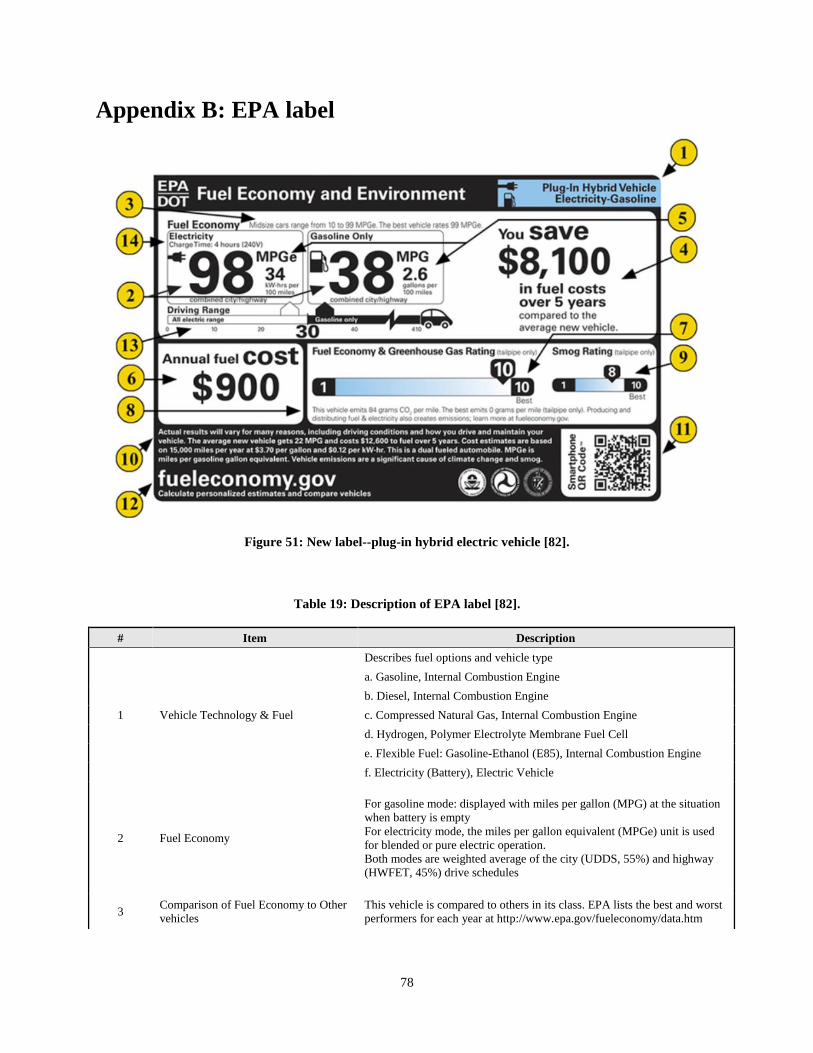
78
Appendix B: EPA label
Figure 51: New label--plug-in hybrid electric vehicle [82].
Table 19: Description of EPA label [82].
# Item Description
1 Vehicle Technology & Fuel
Describes fuel options and vehicle type
a. Gasoline, Internal Combustion Engine
b. Diesel, Internal Combustion Engine
c. Compressed Natural Gas, Internal Combustion Engine
d. Hydrogen, Polymer Electrolyte Membrane Fuel Cell
e. Flexible Fuel: Gasoline-Ethanol (E85), Internal Combustion Engine
f. Electricity (Battery), Electric Vehicle
2 Fuel Economy
For gasoline mode: displayed with miles per gallon (MPG) at the situation
when battery is empty
For electricity mode, the miles per gallon equivalent (MPGe) unit is used
for blended or pure electric operation.
Both modes are weighted average of the city (UDDS, 55%) and highway
(HWFET, 45%) drive schedules
3 Comparison of Fuel Economy to Other
vehicles
This vehicle is compared to others in its class. EPA lists the best and worst
performers for each year at http://www.epa.gov/fueleconomy/data.htm
79
4 Estimated Savings in 5 years
Compared to Avg. new vehicle
Estimated fuel cost savings when compared to the average vehicle of the
same class in that year, calculated on a 15,000 miles/year for 5 years, with
fuel cost at $3.70/gal of gasoline and $0.12/kWh of electricity basis
5 Fuel Consumption Rate
For PHEVs, fuel consumption rates are showed in gasoline and electricity
separately, Fuel efficiency in terms of consumption (gal or kilowatt-hours
per 100 miles) rather than economy (miles per gallon or kilowatt-hours)
6 Estimated Annual Fuel Cost Projected annual fuel cost on a 15,000 miles/year and $3,70/gal of gasoline
and $0.12/kWh of electricity basis
7 Fuel Economy/Greenhouse Gas Rating
Rating for fuel economy from 1 (worst) to 10 (best) and greenhouse gas
emissions (carbon dioxide emitted is directly linked to fuel consumed,
higher fuel economy is correspond to a better GHG emissions)
8 CO2 Emission Information Amount of CO2 emissions (tailpipe only)
9 Smog Rating
Rating for tailpipe emissions related to the pollutants that case smog and
other local air pollution (e.g. nitrogen oxide, carbon monoxide,
formaldehyde, etc.), with a slider bar and a metric of 1 to 10
10 Details in Fine Print Reminder that fuel economy and emission are dependent on driving
conditions and technique
11 QR Code Smartphone integration for additional information of this vehicle and
access to new vehicle
12 Website Link Directs to a website with vehicle comparison information and energy
saving techniques (e.g. local gas prices, driving strategies, etc.)
13 Driving range The number of miles that the vehicle can drive in the combined mode (City
& Highway) after fully charged
14 Charging time Charging time is according to fully charge the battery from empty state by
using 240V electric source (Level 2 charging mode )
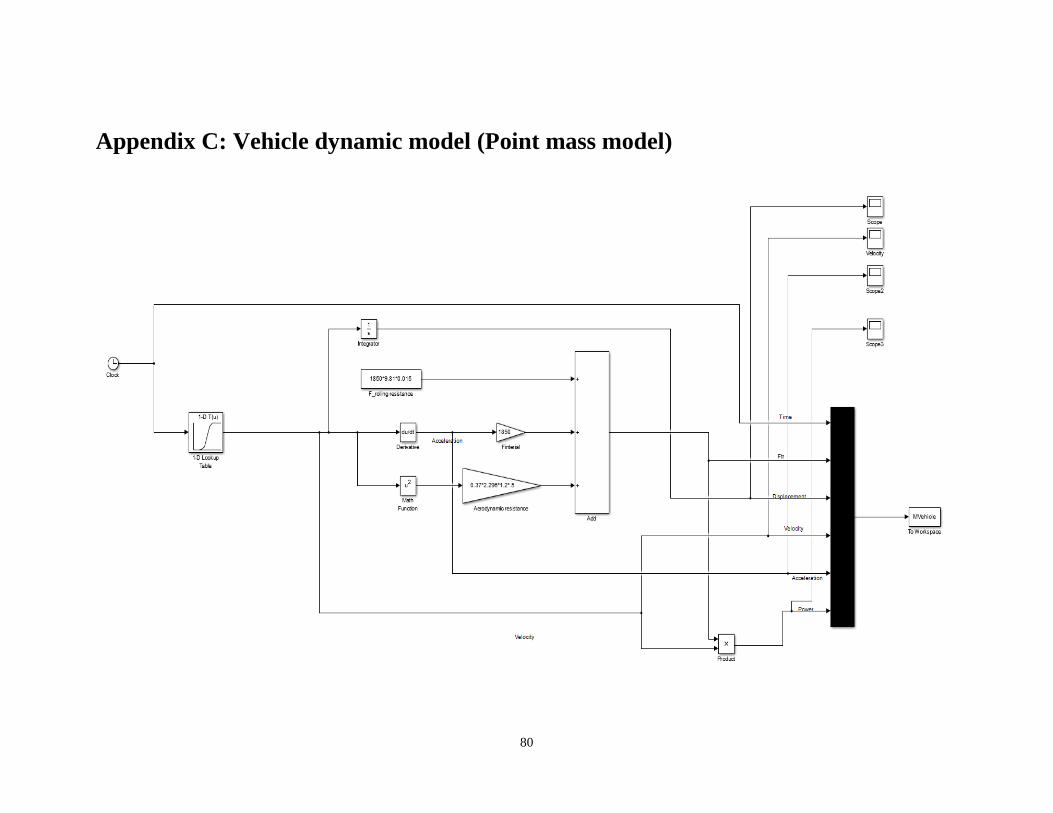
80
Appendix C: Vehicle dynamic model (Point mass model)
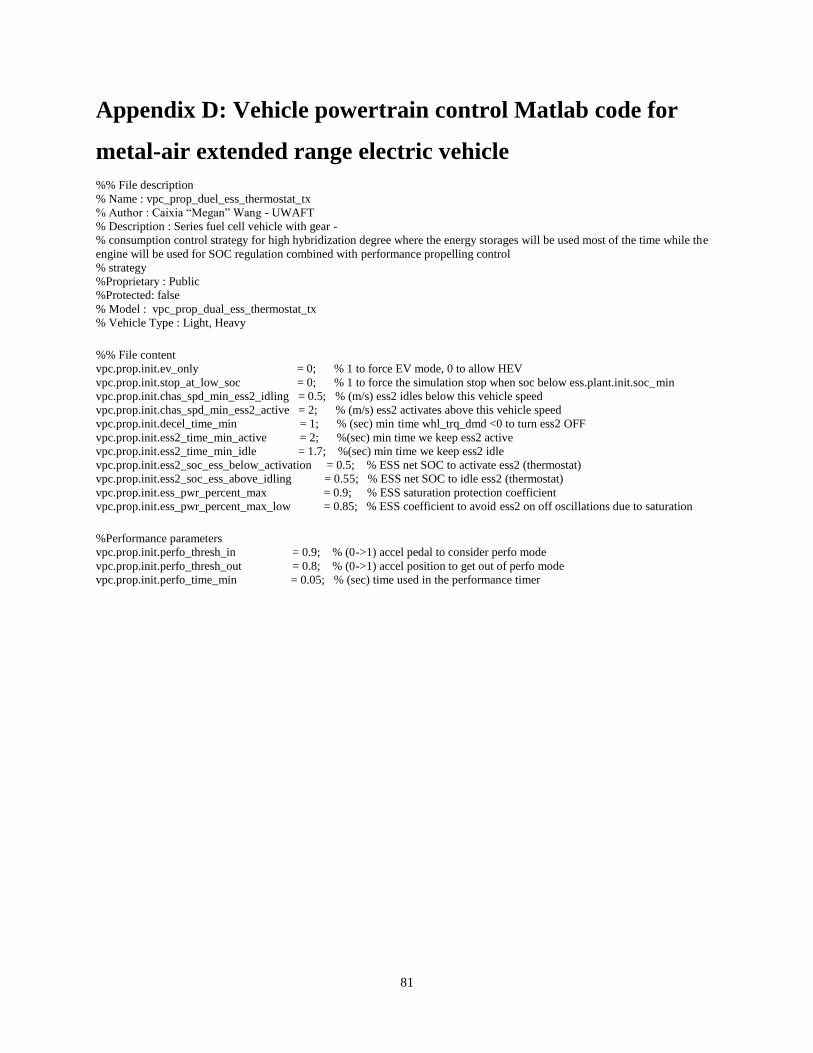
81
Appendix D: Vehicle powertrain control Matlab code for
metal-air extended range electric vehicle
%% File description % Name : vpc_prop_duel_ess_thermostat_tx % Author : Caixia “Megan” Wang - UWAFT % Description : Series fuel cell vehicle with gear - % consumption control strategy for high hybridization degree where the energy storages will be used most of the time while the
engine will be used for SOC regulation combined with performance propelling control % strategy %Proprietary : Public %Protected: false % Model : vpc_prop_dual_ess_thermostat_tx % Vehicle Type : Light, Heavy %% File content vpc.prop.init.ev_only = 0; % 1 to force EV mode, 0 to allow HEV vpc.prop.init.stop_at_low_soc = 0; % 1 to force the simulation stop when soc below ess.plant.init.soc_min vpc.prop.init.chas_spd_min_ess2_idling = 0.5; % (m/s) ess2 idles below this vehicle speed vpc.prop.init.chas_spd_min_ess2_active = 2; % (m/s) ess2 activates above this vehicle speed vpc.prop.init.decel_time_min = 1; % (sec) min time whl_trq_dmd <0 to turn ess2 OFF vpc.prop.init.ess2_time_min_active = 2; %(sec) min time we keep ess2 active vpc.prop.init.ess2_time_min_idle = 1.7; %(sec) min time we keep ess2 idle vpc.prop.init.ess2_soc_ess_below_activation = 0.5; % ESS net SOC to activate ess2 (thermostat) vpc.prop.init.ess2_soc_ess_above_idling = 0.55; % ESS net SOC to idle ess2 (thermostat) vpc.prop.init.ess_pwr_percent_max = 0.9; % ESS saturation protection coefficient vpc.prop.init.ess_pwr_percent_max_low = 0.85; % ESS coefficient to avoid ess2 on off oscillations due to saturation %Performance parameters vpc.prop.init.perfo_thresh_in = 0.9; % (0->1) accel pedal to consider perfo mode vpc.prop.init.perfo_thresh_out = 0.8; % (0->1) accel position to get out of perfo mode vpc.prop.init.perfo_time_min = 0.05; % (sec) time used in the performance timer
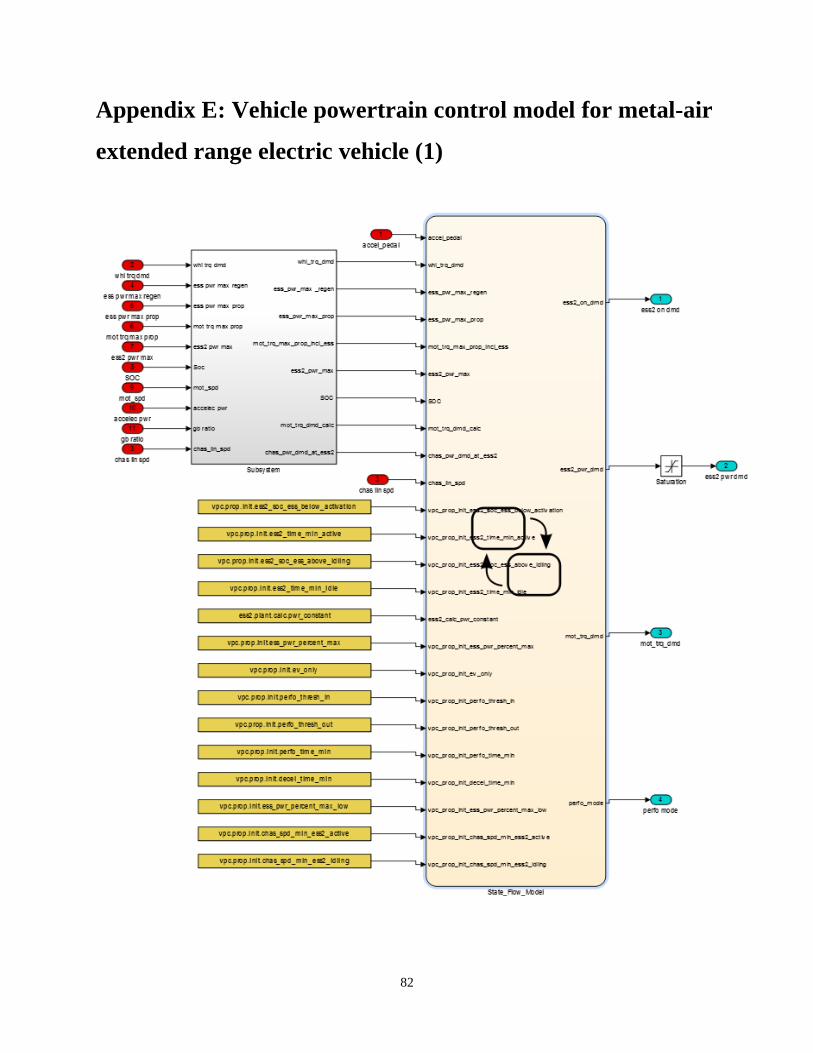
82
Appendix E: Vehicle powertrain control model for metal-air
extended range electric vehicle (1)
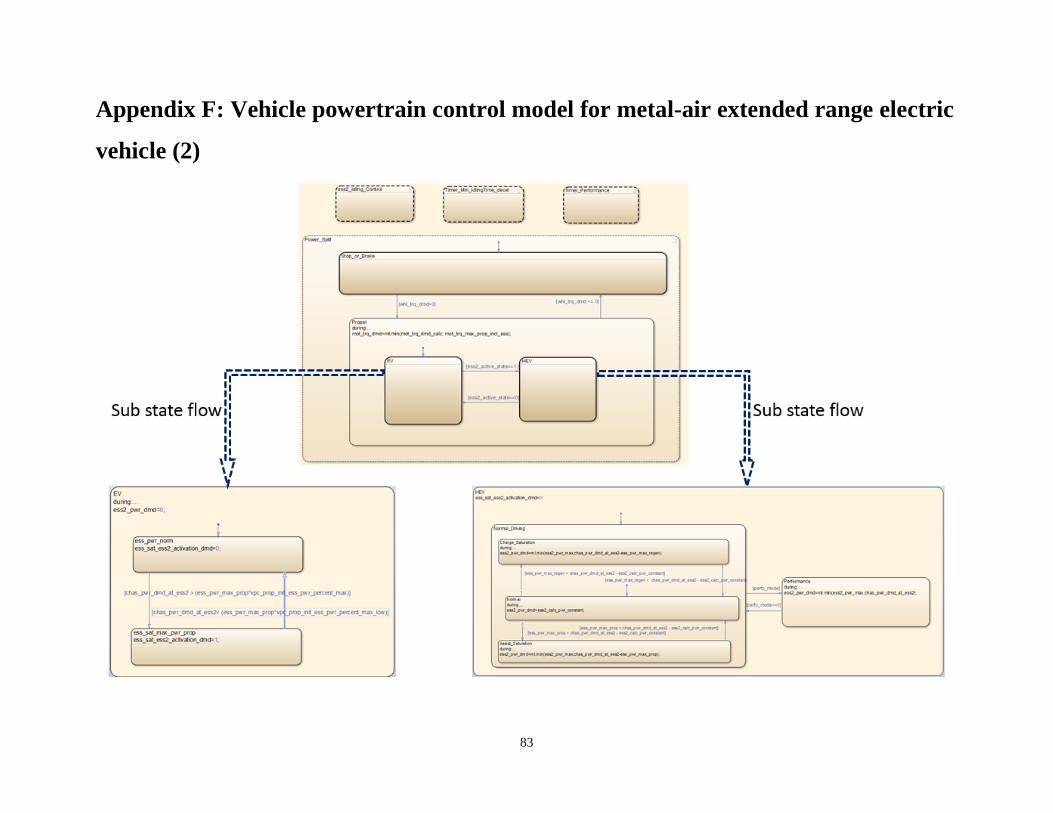
83
Appendix F: Vehicle powertrain control model for metal-air extended range electric
vehicle (2)
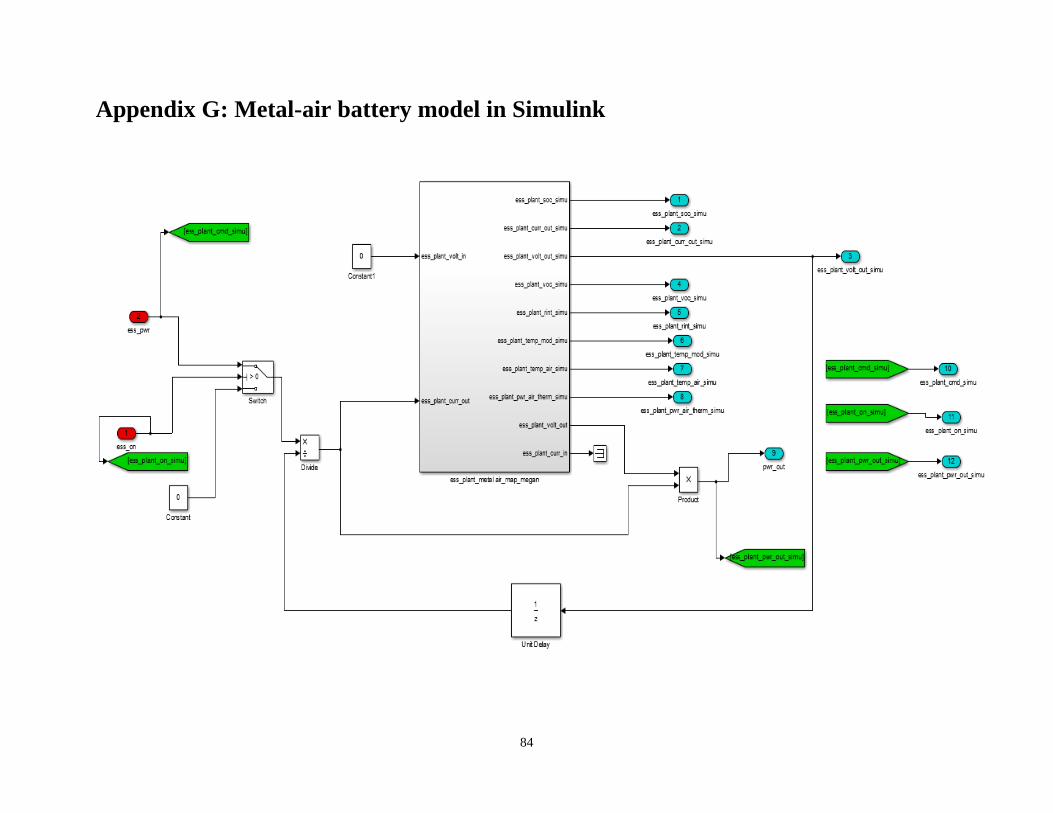
84
Appendix G: Metal-air battery model in Simulink
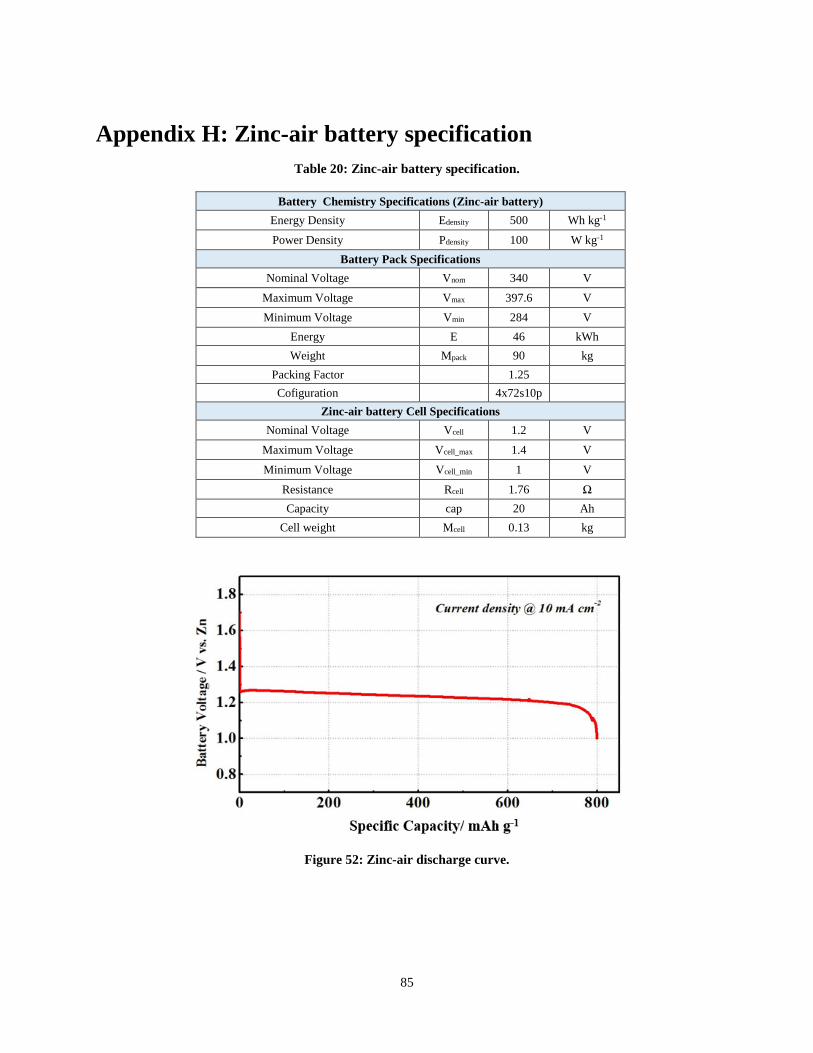
85
Appendix H: Zinc-air battery specification
Table 20: Zinc-air battery specification.
Battery Chemistry Specifications (Zinc-air battery)
Energy Density Edensity 500 Wh kg-1
Power Density Pdensity 100 W kg-1
Battery Pack Specifications
Nominal Voltage Vnom 340 V
Maximum Voltage Vmax 397.6 V
Minimum Voltage Vmin 284 V
Energy E 46 kWh
Weight Mpack 90 kg
Packing Factor
1.25
Cofiguration
4x72s10p
Zinc-air battery Cell Specifications
Nominal Voltage Vcell 1.2 V
Maximum Voltage Vcell_max 1.4 V
Minimum Voltage Vcell_min 1 V
Resistance Rcell 1.76 Ω
Capacity cap 20 Ah
Cell weight Mcell 0.13 kg
Figure 52: Zinc-air discharge curve.
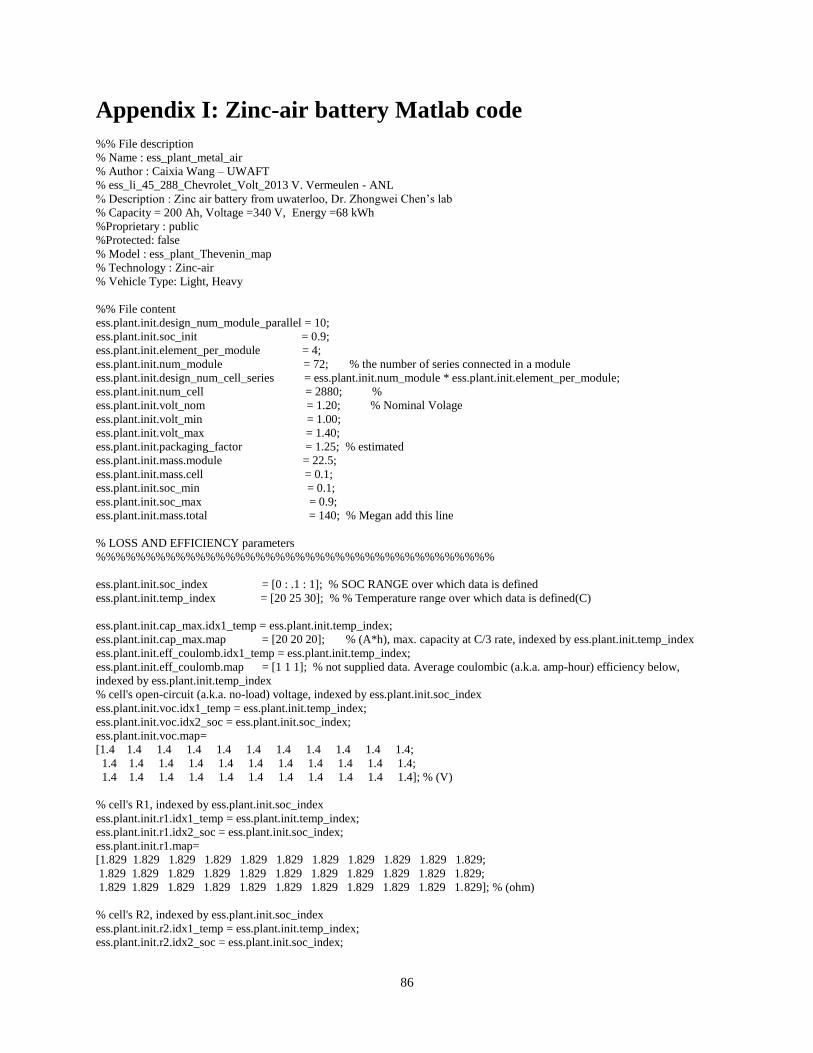
86
Appendix I: Zinc-air battery Matlab code
%% File description
% Name : ess_plant_metal_air
% Author : Caixia Wang – UWAFT
% ess_li_45_288_Chevrolet_Volt_2013 V. Vermeulen - ANL
% Description : Zinc air battery from uwaterloo, Dr. Zhongwei Chen’s lab
% Capacity = 200 Ah, Voltage =340 V, Energy =68 kWh
%Proprietary : public
%Protected: false
% Model : ess_plant_Thevenin_map
% Technology : Zinc-air
% Vehicle Type: Light, Heavy
%% File content
ess.plant.init.design_num_module_parallel = 10;
ess.plant.init.soc_init = 0.9;
ess.plant.init.element_per_module = 4;
ess.plant.init.num_module = 72; % the number of series connected in a module
ess.plant.init.design_num_cell_series = ess.plant.init.num_module * ess.plant.init.element_per_module;
ess.plant.init.num_cell = 2880; %
ess.plant.init.volt_nom = 1.20; % Nominal Volage
ess.plant.init.volt_min = 1.00;
ess.plant.init.volt_max = 1.40;
ess.plant.init.packaging_factor = 1.25; % estimated
ess.plant.init.mass.module = 22.5;
ess.plant.init.mass.cell = 0.1;
ess.plant.init.soc_min = 0.1;
ess.plant.init.soc_max = 0.9;
ess.plant.init.mass.total = 140; % Megan add this line
% LOSS AND EFFICIENCY parameters
%%%%%%%%%%%%%%%%%%%%%%%%%%%%%%%%%%%%%%%%
ess.plant.init.soc_index = [0 : .1 : 1]; % SOC RANGE over which data is defined
ess.plant.init.temp_index = [20 25 30]; % % Temperature range over which data is defined(C)
ess.plant.init.cap_max.idx1_temp = ess.plant.init.temp_index;
ess.plant.init.cap_max.map = [20 20 20]; % (A*h), max. capacity at C/3 rate, indexed by ess.plant.init.temp_index
ess.plant.init.eff_coulomb.idx1_temp = ess.plant.init.temp_index;
ess.plant.init.eff_coulomb.map = [1 1 1]; % not supplied data. Average coulombic (a.k.a. amp-hour) efficiency below,
indexed by ess.plant.init.temp_index
% cell's open-circuit (a.k.a. no-load) voltage, indexed by ess.plant.init.soc_index
ess.plant.init.voc.idx1_temp = ess.plant.init.temp_index;
ess.plant.init.voc.idx2_soc = ess.plant.init.soc_index;
ess.plant.init.voc.map=
[1.4 1.4 1.4 1.4 1.4 1.4 1.4 1.4 1.4 1.4 1.4;
1.4 1.4 1.4 1.4 1.4 1.4 1.4 1.4 1.4 1.4 1.4;
1.4 1.4 1.4 1.4 1.4 1.4 1.4 1.4 1.4 1.4 1.4]; % (V)
% cell's R1, indexed by ess.plant.init.soc_index
ess.plant.init.r1.idx1_temp = ess.plant.init.temp_index;
ess.plant.init.r1.idx2_soc = ess.plant.init.soc_index;
ess.plant.init.r1.map=
[1.829 1.829 1.829 1.829 1.829 1.829 1.829 1.829 1.829 1.829 1.829;
1.829 1.829 1.829 1.829 1.829 1.829 1.829 1.829 1.829 1.829 1.829;
1.829 1.829 1.829 1.829 1.829 1.829 1.829 1.829 1.829 1.829 1.829]; % (ohm)
% cell's R2, indexed by ess.plant.init.soc_index
ess.plant.init.r2.idx1_temp = ess.plant.init.temp_index;
ess.plant.init.r2.idx2_soc = ess.plant.init.soc_index;

87
ess.plant.init.r2.map=
[0.7773 0.7773 0.7773 0.7773 0.7773 0.7773 0.7773 0.7773 0.7773 0.7773 0.7773;
0.7773 0.7773 0.7773 0.7773 0.7773 0.7773 0.7773 0.7773 0.7773 0.7773 0.7773;
0.7773 0.7773 0.7773 0.7773 0.7773 0.7773 0.7773 0.7773 0.7773 0.7773 0.7773];% (ohm)
% cell's C1, indexed by ess.plant.init.soc_index
ess.plant.init.c1.idx1_temp = ess.plant.init.temp_index;
ess.plant.init.c1.idx2_soc = ess.plant.init.soc_index;
ess.plant.init.c1.map=
[1.5923 1.5923 1.5923 1.5923 1.5923 1.5923 1.5923 1.5923 1.5923 1.5923 1.5923;
1.5923 1.5923 1.5923 1.5923 1.5923 1.5923 1.5923 1.5923 1.5923 1.5923 1.5923;
1.5923 1.5923 1.5923 1.5923 1.5923 1.5923 1.5923 1.5923 1.5923 1.5923 1.5923]*1e-3;%(Farads)
%3, 5,
% Max current and power when charging/discharging
ess.plant.init.curr_chg_max = -max((ess.plant.init.volt_max-ess.plant.init.voc.map)./ess.plant.init.r1.map);
ess.plant.init.curr_dis_max = max((ess.plant.init.voc.map-ess.plant.init.volt_min)./ess.plant.init.r1.map);
%check the ess.plant.init.pwr_chg & ess.plant.init.pwr_dis because they're a vector and in the database for the plot we
%need maps
ess.plant.init.pwr_chg.idx1_soc = ess.plant.init.soc_index;
ess.plant.init.pwr_dis.idx1_soc = ess.plant.init.soc_index;
ess.plant.init.pwr_chg.map = -max((ess.plant.init.volt_max-
ess.plant.init.voc.map).*ess.plant.init.volt_max./ess.plant.init.r1.map);%per cell
ess.plant.init.pwr_dis.map = max((ess.plant.init.voc.map-
ess.plant.init.volt_min).*ess.plant.init.volt_min./ess.plant.init.r1.map);%per cell
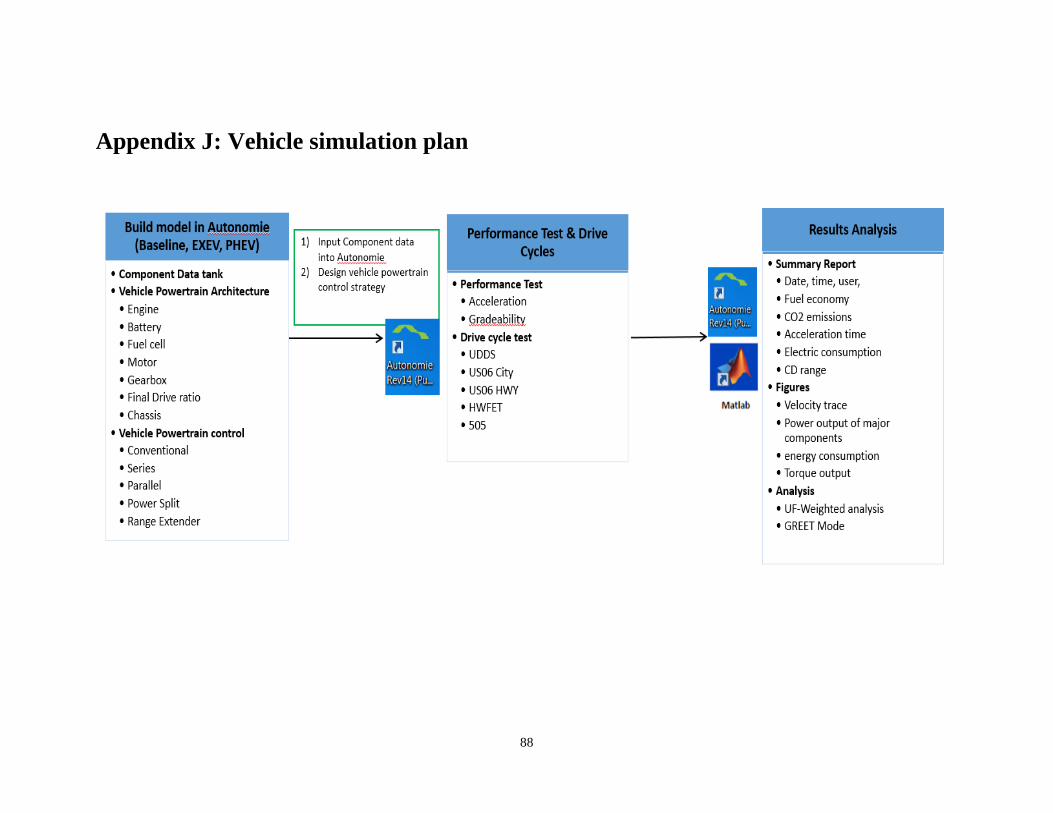
88
Appendix J: Vehicle simulation plan
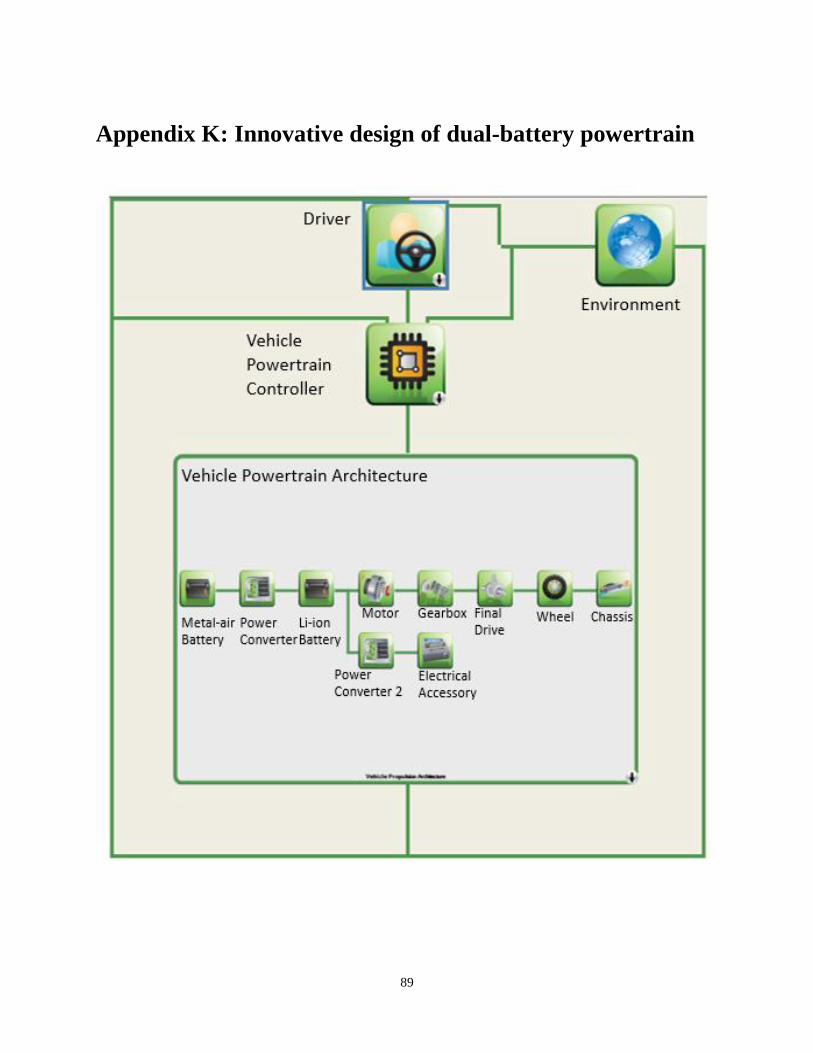
89
Appendix K: Innovative design of dual-battery powertrain
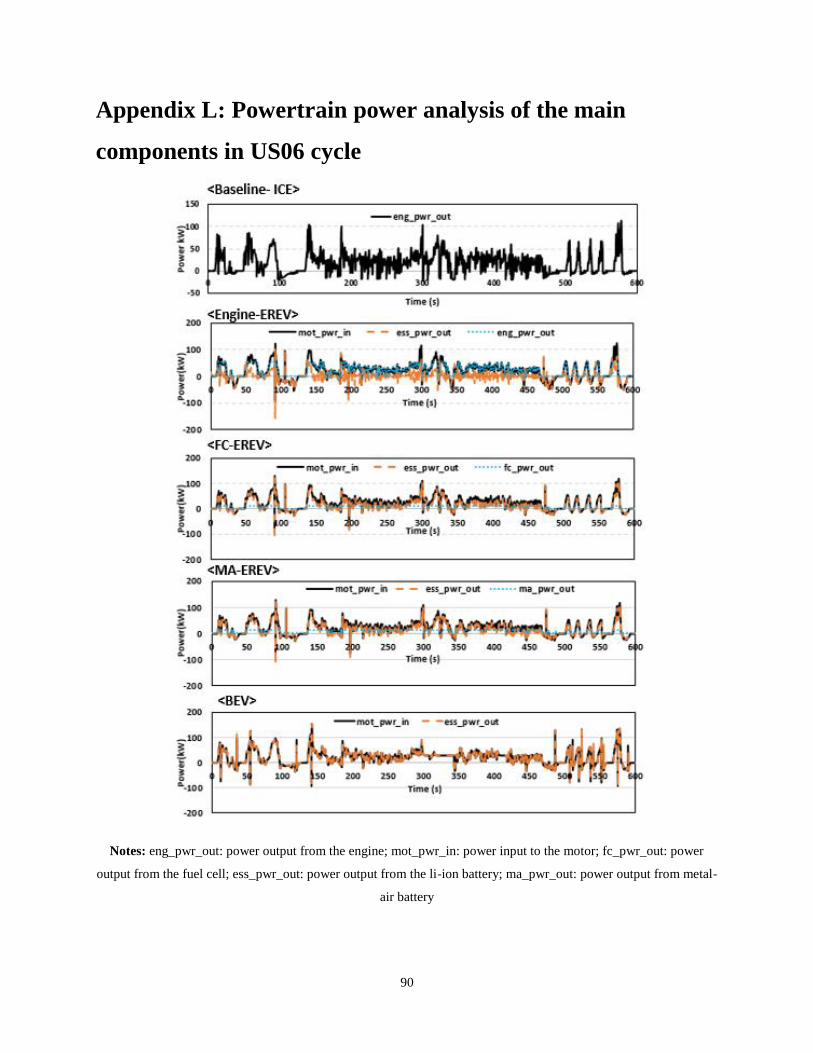
90
Appendix L: Powertrain power analysis of the main
components in US06 cycle
Notes: eng_pwr_out: power output from the engine; mot_pwr_in: power input to the motor; fc_pwr_out: power
output from the fuel cell; ess_pwr_out: power output from the li-ion battery; ma_pwr_out: power output from metal-
air battery
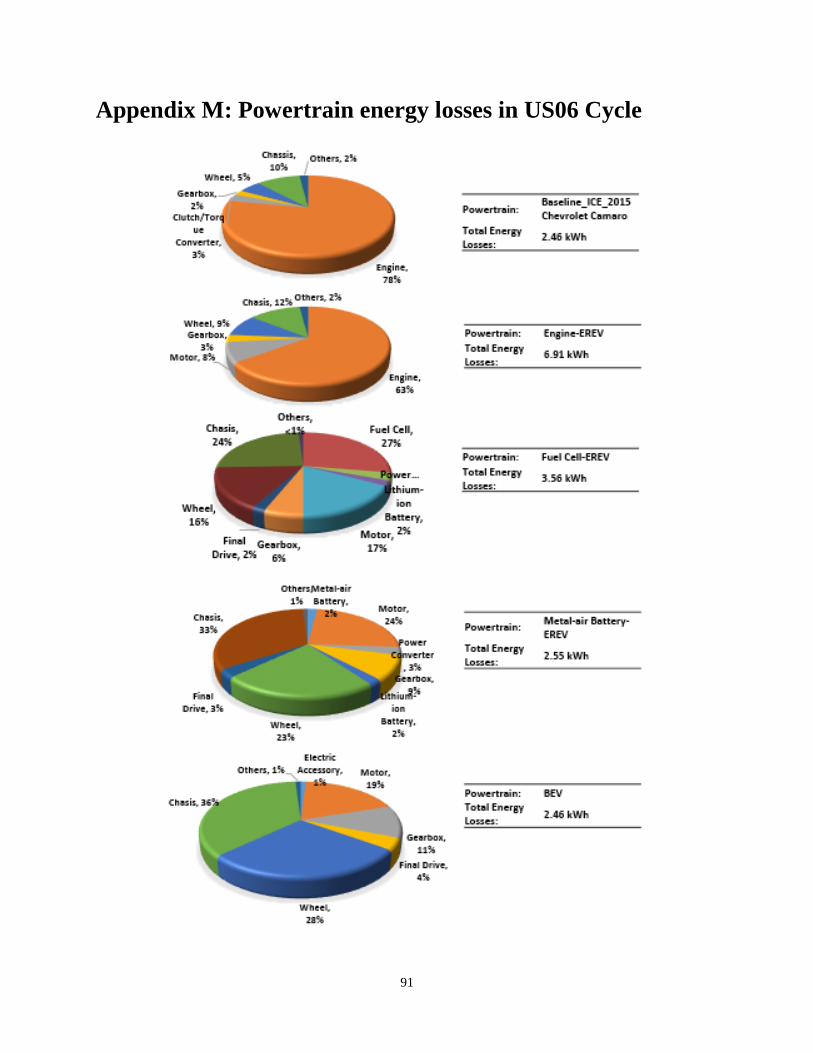
91
Appendix M: Powertrain energy losses in US06 Cycle
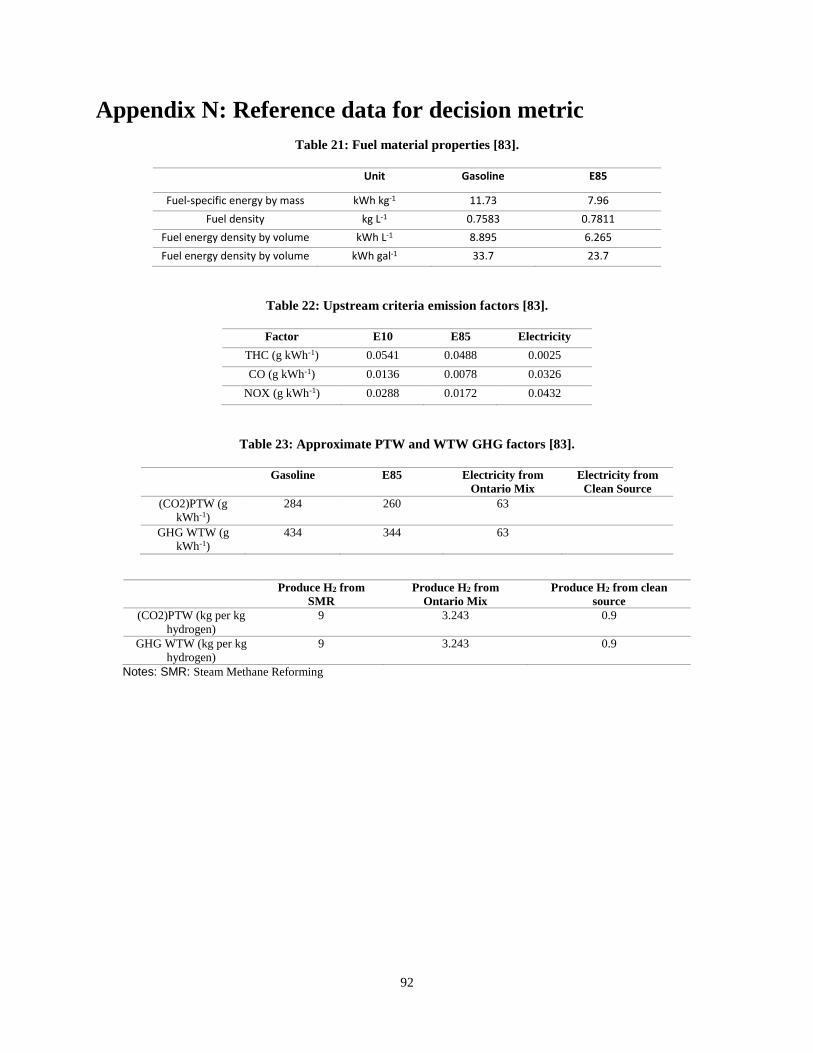
92
Appendix N: Reference data for decision metric
Table 21: Fuel material properties [83].
Unit Gasoline E85
Fuel-specific energy by mass kWh kg-1 11.73 7.96
Fuel density kg L-1 0.7583 0.7811
Fuel energy density by volume kWh L-1 8.895 6.265
Fuel energy density by volume kWh gal-1 33.7 23.7
Table 22: Upstream criteria emission factors [83].
Factor E10 E85 Electricity
THC (g kWh-1) 0.0541 0.0488 0.0025
CO (g kWh-1) 0.0136 0.0078 0.0326
NOX (g kWh-1) 0.0288 0.0172 0.0432
Table 23: Approximate PTW and WTW GHG factors [83].
Gasoline E85 Electricity from
Ontario Mix
Electricity from
Clean Source
(CO2)PTW (g
kWh-1)
284 260 63
GHG WTW (g
kWh-1)
434 344 63
Produce H2 from
SMR
Produce H2 from
Ontario Mix
Produce H2 from clean
source
(CO2)PTW (kg per kg
hydrogen)
9 3.243 0.9
GHG WTW (kg per kg
hydrogen)
9 3.243 0.9
Notes: SMR: Steam Methane Reforming