
Extended Mass Layoffs in 2001 - Bureau of Labor Statistics · Extended Mass Layoffs in 2001 ˘ ˇ...
45
U.S. Department of Labor Bureau of Labor Statistics August 2002 Report 963 Introduction Extended Mass Layoffs in 2001 T he Bureau of Labor Statistics (BLS) conducts the mass layoff statistics program to provide information on large-scale layoff events and on the characteristics of dislocated workers. Each month, BLS reports on the number of mass layoff actions by employers and, each quarter, there is a separate report on the number and characteristics of those mass layoffs that last more than 30 days. This report extends that analysis for the entire 2001 calendar year, pro- viding information on the industry, geographic distribution, and size of mass layoffs; the demographic characteristics of those claiming unemployment insurance; the duration of certified unemployment; the expectation of recall; and the extent of permanent worksite closures. In 2001, employers laid off approximately 1.8 million work- ers in 8,352 extended mass layoff actions. Layoff activity rose sharply in 2001, reaching the highest layoff event and separation levels since BLS studies of mass layoffs were reinstated in 1995. These higher levels of layoff activity continued through each quarter of 2001, with the fourth quar- ter of 2001 registering the highest layoff event and separa- tion figures in the programs history. (See table 1.) In 2001, internal company restructuring surpassed seasonal work for the first time as the reason for layoffs most cited by employ- ers. Over the 2000-2001 period, the annual average national unemployment rate increased from 4.0 percent to 4.8 percent, and nonfarm payroll employment increased by only 0.2 per- cent, or 202,000 jobs. This report presents recent data from the BLS Mass Lay- off Statistics (MLS) program. Extended mass layoffs refer to layoffs of at least 31 days duration that involve the filing of initial claims for unemployment insurance by 50 or more indi- viduals from a single establishment during a consecutive 5- week period. This report uses the North American Industry Classification System (NAICS) for the assignment and tabu- lation of layoff data by industry. However, appendix A, in- cluded at the end of the report, displays selected tables of 2001 industry data using the Standard Industrial Classifica- tion (SIC) system. Additional information about the MLS program is provided in the form of a technical note in appen- dix B. Highlights Industry distribution of 2001 mass layoffs Manufacturing industries accounted for 40 percent of layoff events and 37 percent of separations in the private sector in 2001, up from one-third of both events and separa- tions in 2000. Layoffs in manufacturing were most prevalent in computer and electronic products (mostly semiconduc- tors and electronic components), transportation equipment, and food manufacturing. These three sectors accounted for 41 percent of the layoff events and 46 percent of the separa- tions in manufacturing in 2001. In contrast to developments in 2000, the largest increase in laid-off workers in manufac- turing64,893, or 1,564 percentoccurred among establish- ments manufacturing semiconductor and electronic compo- nents. (See table 2.) Agriculture accounted for more than 9 percent of all layoff events and for more than 10 percent of all separations, mainly due to the end of seasonal work. (See table 2.) Layoff events and separations were most prevalent in agriculture and forestry support activities and in crop production. Employers involved in the manufacturing and distri- bution of computers (including semiconductors) accounted for 9 percent of private-sector layoff events and separations. The number of laid-off workers rose by 121,366, or 464 per- cent, in 2001, reaching the highest levels the industry has recorded. (See tables 2 and 3.) Administrative and waste services accounted for more than 7 percent of all layoff events and for 10 percent of all separations, due largely to the completion of contracts in professional employer organizations and temporary help agencies. (See table 2.) Manufacturers and distributors of clothing reported laying off 107,018 workers. This represents an increase of 51 percent over the number posted in 2000, during which the industrys lowest level of separations was recorded. (See tables 2 and 3.)
Transcript of Extended Mass Layoffs in 2001 - Bureau of Labor Statistics · Extended Mass Layoffs in 2001 ˘ ˇ...

�
U.S. Department of LaborBureau of Labor StatisticsAugust 2002
Report 963
Introduction
Extended Mass Layoffsin 2001
����������������� ������������� ������������������������������������������������������������������������������������������������������������
������������������� ��������!��� ����������������������������������������������������!������"������!��������� �� ��������� ������ �� ���� ������� ���� ���������������� ����������������������������������#$�������������������%���������������������������������&$$'��������������!����������������������������������!����������������������!������(������������)������������������������������������� ��������������������� ���������)� ���� �������� ��������������������)������%����������������)���������%��������������������������������*��&$$'!��������������������%��������'�+������������
�������+!#,&��%����������������������������������������������������&$$'!��������������������������������������������� ������� �������� ��������������� �������������������� ���'--,�� �������������� �������� ���������������������������������"��������&$$'!���������������"���������&$$'����������������������������������������������������������������������.������������ ���������'����*��&$$'!����������������������������������������������������������������������������������������������������������������/��������&$$$�&$$'������!���������������������������������������������������������0�$�����������0�+��������!��������������������������������������������$�&���������!���&$&!$$$�1�������������������������������������������� �2��������
� �����������2� ����������� %��������������������������������������#'�����.�������������������������������������������������������������������������,$������������������������������������������������������������������,���������������������������������3����4��������*�������5������������ �������34*5 ����������������������������������������������������������6�����!��������%�4!��������������������������������!��������������������������&$$'������������������������� ��������*����������5�������������� *5�����������4���������������������������2� ��������������������������������������������������������%���
Highlights
Industry distribution of 2001 mass layoffs� ��������������� ��� ����������������������������
������������ ������������������� �������� � �� ���������� �������������������������������������������� ����� ��������� ���������� ����� ���������������!������ ������������������������������������������� �"�� ���� ������������ ������������������������ #������ ����������$�����������������������������%�� �������� ����� �������������������������������������������� ������&���������������� ��������� ������������������������'�������� ���������������� ���������������� ������� ������������!��(�� ���������������)&��*+��������,&���������)��������������� ���� ������ ������������� ������������������������������������ ���"-�����������#
� .���������������������������������+��������������������������� ������������������������������������� �������� ������������������������� �� �����!��(���"-�����������#�� ���������� ����� �������� �!������ ������������������������������� ���� ������������� ����������������������
� /������� �������������������������������� �������������������� �"������� ����������� #��������������+������������������� ������������������ ����� �������� �%���������������������!��(�� ��� ����������&&������&���������������������������������� ������� �������� ������ �����������"-�������� ���������#
� .��� �����������!� ��� ����� ����������������������������������������������������� �������������������������� �������� ������ ������� ��� ������������������������� � ������ ����� ��������� ����0���� � ���� ���������� ��������� ���"-�����������#
� ������������ � ����� ������� ���� ������� �����������������������*�!��(�� ���%� ������ ��� ��������� �����,��������������������������� �����������������!���������� ���1 ���!� ����������� �������� �!� ������������"-������� ���������#

�
� /������� �������������������������������� ������� �����������������������*����������������������� ������� �������� ������+*���*�!��(�� ��� ����������������� ��� ��������������������������� ����� �������2�����������������"-�������� ���������#
� .����������3��� ����� ������������������������ ����������� ����� �� �� �������� � �� ����� ����� ������ ������!������������ ����������������������� ��������� �4��������������� ������ ���������������������� ������������� ������������������ � �����������!��(�� ���"-����������#
� .���� ���� ���� ���������5.'6-������� ��� ������� ���������������� -�������������� ��������� � ���������������� ���������!��(�� ������������6����������������������������������������������������� ������� �"7��+��*��!��(�� #�������!���������� ����������� ������ ����� �"7*+�&+*#������������ ���������"7,�����#��%!����� 2� ��� ��� ��� ������������ � �� ������������������������ ���� ������������� �"�����*�#������� ���� ��"�+�+��#�
� .�������������5.'6-���� ��� ��� ���� ����� ���������������������������������������������������������� ��������������� ������������������ ����� ����������������������������������������������������� ��������� ����!��(��� �������� ���%�� ����� ��� ������������������������ �� ���� �� ���� �� ������������ �������� ������������� ���������������� ������ ����������������������� ���"-�����������#
Reason for layoff� 8��������� ���������������������!��(�� ���������������
������������������ �������������,����*��� ���� ��� ���������� �������������� �� �����!��(���%� ������ ������������������������ ����������������� �������� � ���������"-���������,�#��%�� �������� ��������������������������������"�� ������������������������������������ ������ �����������$������������������������ #����������������"���������������������� �� ���� #������������ �����������!� �� ����� �"������������ �������������� ����� #�
� /������� ���������������� �� �����!��(�� ��������� ����������������������������������!� �������������������� "����������#����� �������� �"�*��������#�������������"-��������,�#��4 ���������� �� �����!��(��� ����������������������������������������������������� ����� �������� ���'������� �� ����������� �����������������������������������"������������������������� �#�� ���� ����� �����������6���������
� ����� ������������� �� ��������(����������������������� ����� ����� �" ���(�!��(#��� �� ��������������"7��&�,+�
!��(�� #���������������������� �������������������������������� ���������������������������� ����������� �������� ����� ��8����������������"7+��&�*#��������(������"7�+��+&#�!����������2���� ������������ �� ������������-�������� ������������������� ����������� �� �!�������������������� ������������������� � �!��������������������� ����� ������������������� �� �����!��(������������ ���������������� ������ ������� ������������� ���� �������� � � �!��(��� �������� �"�����+*�����������*���� ��������#���"-������� �,�����&�#
� 8����!������-������������������ �������( ����������� �������������������������� ����������*�*�&��!��(�� �%�����������-���� �����������������������������������������������������������-������������������ ���8������������������������� �������������� �����,,���������������� �������� �����������3� ������-���� )6���������5�������'���� ��5�!9��(������%�2� ���.������� ��������������� ���������������� �������( ���*����������������+,&�!��(�� ������������������������� ���������������� ������������ ������.�����������,��������������+�&���!��(�� ��������������������������� ��������� ���-2������������������������������ ������������� ����-������������� ��� ������������ �������������������������� �� ��������(�������������������������� ����� " ���(�!��(#�� ��������������� �������������������������������,*������������������������!��(�� ���"-�������� �������*�#
Size of layoff� ����������� ��������������������������������������
������!��������������������� 0�� ���������!���,*�����������������!���������,��!��(�� ���%� �������� ����������������� ������ ����������,*� ���&�������������������%�� �������� ����!������������������������������������������ �������� ���-�������� ��������,�����������!��(�� ������������ ���������������������� �������� �������� ���� ��������������� �������������������� �������� ���"-���������+�#
� ����� ������������� �������� ���������������������������� ���������������������$������++*�� �������� �������������.����������� ������� ���� ����� ���������� ����� ������������������������������"�� ������� ����������������������������������� #������������������ ����������������� 0�����&�������!���������� �������������!������� ���!����+��!��(�� �"�������������� ��������#���/ ����� ����� �!������� ����� ���������������� 0��!������� �������������� ����� �"����!��(�� #���������������������� ������ ������"����!��(�� #���"-������������#
� /������� ��������(�������� �������� ����������������� ������� �� ������� ������� 0������ ������� ������ "�&�!��(�� #�������!��������� ��������������������������"���!��(�� #��������� �����"�+��!��(�� #������������������������� �"����!��(�� #��� ����� ������������������ �������������������!���������������������!� �� �������� �������������������"++���������!��(�� ���� ��������#���"-������������#

�
� /������� � �������� ����!��( ��� � � �������������� ��������������� �������� ��������������������"-�����������#
� ����� �����������������������������������������-������������������� �������( ����������*,���������!��(�� �
Initial claimants� %�����!������&�+���,������������� ��������������
������ �������� �������!����2��������� ������������� ���������:����� ��������������!����!�����������������!�������(���+���������!����4 ���������������������!����,,����� �����������������.��������������,�������� �!�������!��������� ����������������"-������������#��:������������������������������������������������!����!�����������������!��������(������������!����4 ���������������������!����,,����� �����������������%�����������������������������������������!� ����!���������� ��������������
� %����������������4 ������������ �������������+��������������,������������+++���%������������ ��������. ������;�����' �����������!����������� ������ ������������������"-������������#
� /������������������������������ �������������!������4 �������������������� ��������������� ��������%������ ���������������������� �����,,�����������!� ����� ��������������������������������8���������� ������������� ��������������� ����������� �!��������������������������� �����������!� ��� ����� ������������������������������������������+������������������������ ������������� ����������.�������������2�������**������������������������ ������������������� ������ ������!����!�������"-������� �����������#
Duration of insured unemployment� <� ��=���������������� �������������� ��������
������������ �������!����2��������� � ������������ "� ���� ���������������������������������� �������������������� ������������!���������������#�������!���������> ��������6��������%���� ��������5�����6�������6������ ��2������������ ����� ��3���� ���������!��� ��������� ����� �������� � �������� ��?�����(���4�!��.�� (���5���� (�������<�������"-������������#
� <���������������������� ���������������������� �2��� ����������������� ������������� �������!�����@������%���� ��������.�0������-���� ���������������!�� ����������� �����2��� ��� �!����5���� (������.�� (��"-������������#
� %������� ���������3���� ���������!� ��2������������������ �������������������������� �������"�������� ������ ������������������� ��������� ����� #���������
!���� ����������"������������������������ ���������!���� ���� #���6������ ����������������������������������� ����� �"�� ���� ������� ���������� ���2������� ������� #��������� ����� �� ���� ����3���� ���������������!����������� ����� ���2��������������� ���������"-���������,�#
� A�������2��� �������� �!������� �������!��(�� ������������!���� ���������������������������!����!��(��� ��������������������������������� ����� �������� ��������������!������ ������������ ������������������!� ����� ���"-����������,�#
� 6������ ����������������������������� � ��������������� ��3���� ���������������!��������� ������������������������������������� ����������������������� ���� ����� ��� ��� ��� ����B�����-���� �� � �%��� ����� �� �������� ������������������ ��������������� �������������������������� ���"-����������,�#
� A���(�������� ������������ �!�������. ������;����' ������ ������������������2��� �������� ������������������������������ ��!����!����������� �����������!� ����A������������������������������������(���������� ���!� ����2��� �������� ���<���������������2��� �������� �����������"-����������&�#
Geographic distribution� '������������������������������������� ��������
������������ �������������������8������������������������ ��&���� ���������� �������<� ������������������ ����������� �������� ���������������� ���� ����� �����������������������"������������������������������#���"-�����������#��/2������������������� �� ����������� ��������!� �"����&��#������������ ������������ ���������!��(�� ���2��������� ������������� �
� 6��������!��������2��������������������� � ���������������� �������� ���������������������������������� ��!���������!� ��"7�&���*+#����������������� �������� ��� �����!��� ��� ����<� �� "7�&�����#�� ���� ����-����"7�,����*#���.����������������� �� ������������������� ������������������������/� ��5�����6�������"7����*��#����;�����"7��*���,#��� �� ���"-������������#
� %������!��-���� ���������> ��������6���������������������� �������������� ������������!��(�� � ��������� -��������� ��������++,���6�������������������� �����������!��(��� �������� ���**���+���� ������������������������������ ����������� ������� ����� ��������������������������������������������������%���-���� �!���������2����� ������� ���� �������� �!����'���� �"����*+�#��%�2� "����+��#��8������"+��,*,#������������"+,�*��#���"-���������*�#��/����!�������� �� ���������������� �� ����������� � �2��������6�������� ��������������� �� �������� ���������������

�
� 8��������� ���� ���������> ��������6������������������������������ � �������������������������!��(�� ��������6��������"7����,�#��'���� �"7,&�+��#��8������"7���*&�#��5�!9��(�"7�+����#������������"7���,��#���:����������-���� ���������������������������������.�� (��"����*�#�����:��"����+�#��2������������� ����� �������� � ���"-����������*�#
� -2����������������������� �����&������������� ��������� ���������������������������� ���� ��������� ������������!����&������������������ �����&������������� ��������� ������������ �������� ���.�����������������������-��� �����.��� ��6�������������� ������� ����������� �������� �"*+��*�#������������������������������������������������������������ ����������� ������� ����� ������������ �����������-���C� ���5�!�9��(������ � �=�� ��������� ���� ����������������������� � �� ���� ���� �������!��(�� ����������9�����.D��E��� ���-���A����������6.�����-���� ��6.�� � "-��� ������ �+�#� �/������� � �������� �������������������� � �������������+���!��(�� ����� ������ ������,��������������*�*���!��(�� ������������
� 6������� ��! ��� �����������������������������������������-������ ��� � ��������� ���������� ������ ������ ���� �-���� ���6������������������� ����������������������� ��������������������������������������������������� �������� �� ���������������� ��������E�������������������� ��� ��!���������'���� ��:������5����������������< ��� ����-���� �!���������!� �������������� ������ ��������������!����<������5���� (���>���!���������<� �=����
Recall expectations� '���������������� ��2������������������������,��������
����� � ������� ����� �� ���� � ��!� �� ����������������� ���������� ���������� ��������������� -����������4 ���������������������� �������2���������������&���������������������������� ��� ����� �������������"+���������#������� �����������������������������"�&��������#����������� ���������"����������#�!����������(������������ �����������������������!������� ������������� ��� ��� ����� ����������������� � ������� ������ ���� ���� ��!� �� ���������� ��� �������2���������"���������#�������!��������� ����������������� ������"+��������#���/2������ �� ���������������������������� �"��!�������������!� ��2�������+������������� ������#�����������!� ��2���������������,����������������� ���� �����������1 ���!� ���������������������"-�������� ����������#
� :����� ��� ���� ����� ��2�����������������&�������������������������!��(�� �!��������������������������������*�����������2����������������������� ��������������!��(�� ���"-�����������#
� /������� �������������������������!��( �� ����� ������ ����B�����-���� �� � ���� ��� ��� ���� ����������� ���
��!� �����������������������2���������������!��������� ��������(���������� �� ��!��� ��������������� ������������������������������������������������������� ����� ������!��������B�����-���� ���"-������������#
� ��������������� ��� ����������������+�������������������� ������&���������������� �������� �����!������������������������2����������������%�� ������������������������������������������������ �"�������������������������������� ������� ����������� ������������������ #����� ����������$�������"�� �������������������������#��������������������������"����������������������������������������������������#���"-������������#
� '������������������ ���������!� �������� ��������� �����$����������������� ������!�������������� ��2���������������������+���������������������������� �����,������������ �������� ��� ����� �������� ���(�!��(���������������������������������������� ������ ������ ������&����������� �������� ���"-������������#
Permanent worksite closures� /������� ����������������,�����������������2���������
������������ ��� ����������������������� �����������!��( �������������+��+��!��(�� ���6��������!��������2��������������������������� ���!��������!��( ������ �������� �����&�����������������������������!��(�� �������������� �������������������"-������������#
� �-�������� ���������������� ��� �!���������������������������������� ���������� ���(�!��(�������������������������%�� ����������� �� ����������� ��� ����������������������� ������� � ���!��(��� �������� ���"-������������#
� '����������������������������������,����������������� ������������������� �������� ��� �������!��( ����� ����� �%�� �� ����� � ����������� ���� �� ��������� �������������������� �������������� ��������������� ��������������� ���E��������������������������,��������������������������� ������*������������ �������� ��������������������������������������� �� ���� ��������������������� ����������� ������ ���� �� �.������������������������������������ ��������� ������������������� �������� �!��������� �����������!� ��� ����� ���"-������������#
� '��������� ���� ����� ��������������������$����������������������������������������������������������������������������� ������ ���� ��������������������������������������������������������5.'6-����� ��� ������� ������������!��(�� ���������������� ��� �%����������������� ����������$���������� ���� ������������������ ���� ��������������� �������������� ���� ���"-���������,�#
� 6���������� ������������� ������������ ��������

�
��������������� ����������������� �"&����+#�������!�����������"�,����#��'���� �"�*���+#������%�2� �"�*���,#����������"7����+�#��6��������"7�����,#������%�2� �"7���+��#������������������� ������� � ��� �������� ������������������F�� ���� ��� �"�,��&�#�����?�����(��"������#�������������� �������� � �����������!��(�� ����"-����������&�#
Dislocated worker information� '�������������2��������� ����������������������
� -���������� �� �����++�����������������������������������3��� ����� ��������� ��������!��(�������������� ������������������B�-��>������������� ����1 �/���������������%������.��� ���������� -�����( ����������������� ������ ���$�������������������!��(�� )� �������!��(������ ��� �� �� ������������� ������������������ �������������� ���� ����� ������������� ��� ���'������������ -������������������������������� ��������!��(�� �������� ��������������������1 �� �������"-������������#
� .�� ��������!��(������ ������� � ������� ������������� �������� ������������������!��( ������ ���������������������������!��(�� ���%� ��������������� ����������������!��( ������ ��� ��������������������� ���������!����������������!��( ������ ��� �����������!������������+!��(�� ���'��������������!���������,,�!��(�� �������������,,������������� ���6������������������� ������������ �������!��(��� �������� ��&,�����������!������������"�&��**#�
'���� �"�+���&#������%�2� �"�*�&,+#���������������"�������������������������������������� ��������������#���������������������� �����������!� ��� ����� ������������ ������� ������������!��(�� ���"-�������� ��*������+�#
� ����� ��������G �� ������������� H���������2�������� ������� �������������������,�����������!��(�� �����!������������������ �������� � ������� ���������������������������������������������'��������������!���������������� ����� ������������&,��!��(�� ����������� �� ������������� �������� �6�������� ��������� ���� ���� �����������!��(��� �������� �"������&#�������!������'���� �"����&�#����%�2� �"����*&#���������������"�� ���������������������������������������������������������� ����������$�������#������������ �������������������!��(�� ��� �� ������������������ �������!���������� �������������!������ ��"-�������� ��*������+�#
� '��� ��� ���������� �������������������������������-������ ���� �� ��� � �� ���� ��� ��� � ������� � � ���������������-��������-�������'������������ �������������������� ��������������������� ���� ����� ������ ������������� ��� �������������������������� -����������'�������������!��������������������������� ��������������� ����� ����� ������������� ��� ���6�������������������� �� ��������� ������������ �"�*��&+�#�� �����!������:��"�&&�*��#�����%�2� �"+��*�,#���"-����������*�#

�
Table 1. Number of extended mass layoff events, separations, and initial claimants for unemployment insurance, 1995–2001
Year/quarter Layoff events1 Separations1 Initial claimants for
unemployment insurance1
19952
Second quarter………………… 1,724 400,980 332,731 Third quarter…………………… 950 194,149 154,226 Fourth quarter…………………… 1,764 348,741 312,428
Total…………………………… 4,438 943,870 799,385
1996First quarter……………………… 1,408 272,480 224,393 Second quarter………………… 1,352 261,628 200,032 Third quarter…………………… 1,021 233,199 185,247 Fourth quarter…………………… 1,916 417,048 348,073
Total…………………………… 5,697 1,184,355 957,745
1997First quarter……………………… 1,317 255,227 224,180 Second quarter………………… 1,587 351,198 292,673 Third quarter…………………… 1,082 217,869 209,019 Fourth quarter…………………… 1,697 321,821 316,035
Total…………………………… 5,683 1,146,115 1,041,907
1998First quarter……………………… 1,320 208,082 247,315 Second quarter………………… 1,563 391,461 402,276 Third quarter…………………… 1,234 248,054 256,803 Fourth quarter…………………… 1,734 379,976 325,990
Total…………………………… 5,851 1,227,573 1,232,384
1999First quarter……………………… 1,509 277,780 252,122 Second quarter………………… 1,444 294,968 242,464 Third quarter…………………… 1,097 241,725 189,973 Fourth quarter…………………… 1,625 334,794 287,685
Total…………………………… 5,675 1,149,267 972,244
2000First quarter……………………… 1,330 254,646 221,368 Second quarter………………… 1,271 258,608 231,471 Third quarter…………………… 1,014 230,103 189,250 Fourth quarter…………………… 2,005 427,070 376,611
Total…………………………… 5,620 1,170,427 1,018,700
2001First quarter……………………… 1,765 342,954 340,151 Second quarter………………… 2,072 481,876 401,294 Third quarter…………………… 1,815 384,403 371,124 Fourth quarter…………………… 2,700 541,410 497,136
Total…………………………… 8,352 1,750,643 1,609,705
1 Data on layoffs were reported by employers in all States and the District of Columbia.
2 The MLS program began collecting data in the second quarter of 1995. (See appendix B.)

�
Table 2. Industry distribution: Extended mass layoff events, separations, and initial claimants for unemployment insurance,1999–2001
Industry
Initial claimants for unemployment insurance
1999 2000 2001 1999 2000 2001 1999 2000 2001
Total1 ..................................................................... 5,675 5,620 8,352 1,149,267 1,170,427 1,750,643 972,244 1,018,700 1,609,705
Total private .................................................................... 5,467 5,418 8,131 1,096,859 1,107,055 1,697,593 931,272 974,104 1,562,978
Agriculture, forestry, fishing and hunting....................... 911 827 753 195,408 191,093 173,299 134,355 127,837 110,907 Mining........................................................................... 91 54 61 16,496 6,810 13,109 18,045 6,105 12,476 Utilities.......................................................................... 9 22 19 1,588 3,089 3,835 1,234 3,060 4,196 Construction.................................................................. 792 754 776 117,587 110,814 111,897 118,982 112,761 115,303 Manufacturing............................................................... 1,736 1,834 3,279 356,112 366,070 628,427 310,129 370,779 691,184 Food.......................................................................... 342 336 342 84,482 75,618 72,199 63,785 67,344 65,520 Beverage and tobacco products............................... 22 22 31 5,904 4,234 6,506 4,185 3,855 4,334 Textile mills............................................................... 55 43 96 11,335 9,027 20,174 13,396 10,985 21,877 Textile product mills.................................................. 18 18 28 1,870 2,573 3,636 2,233 2,067 4,334 Apparel...................................................................... 163 157 192 31,063 24,778 32,328 32,750 23,905 31,585 Leather and allied products....................................... 26 27 25 3,663 5,008 4,432 3,554 3,772 3,588 Wood products.......................................................... 60 78 86 6,858 11,193 10,745 6,110 11,492 13,816 Paper........................................................................ 41 61 87 6,416 9,548 16,226 5,474 8,558 13,999 Printing and related support activities....................... 29 38 62 4,589 5,450 9,941 4,117 5,352 8,998 Petroleum and coal products.................................... 22 19 21 3,541 2,419 3,372 3,294 2,468 2,889
Chemicals................................................................. 47 39 71 6,922 6,055 12,614 6,549 5,570 9,444 Plastics and rubber products.................................... 51 69 122 10,195 12,614 18,739 8,228 11,682 21,522 Nonmetallic mineral products................................... 68 70 79 9,575 10,144 13,484 9,624 9,543 13,392 Primary metal............................................................ 84 79 198 15,832 19,034 43,723 16,966 17,830 50,503 Fabricated metal products........................................ 98 110 233 14,573 16,191 32,418 14,293 16,538 36,281 Machinery.................................................................. 122 107 280 21,420 20,440 47,001 22,083 20,772 56,762 Computer and electronic products............................ 147 99 615 30,085 22,227 131,607 21,555 17,767 139,942 Electrical equipment and appliances........................ 44 52 141 10,282 10,024 33,146 9,208 14,742 40,911 Transportation equipment......................................... 211 296 372 63,788 83,210 86,402 51,085 102,057 120,956 Furniture and related products.................................. 33 40 118 4,651 5,254 17,715 4,554 4,733 19,942 Miscellaneous manufacturing................................... 53 74 80 9,068 11,029 12,019 7,086 9,747 10,589
Wholesale trade............................................................ 106 107 180 16,730 17,636 28,975 12,781 12,452 22,600 Retail trade.................................................................... 268 275 457 91,519 88,134 132,013 57,852 59,345 103,328 Transportation and warehousing.................................. 233 273 395 49,966 50,030 117,173 42,150 48,000 96,504 Information.................................................................... 81 77 324 23,076 14,937 59,329 34,754 11,212 56,175 Finance and insurance.................................................. 111 114 177 21,911 31,407 33,654 18,225 18,411 29,631 Real estate and rental and leasing............................... 13 17 33 1,539 2,171 7,602 1,598 2,029 4,645 Professional and technical services.............................. 117 118 257 24,304 22,222 51,215 22,120 19,968 40,566 Management of companies and enterprises................. 18 8 16 3,786 1,975 3,345 2,972 1,556 2,831 Administrative and waste services................................ 322 364 595 61,040 77,711 168,360 67,641 96,072 132,562 Educational services..................................................... 9 11 15 1,446 1,090 1,652 844 964 1,264 Health care and social assistance................................ 226 205 174 35,107 38,669 23,792 25,663 27,785 19,370 Arts, entertainment, and recreation............................... 101 82 126 26,294 25,858 39,758 12,161 9,743 16,710 Accommodation and food services............................... 218 166 367 38,610 41,035 79,556 36,861 30,505 82,001 Other services, except public administration................ 82 79 82 11,833 11,125 11,334 10,169 9,936 10,462
Unclassified .................................................................. 23 31 45 2,507 5,179 9,268 2,736 5,584 10,263
Government..................................................................... 208 202 221 52,408 63,372 53,050 40,972 44,596 46,727 Federal.......................................................................... 38 51 52 9,372 18,373 12,696 9,972 15,294 12,796 State.............................................................................. 43 35 41 14,796 9,164 10,498 8,626 6,301 8,838 Local............................................................................. 127 116 128 28,240 35,835 29,856 22,374 23,001 25,093
Selected industry groupings2
Clothing manufacturing and distribution ………………… 355 329 457 94,407 71,048 107,018 80,312 67,804 99,651 Computer manufacturing and distribution, including semiconductors ……………………………………… 129 113 736 27,916 26,147 147,513 18,257 17,634 153,211 Food production, processing, and distribution…………… 1,457 1,308 1,327 319,562 298,485 298,708 233,793 222,656 226,239
1 See footnote 1, table 1.
Layoff events Separations
�
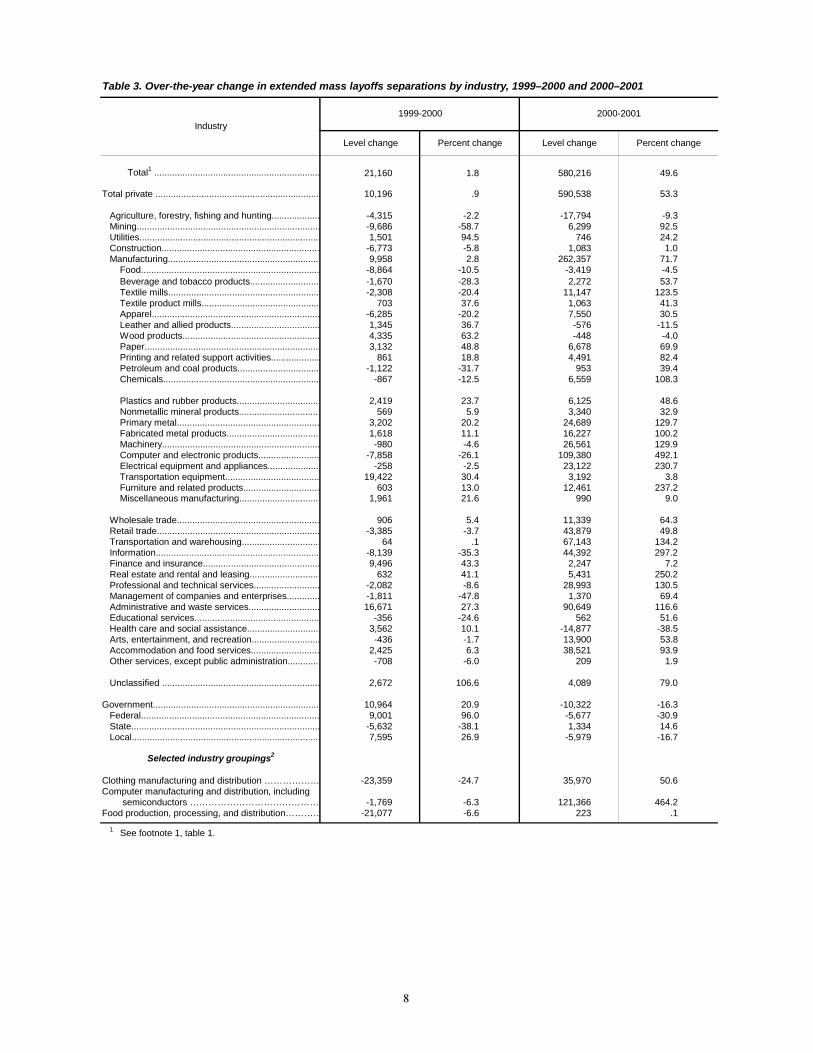
Table 3. Over-the-year change in extended mass layoffs separations by industry, 1999–2000 and 2000–2001
Level change Percent change Level change Percent change
Total1 ................................................................. 21,160 1.8 580,216 49.6
Total private ................................................................. 10,196 .9 590,538 53.3
Agriculture, forestry, fishing and hunting................... -4,315 -2.2 -17,794 -9.3 Mining........................................................................ -9,686 -58.7 6,299 92.5 Utilities....................................................................... 1,501 94.5 746 24.2 Construction.............................................................. -6,773 -5.8 1,083 1.0 Manufacturing............................................................ 9,958 2.8 262,357 71.7 Food...................................................................... -8,864 -10.5 -3,419 -4.5 Beverage and tobacco products............................ -1,670 -28.3 2,272 53.7 Textile mills............................................................ -2,308 -20.4 11,147 123.5 Textile product mills............................................... 703 37.6 1,063 41.3 Apparel.................................................................. -6,285 -20.2 7,550 30.5 Leather and allied products................................... 1,345 36.7 -576 -11.5 Wood products...................................................... 4,335 63.2 -448 -4.0 Paper..................................................................... 3,132 48.8 6,678 69.9 Printing and related support activities................... 861 18.8 4,491 82.4 Petroleum and coal products................................. -1,122 -31.7 953 39.4 Chemicals.............................................................. -867 -12.5 6,559 108.3
Plastics and rubber products................................. 2,419 23.7 6,125 48.6 Nonmetallic mineral products................................ 569 5.9 3,340 32.9 Primary metal........................................................ 3,202 20.2 24,689 129.7 Fabricated metal products..................................... 1,618 11.1 16,227 100.2 Machinery.............................................................. -980 -4.6 26,561 129.9 Computer and electronic products........................ -7,858 -26.1 109,380 492.1 Electrical equipment and appliances..................... -258 -2.5 23,122 230.7 Transportation equipment..................................... 19,422 30.4 3,192 3.8 Furniture and related products.............................. 603 13.0 12,461 237.2 Miscellaneous manufacturing................................ 1,961 21.6 990 9.0
Wholesale trade........................................................ 906 5.4 11,339 64.3 Retail trade................................................................ -3,385 -3.7 43,879 49.8 Transportation and warehousing............................... 64 .1 67,143 134.2 Information................................................................ -8,139 -35.3 44,392 297.2 Finance and insurance.............................................. 9,496 43.3 2,247 7.2 Real estate and rental and leasing............................ 632 41.1 5,431 250.2 Professional and technical services.......................... -2,082 -8.6 28,993 130.5 Management of companies and enterprises............. -1,811 -47.8 1,370 69.4 Administrative and waste services............................ 16,671 27.3 90,649 116.6 Educational services................................................. -356 -24.6 562 51.6 Health care and social assistance............................. 3,562 10.1 -14,877 -38.5 Arts, entertainment, and recreation........................... -436 -1.7 13,900 53.8 Accommodation and food services........................... 2,425 6.3 38,521 93.9 Other services, except public administration............. -708 -6.0 209 1.9
Unclassified .............................................................. 2,672 106.6 4,089 79.0
Government.................................................................. 10,964 20.9 -10,322 -16.3 Federal...................................................................... 9,001 96.0 -5,677 -30.9 State.......................................................................... -5,632 -38.1 1,334 14.6 Local.......................................................................... 7,595 26.9 -5,979 -16.7
Selected industry groupings2
Clothing manufacturing and distribution ……………… -23,359 -24.7 35,970 50.6 Computer manufacturing and distribution, including semiconductors …………………………………… -1,769 -6.3 121,366 464.2 Food production, processing, and distribution………… -21,077 -6.6 223 .1
1 See footnote 1, table 1.
Industry1999-2000 2000-2001

Table 4. Industry distribution: Extended mass layoff events and separations, top 50 industries in 2001
2000 2001
Layoff events Separations Rank1 Layoff events Separations Rank1
Total2 .............................................................. … 5,620 1,170,427 … 8,352 1,750,643 …
Total, top 50 industries ............................................. … 5,187 1,095,964 … 7,688 1,632,113 …
Administrative and support services ………………… 561 366 80,835 3 590 170,533 1 Computer and electronic product manufacturing …… 334 99 22,227 14 615 131,607 2 Agriculture and forestry support activities …………… 115 508 117,242 1 472 104,859 3 Transportation equipment manufacturing …………… 336 296 83,210 2 373 86,461 4 Food manufacturing …………………………………… 311 336 75,618 4 342 72,199 5 Crop production ………………………………………… 111 312 72,651 5 271 67,322 6 Heavy and civil engineering construction …………… 237 404 56,852 6 370 54,834 7 Air transportation ……………………………………… 481 10 1,979 69 88 53,311 8 Professional and technical services ………………… 541 118 22,222 15 257 51,215 9 Machinery manufacturing ……………………………… 333 107 20,440 18 280 47,001 10 General merchandise stores ………………………… 452 80 29,259 7 138 46,955 11 Accommodation ………………………………………… 721 73 21,208 17 218 45,789 12 Primary metal manufacturing ………………………… 331 79 19,034 20 198 43,723 13 Specialty trade contractors …………………………… 238 203 26,891 10 276 36,825 14 Transit and ground passenger transportation ……… 485 145 28,495 8 145 35,699 15 Food services and drinking places …………………… 722 93 19,827 19 149 33,767 16 Electrical equipment and appliance mfg. …………… 335 52 10,024 32 141 33,146 17
Fabricated metal product manufacturing …………… 332 110 16,191 23 233 32,418 18 Apparel manufacturing ………………………………… 315 157 24,778 12 192 32,328 19 Amusements, gambling, and recreation …………… 713 50 21,435 16 70 30,854 20 Telecommunications …………………………………… 517 27 4,375 52 141 29,704 21 Nonstore retailers ……………………………………… 454 46 26,182 11 68 28,445 22 Construction of buildings ……………………………… 236 150 27,671 9 131 20,333 23 Textile mills ……………………………………………… 313 43 9,027 35 96 20,174 24 Plastics and rubber products manufacturing ………… 326 69 12,614 26 122 18,739 25 Furniture and related product manufacturing ………… 337 40 5,254 46 118 17,715 26 Educational services …………………………………… 611 57 15,524 24 81 16,636 27 Paper manufacturing …………………………………… 322 61 9,548 33 87 16,226 28 Social assistance ……………………………………… 624 125 16,692 21 122 15,263 29 Building material and garden supply stores ………… 444 20 4,480 51 44 15,161 30 Credit intermediation and related activities ………… 522 68 22,765 13 68 14,165 31 Merchant wholesalers, nondurable goods …………… 424 60 11,232 27 72 13,789 32 Nonmetallic mineral product manufacturing ………… 327 70 10,144 30 79 13,484 33 Food and beverage stores …………………………… 445 40 9,113 34 59 13,241 34
Merchant wholesalers, durable goods ……………… 423 38 5,145 47 93 12,835 35 Chemical manufacturing ……………………………… 325 39 6,055 42 71 12,614 36 ISPs, search portals, and data processing …………… 518 21 4,263 53 76 12,189 37 Miscellaneous manufacturing ………………………… 339 74 11,029 29 80 12,019 38 Publishing industries, except Internet ………………… 511 16 2,687 61 71 11,920 39 Performing arts and spectator sports ………………… 711 40 8,327 37 65 11,728 40 Executive, legislative, and general government …… 921 56 16,483 22 60 11,296 41 Securities, commodity contracts, investments ……… 523 6 548 80 59 11,294 42 Mining, except oil and gas …………………………… 212 43 5,549 44 49 10,994 43 Wood product manufacturing ………………………… 321 78 11,193 28 87 10,802 44 Printing and related support activities ………………… 323 40 6,821 40 62 9,941 45 Unclassified establishments …………………………… 999 35 5,739 43 49 9,766 46 Couriers and messengers ……………………………… 492 16 3,618 55 24 8,116 47 Insurance carriers and related activities ……………… 524 40 8,294 38 47 7,811 48 Truck transportation …………………………………… 484 62 8,364 36 57 7,486 49 Clothing and clothing accessories stores …………… 448 25 3,519 56 32 7,381 50
1 Industries are ranked by the number of separations in 2001.
Industry NAICS
�
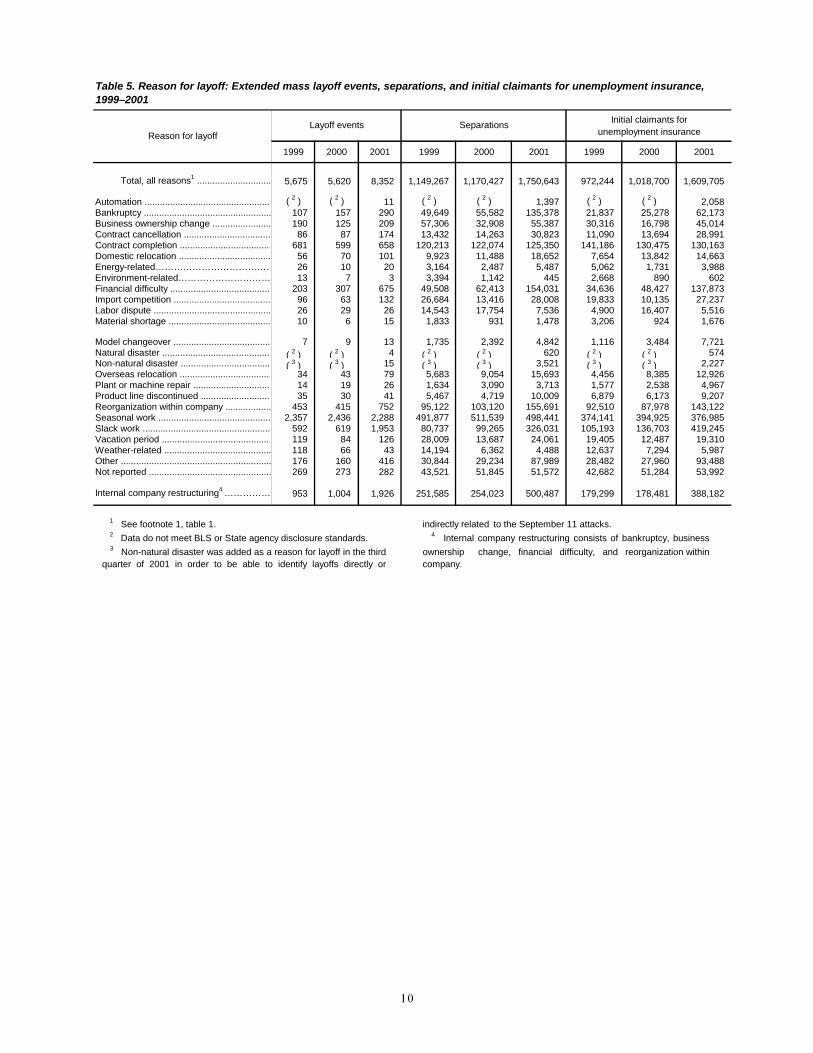
Table 5. Reason for layoff: Extended mass layoff events, separations, and initial claimants for unemployment insurance,1999–2001
Initial claimants for unemployment insurance
1999 2000 2001 1999 2000 2001 1999 2000 2001
Total, all reasons1 ............................. 5,675 5,620 8,352 1,149,267 1,170,427 1,750,643 972,244 1,018,700 1,609,705
Automation .................................................. ( 2 ) ( 2 ) 11 ( 2 ) ( 2 ) 1,397 ( 2 ) ( 2 ) 2,058 Bankruptcy .................................................. 107 157 290 49,649 55,582 135,378 21,837 25,278 62,173 Business ownership change ....................... 190 125 209 57,306 32,908 55,387 30,316 16,798 45,014 Contract cancellation .................................. 86 87 174 13,432 14,263 30,823 11,090 13,694 28,991 Contract completion .................................... 681 599 658 120,213 122,074 125,350 141,186 130,475 130,163 Domestic relocation .................................... 56 70 101 9,923 11,488 18,652 7,654 13,842 14,663 Energy-related………………………………… 26 10 20 3,164 2,487 5,487 5,062 1,731 3,988 Environment-related………………………… 13 7 3 3,394 1,142 445 2,668 890 602 Financial difficulty ........................................ 203 307 675 49,508 62,413 154,031 34,636 48,427 137,873 Import competition ...................................... 96 63 132 26,684 13,416 28,008 19,833 10,135 27,237 Labor dispute .............................................. 26 29 26 14,543 17,754 7,536 4,900 16,407 5,516 Material shortage ........................................ 10 6 15 1,833 931 1,478 3,206 924 1,676
Model changeover ...................................... 7 9 13 1,735 2,392 4,842 1,116 3,484 7,721 Natural disaster ........................................... ( 2 ) ( 2 ) 4 ( 2 ) ( 2 ) 620 ( 2 ) ( 2 ) 574 Non-natural disaster ................................... ( 3 ) ( 3 ) 15 ( 3 ) ( 3 ) 3,521 ( 3 ) ( 3 ) 2,227 Overseas relocation .................................... 34 43 79 5,683 9,054 15,693 4,456 8,385 12,926 Plant or machine repair ............................... 14 19 26 1,634 3,090 3,713 1,577 2,538 4,967 Product line discontinued ............................ 35 30 41 5,467 4,719 10,009 6,879 6,173 9,207 Reorganization within company .................. 453 415 752 95,122 103,120 155,691 92,510 87,978 143,122 Seasonal work ............................................ 2,357 2,436 2,288 491,877 511,539 498,441 374,141 394,925 376,985 Slack work .................................................. 592 619 1,953 80,737 99,265 326,031 105,193 136,703 419,245 Vacation period ........................................... 119 84 126 28,009 13,687 24,061 19,405 12,487 19,310 Weather-related .......................................... 118 66 43 14,194 6,362 4,488 12,637 7,294 5,987 Other ........................................................... 176 160 416 30,844 29,234 87,989 28,482 27,960 93,488 Not reported ................................................ 269 273 282 43,521 51,845 51,572 42,682 51,284 53,992
Internal company restructuring4 …………… 953 1,004 1,926 251,585 254,023 500,487 179,299 178,481 388,182
Layoff events SeparationsReason for layoff
1 See footnote 1, table 1.
2 Data do not meet BLS or State agency disclosure standards.3 Non-natural disaster was added as a reason for layoff in the third
quarter of 2001 in order to be able to identify layoffs directly or
indirectly related to the September 11 attacks.4 Internal company restructuring consists of bankruptcy, business
ownership change, financial difficulty, and reorganization withincompany.

��
Table 6. Over-the-year change in separations by reason for layoff, 1999–2000 and 2000–2001
Level change Percent change Level change Percent change
Total, all reasons1 ............................................................ 21,160 1.8 580,216 49.6
Automation ................................................................................ ( 2 ) ( 2 ) ( 2 ) ( 2 )Bankruptcy ................................................................................. 5,933 11.9 79,796 143.6 Business ownership change ...................................................... -24,398 -42.6 22,479 68.3 Contract cancellation ................................................................. 831 6.2 16,560 116.1 Contract completion ................................................................... 1,861 1.5 3,276 2.7 Domestic relocation ................................................................... 1,565 15.8 7,164 62.4 Energy-related……………………………………………………… -677 -21.4 3,000 120.6 Environment-related………………………………………………… -2,252 -66.4 -697 -61.0 Financial difficulty ...................................................................... 12,905 26.1 91,618 146.8 Import competition ..................................................................... -13,268 -49.7 14,592 108.8 Labor dispute ............................................................................. 3,211 22.1 -10,218 -57.6 Material shortage ....................................................................... -902 -49.2 547 58.8
Model changeover ..................................................................... 657 37.9 2,450 102.4 Natural disaster .......................................................................... ( 2 ) ( 2 ) ( 2 ) ( 2 )Non-natural disaster .................................................................. ( 3 ) ( 3 ) ( 3 ) ( 3 )Overseas relocation ................................................................... 3,371 59.3 6,639 73.3 Plant or machine repair ............................................................. 1,456 89.1 623 20.2 Product line discontinued .......................................................... -748 -13.7 5,290 112.1 Reorganization within company ................................................. 7,998 8.4 52,571 51.0 Seasonal work ........................................................................... 19,662 4.0 -13,098 -2.6 Slack work ................................................................................. 18,528 22.9 226,766 228.4 Vacation period .......................................................................... -14,322 -51.1 10,374 75.8 Weather-related ......................................................................... -7,832 -55.2 -1,874 -29.5 Other .......................................................................................... -1,610 -5.2 58,755 201.0 Not reported ............................................................................... 8,324 19.1 -273 -.5
Internal company restructuring4 …………………………………… 2,438 1.0 246,464 97.0
1999-2000 2000-2001Reason for layoff
Separations
1 See footnote 1, table 1. 2 Data do not meet BLS or State agency disclosure standards.
3 Non-natural disaster was added as a reason for layoff in the thirdquarter of 2001 in order to be able to identify layoffs directly or
indirectly related to the September 11 attacks.4 Internal company restructuring consists of bankruptcy, business
ownership change, financial difficulty, and reorganization within company.

��
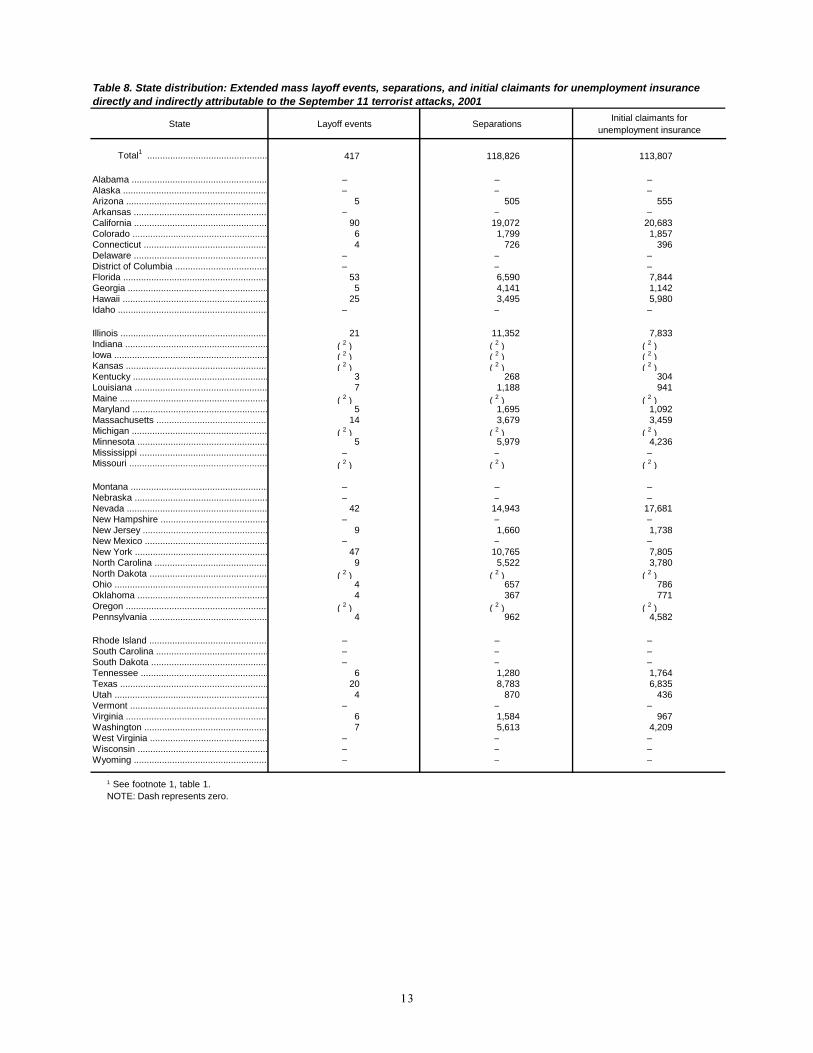
Table 7. Extended mass layoff events, separations, and initial claimants for unemployment insurance directly and indirectly related to the September 11 terrorist attacks, 2001
Measure Layoff events SeparationsInitial claimants for
unemployment insurance
Total1 ........................................................................... 417 118,826 113,807
Industry
Total private ...................................................................... 415 118,426 113,561
Construction ……………………………………………………… 6 627 738 Manufacturing …………………………………………………… 54 16,870 17,206 Wholesale trade ………………………………………………… ( 2 ) ( 2 ) ( 2 )Retail trade ……………………………………………………… 7 962 1,366 Transportation and warehousing ……………………………… 99 51,382 40,256 Information ……………………………………………………… 6 915 3,031 Finance and insurance ………………………………………… 6 954 1,002 Real estate and rental and leasing …………………………… 11 1,325 1,031 Professional and technical services …………………………… 3 380 203 Management of companies and enterprises ………………… 3 634 651 Administrative and waste services …………………………… 40 5,071 4,839 Health care and social assistance ……………………………… ( 2 ) ( 2 ) ( 2 )Arts, entertainment, and recreation …………………………… 4 635 370 Accommodation and food services …………………………… 164 36,988 40,968 Other services, except public administration ………………… 4 819 624 Unclassified ……………………………………………………… 5 569 1,007
Government …………………………………………………… 2 400 246
Reason for layoff3
Directly related to the September 11 terrorist attacks ……… 9 2,411 1,245
Indirectly related to the September 11 terrorist attacks ……… 408 116,415 112,562 Bankruptcy .......................................................................... ( 2 ) ( 2 ) ( 2 ) Business ownership change ............................................... ( 2 ) ( 2 ) ( 2 ) Contract cancellation .......................................................... 17 2,609 2,364 Financial difficulty ............................................................... 65 24,987 18,750 Material shortage ................................................................ ( 2 ) ( 2 ) ( 2 ) Reorganization within company .......................................... 8 1,297 1,177 Seasonal work .................................................................... 11 1,861 1,634 Slack work .......................................................................... 277 67,977 75,586 Other ................................................................................... 24 15,033 11,072
1 See footnote 1, table 1.2 Data do not meet BLS or State agency disclosure standards.3 Layoffs directly related to September 11 encompass those that oc-
curred in the affected local economies. Layoffs indirectly related to Septem-
ber 11 involve those outside of the directly impacted areas. For indirectlyrelated layoffs, the primary reason for layoff is attributed to somethingother than non-natural disaster.
��
Table 8. State distribution: Extended mass layoff events, separations, and initial claimants for unemployment insurancedirectly and indirectly attributable to the September 11 terrorist attacks, 2001
State Layoff events SeparationsInitial claimants for
unemployment insurance
Total1 ............................................... 417 118,826 113,807
Alabama ..................................................... – – –Alaska ......................................................... – – –Arizona ....................................................... 5 505 555 Arkansas .................................................... – – –California .................................................... 90 19,072 20,683 Colorado ..................................................... 6 1,799 1,857 Connecticut ................................................ 4 726 396 Delaware .................................................... – – –District of Columbia .................................... – – –Florida ......................................................... 53 6,590 7,844 Georgia ....................................................... 5 4,141 1,142 Hawaii ......................................................... 25 3,495 5,980 Idaho ........................................................... – – –
Illinois .......................................................... 21 11,352 7,833 Indiana ........................................................ ( 2 ) ( 2 ) ( 2 )Iowa ............................................................ ( 2 ) ( 2 ) ( 2 )Kansas ....................................................... ( 2 ) ( 2 ) ( 2 )Kentucky ..................................................... 3 268 304 Louisiana .................................................... 7 1,188 941 Maine .......................................................... ( 2 ) ( 2 ) ( 2 )Maryland ..................................................... 5 1,695 1,092 Massachusetts ............................................ 14 3,679 3,459 Michigan ..................................................... ( 2 ) ( 2 ) ( 2 )Minnesota ................................................... 5 5,979 4,236 Mississippi .................................................. – – –Missouri ...................................................... ( 2 ) ( 2 ) ( 2 )
Montana ...................................................... – – –Nebraska .................................................... – – –Nevada ....................................................... 42 14,943 17,681 New Hampshire .......................................... – – –New Jersey ................................................. 9 1,660 1,738 New Mexico ................................................ – – –New York .................................................... 47 10,765 7,805 North Carolina ............................................ 9 5,522 3,780 North Dakota .............................................. ( 2 ) ( 2 ) ( 2 )Ohio ............................................................ 4 657 786 Oklahoma ................................................... 4 367 771 Oregon ........................................................ ( 2 ) ( 2 ) ( 2 )Pennsylvania .............................................. 4 962 4,582
Rhode Island .............................................. – – –South Carolina ............................................ – – –South Dakota .............................................. – – –Tennessee .................................................. 6 1,280 1,764 Texas .......................................................... 20 8,783 6,835 Utah ............................................................ 4 870 436 Vermont ...................................................... – – –Virginia ....................................................... 6 1,584 967 Washington ................................................ 7 5,613 4,209 West Virginia .............................................. – – –Wisconsin ................................................... – – –Wyoming .................................................... – – –
11 See footnote 1, table 1.NOTE: Dash represents zero.

��
Table 9. Distribution of extended mass layoff events and separations by size of layoff, 2000 and 2001
2000 2001 2000 2001 2000 2001 2000 2001
Total2…………… 5,620 8,352 100.0 100.0 1,170,427 1,750,643 100.0 100.0
50-99…………………… 1,981 2,895 35.2 34.7 141,560 203,805 12.1 11.6 100-149………………… 1,264 1,919 22.5 23.0 147,698 222,782 12.6 12.7 150-199………………… 685 1,035 12.2 12.4 114,052 172,344 9.7 9.8 200-299………………… 752 1,163 13.4 13.9 174,251 268,465 14.9 15.3 300-499………………… 549 778 9.8 9.3 196,220 282,961 16.8 16.2 500-999………………… 270 382 4.8 4.6 176,004 247,172 15.0 14.1 1,000 or more…………… 119 180 2.1 2.2 220,642 353,114 18.9 20.2
1 Due to rounding, sums of individual percentages may not equal 100.0 percent. 2 See footnote 1, table 1.
Number of workers
Separations
Number Percent1Number
Layoff events
Percent1
��
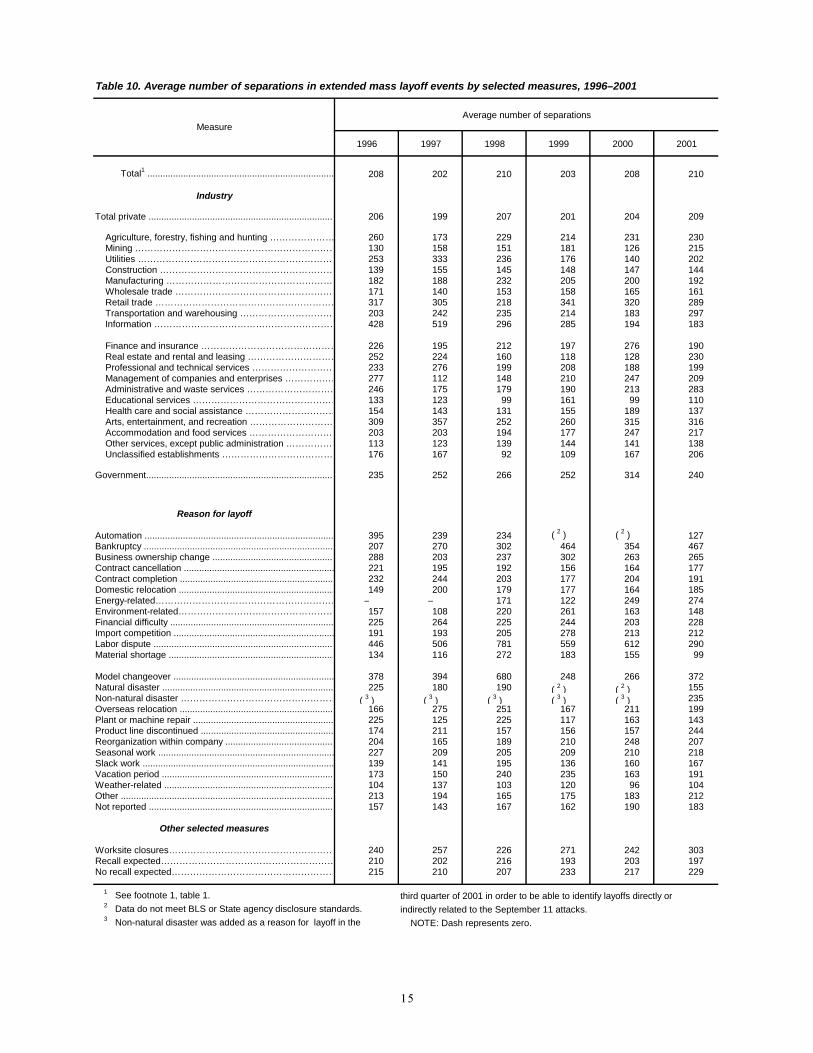
Table 10. Average number of separations in extended mass layoff events by selected measures, 1996–2001
Average number of separations
1996 1997 1998 1999 2000 2001
Total1 ......................................................................... 208 202 210 203 208 210
Industry
Total private ......................................................................... 206 199 207 201 204 209
Agriculture, forestry, fishing and hunting ………………… 260 173 229 214 231 230 Mining ………………………………………………………… 130 158 151 181 126 215 Utilities ………………………………………………………… 253 333 236 176 140 202 Construction ………………………………………………… 139 155 145 148 147 144 Manufacturing ………………………………………………… 182 188 232 205 200 192 Wholesale trade ……………………………………………… 171 140 153 158 165 161 Retail trade …………………………………………………… 317 305 218 341 320 289 Transportation and warehousing …………………………… 203 242 235 214 183 297 Information …………………………………………………… 428 519 296 285 194 183
Finance and insurance ……………………………………… 226 195 212 197 276 190 Real estate and rental and leasing ………………………… 252 224 160 118 128 230 Professional and technical services ……………………… 233 276 199 208 188 199 Management of companies and enterprises ……………… 277 112 148 210 247 209 Administrative and waste services ………………………… 246 175 179 190 213 283 Educational services ………………………………………… 133 123 99 161 99 110 Health care and social assistance ………………………… 154 143 131 155 189 137 Arts, entertainment, and recreation ……………………… 309 357 252 260 315 316 Accommodation and food services ………………………… 203 203 194 177 247 217 Other services, except public administration ……………… 113 123 139 144 141 138 Unclassified establishments ……………………………… 176 167 92 109 167 206
Government.......................................................................... 235 252 266 252 314 240
Reason for layoff
Automation .......................................................................... 395 239 234 ( 2 ) ( 2 ) 127 Bankruptcy ........................................................................... 207 270 302 464 354 467 Business ownership change ................................................ 288 203 237 302 263 265 Contract cancellation ........................................................... 221 195 192 156 164 177 Contract completion ............................................................ 232 244 203 177 204 191 Domestic relocation ............................................................. 149 200 179 177 164 185 Energy-related…………………………………………………… – – 171 122 249 274 Environment-related…………………………………………… 157 108 220 261 163 148 Financial difficulty ................................................................ 225 264 225 244 203 228 Import competition ............................................................... 191 193 205 278 213 212 Labor dispute ....................................................................... 446 506 781 559 612 290 Material shortage ................................................................. 134 116 272 183 155 99
Model changeover ............................................................... 378 394 680 248 266 372 Natural disaster ................................................................... 225 180 190 ( 2 ) ( 2 ) 155 Non-natural disaster …………………………………………… ( 3 ) ( 3 ) ( 3 ) ( 3 ) ( 3 ) 235 Overseas relocation ............................................................. 166 275 251 167 211 199 Plant or machine repair ....................................................... 225 125 225 117 163 143 Product line discontinued .................................................... 174 211 157 156 157 244 Reorganization within company ........................................... 204 165 189 210 248 207 Seasonal work ..................................................................... 227 209 205 209 210 218 Slack work ........................................................................... 139 141 195 136 160 167 Vacation period .................................................................... 173 150 240 235 163 191 Weather-related ................................................................... 104 137 103 120 96 104 Other .................................................................................... 213 194 165 175 183 212 Not reported ......................................................................... 157 143 167 162 190 183
Other selected measures
Worksite closures……………………………………………… 240 257 226 271 242 303 Recall expected………………………………………………… 210 202 216 193 203 197 No recall expected……………………………………………… 215 210 207 233 217 229
1 See footnote 1, table 1. third quarter of 2001 in order to be able to identify layoffs directly or2 Data do not meet BLS or State agency disclosure standards. indirectly related to the September 11 attacks.3 Non-natural disaster was added as a reason for layoff in the NOTE: Dash represents zero.
Measure
��
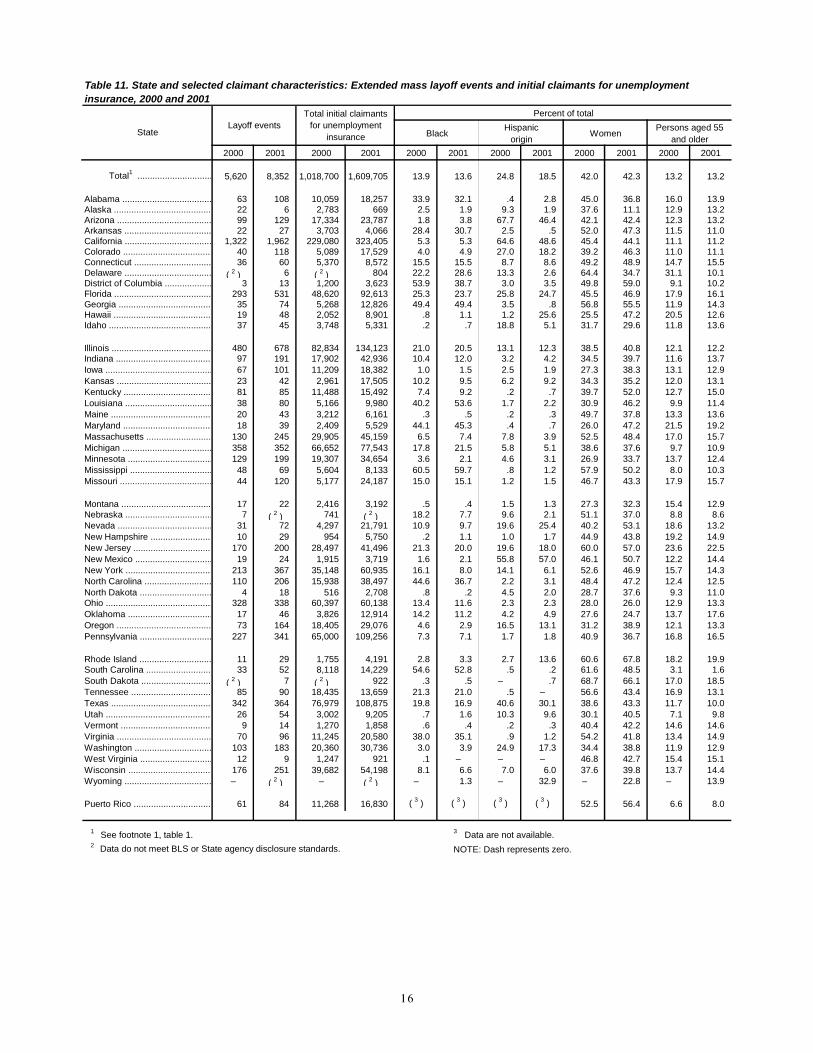
Table 11. State and selected claimant characteristics: Extended mass layoff events and initial claimants for unemploymentinsurance, 2000 and 2001
Percent of total
BlackHispanic
originWomen
Persons aged 55and older
2000 2001 2000 2001 2000 2001 2000 2001 2000 2001 2000 2001
Total1 .............................. 5,620 8,352 1,018,700 1,609,705 13.9 13.6 24.8 18.5 42.0 42.3 13.2 13.2
Alabama .................................... 63 108 10,059 18,257 33.9 32.1 .4 2.8 45.0 36.8 16.0 13.9 Alaska ....................................... 22 6 2,783 669 2.5 1.9 9.3 1.9 37.6 11.1 12.9 13.2 Arizona ...................................... 99 129 17,334 23,787 1.8 3.8 67.7 46.4 42.1 42.4 12.3 13.2 Arkansas ................................... 22 27 3,703 4,066 28.4 30.7 2.5 .5 52.0 47.3 11.5 11.0 California ................................... 1,322 1,962 229,080 323,405 5.3 5.3 64.6 48.6 45.4 44.1 11.1 11.2 Colorado .................................... 40 118 5,089 17,529 4.0 4.9 27.0 18.2 39.2 46.3 11.0 11.1 Connecticut ............................... 36 60 5,370 8,572 15.5 15.5 8.7 8.6 49.2 48.9 14.7 15.5 Delaware ................................... ( 2 ) 6 ( 2 ) 804 22.2 28.6 13.3 2.6 64.4 34.7 31.1 10.1 District of Columbia ................... 3 13 1,200 3,623 53.9 38.7 3.0 3.5 49.8 59.0 9.1 10.2 Florida ....................................... 293 531 48,620 92,613 25.3 23.7 25.8 24.7 45.5 46.9 17.9 16.1 Georgia ..................................... 35 74 5,268 12,826 49.4 49.4 3.5 .8 56.8 55.5 11.9 14.3 Hawaii ....................................... 19 48 2,052 8,901 .8 1.1 1.2 25.6 25.5 47.2 20.5 12.6 Idaho ......................................... 37 45 3,748 5,331 .2 .7 18.8 5.1 31.7 29.6 11.8 13.6
Illinois ........................................ 480 678 82,834 134,123 21.0 20.5 13.1 12.3 38.5 40.8 12.1 12.2 Indiana ....................................... 97 191 17,902 42,936 10.4 12.0 3.2 4.2 34.5 39.7 11.6 13.7 Iowa ........................................... 67 101 11,209 18,382 1.0 1.5 2.5 1.9 27.3 38.3 13.1 12.9 Kansas ...................................... 23 42 2,961 17,505 10.2 9.5 6.2 9.2 34.3 35.2 12.0 13.1 Kentucky ................................... 81 85 11,488 15,492 7.4 9.2 .2 .7 39.7 52.0 12.7 15.0 Louisiana ................................... 38 80 5,166 9,980 40.2 53.6 1.7 2.2 30.9 46.2 9.9 11.4 Maine ......................................... 20 43 3,212 6,161 .3 .5 .2 .3 49.7 37.8 13.3 13.6 Maryland .................................... 18 39 2,409 5,529 44.1 45.3 .4 .7 26.0 47.2 21.5 19.2 Massachusetts .......................... 130 245 29,905 45,159 6.5 7.4 7.8 3.9 52.5 48.4 17.0 15.7 Michigan .................................... 358 352 66,652 77,543 17.8 21.5 5.8 5.1 38.6 37.6 9.7 10.9 Minnesota .................................. 129 199 19,307 34,654 3.6 2.1 4.6 3.1 26.9 33.7 13.7 12.4 Mississippi ................................. 48 69 5,604 8,133 60.5 59.7 .8 1.2 57.9 50.2 8.0 10.3 Missouri ..................................... 44 120 5,177 24,187 15.0 15.1 1.2 1.5 46.7 43.3 17.9 15.7
Montana .................................... 17 22 2,416 3,192 .5 .4 1.5 1.3 27.3 32.3 15.4 12.9 Nebraska ................................... 7 ( 2 ) 741 ( 2 ) 18.2 7.7 9.6 2.1 51.1 37.0 8.8 8.6 Nevada ...................................... 31 72 4,297 21,791 10.9 9.7 19.6 25.4 40.2 53.1 18.6 13.2 New Hampshire ......................... 10 29 954 5,750 .2 1.1 1.0 1.7 44.9 43.8 19.2 14.9 New Jersey ................................ 170 200 28,497 41,496 21.3 20.0 19.6 18.0 60.0 57.0 23.6 22.5 New Mexico ............................... 19 24 1,915 3,719 1.6 2.1 55.8 57.0 46.1 50.7 12.2 14.4 New York ................................... 213 367 35,148 60,935 16.1 8.0 14.1 6.1 52.6 46.9 15.7 14.3 North Carolina ........................... 110 206 15,938 38,497 44.6 36.7 2.2 3.1 48.4 47.2 12.4 12.5 North Dakota ............................. 4 18 516 2,708 .8 .2 4.5 2.0 28.7 37.6 9.3 11.0 Ohio ........................................... 328 338 60,397 60,138 13.4 11.6 2.3 2.3 28.0 26.0 12.9 13.3 Oklahoma .................................. 17 46 3,826 12,914 14.2 11.2 4.2 4.9 27.6 24.7 13.7 17.6 Oregon ...................................... 73 164 18,405 29,076 4.6 2.9 16.5 13.1 31.2 38.9 12.1 13.3 Pennsylvania ............................. 227 341 65,000 109,256 7.3 7.1 1.7 1.8 40.9 36.7 16.8 16.5
Rhode Island ............................. 11 29 1,755 4,191 2.8 3.3 2.7 13.6 60.6 67.8 18.2 19.9 South Carolina .......................... 33 52 8,118 14,229 54.6 52.8 .5 .2 61.6 48.5 3.1 1.6 South Dakota ............................ ( 2 ) 7 ( 2 ) 922 .3 .5 – .7 68.7 66.1 17.0 18.5 Tennessee ................................ 85 90 18,435 13,659 21.3 21.0 .5 – 56.6 43.4 16.9 13.1 Texas ........................................ 342 364 76,979 108,875 19.8 16.9 40.6 30.1 38.6 43.3 11.7 10.0 Utah ........................................... 26 54 3,002 9,205 .7 1.6 10.3 9.6 30.1 40.5 7.1 9.8 Vermont ..................................... 9 14 1,270 1,858 .6 .4 .2 .3 40.4 42.2 14.6 14.6 Virginia ...................................... 70 96 11,245 20,580 38.0 35.1 .9 1.2 54.2 41.8 13.4 14.9 Washington ............................... 103 183 20,360 30,736 3.0 3.9 24.9 17.3 34.4 38.8 11.9 12.9 West Virginia ............................. 12 9 1,247 921 .1 – – – 46.8 42.7 15.4 15.1 Wisconsin .................................. 176 251 39,682 54,198 8.1 6.6 7.0 6.0 37.6 39.8 13.7 14.4 Wyoming ................................... – ( 2 ) – ( 2 ) – 1.3 – 32.9 – 22.8 – 13.9
Puerto Rico ............................... 61 84 11,268 16,830 ( 3 ) ( 3 ) ( 3 ) ( 3 ) 52.5 56.4 6.6 8.0
1 See footnote 1, table 1. 3 Data are not available.
2 Data do not meet BLS or State agency disclosure standards. NOTE: Dash represents zero.
Layoff eventsState
Total initial claimants for unemployment
insurance

��
Table 12. Claimant characteristics by race and ethnicity: Percent of initial claimants for unemployment insurance,2000 and 2001
Percent of total race/ethnicity1
White BlackHispanic
originAmerican Indian or
Alaskan NativeAsian or Pacific
Islander
2000 2001 2000 2001 2000 2001 2000 2001 2000 2001
Total2 .......................................................... 53.6 55.0 13.9 13.6 24.8 18.5 .8 .7 1.8 3.4
Industry
Total private ........................................................... 54.1 55.5 13.0 13.0 25.5 18.7 .5 .6 1.9 3.5
Agriculture, forestry, fishing and hunting ……… 3.1 3.0 2.2 2.1 87.3 87.8 .1 .1 1.1 .9 Mining ……………………………………………… 85.3 86.3 4.0 3.6 4.6 4.4 1.3 1.3 .6 .2 Utilities ……………………………………………… 77.8 76.7 12.1 10.7 5.5 7.5 .6 .2 1.2 1.8 Construction ……………………………………… 78.0 79.2 6.4 5.8 12.2 9.3 .6 .8 .4 .7 Manufacturing ……………………………………… 62.6 61.4 12.9 12.6 16.6 12.5 .6 .6 2.7 4.2 Wholesale trade …………………………………… 51.6 51.7 10.2 10.8 30.8 22.3 .7 .5 3.6 5.0 Retail trade ………………………………………… 59.3 56.6 17.5 15.8 15.7 17.1 .6 .7 1.4 2.3 Transportation and warehousing ………………… 63.4 58.7 18.6 17.0 9.9 9.5 .6 .4 1.1 2.8 Information ………………………………………… 65.5 61.8 15.3 14.3 7.7 8.9 .5 .8 3.0 3.8
Finance and insurance …………………………… 52.8 47.1 21.3 19.9 12.8 10.1 .6 .3 3.4 4.0 Real estate and rental and leasing ……………… 48.8 41.6 31.3 23.2 12.1 13.7 .2 .4 1.4 2.0 Professional and technical services …………… 72.9 66.8 13.3 12.6 8.8 7.9 .4 .5 1.5 5.2 Management of companies and enterprises …… 46.0 49.0 25.6 19.7 18.3 17.4 .3 .7 3.5 5.3 Administrative and waste services ……………… 46.2 47.6 22.2 20.2 24.1 20.3 .5 .6 1.5 3.1 Educational services ……………………………… 52.2 50.4 20.1 31.0 8.6 8.4 6.6 .6 .9 3.1 Health care and social assistance ……………… 40.8 38.6 26.5 26.1 25.6 27.1 .4 .6 1.5 1.9 Arts, entertainment, and recreation ……………… 67.0 64.6 10.6 8.8 12.4 13.5 .4 .8 1.4 1.6 Accommodation and food services ……………… 60.9 44.0 18.4 15.0 13.0 20.4 1.0 .6 2.2 7.3 Other services, except public administration …… 51.1 47.2 23.1 28.0 17.4 14.2 1.3 .5 2.0 2.0
Unclassified establishments ……………………… 69.5 54.3 15.5 18.3 5.3 6.1 1.0 .6 2.0 1.9
Government …………………………………………… 42.4 39.9 32.4 31.6 10.6 9.9 6.9 5.4 .9 1.2
Reason for layoff
Automation …………………………………………… 57.0 57.6 15.0 12.7 14.5 23.1 3.4 .1 6.5 .9 Bankruptcy …………………………………………… 64.3 61.2 17.2 15.6 12.7 13.3 .5 .8 1.8 3.1 Business ownership change ………………………… 49.4 60.5 12.3 10.5 25.9 13.1 .5 .5 4.0 5.5 Contract cancellation ………………………………… 56.2 52.6 17.6 24.1 17.5 12.2 1.0 1.4 1.9 3.4 Contract completion ………………………………… 55.5 60.1 18.7 16.7 20.2 13.9 1.1 .8 1.3 1.8 Domestic relocation ............................................... 46.4 56.9 18.5 15.0 21.0 13.7 .7 .6 3.2 4.4 Energy-related………………………………………… 78.3 57.7 5.9 7.6 7.6 22.8 .9 1.5 1.2 1.6 Environment-related………………………………… 67.3 48.0 10.3 1.7 20.2 39.2 .6 1.7 .1 .7 Financial difficulty .................................................. 54.2 52.6 16.2 15.0 18.8 13.0 .6 .6 3.1 4.4 Import competition ................................................. 59.6 58.1 32.5 17.3 2.5 17.4 .6 .5 1.5 1.9 Labor dispute ......................................................... 87.3 73.6 6.5 7.5 2.2 8.7 .2 .3 .6 .7
Material shortage ................................................... 64.5 57.4 2.8 9.2 24.2 16.3 .4 .7 1.8 4.7 Model changeover ................................................. 29.9 65.7 16.6 16.1 5.5 5.3 .5 1.7 3.6 2.6 Natural disaster ..................................................... 13.0 57.7 – 13.6 1.0 1.2 – – 82.0 5.6 Non-natural disaster ………………………………… ( 3 ) 16.6 ( 3 ) 3.8 ( 3 ) 23.0 ( 3 ) .1 ( 3 ) .7 Overseas relocation ............................................... 71.4 54.4 15.4 15.0 7.6 14.6 .4 .3 2.4 5.7 Plant or machine repair ......................................... 75.8 68.4 11.9 11.7 7.5 13.0 .3 .4 .8 2.7 Product line discontinued ...................................... 53.1 64.7 17.2 19.0 7.2 10.0 .6 .8 5.4 2.4 Reorganization within company ............................. 59.9 55.8 16.6 17.3 13.6 12.9 .8 .7 3.0 3.9 Seasonal work ....................................................... 41.4 42.6 10.4 11.4 40.9 37.2 .9 .9 1.2 1.0 Slack work ............................................................. 69.7 63.5 12.4 10.3 11.1 11.7 .8 .6 2.4 4.9 Vacation period ...................................................... 45.4 53.8 14.3 17.3 31.5 15.2 1.1 .3 1.7 1.1 Weather-related ..................................................... 75.3 72.2 4.1 5.3 15.1 16.6 .7 .5 .2 .3 Other ...................................................................... 51.4 48.5 20.1 16.3 19.4 15.8 .5 .8 1.9 6.2 Not reported ........................................................... 70.7 60.9 19.1 20.3 5.4 7.1 .5 1.0 2.3 4.2
Measure
1 Characteristic totals may not add to 100.0 percent due to somenonreporting.
2 See footnote 1, table 1.3 Non-natural disaster was added as a reason for layoff in the third
quarter of 2001 in order to be able to identify layoffs directly or indirectlyrelated to the September 11 attacks.
NOTE: Dash represents zero.

��
Table 13. Claimant characteristics by age and gender: Percent of initial claimants for unemployment insurance, 2000 and 2001
Percent of total by gender1
Measure Under than 30 years 30 to 44 years 45 to 54 years 55 or older Men Women
2000 2001 2000 2001 2000 2001 2000 2001 2000 2001 2000 2001
Total2 ......................................................... 20.6 20.2 41.1 40.7 23.4 24.0 13.2 13.2 57.5 56.9 42.0 42.3
Industry
Total private .......................................................... 20.7 20.2 41.2 40.7 23.4 24.1 13.1 13.1 58.5 57.5 41.1 41.7
Agriculture, forestry, fishing and hunting ……… 23.6 23.0 45.4 45.0 19.3 19.8 11.3 11.8 65.4 63.8 34.4 36.0 Mining ……………………………………………… 16.0 12.1 39.9 33.1 29.4 39.8 14.2 14.6 92.1 94.4 7.1 5.5 Utilities …………………………………………… 11.2 11.2 38.2 42.9 35.3 34.5 14.7 11.3 70.8 70.7 28.7 29.2 Construction ……………………………………… 20.2 19.4 44.1 43.3 23.2 24.5 11.2 11.5 92.8 92.6 6.5 6.4 Manufacturing …………………………………… 16.4 16.1 40.5 40.3 27.1 27.5 13.9 13.8 59.9 60.5 39.8 38.5 Wholesale trade ………………………………… 17.8 18.3 43.5 44.6 25.0 23.4 12.4 12.9 59.0 57.3 40.9 42.3 Retail trade ………………………………………… 34.0 31.3 35.8 35.3 17.7 19.2 11.9 13.0 37.6 40.3 62.1 59.2 Transportation and warehousing ……………… 14.8 18.6 38.5 42.2 23.7 22.3 19.7 15.0 51.2 47.4 48.3 52.2 Information ………………………………………… 28.2 24.2 41.6 44.3 20.4 20.9 9.0 9.8 44.9 51.4 54.6 48.3 Finance and insurance …………………………… 26.3 25.1 42.0 43.2 20.1 19.0 10.4 10.5 28.8 39.1 71.0 60.6
Real estate and rental and leasing ……………… 29.8 27.1 38.4 40.9 18.2 17.9 10.1 9.7 59.0 59.8 40.8 40.0 Professional and technical services …………… 18.6 23.2 35.8 40.1 23.2 20.9 21.3 14.6 43.8 51.3 55.7 48.3 Management of companies and enterprises … 25.0 25.8 44.5 40.6 20.2 19.6 9.8 13.4 38.5 37.7 61.4 62.2 Administrative and waste services ……………… 29.9 30.8 41.6 39.5 18.6 18.3 8.4 9.7 52.5 52.5 46.4 46.3 Educational services …………………………… 17.5 18.4 32.7 38.8 26.2 25.7 21.2 15.7 29.4 36.3 70.2 63.4 Health care and social assistance ……………… 17.9 17.6 43.9 43.1 23.5 23.4 12.8 13.8 14.2 12.3 85.6 87.5 Arts, entertainment, and recreation …………… 23.0 24.9 31.4 31.0 18.1 19.3 22.6 20.1 52.3 53.1 47.0 46.0 Accommodation and food services …………… 16.4 18.6 38.0 40.3 22.9 22.7 20.2 15.9 33.2 39.6 66.3 59.9 Other services, except public administration … 17.6 18.5 41.0 39.2 23.2 23.7 14.5 13.6 29.8 32.5 70.1 67.3 Unclassified establishments …………………… 22.6 20.3 43.7 42.1 23.5 23.6 10.0 12.0 60.2 58.2 39.4 39.7
Government ………………………………………… 18.9 20.7 39.4 38.8 23.4 22.7 15.0 14.5 37.4 36.1 62.0 63.4
Reason for layoff
Automation ........................................................... 12.8 17.4 41.4 45.2 26.8 25.1 19.0 11.8 45.9 46.6 54.1 53.0 Bankruptcy ............................................................ 20.2 18.1 39.1 36.8 24.3 28.2 15.9 15.6 53.8 57.2 46.0 41.8 Business ownership change ................................. 17.3 18.2 41.1 39.7 25.3 26.4 15.7 14.8 48.5 53.4 51.2 46.3 Contract cancellation ............................................ 23.4 29.9 41.6 39.0 22.2 19.6 11.2 10.7 57.8 50.5 42.0 48.9 Contract completion ............................................. 23.7 22.0 41.6 40.4 21.6 22.9 11.3 12.0 67.2 68.2 31.6 30.3 Domestic relocation .............................................. 26.4 22.8 41.5 39.7 21.8 24.4 10.0 12.7 42.9 49.5 57.1 50.2 Energy-related………………………………………… 23.6 21.8 41.9 38.1 24.7 26.4 9.7 13.4 82.1 77.8 17.8 22.0 Environment-related………………………………… 24.5 14.8 31.6 34.1 20.9 33.4 22.8 16.9 78.7 80.6 21.3 19.3 Financial difficulty ................................................. 20.3 20.6 39.3 41.0 24.0 24.2 14.5 12.6 54.1 56.2 45.6 43.6 Import competition ................................................ 13.9 12.1 37.1 37.1 26.6 32.1 14.3 16.8 40.9 55.8 59.0 43.9 Labor dispute ........................................................ 14.3 11.5 40.3 39.1 32.5 32.7 12.7 15.6 61.4 66.5 38.4 33.1 Material shortage .................................................. 18.1 16.0 49.6 45.0 21.9 27.4 10.2 11.1 56.2 71.3 43.6 28.3
Model changeover ................................................ 8.8 6.1 35.4 28.4 39.3 44.0 15.8 21.2 76.3 35.8 23.4 16.5 Natural disaster .................................................... 6.0 17.1 36.0 43.7 27.0 26.3 31.0 12.9 61.0 62.5 39.0 37.5 Non-natural disaster ………………………………… ( 3 ) 18.3 ( 3 ) 34.8 ( 3 ) 22.9 ( 3 ) 11.7 ( 3 ) 62.2 ( 3 ) 37.8 Overseas relocation ............................................. 11.4 13.1 41.7 40.6 29.7 29.1 16.3 16.5 42.8 40.1 57.0 59.6 Plant or machine repair ........................................ 13.2 14.8 42.1 42.4 27.5 27.7 16.5 13.2 55.8 63.6 43.3 34.7 Product line discontinued ..................................... 15.0 16.0 38.3 34.7 31.7 20.4 13.5 10.0 56.8 53.7 43.1 45.9 Reorganization within company ............................ 20.1 22.4 41.2 41.1 25.1 23.4 12.4 12.0 50.3 52.5 49.3 47.2 Seasonal work ...................................................... 20.7 20.5 41.7 40.6 21.6 22.3 14.3 15.0 56.3 55.4 43.4 44.3 Slack work ............................................................ 19.3 19.5 39.0 41.6 26.6 25.3 12.0 12.3 64.7 59.2 34.5 40.2 Vacation period .................................................... 16.7 10.3 42.8 36.4 23.8 25.3 16.5 22.4 24.0 34.4 76.0 65.5 Weather-related .................................................... 21.3 21.7 47.2 42.9 21.3 23.8 9.9 11.2 88.8 85.4 10.3 13.7 Other ..................................................................... 22.0 21.5 39.9 43.5 22.5 21.8 13.4 10.5 50.5 57.7 49.1 42.0 Not reported .......................................................... 22.2 22.6 44.3 40.6 22.4 20.0 9.9 10.0 57.1 51.9 42.7 47.8
Percent of total by age1
1 Characteristic totals may not add to 100.0 percent due to somenonreporting.
2 See footnote 1, table 1.
3 Non-natural disaster was added as a reason for layoff in the third quarterof 2001 in order to be able to identify layoffs directly or indirectly related to theSeptember 11 attacks.

�
Table 14. Claimants for unemployment insurance associated with extended mass layoff events by State, 2001
Number Average number
filed per initial claimant
Number
Percentage of initial claimants receiving final
payments
Total2……………………………………………… 1,609,705 3,415,531 2.1 241,356 15.0
Alabama………………………………………………… 18,257 51,792 2.8 3,231 17.7 Alaska…………………………………………………… 669 560 .8 3 .4 Arizona…………………………………………………… 23,787 54,491 2.3 6,228 26.2 Arkansas………………………………………………… 4,066 8,950 2.2 592 14.6 California………………………………………………… 323,405 733,011 2.3 47,442 14.7 Colorado………………………………………………… 17,529 47,307 2.7 1,934 11.0 Connecticut……………………………………………… 8,572 11,016 1.3 820 9.6 Delaware………………………………………………… 804 1,335 1.7 47 5.8 District of Columbia……………………………………… 3,623 12,052 3.3 642 17.7 Florida…………………………………………………… 92,613 204,959 2.2 20,827 22.5 Georgia…………………………………………………… 12,826 34,479 2.7 4,080 31.8 Hawaii…………………………………………………… 8,901 6,561 .7 283 3.2 Idaho……………………………………………………… 5,331 10,911 2.0 985 18.5
Illinois……………………………………………………… 134,123 346,960 2.6 21,706 16.2 Indiana…………………………………………………… 42,936 85,137 2.0 6,775 15.8 Iowa……………………………………………………… 18,382 30,191 1.6 1,239 6.7 Kansas…………………………………………………… 17,505 35,408 2.0 1,846 10.5 Kentucky………………………………………………… 15,492 4,482 .3 1,715 11.1 Louisiana………………………………………………… 9,980 20,380 2.0 1,953 19.6 Maine……………………………………………………… 6,161 9,590 1.6 884 14.3 Maryland………………………………………………… 5,529 13,210 2.4 374 6.8 Massachusetts…………………………………………… 45,159 99,451 2.2 6,532 14.5 Michigan………………………………………………… 77,543 138,956 1.8 9,557 12.3 Minnesota………………………………………………… 34,654 92,633 2.7 5,161 14.9 Mississippi………………………………………………… 8,133 11,414 1.4 154 1.9 Missouri…………………………………………………… 24,187 44,703 1.8 2,651 11.0
Montana…………………………………………………… 3,192 6,409 2.0 632 19.8 Nebraska………………………………………………… ( 3 ) ( 3 ) 1.0 ( 3 ) .2 Nevada ...................................................................... 21,791 38,489 1.8 1,771 8.1 New Hampshire ......................................................... 5,750 8,767 1.5 563 9.8 New Jersey ................................................................ 41,496 107,688 2.6 8,394 20.2 New Mexico ............................................................... 3,719 10,298 2.8 806 21.7 New York………………………………………………… 60,935 141,960 2.3 7,994 13.1 North Carolina…………………………………………… 38,497 119,662 3.1 9,565 24.8 North Dakota……………………………………………… 2,708 4,854 1.8 460 17.0 Ohio……………………………………………………… 60,138 67,993 1.1 7,856 13.1 Oklahoma………………………………………………… 12,914 25,389 2.0 2,984 23.1 Oregon…………………………………………………… 29,076 42,414 1.5 3,757 12.9 Pennsylvania……………………………………………… 109,256 169,224 1.5 8,737 8.0
Rhode Island……………………………………………… 4,191 6,510 1.6 89 2.1 South Carolina…………………………………………… 14,229 20,913 1.5 1,276 9.0 South Dakota…………………………………………… 922 1,862 2.0 72 7.8 Tennessee……………………………………………… 13,659 44,038 3.2 3,672 26.9 Texas……………………………………………………… 108,875 247,027 2.3 21,008 19.3 Utah……………………………………………………… 9,205 19,397 2.1 996 10.8 Vermont ………………………………………………… 1,858 3,956 2.1 301 16.2 Virginia…………………………………………………… 20,580 39,453 1.9 3,039 14.8 Washington……………………………………………… 30,736 83,074 2.7 3,903 12.7 West Virginia…………………………………………… 921 3,260 3.5 52 5.6 Wisconsin………………………………………………… 54,198 92,439 1.7 5,728 10.6 Wyoming………………………………………………… ( 3 ) ( 3 ) 1.0 ( 3 ) 49.4
Puerto Rico……………………………………………… 16,830 55,243 3.3 2,053 12.2
Continued claims without earnings1
State
Final payments for
unemployment insurance1
Initial claims for unemployment
insurance
1 The MLS program tracks continued claim activity for initialclaimants associated with extended mass layoffs once a monthduring the Current Population Survey (CPS) reference week, which is usually the week including the 12th day of the month. Continuedclaims with earnings are excluded because such individuals are
classified as employed in the CPS. Final payment information for MLS claimants is collected weekly. See appendix B for additionalinformation.
2 See footnote 1, table 1.
3 Data do not meet BLS or State agency disclosure standards.

�
Table 15. Claimants for unemployment insurance associated with extended mass layoff events by industry and reason forlayoff, 2001
Number Average number
filed per initial claimant
Number
Percentage of initial claimants receiving final
payments
Total2…………………………………………………… 1,609,705 3,415,531 2.1 241,356 15.0
Industry
Total private ...................................................................... 1,562,978 3,318,137 2.1 233,002 14.9
Agriculture, forestry, fishing and hunting ………………… 110,907 278,841 2.5 24,027 21.7 Mining ……………………………………………………… 12,476 25,119 2.0 1,291 10.3 Utilities ……………………………………………………… 4,196 8,525 2.0 461 11.0 Construction ………………………………………………… 115,303 202,894 1.8 9,057 7.9 Manufacturing ……………………………………………… 691,184 1,444,836 2.1 109,060 15.8 Wholesale trade …………………………………………… 22,600 62,911 2.8 4,977 22.0 Retail trade ………………………………………………… 103,328 214,121 2.1 17,831 17.3 Transportation and warehousing ………………………… 96,504 207,586 2.2 7,274 7.5 Information ………………………………………………… 56,175 149,615 2.7 9,264 16.5
Finance and insurance …………………………………… 29,631 88,239 3.0 6,302 21.3 Real estate and rental and leasing ……………………… 4,645 9,765 2.1 619 13.3 Professional and technical services ……………………… 40,566 101,656 2.5 8,402 20.7 Management of companies and enterprises …………… 2,831 5,271 1.9 233 8.2 Administrative and waste services ……………………… 132,562 272,062 2.1 21,829 16.5 Educational services ……………………………………… 1,264 2,760 2.2 280 22.2 Health care and social assistance ……………………… 19,370 41,798 2.2 2,111 10.9 Arts, entertainment, and recreation ……………………… 16,710 29,825 1.8 1,800 10.8 Accommodation and food services ……………………… 82,001 131,315 1.6 5,917 7.2 Other services, except public administration …………… 10,462 17,871 1.7 926 8.9
Unclassified establishments ……………………………… 10,263 23,127 2.3 1,341 13.1
Government …………………………………………………… 46,727 97,394 2.1 8,354 17.9
Reason for layoff
Automation ........................................................................ 2,058 3,263 1.6 170 8.3 Bankruptcy ........................................................................ 62,173 169,594 2.7 12,866 20.7 Business ownership change ............................................. 45,014 100,768 2.2 7,431 16.5 Contract cancellation ......................................................... 28,991 68,271 2.4 5,565 19.2 Contract completion .......................................................... 130,163 237,076 1.8 20,403 15.7 Domestic relocation ........................................................... 14,663 37,631 2.6 3,347 22.8 Energy-related………………………………………………… 3,988 13,068 3.3 1,069 26.8 Environment-related…………………………………………… 602 842 1.4 71 11.8 Financial difficulty .............................................................. 137,873 361,387 2.6 25,275 18.3 Import competition ............................................................. 27,237 65,294 2.4 6,077 22.3 Labor dispute .................................................................... 5,516 8,486 1.5 508 9.2 Material shortage ............................................................... 1,676 3,301 2.0 299 17.8
Model changeover ............................................................. 7,721 13,181 1.7 2,163 28.0 Natural disaster ................................................................. 574 940 1.6 10 1.7 Non-natural disaster ………………………………………… 2,227 8,202 3.7 574 25.8 Overseas relocation .......................................................... 12,926 39,351 3.0 4,139 32.0 Plant or machine repair ..................................................... 4,967 7,239 1.5 366 7.4 Product line discontinued .................................................. 9,207 21,769 2.4 2,183 23.7 Reorganization within company ........................................ 143,122 381,478 2.7 30,622 21.4 Seasonal work ................................................................... 376,985 763,982 2.0 52,703 14.0 Slack work ......................................................................... 419,245 760,392 1.8 42,982 10.3 Vacation period ................................................................. 19,310 24,540 1.3 655 3.4 Weather-related ................................................................ 5,987 9,361 1.6 231 3.9 Other ................................................................................. 93,488 216,278 2.3 14,185 15.2 Not reported ...................................................................... 53,992 99,837 1.8 7,462 13.8
Continued claims without earnings1
Measure
Final payments for
unemployment insurance1
Initial claims for unemployment
insurance
1 The MLS program tracks continued claim activity for initialclaimants associated with extended mass layoffs once a monthduring the Current Population Survey (CPS) reference week, whichis usually the week including the 12th day of the month. Continuedclaims with earnings are excluded because such individuals are
classified as employed in the CPS. Final payment information for MLSclaimants is collected weekly. See appendix B for additionalinformation.
2 See footnote 1, table 1.

��
Table 16. Unemployment insurance benefit exhaustion rates by selected claimant characteristics, 2001
CharacteristicInitial claims for
unemployment insuranceFinal payments for
unemployment insurance1Percentage of initial claimants
receiving final payments
Total2 ………………………………… 1,609,705 241,356 15.0
Age
Under 30 years of age ………………… 325,473 44,886 13.8 30 to 44 ………………………………… 654,890 97,561 14.9 45 to 54 ………………………………… 386,747 58,457 15.1 55 years of age or older ……………… 211,845 37,066 17.5 Not available …………………………… 30,750 3,386 11.0
Gender
Male……………………………………… 915,950 123,006 13.4 Female…………………………………… 681,550 115,379 16.9 Not available …………………………… 12,205 2,971 24.3
Race/ethnicity
White……………………………………… 886,093 113,747 12.8 Black …………………………………… 218,430 42,518 19.5 Hispanic origin ………………………… 297,440 52,999 17.8 American Indian or Alaskan Native …… 11,798 1,813 15.4 Asian or Pacific Islander ……………… 54,668 10,295 18.8 Not available …………………………… 141,276 19,984 14.1
1 Final payment information for MLS claimants is collected weekly. See appendix B for additional information.
2 See footnote 1, table 1.

��
Table 17. Census region and division: Extended mass layoff events, separations, and initial claimants for unemploymentinsurance, 1999–2001
Initial claimants for unemployment insurance
1999 2000 2001 1999 2000 2001 1999 2000 2001
United States1 ............................. 5,675 5,620 8,352 1,149,267 1,170,427 1,750,643 972,244 1,018,700 1,609,705
Northeast ............................................... 848 826 1,328 169,040 158,894 257,566 165,293 171,111 283,378
New England ..................................... 207 216 420 57,185 63,343 88,371 32,913 42,466 71,691 Middle Atlantic ................................... 641 610 908 111,855 95,551 169,195 132,380 128,645 211,687
South ..................................................... 1,212 1,271 1,895 229,203 245,099 396,407 213,718 229,395 380,998
South Atlantic .................................... 519 575 1,026 107,574 117,803 202,406 79,072 94,135 189,622 East South Central ............................ 176 277 352 28,885 46,406 65,596 24,548 45,586 55,541 West South Central ........................... 517 419 517 92,744 80,890 128,405 110,098 89,674 135,835
Midwest ................................................. 1,643 1,715 2,301 305,299 348,029 515,218 270,112 307,713 467,909
East North Central ............................. 1,362 1,439 1,810 255,064 300,607 424,477 227,501 267,467 368,938 West North Central ............................ 281 276 491 50,235 47,422 90,741 42,611 40,246 98,971
West ...................................................... 1,972 1,808 2,828 445,725 418,405 581,452 323,121 310,481 477,420
Mountain ............................................ 250 269 465 54,902 54,811 109,423 33,630 37,801 84,633 Pacific ................................................ 1,722 1,539 2,363 390,823 363,594 472,029 289,491 272,680 392,787
Layoff events SeparationsCensus region and division
1 See footnote 1, table 1.NOTE: The States (including the District of Columbia) that make up the
census divisions are: New England: Connecticut, Maine, Massachusetts,New Hampshire, Rhode Island, and Vermont; Middle Atlantic: New Jersey,New York, and Pennsylvania; South Atlantic: Delaware, District of Columbia,Florida, Georgia, Maryland, North Carolina, South Carolina, Virginia, andWest Virginia; East South Central: Alabama, Kentucky, Mississippi, and
Tennessee; West South Central: Arkansas, Louisiana, Oklahoma, and Texas;East North Central: Illinois, Indiana, Michigan, Ohio, and Wisconsin; WestNorth Central: Iowa, Kansas, Minnesota, Missouri, Nebraska, North Dakota,and South Dakota; Mountain: Arizona, Colorado, Idaho, Montana, Nevada,New Mexico, Utah, and Wyoming; and Pacific: Alaska, California, Hawaii,Oregon, and Washington.
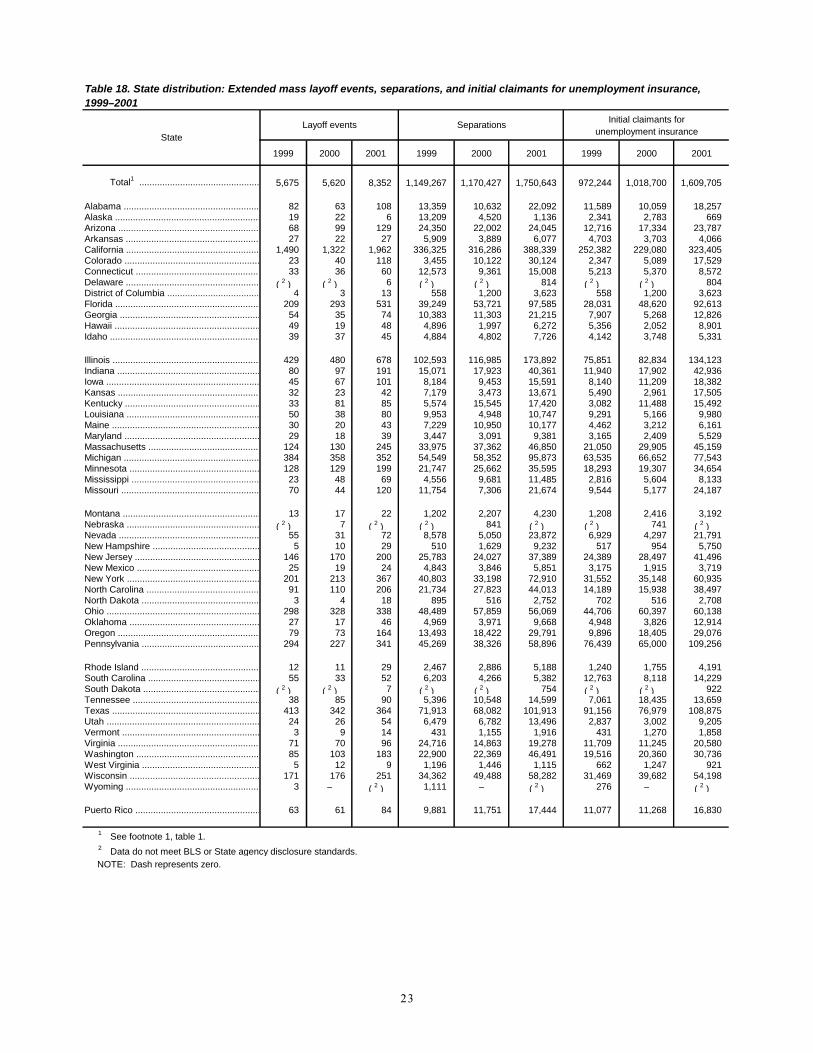
��
Table 18. State distribution: Extended mass layoff events, separations, and initial claimants for unemployment insurance,1999–2001
Initial claimants for unemployment insurance
1999 2000 2001 1999 2000 2001 1999 2000 2001
Total1 ............................................... 5,675 5,620 8,352 1,149,267 1,170,427 1,750,643 972,244 1,018,700 1,609,705
Alabama ..................................................... 82 63 108 13,359 10,632 22,092 11,589 10,059 18,257 Alaska ......................................................... 19 22 6 13,209 4,520 1,136 2,341 2,783 669 Arizona ....................................................... 68 99 129 24,350 22,002 24,045 12,716 17,334 23,787 Arkansas .................................................... 27 22 27 5,909 3,889 6,077 4,703 3,703 4,066 California .................................................... 1,490 1,322 1,962 336,325 316,286 388,339 252,382 229,080 323,405 Colorado ..................................................... 23 40 118 3,455 10,122 30,124 2,347 5,089 17,529 Connecticut ................................................ 33 36 60 12,573 9,361 15,008 5,213 5,370 8,572 Delaware .................................................... ( 2 ) ( 2 ) 6 ( 2 ) ( 2 ) 814 ( 2 ) ( 2 ) 804 District of Columbia .................................... 4 3 13 558 1,200 3,623 558 1,200 3,623 Florida ......................................................... 209 293 531 39,249 53,721 97,585 28,031 48,620 92,613 Georgia ....................................................... 54 35 74 10,383 11,303 21,215 7,907 5,268 12,826 Hawaii ......................................................... 49 19 48 4,896 1,997 6,272 5,356 2,052 8,901 Idaho ........................................................... 39 37 45 4,884 4,802 7,726 4,142 3,748 5,331
Illinois .......................................................... 429 480 678 102,593 116,985 173,892 75,851 82,834 134,123 Indiana ........................................................ 80 97 191 15,071 17,923 40,361 11,940 17,902 42,936 Iowa ............................................................ 45 67 101 8,184 9,453 15,591 8,140 11,209 18,382 Kansas ....................................................... 32 23 42 7,179 3,473 13,671 5,490 2,961 17,505 Kentucky ..................................................... 33 81 85 5,574 15,545 17,420 3,082 11,488 15,492 Louisiana .................................................... 50 38 80 9,953 4,948 10,747 9,291 5,166 9,980 Maine .......................................................... 30 20 43 7,229 10,950 10,177 4,462 3,212 6,161 Maryland ..................................................... 29 18 39 3,447 3,091 9,381 3,165 2,409 5,529 Massachusetts ............................................ 124 130 245 33,975 37,362 46,850 21,050 29,905 45,159 Michigan ..................................................... 384 358 352 54,549 58,352 95,873 63,535 66,652 77,543 Minnesota ................................................... 128 129 199 21,747 25,662 35,595 18,293 19,307 34,654 Mississippi .................................................. 23 48 69 4,556 9,681 11,485 2,816 5,604 8,133 Missouri ...................................................... 70 44 120 11,754 7,306 21,674 9,544 5,177 24,187
Montana ...................................................... 13 17 22 1,202 2,207 4,230 1,208 2,416 3,192 Nebraska .................................................... ( 2 ) 7 ( 2 ) ( 2 ) 841 ( 2 ) ( 2 ) 741 ( 2 )Nevada ....................................................... 55 31 72 8,578 5,050 23,872 6,929 4,297 21,791 New Hampshire .......................................... 5 10 29 510 1,629 9,232 517 954 5,750 New Jersey ................................................. 146 170 200 25,783 24,027 37,389 24,389 28,497 41,496 New Mexico ................................................ 25 19 24 4,843 3,846 5,851 3,175 1,915 3,719 New York .................................................... 201 213 367 40,803 33,198 72,910 31,552 35,148 60,935 North Carolina ............................................ 91 110 206 21,734 27,823 44,013 14,189 15,938 38,497 North Dakota .............................................. 3 4 18 895 516 2,752 702 516 2,708 Ohio ............................................................ 298 328 338 48,489 57,859 56,069 44,706 60,397 60,138 Oklahoma ................................................... 27 17 46 4,969 3,971 9,668 4,948 3,826 12,914 Oregon ........................................................ 79 73 164 13,493 18,422 29,791 9,896 18,405 29,076 Pennsylvania .............................................. 294 227 341 45,269 38,326 58,896 76,439 65,000 109,256
Rhode Island .............................................. 12 11 29 2,467 2,886 5,188 1,240 1,755 4,191 South Carolina ............................................ 55 33 52 6,203 4,266 5,382 12,763 8,118 14,229 South Dakota .............................................. ( 2 ) ( 2 ) 7 ( 2 ) ( 2 ) 754 ( 2 ) ( 2 ) 922 Tennessee .................................................. 38 85 90 5,396 10,548 14,599 7,061 18,435 13,659 Texas .......................................................... 413 342 364 71,913 68,082 101,913 91,156 76,979 108,875 Utah ............................................................ 24 26 54 6,479 6,782 13,496 2,837 3,002 9,205 Vermont ...................................................... 3 9 14 431 1,155 1,916 431 1,270 1,858 Virginia ....................................................... 71 70 96 24,716 14,863 19,278 11,709 11,245 20,580 Washington ................................................ 85 103 183 22,900 22,369 46,491 19,516 20,360 30,736 West Virginia .............................................. 5 12 9 1,196 1,446 1,115 662 1,247 921 Wisconsin ................................................... 171 176 251 34,362 49,488 58,282 31,469 39,682 54,198 Wyoming .................................................... 3 – ( 2 ) 1,111 – ( 2 ) 276 – ( 2 )
Puerto Rico ................................................. 63 61 84 9,881 11,751 17,444 11,077 11,268 16,830
1 See footnote 1, table 1. 2 Data do not meet BLS or State agency disclosure standards. NOTE: Dash represents zero.
Layoff events SeparationsState

��
Table 19. Top 50 Metropolitan Statistical Areas in 2001: Number of extended mass layoff events and separations
Layoff events Separations Rank1 Layoff events Separations Rank1
Total, 331 Metropolitan Statistical Areas2… 3,562 706,632 – 5,651 1,118,152 …
Total, top 50 Metropolitan Statistical Areas…… 2,274 501,827 – 3,628 756,351 …
Chicago, IL ……………………………………… 226 52,156 1 346 89,087 1 Los Angeles-Long Beach, CA ………………… 128 29,389 3 299 55,135 2 Fresno, CA ……………………………………… 169 40,883 2 157 36,172 3 San Jose, CA …………………………………… 17 4,505 35 199 31,613 4 Bakersfield, CA ………………………………… 111 21,990 5 119 31,226 5 New York, NY …………………………………… 92 12,450 12 162 30,918 6 Detroit, MI ………………………………………… 133 24,547 4 142 27,734 7 Houston, TX ……………………………………… 102 20,234 7 60 23,387 8 Las Vegas, NV-AZ ……………………………… 24 3,837 41 66 19,792 9 Dallas, TX ………………………………………… 46 16,187 9 92 19,417 10
Salinas, CA ……………………………………… 88 18,624 8 82 19,327 11 Minneapolis-St. Paul, MN-WI …………………… 54 7,645 19 97 16,755 12 San Francisco, CA ……………………………… 24 3,494 47 106 16,352 13 Seattle-Bellevue-Everett, WA ………………… 24 7,282 20 61 15,896 14 Boston, MA-NH ………………………………… 39 7,152 22 89 15,844 15 Riverside-San Bernardino, CA ………………… 75 20,636 6 84 14,634 16 Visalia-Tulare-Porterville, CA …………………… 84 14,408 11 91 14,240 17 Orange County, CA ……………………………… 26 5,628 28 101 13,112 18 Stockton-Lodi, CA ……………………………… 42 8,189 18 47 12,146 19 Portland-Vancouver, OR-WA …………………… 13 2,819 59 46 11,959 20
San Diego, CA …………………………………… 22 5,218 29 82 11,744 21 Fort Worth-Arlington, TX ………………………… 17 3,533 46 31 11,736 22 Phoenix-Mesa, AZ ……………………………… 28 3,689 44 67 11,499 23 Atlanta, GA ……………………………………… 10 6,557 24 31 11,460 24 Austin-San Marcos, TX ………………………… 5 1,015 121 32 11,388 25 Miami, FL ………………………………………… 35 5,879 27 67 11,156 26 Oakland, CA ……………………………………… 23 3,588 45 78 10,668 27 San Antonio, TX ………………………………… 23 4,051 38 26 8,572 28 Salt Lake City-Ogden, UT ……………………… 13 3,144 53 36 8,462 29 Ventura, CA ……………………………………… 24 3,295 50 51 8,398 30
St. Louis, MO-IL ………………………………… 19 6,297 26 43 8,262 31 Sacramento, CA ………………………………… 25 8,951 16 31 8,152 32 Charlotte-Gastonia-Rock Hill, NC-SC ………… 19 10,794 14 35 8,090 33 Milwaukee-Waukesha, WI ……………………… 26 12,092 13 33 8,010 34 Philadelphia, PA-NJ …………………………… 44 4,031 39 58 7,940 35 Yuma, AZ ………………………………………… 50 15,481 10 32 7,543 36 Kansas City, MO-KS …………………………… 15 2,798 60 33 7,479 37 Tampa-St Petersburg-Clearwater, FL ………… 14 1,936 83 45 7,338 38 Indianapolis, IN …………………………………… 15 2,895 57 32 7,196 39 Newark, NJ ……………………………………… 36 4,786 32 40 7,110 40
Modesto, CA ……………………………………… 35 8,565 17 31 6,827 41 Denver, CO ……………………………………… 5 551 179 26 6,385 42 Cincinnati, OH-KY-IN …………………………… 24 4,911 31 33 6,266 43 Buffalo-Niagara Falls, NY ……………………… 17 2,179 77 30 6,089 44 Orlando, FL ……………………………………… 11 1,560 95 50 5,805 45 Raleigh-Durham-Chapel Hill, NC ……………… 3 373 205 20 5,767 46 Grand Rapids-Muskegon-Holland, MI ………… 41 7,069 23 38 5,750 47 West Palm Beach-Boca Raton, FL …………… 31 8,988 15 27 5,732 48 Nassau-Suffolk, NY ……………………………… 26 4,612 34 26 5,531 49 Gary, IN …………………………………………… 9 1,453 99 18 5,250 50
Metropolitan Statistical Area
2000 2001
1 Metropolitan areas are ranked by the number of separation in 2001.2 See footnote 1, table 1.NOTE: The geographic boundaries of the metropolitan areas shown in
this table are defined in Metropolitan Statistical Areas, 1999, U.S. Office ofManagement and Budget, June 1999.
.Tampa-St. Petersburg-Clearwater, FL

��
AK HI
TX
OKAR
ALMS
TN
SC
NC
LA
FL
GA
UT
NMAZ
CA
OR
WA
NV
CO
WY
ID
MT
KS MO
IA
MN
ND
SD
NE
KY
WI
ILIN OH
MI
WVVA
DC
MDDE
PA
NY
NJ
MEVT
NH
MA
CTRI
Note: The index is calculated as the share of privates ector separations divided by the share of private,sector employment in establishments employing at least 50 workers.
Source: Mass Layoff Statistics
Pacific
Mountain West North Central East North Central
MiddleAtlantic
New England
SouthAtlantic
West SouthCentral
East SouthCentral
Chart 1. Index of mass layoff separations, 2001
Index
160 or more
120 to 159
80 to 119
40 to 79
39 or below
Note: The index is calculated as the share of private sectorseparations divided by the share of private sector employmentin establishments employing at least 50 workers.
SOURCE: Mass Layoff Statistics
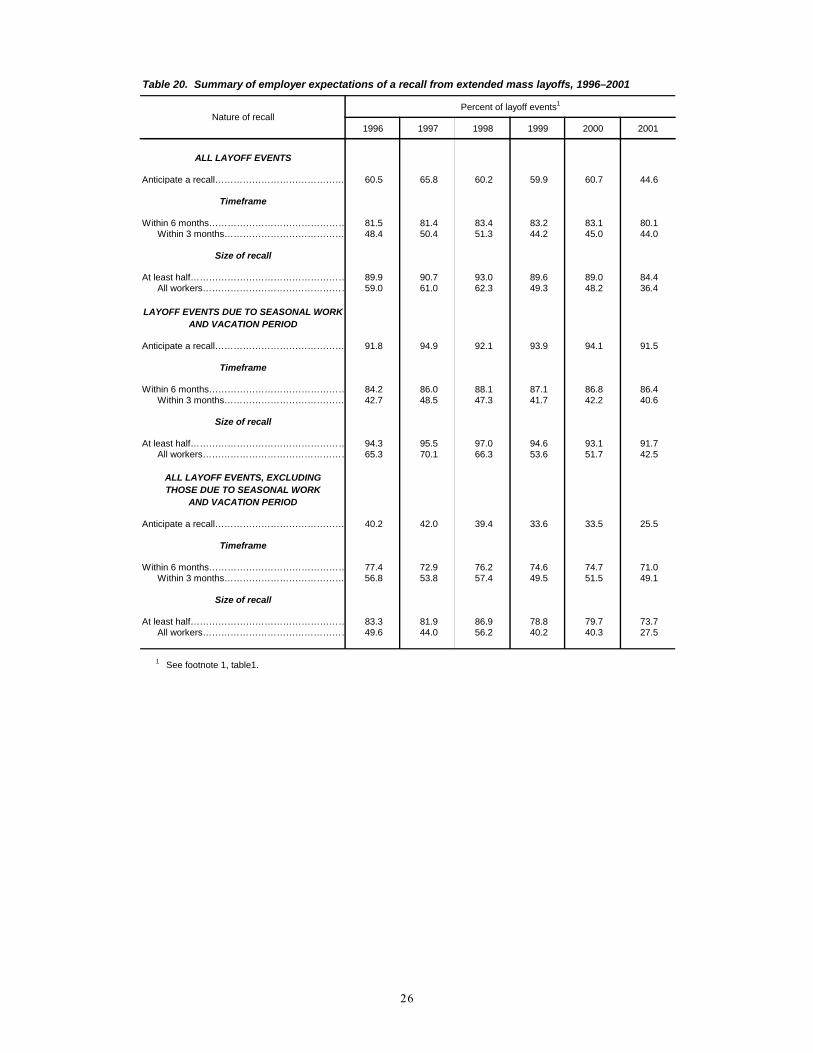
��
Table 20. Summary of employer expectations of a recall from extended mass layoffs, 1996–2001
1996 1997 1998 1999 2000 2001
ALL LAYOFF EVENTS
Anticipate a recall…………………………………… 60.5 65.8 60.2 59.9 60.7 44.6
Timeframe
Within 6 months……………………………………… 81.5 81.4 83.4 83.2 83.1 80.1 Within 3 months………………………………… 48.4 50.4 51.3 44.2 45.0 44.0
Size of recall
At least half…………………………………………… 89.9 90.7 93.0 89.6 89.0 84.4 All workers………………………………………… 59.0 61.0 62.3 49.3 48.2 36.4
LAYOFF EVENTS DUE TO SEASONAL WORK AND VACATION PERIOD
Anticipate a recall…………………………………… 91.8 94.9 92.1 93.9 94.1 91.5
Timeframe
Within 6 months……………………………………… 84.2 86.0 88.1 87.1 86.8 86.4 Within 3 months………………………………… 42.7 48.5 47.3 41.7 42.2 40.6
Size of recall
At least half…………………………………………… 94.3 95.5 97.0 94.6 93.1 91.7 All workers………………………………………… 65.3 70.1 66.3 53.6 51.7 42.5
ALL LAYOFF EVENTS, EXCLUDING THOSE DUE TO SEASONAL WORK
AND VACATION PERIOD
Anticipate a recall…………………………………… 40.2 42.0 39.4 33.6 33.5 25.5
Timeframe
Within 6 months……………………………………… 77.4 72.9 76.2 74.6 74.7 71.0 Within 3 months………………………………… 56.8 53.8 57.4 49.5 51.5 49.1
Size of recall
At least half…………………………………………… 83.3 81.9 86.9 78.8 79.7 73.7 All workers………………………………………… 49.6 44.0 56.2 40.2 40.3 27.5
1 See footnote 1, table1.
Nature of recallPercent of layoff events1

��
Table 21. Distribution of extended mass layoff events with expected recall, 1996–2001
1996 1997 1998 1999 2000 2001
Total1…………………………………….……… 60.5 65.8 60.2 59.9 60.7 44.6
Industry
Total private ............................................................. 60.7 65.4 60.0 59.6 60.6 44.0
Agriculture, forestry, fishing and hunting ............. 92.6 95.2 93.2 92.8 91.4 92.8 Mining .................................................................. 41.2 61.5 42.2 34.1 61.1 62.3 Utilities ................................................................. 14.3 33.3 11.1 55.6 31.8 26.3 Construction ........................................................ 70.3 73.0 69.3 72.7 81.6 72.6 Manufacturing....................................................... 56.0 58.4 55.6 47.5 48.5 33.5 Wholesale trade .................................................. 41.4 48.6 43.5 36.8 35.5 18.3 Retail trade .......................................................... 28.3 29.3 29.3 32.5 29.1 21.2 Transportation and warehousing ......................... 72.8 78.0 72.2 73.4 70.3 54.9 Information ........................................................... 45.2 48.2 25.0 25.9 26.0 8.6 Finance and insurance ........................................ 8.7 7.5 3.8 5.4 5.3 2.8
Real estate and rental and leasing ...................... 60.0 37.5 50.0 61.5 41.2 24.2 Professional and technical services .................... 58.0 57.0 49.1 50.4 50.8 20.6 Management of companies and enterprises ....... 33.3 66.7 63.6 33.3 50.0 37.5 Administrative and waste services ...................... 53.2 51.6 43.4 37.9 52.2 38.8 Educational services............................................. 50.0 76.9 61.5 55.6 54.5 33.3 Health care and social assistance ....................... 62.1 70.2 61.3 63.3 56.6 68.4 Arts, entertainment, and recreation ..................... 82.2 82.7 68.3 83.2 81.7 76.2 Accommodation and food services ..................... 73.5 74.9 66.7 70.2 73.5 55.0 Other services, except public administration........ 81.4 87.5 83.1 80.5 82.3 72.0
Unclassified ........................................................ 40.0 40.0 – 30.4 32.3 28.9
Government ............................................................. 57.1 73.0 64.1 68.3 63.9 65.6
Reason for layoff
Automation .............................................................. 57.1 33.3 66.7 20.0 – 36.4 Bankruptcy ............................................................... 3.9 11.3 4.9 2.8 3.2 3.1 Business ownership change .................................... 9.0 14.8 9.1 7.4 4.0 4.3 Contract cancellation ............................................... 36.4 24.6 25.0 25.6 28.7 16.7 Contract completion ................................................. 58.7 62.1 43.2 47.7 57.6 52.0 Domestic relocation ................................................. 9.2 5.2 4.4 5.4 – 5.0 Energy-related………………………………………… – – 33.3 50.0 40.0 20.0 Environment-related…………………………………… 42.9 – 57.1 7.7 28.6 –Financial difficulty .................................................... 12.3 10.3 9.2 8.9 7.5 8.3 Import competition ................................................... 9.7 12.1 18.9 5.2 9.5 9.1 Labor dispute ........................................................... 50.0 59.4 77.1 61.5 48.3 61.5 Material shortage ..................................................... 57.1 84.6 87.0 70.0 83.3 40.0
Model changeover ................................................... 83.3 94.4 84.2 71.4 77.8 53.8 Natural disaster ....................................................... 81.3 60.0 33.3 – 100.0 75.0 Non-natural disaster ................................................ ( 3 ) ( 3 ) ( 3 ) ( 3 ) ( 3 ) 6.7 Overseas relocation ................................................. 7.7 5.3 5.7 – 2.3 1.3 Plant or machine repair ........................................... 87.0 100.0 90.6 92.9 84.2 100.0 Product line discontinued ........................................ 28.6 27.7 22.2 17.1 20.0 4.9 Reorganization within company ............................... 14.2 14.1 12.0 13.0 11.6 6.3 Seasonal work ......................................................... 91.5 94.7 91.8 93.9 94.0 91.0 Slack work ............................................................... 73.6 74.1 71.0 70.3 69.5 42.5 Vacation period ........................................................ 100.0 98.9 98.1 94.1 98.8 99.2 Weather-related ....................................................... 86.7 89.2 95.5 94.9 86.4 90.7 Other ........................................................................ 29.3 23.6 27.7 18.8 23.8 14.9 Not reported ............................................................. 1.2 2.3 1.0 1.1 .7 .7
MeasurePercent of layoff events
1 See footnote 1, table 1. 2 Data do not meet BLS or State agency disclosure
standards.
3 Non-natural disaster was added as a reason for
layoff in the third quarter of 2001 in order to be able to
identify layoffs directly or indirectly related to the September 11 attacks.
NOTE: Dash represents zero.

��
Table 22. Number of extended mass layoff events and separations from whichthe employer does not expect a recall, 2001
Total1……………………………………………… 3,453 789,407
Industry
Total private ............................................................... 3,415 782,972
Agriculture, forestry, fishing and hunting ................ 29 6,382 Mining ..................................................................... 17 3,618 Utilities .................................................................... 13 1,914 Construction ........................................................... 105 14,568 Manufacturing.......................................................... 1,704 361,555 Wholesale trade ..................................................... 124 21,421 Retail trade ............................................................. 307 92,616 Transportation and warehousing ............................ 113 39,295 Information ............................................................. 268 50,978 Finance and insurance ........................................... 160 30,947
Real estate and rental and leasing ......................... 17 4,532 Professional and technical services ....................... 155 25,373 Management of companies and enterprises .......... 8 895 Administrative and waste services ......................... 187 87,539 Educational services............................................... 8 1,084 Health care and social assistance .......................... 47 7,944 Arts, entertainment, and recreation ........................ 17 4,668 Accommodation and food services ........................ 99 21,869 Other services, except public administration........... 14 1,722
Unclassified ........................................................... 23 4,052
Government ............................................................... 38 6,435
Reason for layoff
Automation ................................................................. 3 385 Bankruptcy ................................................................. 264 125,909 Business ownership change ...................................... 190 51,443 Contract cancellation .................................................. 114 22,304 Contract completion ................................................... 152 28,322 Domestic relocation .................................................... 96 18,222 Energy-related…………………………………………… 11 2,341 Environment-related……………………………………… ( 2 ) ( 2 )Financial difficulty ....................................................... 567 128,107 Import competition ...................................................... 112 23,891 Labor dispute .............................................................. 3 893 Material shortage ........................................................ 8 883
Model changeover ...................................................... 5 1,728 Natural disaster .......................................................... ( 2 ) ( 2 )Non-natural disaster ................................................... 13 2,991 Overseas relocation ................................................... 76 15,059 Plant or machine repair .............................................. – –Product line discontinued ........................................... 36 8,919 Reorganization within company ................................. 662 141,358 Seasonal work ............................................................ 114 28,086 Slack work .................................................................. 688 122,762 Vacation period .......................................................... – –Weather-related ......................................................... – –Other .......................................................................... 299 60,612 Not reported ............................................................... 37 4,689
Internal company restructuring3………………………… 1,683 446,817
Measure Layoff events Separations
1 See footnote 1, table 1.2 Data do not meet BLS or State agency
disclosure standards.
3 Internal company restructuring consists of
bankruptcy, business ownership change, financialdifficulty, and reorganization within company.
NOTE: Dash represents zero.
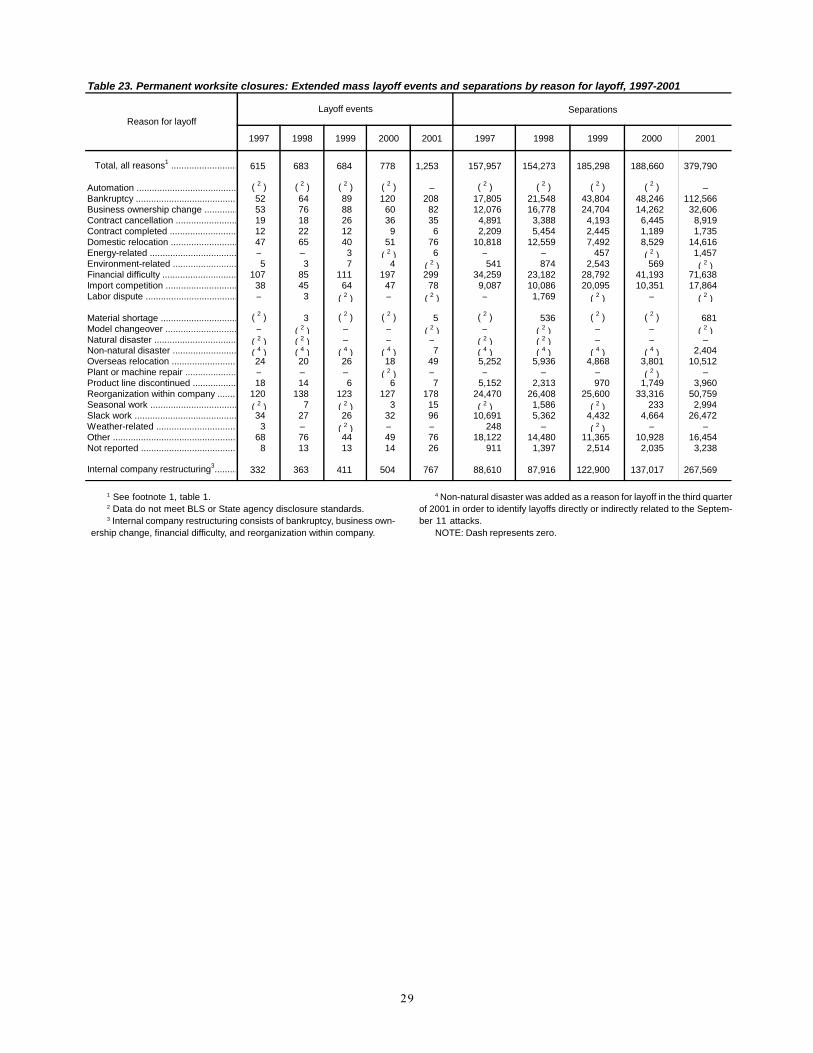
�
Table 23. Permanent worksite closures: Extended mass layoff events and separations by reason for layoff, 1997-2001
Separations
1997 1998 1999 2000 2001 1997 1998 1999 2000 2001
Total, all reasons1 .......................... 615 683 684 778 1,253 157,957 154,273 185,298 188,660 379,790
Automation ....................................... ( 2 ) ( 2 ) ( 2 ) ( 2 ) – ( 2 ) ( 2 ) ( 2 ) ( 2 ) –Bankruptcy ........................................ 52 64 89 120 208 17,805 21,548 43,804 48,246 112,566 Business ownership change ............. 53 76 88 60 82 12,076 16,778 24,704 14,262 32,606 Contract cancellation ........................ 19 18 26 36 35 4,891 3,388 4,193 6,445 8,919 Contract completed .......................... 12 22 12 9 6 2,209 5,454 2,445 1,189 1,735 Domestic relocation .......................... 47 65 40 51 76 10,818 12,559 7,492 8,529 14,616 Energy-related .................................. – – 3 ( 2 ) 6 – – 457 ( 2 ) 1,457 Environment-related ......................... 5 3 7 4 ( 2 ) 541 874 2,543 569 ( 2 )Financial difficulty ............................. 107 85 111 197 299 34,259 23,182 28,792 41,193 71,638 Import competition ............................ 38 45 64 47 78 9,087 10,086 20,095 10,351 17,864 Labor dispute .................................... – 3 ( 2 ) – ( 2 ) – 1,769 ( 2 ) – ( 2 )
Material shortage .............................. ( 2 ) 3 ( 2 ) ( 2 ) 5 ( 2 ) 536 ( 2 ) ( 2 ) 681 Model changeover ............................ – ( 2 ) – – ( 2 ) – ( 2 ) – – ( 2 )Natural disaster ................................ ( 2 ) ( 2 ) – – – ( 2 ) ( 2 ) – – –Non-natural disaster ......................... ( 4 ) ( 4 ) ( 4 ) ( 4 ) 7 ( 4 ) ( 4 ) ( 4 ) ( 4 ) 2,404 Overseas relocation ......................... 24 20 26 18 49 5,252 5,936 4,868 3,801 10,512 Plant or machine repair .................... – – – ( 2 ) – – – – ( 2 ) –Product line discontinued ................. 18 14 6 6 7 5,152 2,313 970 1,749 3,960 Reorganization within company ........ 120 138 123 127 178 24,470 26,408 25,600 33,316 50,759 Seasonal work .................................. ( 2 ) 7 ( 2 ) 3 15 ( 2 ) 1,586 ( 2 ) 233 2,994 Slack work ........................................ 34 27 26 32 96 10,691 5,362 4,432 4,664 26,472 Weather-related ................................ 3 – ( 2 ) – – 248 – ( 2 ) – –Other ................................................. 68 76 44 49 76 18,122 14,480 11,365 10,928 16,454 Not reported ...................................... 8 13 13 14 26 911 1,397 2,514 2,035 3,238
Internal company restructuring3......... 332 363 411 504 767 88,610 87,916 122,900 137,017 267,569
Reason for layoffLayoff events
1 See footnote 1, table 1.2 Data do not meet BLS or State agency disclosure standards.3 Internal company restructuring consists of bankruptcy, business own-
ership change, financial difficulty, and reorganization within company.
4 Non-natural disaster was added as a reason for layoff in the third quarterof 2001 in order to identify layoffs directly or indirectly related to the Septem-ber 11 attacks.
NOTE: Dash represents zero.
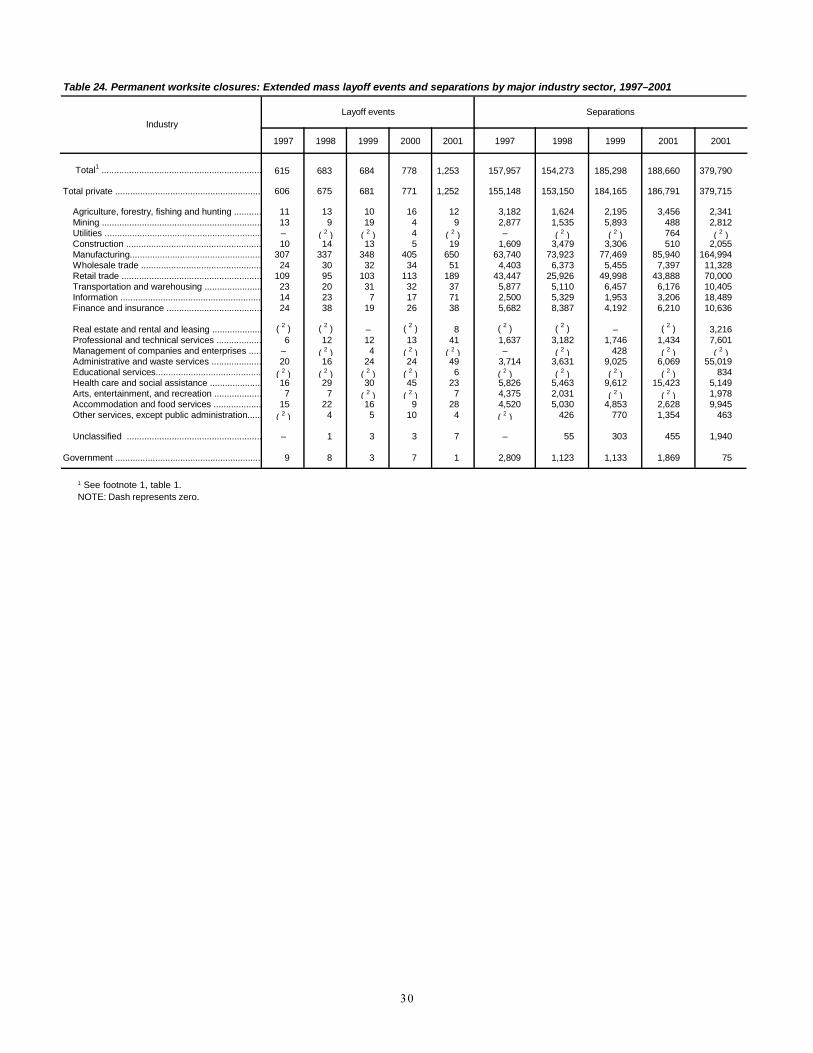
�
Table 24. Permanent worksite closures: Extended mass layoff events and separations by major industry sector, 1997–2001
1997 1998 1999 2000 2001 1997 1998 1999 2001 2001
Total1 ................................................................ 615 683 684 778 1,253 157,957 154,273 185,298 188,660 379,790
Total private ........................................................... 606 675 681 771 1,252 155,148 153,150 184,165 186,791 379,715
Agriculture, forestry, fishing and hunting ........... 11 13 10 16 12 3,182 1,624 2,195 3,456 2,341 Mining ................................................................ 13 9 19 4 9 2,877 1,535 5,893 488 2,812 Utilities ............................................................... – ( 2 ) ( 2 ) 4 ( 2 ) – ( 2 ) ( 2 ) 764 ( 2 ) Construction ...................................................... 10 14 13 5 19 1,609 3,479 3,306 510 2,055 Manufacturing..................................................... 307 337 348 405 650 63,740 73,923 77,469 85,940 164,994 Wholesale trade ................................................ 24 30 32 34 51 4,403 6,373 5,455 7,397 11,328 Retail trade ........................................................ 109 95 103 113 189 43,447 25,926 49,998 43,888 70,000 Transportation and warehousing ....................... 23 20 31 32 37 5,877 5,110 6,457 6,176 10,405 Information ........................................................ 14 23 7 17 71 2,500 5,329 1,953 3,206 18,489 Finance and insurance ...................................... 24 38 19 26 38 5,682 8,387 4,192 6,210 10,636
Real estate and rental and leasing .................... ( 2 ) ( 2 ) – ( 2 ) 8 ( 2 ) ( 2 ) – ( 2 ) 3,216 Professional and technical services .................. 6 12 12 13 41 1,637 3,182 1,746 1,434 7,601 Management of companies and enterprises ..... – ( 2 ) 4 ( 2 ) ( 2 ) – ( 2 ) 428 ( 2 ) ( 2 ) Administrative and waste services .................... 20 16 24 24 49 3,714 3,631 9,025 6,069 55,019 Educational services.......................................... ( 2 ) ( 2 ) ( 2 ) ( 2 ) 6 ( 2 ) ( 2 ) ( 2 ) ( 2 ) 834 Health care and social assistance ..................... 16 29 30 45 23 5,826 5,463 9,612 15,423 5,149 Arts, entertainment, and recreation ................... 7 7 ( 2 ) ( 2 ) 7 4,375 2,031 ( 2 ) ( 2 ) 1,978 Accommodation and food services ................... 15 22 16 9 28 4,520 5,030 4,853 2,628 9,945 Other services, except public administration...... ( 2 ) 4 5 10 4 ( 2 ) 426 770 1,354 463
Unclassified ...................................................... – 1 3 3 7 – 55 303 455 1,940
Government ........................................................... 9 8 3 7 1 2,809 1,123 1,133 1,869 75
IndustryLayoff events Separations
1 See footnote 1, table 1.NOTE: Dash represents zero.

��
Table 25. Permanent worksite closures: Extended mass layoff events and separations, top 50 industries in 2001
Permanent closures
2000 2001
Layoff events Separations Rank1 Layoff events Separations Rank1
Total2 .............................................................. … 778 188,660 … 1,253 379,790 …
Total, top 50 industries ............................................. … 727 182,365 … 1,143 355,809 …
Administrative and support services ………………… 561 24 6,069 7 48 54,915 1 General merchandise stores ………………………… 452 26 17,989 1 58 27,640 2 Computer and electronic product manufacturing …… 334 24 8,132 6 76 25,347 3 Apparel manufacturing ………………………………… 315 66 12,388 2 86 17,413 4 Electrical equipment and appliance mfg. …………… 335 11 2,231 31 33 15,552 5 Primary metal manufacturing ………………………… 331 12 4,040 15 34 14,574 6 Textile mills ……………………………………………… 313 23 5,586 10 57 13,436 7 Building material and garden supply stores ………… 444 7 3,039 21 23 12,868 8 Machinery manufacturing ……………………………… 333 21 4,952 11 41 9,877 9 Food manufacturing …………………………………… 311 44 9,481 5 38 9,699 10 Transportation equipment manufacturing …………… 336 42 11,631 3 37 8,678 11 Paper manufacturing …………………………………… 322 21 4,300 14 32 8,545 12 Furniture and related product manufacturing ………… 337 14 2,537 26 38 8,224 13 Professional and technical services ………………… 541 13 1,434 35 41 7,601 14 Food and beverage stores …………………………… 445 20 5,996 8 28 7,487 15 Telecommunications …………………………………… 517 6 1,044 39 30 7,420 16 Merchant wholesalers, nondurable goods …………… 424 19 4,460 12 26 6,597 17
Fabricated metal product manufacturing …………… 332 20 2,773 22 38 6,361 18 Plastics and rubber products manufacturing ………… 326 15 2,462 27 23 6,033 19 Furniture and home furnishings stores ……………… 442 16 3,875 17 24 5,760 20 Accommodation ………………………………………… 721 4 1,970 33 10 5,758 21 Nonstore retailers ……………………………………… 454 8 2,572 25 18 5,671 22 Credit intermediation and related activities ………… 522 11 2,453 28 18 5,597 23 Clothing and clothing accessories stores …………… 448 15 2,578 24 12 5,020 24 ISPs, search portals, and data processing …………… 518 6 1,243 37 19 4,807 25 Food services and drinking places …………………… 722 5 658 48 18 4,187 26 Publishing industries, except Internet ………………… 511 3 531 51 13 3,950 27 Chemical manufacturing ……………………………… 325 6 550 49 20 3,785 28 Miscellaneous manufacturing ………………………… 339 22 3,598 18 18 3,488 29 Insurance carriers and related activities ……………… 524 16 4,357 13 14 3,393 30 Merchant wholesalers, durable goods ……………… 423 10 2,175 32 19 3,391 31 Printing and related support activities ………………… 323 14 2,610 23 16 3,386 32 Leather and allied product manufacturing …………… 316 13 2,422 29 12 3,023 33 Wood product manufacturing ………………………… 321 20 3,542 19 24 2,927 34
Mining, except oil and gas …………………………… 212 4 488 54 9 2,812 35 Couriers and messengers ……………………………… 492 4 826 41 5 2,649 36 Real estate ……………………………………………… 531 ( 3 ) ( 3 ) 72 ( 3 ) ( 3 ) 37 Truck transportation …………………………………… 484 15 3,465 20 10 2,126 38 Unclassified establishments …………………………… 999 3 455 58 7 1,940 39 Hospitals ………………………………………………… 622 28 10,156 4 6 1,921 40 Ambulatory health care services ……………………… 621 10 4,011 16 8 1,905 41 Textile product mills …………………………………… 314 7 1,381 36 12 1,878 42 Air transportation ……………………………………… 481 ( 3 ) ( 3 ) 57 ( 3 ) ( 3 ) 43 Securities, commodity contracts, investments ……… 523 – – 73 6 1,646 44 Motion picture and sound recording industries ……… 512 ( 3 ) ( 3 ) 59 ( 3 ) ( 3 ) 45 Specialty trade contractors …………………………… 238 3 329 60 11 1,382 46 Miscellaneous store retailers ………………………… 453 ( 3 ) ( 3 ) 70 8 1,352 47 Electronic markets and agents and brokers ………… 425 5 762 44 6 1,340 48 Nonmetallic mineral product manufacturing ………… 327 8 1,756 34 7 1,251 49 Transit and ground passenger transportation ……… 485 5 713 46 6 1,197 50
1 Industries are ranked by the number of separations in 2001. 3 Data do not meet BLS or State agency disclosure standards. 2 See footnote 1, table 1. NOTE: Dash represents zero.
Industry NAICS
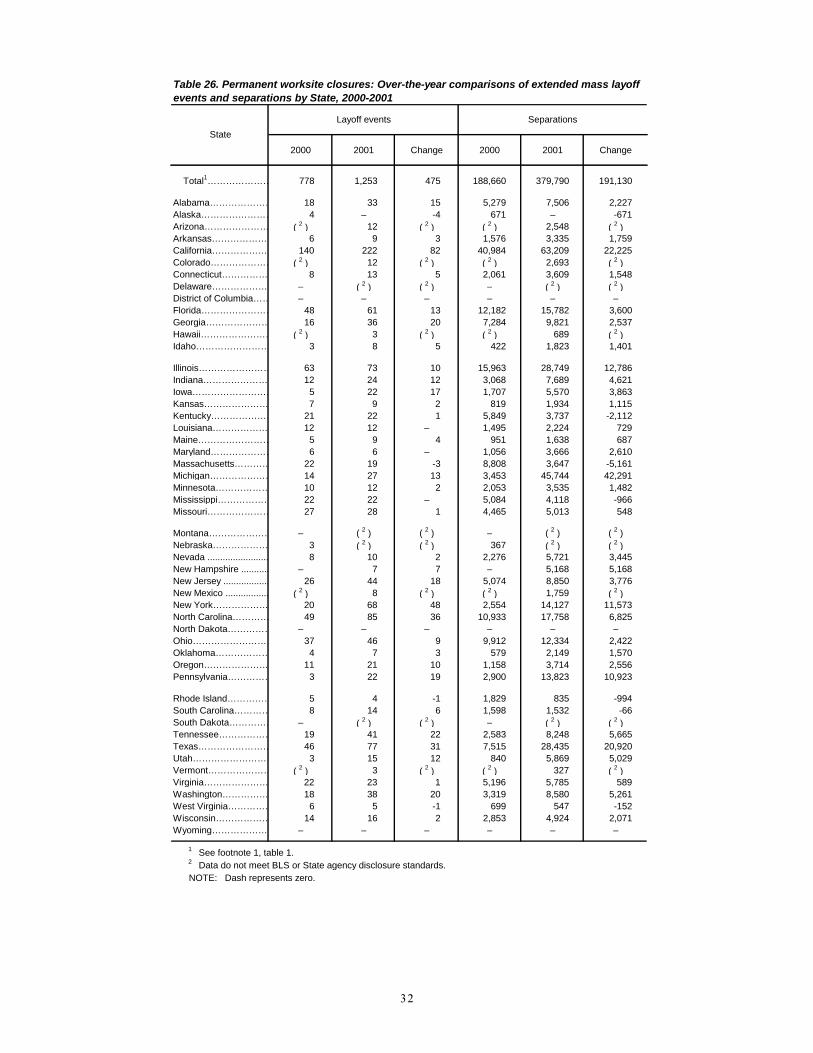
��
Table 26. Permanent worksite closures: Over-the-year comparisons of extended mass layoffevents and separations by State, 2000-2001
2000 2001 Change 2000 2001 Change
Total1………………… 778 1,253 475 188,660 379,790 191,130
Alabama………………… 18 33 15 5,279 7,506 2,227 Alaska…………………… 4 – -4 671 – -671 Arizona………………… ( 2 ) 12 ( 2 ) ( 2 ) 2,548 ( 2 )Arkansas……………… 6 9 3 1,576 3,335 1,759 California……………… 140 222 82 40,984 63,209 22,225 Colorado………………… ( 2 ) 12 ( 2 ) ( 2 ) 2,693 ( 2 )Connecticut…………… 8 13 5 2,061 3,609 1,548 Delaware……………… – ( 2 ) ( 2 ) – ( 2 ) ( 2 )District of Columbia…… – – – – – –Florida…………………… 48 61 13 12,182 15,782 3,600 Georgia………………… 16 36 20 7,284 9,821 2,537 Hawaii…………………… ( 2 ) 3 ( 2 ) ( 2 ) 689 ( 2 )Idaho…………………… 3 8 5 422 1,823 1,401
Illinois…………………… 63 73 10 15,963 28,749 12,786 Indiana………………… 12 24 12 3,068 7,689 4,621 Iowa……………………… 5 22 17 1,707 5,570 3,863 Kansas………………… 7 9 2 819 1,934 1,115 Kentucky………………… 21 22 1 5,849 3,737 -2,112 Louisiana……………… 12 12 – 1,495 2,224 729 Maine…………………… 5 9 4 951 1,638 687 Maryland………………… 6 6 – 1,056 3,666 2,610 Massachusetts………… 22 19 -3 8,808 3,647 -5,161 Michigan………………… 14 27 13 3,453 45,744 42,291 Minnesota……………… 10 12 2 2,053 3,535 1,482 Mississippi……………… 22 22 – 5,084 4,118 -966 Missouri………………… 27 28 1 4,465 5,013 548
Montana………………… – ( 2 ) ( 2 ) – ( 2 ) ( 2 )Nebraska……………… 3 ( 2 ) ( 2 ) 367 ( 2 ) ( 2 )Nevada ........................ 8 10 2 2,276 5,721 3,445 New Hampshire ........... – 7 7 – 5,168 5,168 New Jersey .................. 26 44 18 5,074 8,850 3,776 New Mexico ................. ( 2 ) 8 ( 2 ) ( 2 ) 1,759 ( 2 )New York……………… 20 68 48 2,554 14,127 11,573 North Carolina………… 49 85 36 10,933 17,758 6,825 North Dakota…………… – – – – – –Ohio……………………… 37 46 9 9,912 12,334 2,422 Oklahoma……………… 4 7 3 579 2,149 1,570 Oregon………………… 11 21 10 1,158 3,714 2,556 Pennsylvania…………… 3 22 19 2,900 13,823 10,923
Rhode Island…………… 5 4 -1 1,829 835 -994 South Carolina………… 8 14 6 1,598 1,532 -66 South Dakota…………… – ( 2 ) ( 2 ) – ( 2 ) ( 2 )Tennessee……………… 19 41 22 2,583 8,248 5,665 Texas…………………… 46 77 31 7,515 28,435 20,920 Utah……………………… 3 15 12 840 5,869 5,029 Vermont………………… ( 2 ) 3 ( 2 ) ( 2 ) 327 ( 2 )Virginia………………… 22 23 1 5,196 5,785 589 Washington…………… 18 38 20 3,319 8,580 5,261 West Virginia…………… 6 5 -1 699 547 -152 Wisconsin……………… 14 16 2 2,853 4,924 2,071 Wyoming……………… – – – – – –
1 See footnote 1, table 1. 2 Data do not meet BLS or State agency disclosure standards. NOTE: Dash represents zero.
Layoff events Separations
State
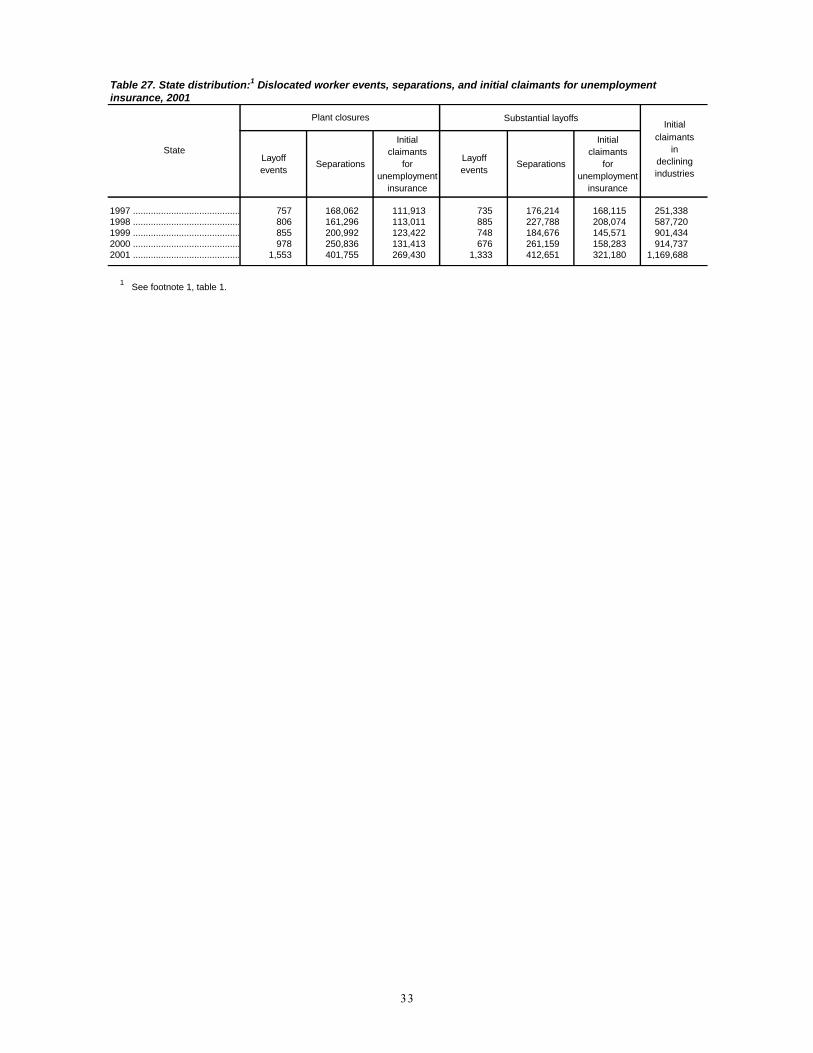
��
Table 27. State distribution:1 Dislocated worker events, separations, and initial claimants for unemployment insurance, 2001
Substantial layoffsInitial
Layoffevents
Separations
Initialclaimants
forunemployment
insurance
Layoffevents
Separations
Initialclaimants
forunemployment
insurance
claimants in
decliningindustries
1997 .......................................... 757 168,062 111,913 735 176,214 168,115 251,338 1998 .......................................... 806 161,296 113,011 885 227,788 208,074 587,720 1999 .......................................... 855 200,992 123,422 748 184,676 145,571 901,434 2000 .......................................... 978 250,836 131,413 676 261,159 158,283 914,737 2001 .......................................... 1,553 401,755 269,430 1,333 412,651 321,180 1,169,688
1 See footnote 1, table 1.
Plant closures
State

��
Table 28. State distribution: Dislocated worker events, separations, and initial claimants for unemployment insurance, 2001
Substantial layoffsInitial
Layoffevents
Separations
Initialclaimants
forunemployment
insurance
Layoffevents
Separations
Initialclaimants
forunemployment
insurance
claimants in
decliningindustries
Total 1 ................................... 1,553 401,755 269,430 1,333 412,651 321,180 1,169,688
Alabama ................................... 36 8,120 5,434 24 6,793 5,689 12,576 Alaska ....................................... – – – – – – 3,064 Arizona ...................................... 12 2,548 1,870 16 5,676 4,141 9,231 Arkansas ................................... 11 3,827 1,428 ( 2 ) ( 2 ) ( 2 ) 11,634 California ................................... 247 65,122 51,381 252 101,346 43,169 282,692 Colorado ................................... 14 2,926 1,668 12 2,002 1,084 –Connecticut ............................... 14 3,670 1,770 5 1,388 893 19,860 Delaware ................................... ( 2 ) ( 2 ) ( 2 ) – – – 9,199 District of Columbia .................. – – – ( 2 ) ( 2 ) ( 2 ) 402 Florida ....................................... 62 15,902 9,281 48 14,290 14,881 3,669 Georgia ..................................... 44 10,921 7,616 14 5,955 2,088 4,647 Hawaii ....................................... 3 689 689 9 1,325 1,482 2,970 Idaho ......................................... 17 2,424 1,510 12 1,802 668 76
Illinois ........................................ 85 29,276 19,749 141 41,061 29,459 10,488 Indiana ...................................... 34 8,240 5,739 26 10,339 12,165 5,575 Iowa .......................................... 44 7,199 4,312 11 2,395 2,301 18,401 Kansas ...................................... 9 1,934 837 20 7,721 10,497 10,284 Kentucky ................................... 26 4,191 3,470 19 5,245 4,595 77,389 Louisiana .................................. 13 2,255 2,270 8 1,231 817 2,955 Maine ........................................ 15 2,340 1,581 9 2,018 1,303 10,012 Maryland ................................... 8 3,857 1,194 6 1,611 743 24,802 Massachusetts .......................... 31 4,267 3,080 46 16,639 8,854 19,526 Michigan ................................... 41 46,388 6,107 46 16,508 18,995 13,356 Minnesota ................................. 15 3,661 3,199 20 8,677 6,585 30,398 Mississippi ................................ 23 4,238 2,492 17 3,569 2,379 3,553 Missouri .................................... 39 5,852 3,694 18 4,597 3,266 43,831
Montana .................................... ( 2 ) ( 2 ) ( 2 ) 7 1,842 1,066 Nebraska .................................. 3 272 207 ( 2 ) ( 2 ) ( 2 ) 4,982 Nevada ..................................... 16 6,056 1,893 19 11,674 12,124 6,642 New Hampshire ........................ 8 5,218 2,364 10 2,336 1,934 2,082 New Jersey ............................... 48 9,095 9,678 24 8,040 7,549 2,259 New Mexico .............................. 8 1,759 1,473 – – – 553 New York .................................. 126 17,666 11,693 75 11,304 7,895 24,357 North Carolina ........................... 112 20,412 15,847 49 12,460 9,372 3,676 North Dakota ............................ ( 2 ) ( 2 ) ( 2 ) 4 801 763 2,729 Ohio .......................................... 52 12,493 8,381 65 13,254 13,761 166,841 Oklahoma ................................. 10 2,333 2,117 5 1,410 1,720 24,655 Oregon ...................................... 21 3,714 3,714 6 4,554 4,374 34,205 Pennsylvania ............................ 23 13,923 18,907 99 16,795 25,218 43,478
Rhode Island ............................. 10 1,237 621 5 1,160 514 15,257 South Carolina .......................... 17 1,657 3,709 5 481 588 38,718 South Dakota ............................ ( 2 ) ( 2 ) ( 2 ) – – – –Tennessee ................................ 45 8,714 5,212 16 2,663 2,026 37,727 Texas ........................................ 83 28,659 22,664 78 37,386 37,628 90,815 Utah .......................................... 18 6,228 4,225 12 1,650 908 158 Vermont .................................... 3 327 228 – – – 2,335 Virginia ...................................... 24 5,847 4,997 14 4,479 2,430 16,944 Washington ............................... 46 9,317 5,813 19 8,097 5,238 12,289 West Virginia ............................ 8 696 638 4 370 263 4,201 Wisconsin ................................. 23 5,291 4,019 31 7,095 6,930 2,709 Wyoming ................................... – – – – – – 1,486
Puerto Rico ............................... 23 8,489 4,565 26 6,073 2,561 16,817
Plant closures
State
1 See footnote 1, table 1.2 Data do not meet BLS or State agency disclosure standards.
NOTE: Dash represents zero.

��
Table 29. Industry distribution: Dislocated worker events, separations, and initial claimants for unemploymentinsurance, 2001
Substantial layoffs
Layoffevents
Separations
Initialclaimants
forunemployment
insurance
Layoffevents
Separations
Initialclaimants
forunemployment
insurance
Total 1 ............................................................... 1,553 401,755 269,430 1,333 412,651 321,180
Total private .......................................................... 1,552 401,680 269,291 1,322 367,762 318,183
Agriculture, forestry, fishing and hunting ………… 15 2,876 1,719 24 4,586 2,981 Mining ………………………………………………… 11 2,874 2,534 20 5,619 5,006 Utilities ………………………………………………… ( 2 ) ( 2 ) ( 2 ) 3 662 798 Construction ………………………………………… 31 2,767 2,025 216 37,182 31,489 Manufacturing ………………………………………… 778 175,449 146,005 614 164,227 157,182 Wholesale trade ……………………………………… 69 12,164 7,138 30 5,453 3,498 Retail trade …………………………………………… 215 72,144 47,224 33 8,914 6,602 Transportation and warehousing …………………… 49 11,266 8,026 53 43,359 30,374 Information …………………………………………… 97 19,940 15,100 65 14,710 10,918 Finance and insurance ……………………………… 42 10,927 7,334 16 4,130 3,103 Real estate and rental and leasing ………………… 9 3,278 1,189 ( 2 ) ( 2 ) ( 2 )Professional and technical services ……………… 66 9,189 5,903 54 12,302 10,405 Management of companies and enterprises ……… ( 2 ) ( 2 ) ( 2 ) ( 2 ) ( 2 ) ( 2 )Administrative and waste services ………………… 57 55,686 13,929 85 36,985 29,558 Educational services ………………………………… 7 974 613 3 473 190 Health care and social assistance ………………… 28 5,486 2,914 11 1,244 944 Arts, entertainment, and recreation ………………… 8 2,002 561 9 2,387 1,598 Accommodation and food services ………………… 36 10,527 4,577 37 17,397 16,842 Other services, except public administration ……… 8 693 547 16 3,103 2,515 Unclassified establishments ………………………… 23 2,928 1,649 30 4,489 3,949
Government .......................................................... 1 75 139 11 44,889 2,997
Plant closures
Industry
1 See footnote 1, table 1.2 Data do not meet BLS or State agency disclosure standards.

��
��������������������������������7�������&$$&!����2��������� �����������2� ������������������������&$$&��������� ����3����4�������� *�������
5������������ �������34*5 ��������������������������������������������������������������������������8���������������������������������������34*5 ������������������������� ��������*����������5������������� *5�!����������������������������������������������34*5 ������ *5�
Appendix A: Tables Displaying SIC-based Industry Data
�� ��� � ��� �� �/2�������� -������ ����� ������$�������++,���������������$���������������������������������5.'6-����-'6��� � ���-������!��������������������!���������������������������������5.'6-��� �'���� ���������� -���������������������������� �����
� �������������� ����������5.'6-���� �������� ������ � ������4�!�������������������� ����������������� ��������2������� ������������� ���������������-'6��� �

��
A-1. Industry distribution: Extended mass layoff events, separations, and initial claimants for unemployment insurance, 1999–2001
Industry
Initial claimants for unemployment insurance
1999 2000 2001 1999 2000 2001 1999 2000 2001
Total1 ..................................................................... 5,675 5,620 8,352 1,149,267 1,170,427 1,750,643 972,244 1,018,700 1,609,705
Total private .................................................................... 5,467 5,418 8,131 1,096,859 1,107,055 1,697,593 931,272 974,104 1,562,978
Agriculture .................................................................... 932 860 784 197,734 194,833 176,623 138,471 131,515 115,190 Nonagriculture ............................................................... 4,512 4,529 7,332 896,629 907,379 1,518,037 790,068 837,088 1,444,407 Manufacturing ........................................................... 1,758 1,824 3,304 360,806 363,961 632,705 315,726 367,699 694,873 Durable goods ........................................................ 916 987 2,199 186,769 202,798 428,069 162,616 218,906 501,107 Lumber and wood products ................................ 72 88 99 8,774 12,957 12,379 7,243 12,674 16,322 Furniture and fixtures .......................................... 35 38 122 4,805 5,074 18,099 4,856 4,553 19,388 Stone, clay, and glass products .......................... 69 72 80 9,636 10,326 13,527 9,685 9,742 13,481 Primary metal industries ..................................... 86 80 221 16,078 19,286 48,617 16,107 18,079 55,116 Fabricated metal products .................................. 105 129 228 15,033 19,677 31,140 15,205 20,946 35,034 Industrial machinery and equipment ................... 164 143 377 31,128 31,164 68,209 31,471 27,932 79,480 Electronic and other electrical equipment ........... 134 113 613 31,545 21,431 133,458 23,339 25,966 151,000 Transportation equipment ................................... 167 236 314 55,922 70,345 77,176 43,402 88,037 108,592 Instruments and related products ....................... 41 35 85 7,637 5,634 15,821 5,497 4,122 14,700 Miscellaneous manufacturing industries ............. 43 53 60 6,211 6,904 9,643 5,811 6,855 7,994
Nondurable goods .................................................. 842 837 1,105 174,037 161,163 204,636 153,110 148,793 193,766 Food and kindred products .................................. 343 334 353 83,659 74,656 72,853 63,344 66,260 65,773 Tobacco products ................................................ 9 10 11 3,425 2,645 3,915 2,119 2,247 2,435 Textile mill products ............................................. 76 53 127 16,260 13,359 27,380 18,281 13,168 29,323 Apparel and other textile products ....................... 176 177 195 31,319 27,957 30,718 33,468 28,802 31,586 Paper and allied products .................................... 45 63 91 6,925 9,948 16,845 5,897 8,787 15,069 Printing and publishing ......................................... 43 42 91 6,986 6,190 15,788 7,103 5,668 12,481 Chemicals and allied products ............................. 40 34 66 5,869 5,240 10,149 5,604 4,821 8,128 Petroleum and coal products ............................... 22 19 18 3,629 2,479 2,865 3,389 2,519 2,488 Rubber and miscellaneous plastics products ...... 67 83 131 12,864 14,784 20,757 10,864 13,423 23,620 Leather and leather products ............................... 21 22 22 3,101 3,905 3,366 3,041 3,098 2,863
Nonmanufacturing ..................................................... 2,754 2,705 4,028 535,823 543,418 885,332 474,342 469,389 749,534 Mining .................................................................... 88 48 61 15,931 6,215 13,109 17,607 5,450 12,476 Construction ............................................................ 799 750 771 117,764 109,205 110,566 119,389 111,205 113,795 Transportation and public utilities ........................... 266 322 609 55,937 57,425 156,832 49,878 55,805 133,896 Wholesale and retail trade ...................................... 547 507 821 140,343 132,681 205,007 96,827 98,382 166,044 Wholesale trade .................................................. 146 147 221 23,541 23,892 37,020 16,964 17,964 29,805 Retail trade .......................................................... 401 360 600 116,802 108,789 167,987 79,863 80,418 136,239 Finance, insurance, and real estate ........................ 128 131 203 25,088 33,618 40,045 20,001 20,412 33,751 Services .................................................................. 926 947 1,563 180,760 204,274 359,773 170,640 178,135 289,572
Not identified ................................................................ 23 29 15 2,496 4,843 2,933 2,733 5,501 3,381
Government .................................................................... 208 202 221 52,408 63,372 53,050 40,972 44,596 46,727 Federal .................................................................... 38 51 52 9,372 18,373 12,696 9,972 15,294 12,796 State ........................................................................ 43 35 41 14,796 9,164 10,498 8,626 6,301 8,838 Local ....................................................................... 127 116 128 28,240 35,835 29,856 22,374 23,001 25,093
Selected industry groupings2
High-technology-intensive industries……………………… 218 180 917 59,662 41,851 183,140 41,046 36,198 190,644 Food production, processing, and distribution…………… 1,493 1,342 1,360 325,243 303,953 304,875 236,905 227,333 230,579
1 Data on layoffs were reported by employers in all States and the District of Columbia.
2 See appendix B for descriptions of these industry groupings.
Layoff events Separations
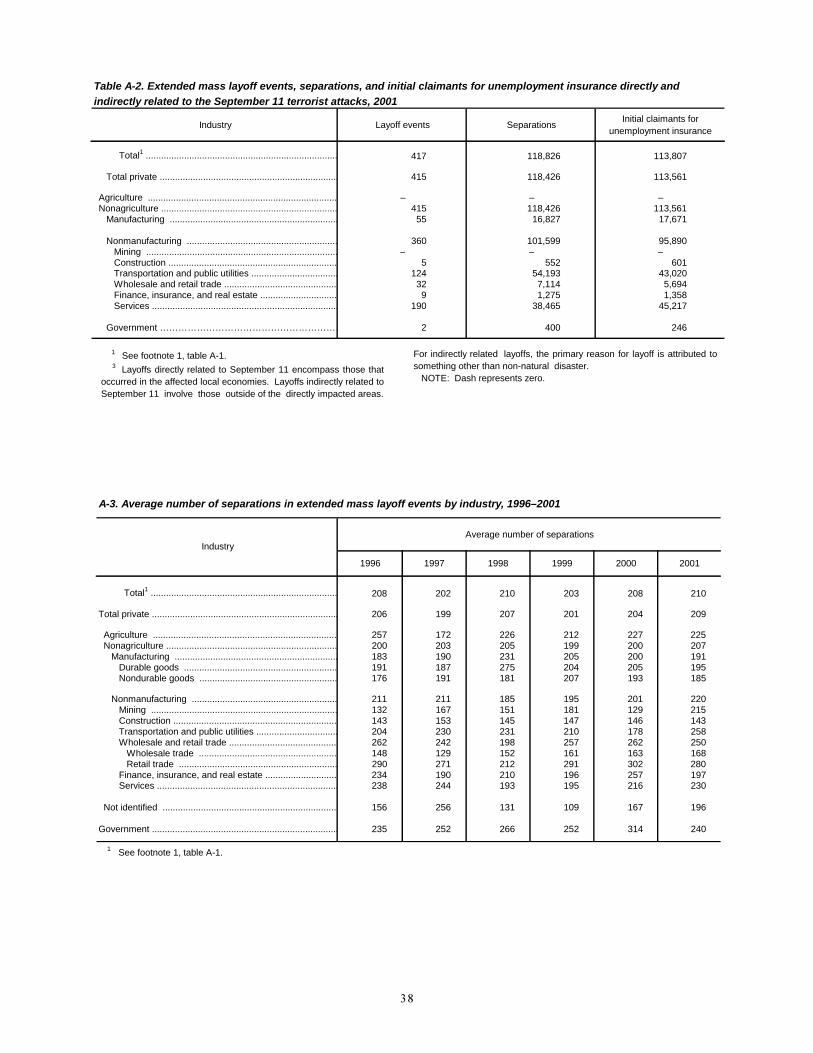
��
A-3. Average number of separations in extended mass layoff events by industry, 1996–2001
Average number of separations
1996 1997 1998 1999 2000 2001
Total1 ......................................................................... 208 202 210 203 208 210
Total private ......................................................................... 206 199 207 201 204 209
Agriculture ........................................................................ 257 172 226 212 227 225 Nonagriculture ................................................................... 200 203 205 199 200 207 Manufacturing ................................................................ 183 190 231 205 200 191 Durable goods ............................................................ 191 187 275 204 205 195 Nondurable goods ...................................................... 176 191 181 207 193 185
Nonmanufacturing ......................................................... 211 211 185 195 201 220 Mining ......................................................................... 132 167 151 181 129 215 Construction ................................................................ 143 153 145 147 146 143 Transportation and public utilities ................................ 204 230 231 210 178 258 Wholesale and retail trade ........................................... 262 242 198 257 262 250 Wholesale trade ...................................................... 148 129 152 161 163 168 Retail trade .............................................................. 290 271 212 291 302 280 Finance, insurance, and real estate ............................ 234 190 210 196 257 197 Services ....................................................................... 238 244 193 195 216 230
Not identified ..................................................................... 156 256 131 109 167 196
Government ......................................................................... 235 252 266 252 314 240
1 See footnote 1, table A-1.
Industry
Table A-2. Extended mass layoff events, separations, and initial claimants for unemployment insurance directly and indirectly related to the September 11 terrorist attacks, 2001
Industry Layoff events SeparationsInitial claimants for
unemployment insurance
Total1 ........................................................................... 417 118,826 113,807
Total private ...................................................................... 415 118,426 113,561
Agriculture .......................................................................... – – – Nonagriculture ..................................................................... 415 118,426 113,561 Manufacturing .................................................................. 55 16,827 17,671
Nonmanufacturing ........................................................... 360 101,599 95,890 Mining ........................................................................... – – – Construction .................................................................. 5 552 601 Transportation and public utilities .................................. 124 54,193 43,020 Wholesale and retail trade ............................................ 32 7,114 5,694 Finance, insurance, and real estate .............................. 9 1,275 1,358 Services ......................................................................... 190 38,465 45,217
Government …………………………………………………… 2 400 246
1 See footnote 1, table A-1. 3 Layoffs directly related to September 11 encompass those that
occurred in the affected local economies. Layoffs indirectly related toSeptember 11 involve those outside of the directly-impacted areas.
For indirectly-related layoffs, the primary reason for layoff is attributed tosomething other than non-natural disaster. NOTE: Dash represents zero.

�
Table A-4. Claimant characteristics by race and ethnicity: Percent of initial claimants for unemployment insurance,2000–2001
Percent of total race/ethnicity1
White BlackHispanic
originAmerican Indian or
Alaskan NativeAsian or Pacific
Islander
2000 2001 2000 2001 2000 2001 2000 2001 2000 2001
Total2 ............................................... 53.6 55.0 13.9 13.6 24.8 18.5 0.8 0.7 1.8 3.4
Total private ................................................ 54.1 55.5 13.0 13.0 25.5 18.7 .5 .6 1.9 3.5
Agriculture ............................................... 4.4 5.2 2.4 2.2 85.9 85.7 .1 .1 1.1 .9 Nonagriculture .......................................... 61.8 59.5 14.7 13.9 16.1 13.4 .6 .6 2.0 3.7 Manufacturing ....................................... 63.1 61.6 12.9 12.6 16.2 12.3 .6 .6 2.7 4.2
Nonmanufacturing ................................ 60.9 57.6 16.0 15.0 16.1 14.5 .6 .6 1.5 3.2 Mining ................................................ 85.4 86.3 3.8 3.6 4.7 4.4 1.4 1.3 .5 .2 Construction ....................................... 77.9 79.3 6.3 5.8 12.3 9.3 .6 .8 .5 .7 Transportation and public utilities ....... 64.1 58.8 17.8 17.6 9.9 9.4 .6 .4 1.2 3.0 Wholesale and retail trade ................. 57.9 55.7 16.8 15.7 17.7 17.1 .8 .7 1.7 2.6 Wholesale trade ............................. 48.0 51.9 9.9 9.9 34.0 22.7 .6 .6 3.6 4.5 Retail trade ..................................... 60.2 56.5 18.4 17.0 14.0 15.9 .8 .7 1.2 2.1 Finance, insurance, and real estate ... 51.9 46.9 22.3 20.1 13.1 10.4 .5 .4 3.2 3.6 Services .............................................. 51.1 49.7 20.7 16.9 20.2 18.3 .5 .6 1.9 4.7
Not identified ........................................... 66.8 47.3 18.5 24.8 5.6 8.3 1.0 .3 2.1 2.1
Government ................................................ 42.4 39.9 32.4 31.6 10.6 9.9 6.9 5.4 .9 1.2
1 Characteristic totals may not add to 100.0 percent due to some nonreporting. 2 See footnote 1, table A-1.
Industry
Table A-5. Claimant characteristics by age and gender: Percent of initial claimants for unemployment insurance, 2000–2001
Percent of total by gender1
Industry Under than 30 years 30 to 44 years 45 to 54 years 55 or older Men Women
2000 2001 2000 2001 2000 2001 2000 2001 2000 2001 2000 2001
Total2 .............................................. 20.6 20.2 41.1 40.7 23.4 24.0 13.2 13.2 57.5 56.9 42.0 42.3
Total private .............................................. 20.7 20.2 41.2 40.7 23.4 24.1 13.1 13.1 58.5 57.5 41.1 41.7
Agriculture .............................................. 24.1 23.5 45.3 44.9 19.1 19.6 11.2 11.6 66.2 64.9 33.6 34.9 Nonagriculture ......................................... 20.1 19.9 40.5 40.4 24.1 24.4 13.4 13.2 57.2 57.0 42.3 42.2 Manufacturing ..................................... 16.4 16.1 40.4 40.3 27.1 27.5 13.9 13.8 60.0 60.6 39.6 38.4
Nonmanufacturing .............................. 23.0 23.5 40.6 40.5 21.6 21.6 13.0 12.7 55.1 53.6 44.4 45.8 Mining .............................................. 16.1 12.1 39.7 33.1 29.4 39.8 14.4 14.6 92.1 94.4 7.0 5.5 Construction ...................................... 20.3 19.4 44.1 43.4 23.2 24.4 11.2 11.5 92.8 92.7 6.5 6.3 Transportation and public utilities .... 15.8 20.2 38.7 42.1 24.1 22.5 18.5 13.6 50.4 47.4 49.1 52.2 Wholesale and retail trade ................ 26.3 25.6 37.5 37.1 20.5 21.1 14.3 14.7 38.8 40.5 60.9 59.0 Wholesale trade ............................ 18.4 18.9 43.5 43.6 24.2 23.3 12.7 12.9 56.6 54.9 43.2 44.7 Retail trade .................................... 28.1 27.0 36.2 35.6 19.7 20.6 14.6 15.1 34.8 37.3 64.8 62.2 Finance, insurance, and real estate .. 26.7 25.3 41.3 42.7 20.0 19.0 10.5 10.4 31.2 40.7 68.6 58.9 Services ............................................ 25.0 25.6 40.7 40.7 20.4 19.9 12.1 11.8 43.5 48.3 55.8 50.9
Not identified .......................................... 23.0 25.0 44.2 43.6 22.6 20.5 9.9 9.9 59.8 49.3 40.1 44.7
Government .............................................. 18.9 20.7 39.4 38.8 23.4 22.7 15.0 14.5 37.4 36.1 62.0 63.4
1 Characteristic totals may not add to 100.0 percent due to some nonreporting. 2 See footnote 1, table A-1.
Percent of total by age1

�
Table A-6. Claimants for unemployment insurance associated with extended mass layoff events by industry, 2001
Number Average number
filed per initial claimant
Number
Percentage of initial claimants receiving final
payments
Total2…………………………………………………… 1,609,705 3,415,531 2.1 241,356 15.0
Total private ...................................................................... 1,562,978 3,318,137 2.1 233,002 14.9
Agriculture ...................................................................... 115,190 288,858 2.5 24,086 20.9 Nonagriculture ................................................................. 1,444,407 3,020,133 2.1 208,154 14.4 Manufacturing .............................................................. 694,873 1,455,620 2.1 109,645 15.8
Nonmanufacturing ....................................................... 749,534 1,564,513 2.1 98,509 13.1 Mining ....................................................................... 12,476 25,119 2.0 1,291 10.3 Construction .............................................................. 113,795 200,435 1.8 8,996 7.9 Transportation and public utilities ............................. 133,896 311,022 2.3 13,366 10.0 Wholesale and retail trade ........................................ 166,044 355,333 2.1 26,519 16.0 Wholesale trade .................................................... 29,805 79,444 2.7 6,043 20.3 Retail trade ............................................................ 136,239 275,889 2.0 20,476 15.0 Finance, insurance, and real estate…………………… 33,751 95,867 2.8 6,775 20.1 Services .................................................................... 289,572 576,737 2.0 41,562 14.4
Not identified .................................................................. 3,381 9,146 2.7 762 22.5
Government ...................................................................... 46,727 97,394 2.1 8,354 17.9
Continued claims without earnings1
Industry
Final payments for
unemployment insurance1
Initial claims for unemployment
insurance
Table A-7. Distribution of extended mass layoff events with expected recall, 1996–2001
1996 1997 1998 1999 2000 2001
Total1…………………………………….……… 60.5 65.8 60.2 59.9 60.7 44.6
Total private ............................................................. 60.7 65.4 60.0 59.6 60.6 44.0
Agriculture ............................................................ 92.8 95.5 93.2 92.6 91.6 93.1 Nonagriculture ....................................................... 56.3 60.5 55.0 52.9 54.9 38.7 Manufacturing .................................................... 55.5 58.2 55.8 47.3 48.5 33.4
Nonmanufacturing ............................................. 56.9 62.0 54.4 56.5 59.2 43.1 Mining ............................................................. 38.8 57.4 42.7 34.1 62.5 62.3 Construction .................................................... 70.0 73.2 69.0 72.7 81.3 72.6 Transportation and public utilities ................... 57.2 68.3 62.6 65.4 62.4 37.6 Wholesale and retail trade ............................... 41.3 45.4 45.7 44.4 40.8 29.7 Wholesale trade .......................................... 45.1 52.1 51.6 43.8 38.8 23.1 Retail trade .................................................. 40.3 43.7 43.9 44.6 41.7 32.2 Finance, insurance, and real estate…………… 12.9 16.1 9.0 11.7 12.2 6.9 Services ........................................................... 64.1 65.7 52.4 55.5 56.7 41.7
Not identified ......................................................... 57.1 70.0 14.3 34.8 31.0 46.7
Government ............................................................. 57.1 73.0 64.1 68.3 63.9 65.6 1 See footnote 1, table A-1.
IndustryPercent of layoff events
1 The MLS program tracks continued claim activity for initial claimantsassociated with extended mass layoffs once a month during the CurrentPopulation Survey (CPS) reference week, which is usually the week includ-ing the 12th day of the month. Continued claims with earnings are excluded
because such individuals are classified as employed in the CPS. Finalpayment information for MLS claimants is collected weekly. See appendix Bfor additional information.
2 See footnote 1, table A-1.

��
Table A-8. Number of extended mass layoff events and separations from whichthe employer does not expect a recall, 2001
Total1……………………………………………… 3,453 789,407
Total private ............................................................... 3,415 782,972
Agriculture ............................................................... 28 6,122 Nonagriculture .......................................................... 3,383 775,424 Manufacturing ....................................................... 1,723 365,971
Nonmanufacturing ................................................ 1,660 409,453 Mining ................................................................ 17 3,618 Construction ....................................................... 105 14,694 Transportation and public utilities ...................... 289 72,379 Wholesale and retail trade ................................. 486 126,053 Wholesale trade ............................................. 146 26,009 Retail trade ..................................................... 340 100,044 Finance, insurance, and real estate……………… 175 34,752 Services ............................................................. 588 157,957
Not identified ........................................................... 4 1,426
Government ............................................................... 38 6,435
Industry Layoff events Separations
1 See footnote 1, table A-1.
Table A-9. Permanent worksite closures: Extended mass layoff events and separations by major industry division, 1997–2001
1997 1998 1999 2000 2001 1997 1998 1999 2000 2001
Total1 ................................................ 615 683 684 778 1,253 157,957 154,273 185,298 188,660 379,790
Total private ............................................... 606 675 681 771 1,252 155,148 153,150 184,165 186,791 379,715
Agriculture ............................................... 10 12 10 15 11 2,817 1,569 2,059 3,206 2,081 Nonagriculture .......................................... 595 661 668 753 1,238 151,231 151,246 181,803 183,130 376,302 Manufacturing ...................................... 315 343 359 403 657 66,677 74,972 80,185 85,644 167,734
Nonmanufacturing ................................ 280 318 309 350 581 84,554 76,274 101,618 97,486 208,568 Mining ................................................ 13 9 19 4 9 2,877 1,535 5,549 488 2,812 Construction ....................................... 11 14 13 6 18 1,664 3,389 3,396 810 1,978 Transportation and public utilities ...... 29 22 38 42 76 6,299 7,034 7,865 8,584 18,184 Wholesale and retail trade ................. 141 137 149 158 265 48,510 35,277 59,486 53,028 87,488 Wholesale trade ............................. 22 34 31 43 59 3,361 7,081 5,122 9,172 14,096 Retail trade ..................................... 119 103 118 115 206 45,149 28,196 54,364 43,856 73,392 Finance, insurance, and real estate ... 24 41 19 27 44 5,682 9,345 4,192 6,260 13,305 Services ............................................. 62 95 71 113 169 19,522 19,694 21,130 28,316 84,801
Not identified ........................................... 1 2 3 3 3 1,100 335 303 455 1,332
Government ............................................... 9 8 3 7 1 2,809 1,123 1,133 1,869 75
1 See footnote 1, table A-1.
IndustryLayoff events Separations

��
Table A-10. Permanent worksite closures: Extended mass layoff events and separations, top 50 industries in 2001
Permanent closures
2000 2001
Layoff events Separations Rank1 Layoff events Separations Rank1
Total2 ................................................... … 778 188,660 … 1,253 379,790 …
Total, top 50 industries .................................. … 736 182,164 … 1,215 374,435 …
Business services ……………………………… 73 40 7,497 9 90 61,523 1 Electronic and other electric equipment ……… 36 27 6,091 11 93 36,902 2 General merchandise stores ………………… 53 26 17,989 1 58 27,439 3 Textile mill products …………………………… 22 31 9,449 5 72 18,271 4 Primary metal industries ……………………… 33 12 4,040 16 39 15,948 5 Apparel and other textile products …………… 23 68 10,278 3 82 14,752 6 Building materials and garden supplies ……… 52 7 3,039 21 24 13,018 7 Industrial machinery and equipment ………… 35 30 9,263 7 56 12,932 8 Food and kindred products …………………… 20 43 9,325 6 41 10,198 9 Miscellaneous retail …………………………… 59 16 3,910 17 34 9,760 10 Wholesale trade--nondurable goods ………… 51 25 6,140 10 36 9,224 11 Paper and allied products ……………………… 26 22 4,489 13 34 8,866 12 Food stores ……………………………………… 54 19 5,776 12 30 7,902 13 Furniture and fixtures ………………………… 25 14 2,556 23 36 7,844 14 Hotels and other lodging places ……………… 70 4 1,970 29 14 7,205 15 Communications ……………………………… 48 6 1,654 31 30 7,125 16 Furniture and homefurnishings stores ……… 57 22 9,739 4 30 7,082 17
Rubber and miscellaneous plastics products 30 19 3,077 20 25 6,988 18 Transportation equipment …………………… 37 28 8,884 8 29 6,988 18 Printing and publishing ………………………… 27 11 1,633 32 22 6,396 20 Fabricated metal products …………………… 34 24 3,870 18 38 6,239 21 Engineering and management services ……… 87 5 621 44 18 5,575 22 Wholesale trade--durable goods ……………… 50 18 3,032 22 23 4,872 23 Health services ………………………………… 80 43 14,760 2 19 4,608 24 Nondepository institutions …………………… 61 11 2,453 24 11 4,340 25 Apparel and accessory stores ………………… 56 14 2,264 26 10 4,172 26 Transportation by air …………………………… 45 5 911 38 7 3,979 27 Chemicals and allied products ………………… 28 4 345 51 19 3,704 28 Lumber and wood products …………………… 24 23 4,386 14 27 3,504 29 Trucking and warehousing …………………… 42 19 4,101 15 14 3,048 30 Miscellaneous manufacturing industries …… 39 9 1,240 33 15 3,037 31 Insurance carriers ……………………………… 63 11 3,660 19 13 3,008 32 Eating and drinking places …………………… 58 5 658 42 15 2,829 33 Real estate ……………………………………… 65 ( 3 ) ( 3 ) 60 3 2,377 34
Leather and leather products ………………… 31 13 2,422 25 11 2,132 35 Amusement and recreation services ………… 79 4 575 45 7 1,978 36 Metal mining …………………………………… 10 ( 3 ) ( 3 ) 57 5 1,807 37 Motion pictures ………………………………… 78 4 1,047 36 5 1,686 38 Security and commodity brokers ……………… 62 – – 61 6 1,646 39 Transportation services ……………………… 47 ( 3 ) ( 3 ) 50 14 1,561 40 Depository institutions ………………………… 60 – – 61 8 1,394 41 Special trade contractors ……………………… 17 4 629 43 11 1,382 42 Nonclassifiable establishments ……………… 99 4 1,201 34 3 1,332 43 Stone, clay, and glass products ……………… 32 8 1,756 30 7 1,244 44 Agricultural production crops ………………… 01 5 1,035 37 6 1,214 45 Local and interurban passenger transit ……… 41 5 713 40 6 1,197 46 Automotive dealers and service stations …… 55 6 481 47 5 1,190 47 Instruments and related products …………… 38 14 2,226 27 7 1,111 48 Coal mining ……………………………………… 12 3 412 48 4 1,005 49 Water transportation …………………………… 44 ( 3 ) ( 3 ) 58 3 901 50
1 Industries are ranked by the number of separations in 2001. 3 Data do not meet BLS or State agency disclosure standards. 2 See footnote 1, table A-1. NOTE: Dash represents zero.
Industry SIC

��
Table A-11. Industry distribution: Dislocated worker events, separations, and initial claimants for unemploymentinsurance, 2001
Substantial layoffs
Layoffevents
Separations
Initialclaimants
forunemployment
insurance
Layoffevents
Separations
Initialclaimants
forunemployment
insurance
Total 1 ............................................................... 1,553 401,755 269,430 1,331 374,001 320,831
Total private .......................................................... 1,552 401,680 269,291 1,322 367,762 318,183
Agriculture .......................................................... 14 2,616 1,529 24 4,586 2,981 Nonagriculture ..................................................... 1,532 397,605 266,905 1,293 362,169 314,022 Manufacturing ................................................. 794 178,439 147,232 618 164,217 156,958
Nonmanufacturing .......................................... 738 219,166 119,673 675 197,952 157,064 Mining .......................................................... 11 2,874 2,534 21 5,799 5,077 Construction .................................................. 31 2,710 1,987 221 37,260 31,498 Transportation and public utilities ................ 101 19,849 14,997 100 55,096 39,986 Wholesale and retail trade ............................ 321 91,361 58,274 83 18,630 13,104 Wholesale trade ........................................ 80 14,986 8,544 38 7,356 5,127 Retail trade ................................................ 241 76,375 49,730 45 11,274 7,977 Finance, insurance, and real estate………… 49 13,650 8,174 18 4,409 3,229 Services ........................................................ 225 88,722 33,707 232 76,758 64,170
Not identified ...................................................... 6 1,459 857 5 1,007 1,180
Government .......................................................... 1 75 139 9 6,239 2,648
1 See footnote 1, table A-1.
Plant closures
Industry

��
����2�������� �����������2� ��������������9�������� ���������������������������������(��!�����������������������������!�����������!�����������������
���������1��1����������!�������������������� ����.������������������������:*������������� ��������������������������������,$�����������������������������������������������������������������������������,������������������������������� ���������������������������:*����������������������������������������������������������#'������������!����!����!����������������������������������������������������������������������������������������������� ������������������������������������������������������������ ���� ������!� ���������������� ����������������������������������������������������������������!����!�������!������������!����������������������������2� ��������������������������������������.��������������������������!���������������������������������������������������������������%������������2� �������������������4�����'--,)������������
��������������3�������'--&����������������������6������!������������������������������������������!�������������������������������������������������������������
Definitions
����������� �������� ��� �������������� � '��� ��� � ������������������������������ ��������������������%�� �5.'6-��� ������ ��� ��������������������F������������F���2������� F��������������������F�����!����������������F��������������������� ����������!���� ���� F������� ���� F� ���� ���� F������������ ���� F�����������!���������� ������������
���������� ��������������������������������������������������'��� ��� ������������������������������ �������������������� ��������� ���������������������������%�� ��5.'6-��� ������ ��� �������� ���������������������������������F�������������������������$�������������������F������������ ��$�������������������F� ����� ����������$������������������F� ������������� ���� ���������� ���������� �����������F ���!���� ���������F� ��������� ���� ���!������������!���� ���� F�������������� ���!���� ���� F� ���!��������� ��� F���������� � ��� ��� �������������� ����� F����������������F�������������������������������������
Appendix B: Technical Note
����������������.���������������������������������������������������������� ��������!����������������������������������������!��(�������������������%���� -�������������� �������������� �������!��(��������������%���� ����������������������!��(������������ ������������������������������� �������������� �����6�������;���������-�����"6;-#�����������!��(���A���� ��������������� ������������(�����������!��( ������2������� �������� �����3���� �������� ��������������
�������������.���������� ������� ���������������!������������������������������������������� �����������
������������ ������8��������������������� �������������������� ������������� ���������� ���� ������������,�!��(��������!��������� ��,��!��(�� � ���������������������������� �
������������������������;�� �� �!���������2��� ����������������������������� ������������� ��������������������������������������������� �
���� ����������� ����������� ��� ������������ ��� �!"�'��� ��� ��������������������������������������� �������������������%�� ��5.'6-��� ������ ��� ���������� ����������������F�������������������������F�����������������������F���������� ���!�������������F� ������������F����������F���������������������F�����������������������F���������������F�������������������������F� ������������������F��������$���������F�����������F��������������������������F�� ����������������������F� ��� ������������ �������� ���� ��������F� ��������� ���� �������� ���������F� ������ �� ������ �� ���������� F���������������������� ��������!������� F����������������� ����� F� ������������� ��������������������F����������������F��������������������F���������������������������!���� ���� F����������������!�������������������!���� ���� �F���������������������������!���� ����� F������ ����� ����������!���� ���� F����������������� ���� F������"������#� ���������� ���� F������������!������� ������ �����F� �������������!������ ������ ������F� ���������� ����� F� ���� ����� ����� � ���� ���(������ �
������������������������������������������! �"�� � '���� ��� ��������������������������������������� �������

��
��� ������ �%�� ��-'6��� ��� ��� ��� � ������� �������������������I���� F� ����������� ���������I��� ���(F� ������������� ����� F������ ����� F����������� ����� F�������� ����� ���2��������������� ����� F��������������������������� ����� F�� ���������������������F���������(������������� F������������������� F������� ��������������������� F����������������!�������� F�������!�������� ������ ������� F� ����� ���� F� ���� ����� ���� ���(������ �
#�����������������������������������! �"���'��� ��� ������������������������ ������������ ���,��� �����������������������!��(�� ��������� ����!��(�� ������+���������������������!��(�� ��������� ����!��(�� ���-'6��� ������� ��� ���������� ������������������� ������������������ F���� ������������������ F���� F������������������� �$������F� ����������� � �$������F� ������������������ ��������� ��� F����������������� F������� � �� �� ����������� ���������� F� �������������������$�������F���� ����������������������� F����������������������� �� ����� F������� ������������ ��� ����� �
��������������� �.���� ���!������ �����������������������������������������$�� ��������������������������������������������������������������� ��������������� ���
�$���������������������������!������������������������������������
$��� ���%��� ��������������� �� ������������������� ������������ ����������������"-�������!�#�-���������� ��������������� �� �!������� ��3���� ����������������� ��!����������������
%������� ���8��������������������� ������������������ ������������� ���������� ���� ��������������������������������� ������������
&��'��������������%����������� ������������������������ ��������� ���� ����� ������������������ ������������������ ����� ���������!����������!��( �� ������������������� ������� ����������������������� ���
������������ �������� ������������������������!���������������������������� �������� ���!���������� � �����%����������������� �������� ������������� �� ����������������� ��������$�� ����=���������J�"���#�&+���*�*F�8�������E�����-�����J���*���*���*��+���/���������� J���� �(��������


![Untitled-2 []...˘ˇ ˆ ˙ ˇ ˙ ˝ ˛ ˚ˆ ˇ ˛ ˆ ˜ ˆ ˜ ˛ ˆˆ˙ !" # ˙ ˇ ˆ $ ˜ˆ ˆˆ $ ˛ ˙ ˛ ˛ ˆ ˆ ˜ ˆ ˆ $ ˝ ˛ ˚ˆ ˇ ˛ ˙ ˇ ˆ ˇˇ ˆˆ ...](https://static.fdocuments.in/doc/165x107/5e66db259e270c079278a430/untitled-2-oe-oe-.jpg)