Extended DLVO calculations expose the role of the structural nature of the adsorbent beads during...
11
1068 J. Sep. Sci. 2012, 35, 1068–1078 Muhammad Aasim 1,2 Noor Shad Bibi 1 Rami Reddy Vennapusa 1 Marcelo Fernandez-Lahore 1 1 Downstream Bioprocessing Laboratory, School of Engineering and Science, Jacobs University, Bremen, Germany 2 Department of Biotechnology, University of Malakand, Pakhtunkhwa, Pakistan Received September 19, 2011 Revised February 08, 2012 Accepted February 09, 2012 Research Article Extended DLVO calculations expose the role of the structural nature of the adsorbent beads during chromatography Protein adsorption onto hydrophobic interaction chromatography supports was studied by a surface-thermodynamics approach. To gather relevant experimental information, contact angle measurements and zeta potential determinations were performed on three differ- ent commercial adsorbent beads, Phenyl Sepharose 6 Fast Flow, Toyopearl Phenyl 650-C and Source 15 Phenyl, having soft to rigid backbone structure. Similar information was obtained for a collection of model proteins, lysozyme, bovine serum albumin (BSA), poly- galacturonase, aminopeptidase, chymosin, aspartic protease, beta-galactosidase, human im- munoglobulin G, and lactoferrin, were evaluated in the hydrated and in the dehydrated state. Based on the mentioned experimental data, calculations were performed to obtain the (inter- facial) energy versus distance profiles of nine individual (model) proteins on (commercial) beads of three different types. All of these beads harbored the phenyl-ligand onto a matrix of differentiated chemical nature. Extended Derjaguin, Landau, Verwey, and Overbeek (DLVO) calculations were correlated with actual chromatographic behavior. Typical chromatography conditions were employed. The population of model proteins utilized in this study could be segregated into two groups, according to the minimum values observed for the resulting interaction energy pockets and the corresponding retention volumes (or times) during chro- matography. Moreover, trends were also identified as a function of the type of adsorbent bead under consideration. This has revealed the influence of the physicochemical nature of the bead structure on the adsorption process and consequently, on the expected separation behavior. Keywords: Adsorption of proteins / Chromatography / Surface energetics DOI 10.1002/jssc.201100719 1 Introduction Hydrophobic interaction chromatography (HIC) is an impor- tant and powerful method for the separation of biologically and pharmaceutically relevant (bio) products, including many (bio) therapeutic agents already in the market. The method presents several advantages including the potential for rapid separation, high resolution, and gentle conditions for protein separation [1]. HIC is generally believed to separate proteins (and other products) on the basis of a reversible interaction between the hydrophobic patches available on the separand surface with aromatic of alkyl ligands immobilized onto chro- matography beads [2,3]. Protein adsorption onto hydrophobic supports has been widely investigated in terms of the influ- ence of the pH and composition of the mobile phase (e.g. Correspondence: Dr. Marcelo Fernandez-Lahore, Downstream Bioprocessing Laboratory, Jacobs University, Campus Ring 1, D-28759 Bremen, Germany E-mail: [email protected] Fax: +49 421 200 3249 Abbreviations: AB, acid–base; EL, electrostatic; LW, Lifshitz– Van der Waals; m, chromatographic material; MWCO, molec- ular weight cut off (kDa); p, protein particle type and concentration of added salts) or the chemical nature of the ligand per se and its density [4–6]. During HIC separation, more hydrophilic proteins are retained at high salt concentration while more hydrophobic ones tend to be eluted with descending salt gradient and/or by incorporation of an organic modifier to the mobile phase [3,4]. Consequently, many studies have focused on the separation properties of the various available ligands (e.g. butyl, octyl, or phenyl) but less attention has been given to the influence of the backbone structure (e.g. based on cross-linked agarose and/or dextran, or synthetic polymers like methacrylates) on the overall chromatography process [4, 6, 7]. Several research groups have attempted to predict protein chromatography behavior onto hydrophobic supports with varying degree of success but none of their approaches has gained universal acceptance. Some strategies employed to shed light on the underlying mechanisms of protein sepa- ration behavior during chromatography include isothermal titration calorimetry [4, 8], calculation of (protein) average (or localized) surface hydrophobicity [2, 6, 9–11], and exam- ination of (protein) structural features [6, 10, 12]. All these efforts illustrate the fact that, despite many years of utiliza- tion of chromatography techniques, there is still a need for a better fundamental understanding of the underlying pro- cesses occurring during protein separation. C 2012 WILEY-VCH Verlag GmbH & Co. KGaA, Weinheim www.jss-journal.com
-
Upload
muhammad-aasim -
Category
Documents
-
view
217 -
download
2
Transcript of Extended DLVO calculations expose the role of the structural nature of the adsorbent beads during...

1068 J. Sep. Sci. 2012, 35, 1068–1078
Muhammad Aasim1,2
Noor Shad Bibi1Rami Reddy Vennapusa1
Marcelo Fernandez-Lahore1
1Downstream BioprocessingLaboratory, School ofEngineering and Science,Jacobs University, Bremen,Germany
2Department of Biotechnology,University of Malakand,Pakhtunkhwa, Pakistan
Received September 19, 2011Revised February 08, 2012Accepted February 09, 2012
Research Article
Extended DLVO calculations expose the roleof the structural nature of the adsorbentbeads during chromatography
Protein adsorption onto hydrophobic interaction chromatography supports was studied bya surface-thermodynamics approach. To gather relevant experimental information, contactangle measurements and zeta potential determinations were performed on three differ-ent commercial adsorbent beads, Phenyl Sepharose 6 Fast Flow, Toyopearl Phenyl 650-Cand Source 15 Phenyl, having soft to rigid backbone structure. Similar information wasobtained for a collection of model proteins, lysozyme, bovine serum albumin (BSA), poly-galacturonase, aminopeptidase, chymosin, aspartic protease, beta-galactosidase, human im-munoglobulin G, and lactoferrin, were evaluated in the hydrated and in the dehydrated state.Based on the mentioned experimental data, calculations were performed to obtain the (inter-facial) energy versus distance profiles of nine individual (model) proteins on (commercial)beads of three different types. All of these beads harbored the phenyl-ligand onto a matrix ofdifferentiated chemical nature. Extended Derjaguin, Landau, Verwey, and Overbeek (DLVO)calculations were correlated with actual chromatographic behavior. Typical chromatographyconditions were employed. The population of model proteins utilized in this study could besegregated into two groups, according to the minimum values observed for the resultinginteraction energy pockets and the corresponding retention volumes (or times) during chro-matography. Moreover, trends were also identified as a function of the type of adsorbentbead under consideration. This has revealed the influence of the physicochemical nature ofthe bead structure on the adsorption process and consequently, on the expected separationbehavior.
Keywords: Adsorption of proteins / Chromatography / Surface energeticsDOI 10.1002/jssc.201100719
1 Introduction
Hydrophobic interaction chromatography (HIC) is an impor-tant and powerful method for the separation of biologicallyand pharmaceutically relevant (bio) products, including many(bio) therapeutic agents already in the market. The methodpresents several advantages including the potential for rapidseparation, high resolution, and gentle conditions for proteinseparation [1]. HIC is generally believed to separate proteins(and other products) on the basis of a reversible interactionbetween the hydrophobic patches available on the separandsurface with aromatic of alkyl ligands immobilized onto chro-matography beads [2,3]. Protein adsorption onto hydrophobicsupports has been widely investigated in terms of the influ-ence of the pH and composition of the mobile phase (e.g.
Correspondence: Dr. Marcelo Fernandez-Lahore, DownstreamBioprocessing Laboratory, Jacobs University, Campus Ring 1,D-28759 Bremen, GermanyE-mail: [email protected]: +49 421 200 3249
Abbreviations: AB, acid–base; EL, electrostatic; LW, Lifshitz–Van der Waals; m, chromatographic material; MWCO, molec-ular weight cut off (kDa); p, protein particle
type and concentration of added salts) or the chemical natureof the ligand per se and its density [4–6].
During HIC separation, more hydrophilic proteins areretained at high salt concentration while more hydrophobicones tend to be eluted with descending salt gradient and/or byincorporation of an organic modifier to the mobile phase [3,4].Consequently, many studies have focused on the separationproperties of the various available ligands (e.g. butyl, octyl,or phenyl) but less attention has been given to the influenceof the backbone structure (e.g. based on cross-linked agaroseand/or dextran, or synthetic polymers like methacrylates) onthe overall chromatography process [4, 6, 7].
Several research groups have attempted to predict proteinchromatography behavior onto hydrophobic supports withvarying degree of success but none of their approaches hasgained universal acceptance. Some strategies employed toshed light on the underlying mechanisms of protein sepa-ration behavior during chromatography include isothermaltitration calorimetry [4, 8], calculation of (protein) average(or localized) surface hydrophobicity [2, 6, 9–11], and exam-ination of (protein) structural features [6, 10, 12]. All theseefforts illustrate the fact that, despite many years of utiliza-tion of chromatography techniques, there is still a need for abetter fundamental understanding of the underlying pro-cesses occurring during protein separation.
C© 2012 WILEY-VCH Verlag GmbH & Co. KGaA, Weinheim www.jss-journal.com

J. Sep. Sci. 2012, 35, 1068–1078 Liquid Chromatography 1069
The deposition of colloidal particles and nanosized bod-ies onto a broad range of solid materials has been con-ceptualized within the frame provided by several interfacial-energy-of-interaction-related theories [13, 14]. For example,the so-called extended Derjaguin, Landau, Verwey, and Over-beek (DLVO) approach has been successfully utilized to eval-uate the adhesion of biological particles in the context ofbioprocessing, biomedical engineering, and environmentalsystems [13, 15–17]. Moreover, the same theoretical frame-work proved to be appropriate for protein interaction studies[7, 18–22] and to predict protein behavior during chromatog-raphy [22].
According to the extended DLVO theory, overall proteininteraction(s) to hydrophobic supports in aqueous media mayrepresent the net effect of Lifshitz–Van der Waals (LW),Lewis acid–base (AB), and Coulombic type forces/energies[22]. Coulomb-type energy contributions are dramatically re-duced at high salt concentrations due to charge-maskingeffects. Salts are typically employed during ion-exchangechromatography to elute proteins, which were previously ad-sorbed employing a mobile phase of low conductivity (or ionicstrength) [23,24]. An extensive body of knowledge is availableon the mentioned theory and its applications [4,15,21,25,26].
In this study, a surface thermodynamics approach wasemployed to understand protein adsorption during chro-matography on hydrophobic interaction systems. The role ofthe physicochemical nature of the adsorbent-bead backbonewas of particular interest.
1.1 Theoretical background
According to the classical DLVO theory, the interaction en-ergy between two colloidal bodies is the overall sum of LWand electrostatic/Coulombic-type (EL) energies, as follows:
UDLVOmwp = ULW
mwp + UELmwp (1)
where UDLVO is the total interaction energy, ULW is LW in-teraction energy, and UEL is the EL interaction energy. Thesubscript m refers to chromatographic matrix, w refers toaqueous environment, and p refers to protein (or particle).Classical DLVO theory has been “extended” by including an-other short-range AB energy component, which accounts foran additional interaction, according to:
UXDLVOmwp = ULW
mwp + UELmwp + UAB
mwp (2)
where UXDLVO is the total interaction energy and UAB is theAB energy component [16, 21, 27].
The energy components stated above can be experimen-tally assessed by contact angle measurements (CAMs) (e.g.the LW and AB components) and zeta potential determina-tions (e.g. the EL component) [16, 17, 22, 27]. Briefly, contactangle values are employed to calculate the apolar �LW and po-lar surface �ABtension parameters of the interacting surfacesby application of the modified Young–Dupre equation:
�l (cos � + 1) − 2√
�LWs �LW
l = 2√
�−s �+
l + 2√
�+s �−
l (3)
Table 1. Expressions for calculating the free energies of interac-tion �GLW and �GAB from the surface tension values
Energya) Expression
�GLW 2(√
�LWm −
√�LW
w
) (√�LW
p −√
�LWw
)
�GAB 2√
�+w
(√�−
m +√
�−p −
√�−
w
)
+2√
�−w
(√�+
m +√
�+p −
√�+
w
)
−2(√
�+m �−
p +√
�−m �+
p
)
a) Interaction energy components m, refers to chromatographicbead; w, aqueous environment; p, protein particle.
where � stands for contact angle, the subscripts l and s refersto liquid media and solid surface, respectively. The �AB canbe further divided to electron donor �− and electron acceptor�+ parameters. The total surface tension can be representedas the sum of AB and LW surface tension parameters [13,16],as follows:
�s = �LWs + �AB
s (4)
where �s is the total surface energy, �LWs is the apolar energy
component, and �ABs is polar energy component. In this ex-
pression the different parameters can be quantitated by thefollowing expressions:
�ABs = 2
√�−
s �+s (5)
where �−s is electron donating/base and �+
s is the electronaccepting/acid component of free energy. These parameterscan be obtained from a combination of polar probe liquids,water and formamide.
On the other hand, the LW energy component of theprotein or matrix can be estimated utilizing an apolar liquidi.e. 1-bromonephthalene as its polar component �AB is closeto zero [21].
�LWs =
{√�lv (cos � + 1)
2
}2
(6)
The surface tension parameters referred to above can beutilized to calculate the free energies of interaction �GLW
and �GAB (at the shortest distance of approximation i.e.1.57 × 10−10 m) between two interacting bodies [16]. �GEL canbe directly calculated from zeta potential values [16]. �GLW
and �GAB can be calculated from the expressions shown inTable 1. Free energies of interaction (�GLW, �GAB, and �GEL)can be further used to calculate interaction energies, be-tween two interacting bodies, as function of distance. For therequired calculations, sphere-flat plane geometry has beenassumed [14,21]. The expressions for ULW, UAB, and UEL andthe relevant parameters are shown in Table 2 [21, 28].
C© 2012 WILEY-VCH Verlag GmbH & Co. KGaA, Weinheim www.jss-journal.com
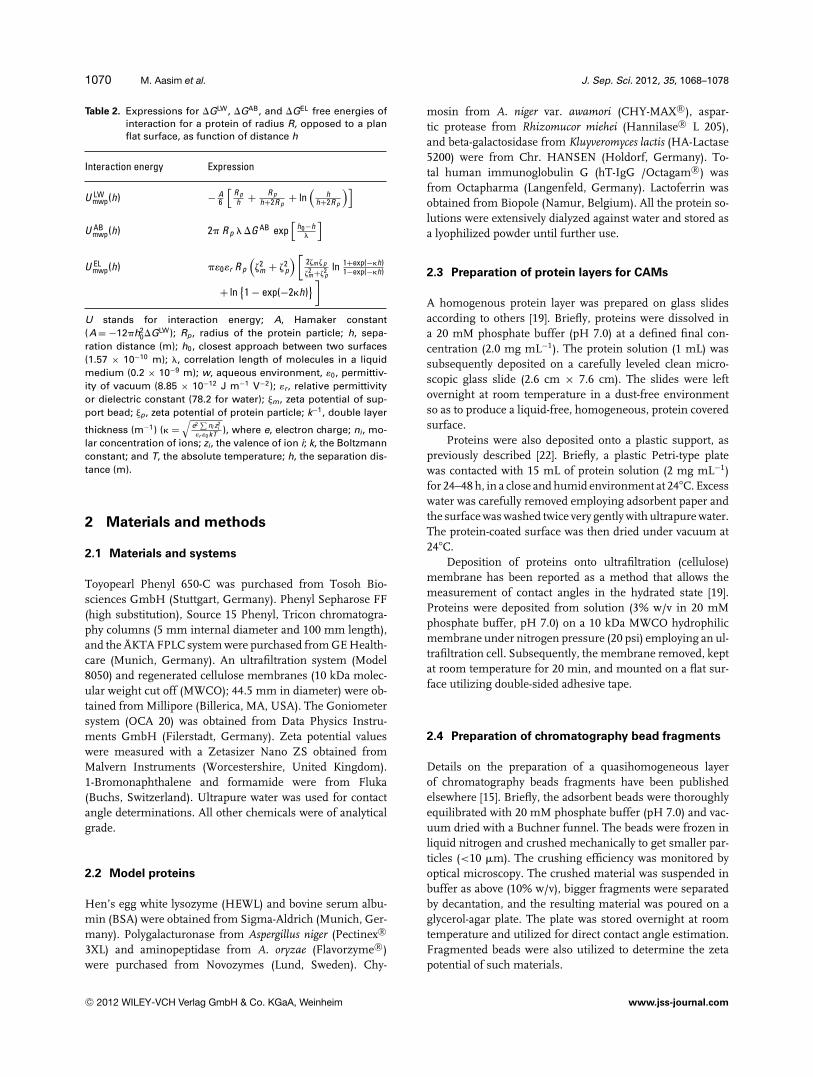
1070 M. Aasim et al. J. Sep. Sci. 2012, 35, 1068–1078
Table 2. Expressions for �GLW, �GAB, and �GEL free energies ofinteraction for a protein of radius R, opposed to a planflat surface, as function of distance h
Interaction energy Expression
U LWmwp(h) − A
6
[R ph + R p
h+2R p+ ln
(h
h+2R p
)]
U ABmwp(h) 2� R p � �G AB exp
[h0−h
�
]
U ELmwp(h) ��0�r R p
(�2
m + �2p
) [2�m �p
�2m +�2
pln 1+exp(−h)
1−exp(−h)
+ ln{
1 − exp(−2h)} ]
U stands for interaction energy; A, Hamaker constant(A = −12�h2
0�GLW); Rp, radius of the protein particle; h, sepa-ration distance (m); h0, closest approach between two surfaces(1.57 × 10⁻¹⁰ m); �, correlation length of molecules in a liquidmedium (0.2 × 10⁻⁹ m); w, aqueous environment, �0, permittiv-ity of vacuum (8.85 × 10⁻¹² J m−1 V−2); �r, relative permittivityor dielectric constant (78.2 for water); m, zeta potential of sup-port bead; p, zeta potential of protein particle; k−1, double layer
thickness (m−1) ( =√
e2∑
ni z2i
�r �0kT ), where e, electron charge; ni, mo-lar concentration of ions; zi, the valence of ion i; k, the Boltzmannconstant; and T, the absolute temperature; h, the separation dis-tance (m).
2 Materials and methods
2.1 Materials and systems
Toyopearl Phenyl 650-C was purchased from Tosoh Bio-sciences GmbH (Stuttgart, Germany). Phenyl Sepharose FF(high substitution), Source 15 Phenyl, Tricon chromatogra-phy columns (5 mm internal diameter and 100 mm length),and the AKTA FPLC system were purchased from GE Health-care (Munich, Germany). An ultrafiltration system (Model8050) and regenerated cellulose membranes (10 kDa molec-ular weight cut off (MWCO); 44.5 mm in diameter) were ob-tained from Millipore (Billerica, MA, USA). The Goniometersystem (OCA 20) was obtained from Data Physics Instru-ments GmbH (Filerstadt, Germany). Zeta potential valueswere measured with a Zetasizer Nano ZS obtained fromMalvern Instruments (Worcestershire, United Kingdom).1-Bromonaphthalene and formamide were from Fluka(Buchs, Switzerland). Ultrapure water was used for contactangle determinations. All other chemicals were of analyticalgrade.
2.2 Model proteins
Hen’s egg white lysozyme (HEWL) and bovine serum albu-min (BSA) were obtained from Sigma-Aldrich (Munich, Ger-many). Polygalacturonase from Aspergillus niger (Pectinex R©
3XL) and aminopeptidase from A. oryzae (Flavorzyme R©)were purchased from Novozymes (Lund, Sweden). Chy-
mosin from A. niger var. awamori (CHY-MAX R©), aspar-tic protease from Rhizomucor miehei (Hannilase R© L 205),and beta-galactosidase from Kluyveromyces lactis (HA-Lactase5200) were from Chr. HANSEN (Holdorf, Germany). To-tal human immunoglobulin G (hT-IgG /Octagam R©) wasfrom Octapharma (Langenfeld, Germany). Lactoferrin wasobtained from Biopole (Namur, Belgium). All the protein so-lutions were extensively dialyzed against water and stored asa lyophilized powder until further use.
2.3 Preparation of protein layers for CAMs
A homogenous protein layer was prepared on glass slidesaccording to others [19]. Briefly, proteins were dissolved ina 20 mM phosphate buffer (pH 7.0) at a defined final con-centration (2.0 mg mL−1). The protein solution (1 mL) wassubsequently deposited on a carefully leveled clean micro-scopic glass slide (2.6 cm × 7.6 cm). The slides were leftovernight at room temperature in a dust-free environmentso as to produce a liquid-free, homogeneous, protein coveredsurface.
Proteins were also deposited onto a plastic support, aspreviously described [22]. Briefly, a plastic Petri-type platewas contacted with 15 mL of protein solution (2 mg mL−1)for 24–48 h, in a close and humid environment at 24�C. Excesswater was carefully removed employing adsorbent paper andthe surface was washed twice very gently with ultrapure water.The protein-coated surface was then dried under vacuum at24�C.
Deposition of proteins onto ultrafiltration (cellulose)membrane has been reported as a method that allows themeasurement of contact angles in the hydrated state [19].Proteins were deposited from solution (3% w/v in 20 mMphosphate buffer, pH 7.0) on a 10 kDa MWCO hydrophilicmembrane under nitrogen pressure (20 psi) employing an ul-trafiltration cell. Subsequently, the membrane removed, keptat room temperature for 20 min, and mounted on a flat sur-face utilizing double-sided adhesive tape.
2.4 Preparation of chromatography bead fragments
Details on the preparation of a quasihomogeneous layerof chromatography beads fragments have been publishedelsewhere [15]. Briefly, the adsorbent beads were thoroughlyequilibrated with 20 mM phosphate buffer (pH 7.0) and vac-uum dried with a Buchner funnel. The beads were frozen inliquid nitrogen and crushed mechanically to get smaller par-ticles (<10 �m). The crushing efficiency was monitored byoptical microscopy. The crushed material was suspended inbuffer as above (10% w/v), bigger fragments were separatedby decantation, and the resulting material was poured on aglycerol-agar plate. The plate was stored overnight at roomtemperature and utilized for direct contact angle estimation.Fragmented beads were also utilized to determine the zetapotential of such materials.
C© 2012 WILEY-VCH Verlag GmbH & Co. KGaA, Weinheim www.jss-journal.com
J. Sep. Sci. 2012, 35, 1068–1078 Liquid Chromatography 1071
2.5 Measurement of contact angle values
Contact angle values were measured according to the ses-sile drop technique utilizing a commercial Goniometer [13].Three diagnostic liquids were employed, namely water, form-amide, and 1-bromonaphthalene. The surface properties ofthese liquids are available in [25,29]. Small drops of the probeliquids (2–5 �L) were dispensed on the sample and on thecontrol surfaces. CAMs were performed by taking videos ofa sessile drop of the probe liquid(s) for around 300 framesat a rate of 25 frames/s. CAMs were performed six timesfor each probe liquid at room temperature. The measuredcontact angle values were utilized for surface energy calcula-tions, according to the AB theory [21], utilizing a commercialsoftware package (SCA 20).
All CAMs were performed on smooth, fully covered, sup-porting surfaces like agar plates or glass/plastic/membranesurfaces. Controls were performed with clean surfaces thatprovided contact angle values similar to those reported in theliterature for such surfaces. Controls were also performedwith nonfunctionalized beads [16, 17].
2.6 Determination of zeta potential values
Zeta potential determinations on protein samples were per-formed employing 2.0 mg mL−1 solutions prepared in a20 mM phosphate buffer (pH 7.0). Electrophoresis mobilitydata was utilized to calculate zeta potentials via the Henry’sequation [21]. All the measurements were done in triplicate.
Zeta potential determinations on fragmented chromatog-raphy beads were performed on suspensions (∼200 parti-cle count) prepared in the buffer mentioned above. Elec-trophoretic mobility data was utilized to calculate zeta po-tentials via the Smoluchowski’s equation [30]. The values forzeta potentials at high salt concentration were calculated fromthe experimentally measured values, employing known cor-relations [31]. All the measurements were done in triplicate.
2.7 Chromatography of model proteins
An AKTA FPLC system was utilized to perform the chro-matography runs. The adsorbent beads were packed in com-mercially available chromatographic column (2.0 bed volume;aspect ratio 4.0). Quality of the packing was evaluated by res-idence time distribution analysis employing 1% acetone asa tracer [32]. Chromatographic experiments were performedutilizing a mobile phase consisting of two buffer solutions:buffer A, 20 mM phosphate buffer with 1.7 M ammoniumsulphate, pH 7.0 (conductivity 184 mS cm−1) and buffer B,20 mM phosphate buffer, pH 7.0 (conductivity 23 mS cm−1).All the buffers were filtered and degassed before use. Afterequilibration with buffer A (10 CV), a 200 �L protein sample(4 mg mL−1 in buffer A) was injected into the column. Un-bound material was eluted in 5 CV of buffer A and elutionwas exerted by executing a linear gradient from 0 to 100% of
buffer B (20 CV). Re-equilibration was performed with 5 CVof buffer A. Flow rate was 1.0 mL min−1 (300 cm h−1). Thechromatography eluate was monitored with a UV/VIS detec-tor at 280 nm. Chromatography data were stored and analyzedutilizing a commercial software package (UNICORNTM).
3 Results and discussion
3.1 Adsorbent beads
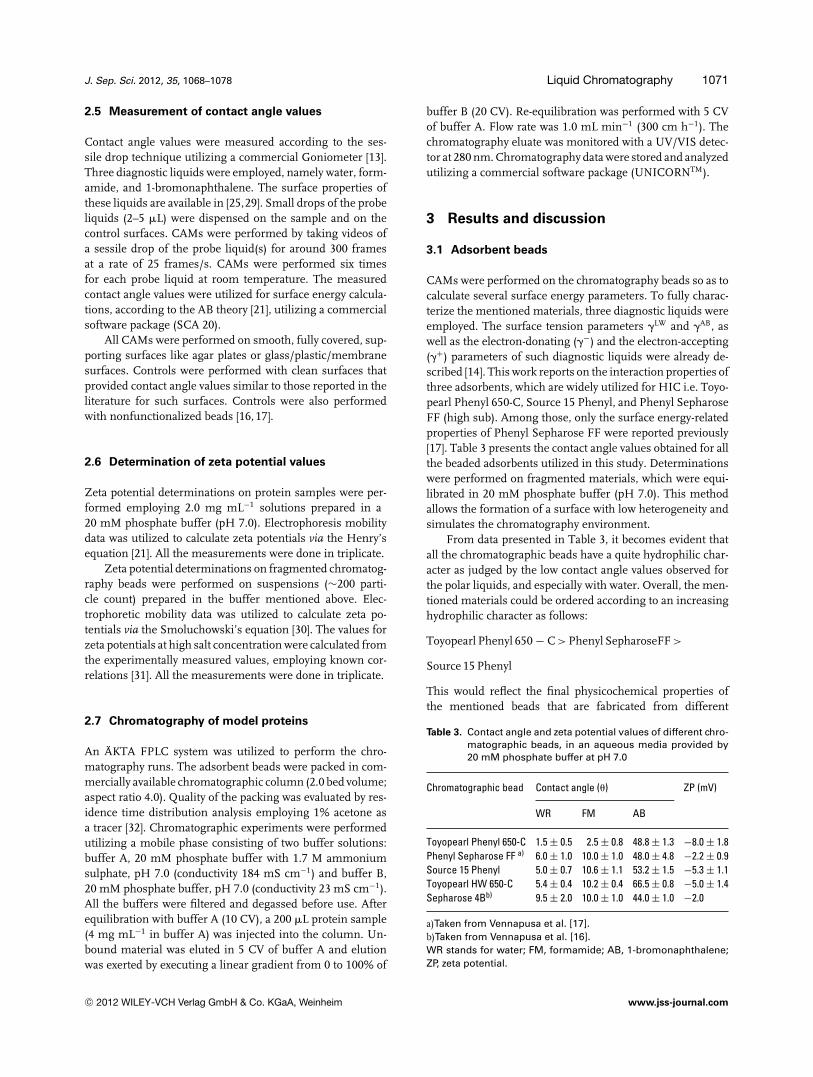
CAMs were performed on the chromatography beads so as tocalculate several surface energy parameters. To fully charac-terize the mentioned materials, three diagnostic liquids wereemployed. The surface tension parameters �LW and �AB, aswell as the electron-donating (�−) and the electron-accepting(�+) parameters of such diagnostic liquids were already de-scribed [14]. This work reports on the interaction properties ofthree adsorbents, which are widely utilized for HIC i.e. Toyo-pearl Phenyl 650-C, Source 15 Phenyl, and Phenyl SepharoseFF (high sub). Among those, only the surface energy-relatedproperties of Phenyl Sepharose FF were reported previously[17]. Table 3 presents the contact angle values obtained for allthe beaded adsorbents utilized in this study. Determinationswere performed on fragmented materials, which were equi-librated in 20 mM phosphate buffer (pH 7.0). This methodallows the formation of a surface with low heterogeneity andsimulates the chromatography environment.
From data presented in Table 3, it becomes evident thatall the chromatographic beads have a quite hydrophilic char-acter as judged by the low contact angle values observed forthe polar liquids, and especially with water. Overall, the men-tioned materials could be ordered according to an increasinghydrophilic character as follows:
Toyopearl Phenyl 650 − C > Phenyl SepharoseFF >
Source 15 Phenyl
This would reflect the final physicochemical properties ofthe mentioned beads that are fabricated from different
Table 3. Contact angle and zeta potential values of different chro-matographic beads, in an aqueous media provided by20 mM phosphate buffer at pH 7.0
Chromatographic bead Contact angle (�) ZP (mV)
WR FM AB
Toyopearl Phenyl 650-C 1.5 ± 0.5 2.5 ± 0.8 48.8 ± 1.3 −8.0 ± 1.8Phenyl Sepharose FF a) 6.0 ± 1.0 10.0 ± 1.0 48.0 ± 4.8 −2.2 ± 0.9Source 15 Phenyl 5.0 ± 0.7 10.6 ± 1.1 53.2 ± 1.5 −5.3 ± 1.1Toyopearl HW 650-C 5.4 ± 0.4 10.2 ± 0.4 66.5 ± 0.8 −5.0 ± 1.4Sepharose 4Bb) 9.5 ± 2.0 10.0 ± 1.0 44.0 ± 1.0 −2.0
a)Taken from Vennapusa et al. [17].b)Taken from Vennapusa et al. [16].WR stands for water; FM, formamide; AB, 1-bromonaphthalene;ZP, zeta potential.
C© 2012 WILEY-VCH Verlag GmbH & Co. KGaA, Weinheim www.jss-journal.com

1072 M. Aasim et al. J. Sep. Sci. 2012, 35, 1068–1078
polymers and employing different chemical methods. For ex-ample, Toyopearl beads are made of polymethacrylates whileSepharose beads are made of cross-linked agarose. Sourceadsorbents are composite structures with a polysterene-divinylbenzene (PDV) core [33]. Chromatographic beadsmade of PDV are normally hydrophilized by the manufactur-ers in order to prevent unspecific protein binding, althoughdetails on how this is performed are rarely released.
The values for surface energy components (LW, AB, andtotal) of the chromatography beads described above are shownin Table 4. Calculated total energy parameter values, as wellas, the base (or electron-donor) parameter values were verysimilar for all the materials. However, a clear trend can be ob-served among the acid (or electron-acceptor) values obtained,as follows:
Toyopearl Phenyl 650 − C > Phenyl SepharoseFF >
Source 15 Phenyl
Table 4. Surface free energy parameters of different chromato-graphic beads
Chromatographic beada) Surface energy parameters (mJ m−2)
�LW �Acidd) �Basee) �Total
Source 15 Phenyl 28.4 4.3 54.5 59.1Toyopearl Phenyl 650-C 30.9 3.7 53.9 59.3Phenyl Sepharose FF b) 30.8 3.5 54.4 58.4Toyopearl HW 650-C 21.7 8.1 53.5 62.2Sepharose 4Bc) 32.8 2.9 53.6 57.7
a)Measurement done in aqueous media provided by 20 mM phos-phate buffer.b)Taken from Vennapusa et al. [17].c)Taken from Vennapusa et al. [16].d)Electron acceptor.e)Electron donor.
Table 5. Properties of different proteins
Protein M. Wt. (kDa) pI ZP at high salta)
LF 80.0 8.0 −2.5IgG 150 ∼ 6.0 −0.9BSA 66.4 4.9 −5.0CHY 35.6 4.5 −1.7PGase 36.0 7.5 −2.9β-Gal ∼ 75.0 4.6 −4.6APR 33.0 4.2 −7.0LYS 14.5 11.0 +1.0APP 72 ∼ 6.0 −1.0
LF stands for lactoferrin, IgG for immunoglobulin G, BSA forbovine serum albumin, CHY for chymosin, PGase for polygalac-turonase, β-Gal for beta galactosidase, APR for aspartic protease,LYS for lysozyme, APP for aminopeptidase, M. Wt. for molecularweight of proteins, pI for isoelectric points.a)Zeta potential values considered at 200 mM (NH4)2SO4.
Moreover, the LW parameter for Source 15 Phenyl was thelower within the series. All these observations may help toexplain the performance of the mentioned adsorbents. De-pending on their own surface energy characteristics, pro-teins would interact with such supports with increased ordecreased strength.
A complete characterization of the adsorbent beads re-quires an evaluation of the surface charge. Since the latter isimpractical it is common to rely on zeta potential determina-tions, which can be performed with ease via electrophoreticmobility experiments. Table 3 depicts the zeta potential valuesobtained for the chromatography beads under study. All ofthem presented a moderated negative charge in diluted phos-phate buffer at pH 7. The beads could be ordered accordingto charge as follows:
Phenyl Sepharose FF > Source 15 Phenyl >
Toyopearl Phenyl 1650-C
As expected, zeta potential values decreased toward a negligi-ble value with an increased concentration of added salts in theliquid media. For example, zeta potential values at high saltconcentrations e.g. 0.4–1.0 M ammonium sulphate were typ-ically only one-tenth of the values measured in diluted buffersolution. Moreover, no correlation was observed between ac-tual zeta potential values and retention behavior onto HICsupports (data not shown).
3.2 Model proteins
CAMs were performed on layers of the proteins under studyso as to calculate various surface energy parameters. More-over, CAM values were obtained for such proteins under con-ditions resembling the hydrated and the dehydrated state.As before, three diagnostic liquids were employed [14]. Itis generally assumed that – under the conditions prevailingduring HIC i.e. mobile phase ammonium sulphate concen-trations in the range 0.4–1.7 M – most proteins would be inthe dehydrated state [19]. However, and in order to explore abroader calculation space it was decided to include CAM val-ues as gathered on protein layers on three distinct surfacese.g. glass, plastic, and hydrophilic ultrafiltration membranes.Details on the contact angles values and the surface energyparameters of the model proteins utilized here can be foundin a previous publication from our group [22]. The zeta poten-tial values for the set of model proteins can also be found inthe literature [22]. All the parameters for the model proteinsare presented in Table 5. A broader range of proteins wereselected on the basis of a broad distribution in their molec-ular weight values, their isoelectric points, and their surfacecharge characteristics.
3.3 Interfacial free energy of interaction
The free energy of interaction values between a chromato-graphic bead and the collection of model proteins employed
C© 2012 WILEY-VCH Verlag GmbH & Co. KGaA, Weinheim www.jss-journal.com

J. Sep. Sci. 2012, 35, 1068–1078 Liquid Chromatography 1073
Table 6. Free energies of interaction (mJ m−2) between several model proteins and Phenyl Sepharose FF. Calculations were performedassuming interaction in 20 mM phosphate buffer at pH 7.0
Support surface LF IgG BSA CHY PGase β-Gal APR LYS APP
Glassa) �GLW −4.66 −4.86 −5.13 −4.86 −4.76 −4.35 −4.66 −4.98 −4.35�GAB 25.06 47.09 32.11 44.88 27.02 25.87 28.71 43.71 41.20�GTotal 20.40 42.24 26.98 40.02 22.26 21.52 24.05 38.72 36.85
Plastica) �GLW −5.46 −5.61 −5.53 −6.08 −6.25 −5.53 −6.15 −5.38 −6.00�GAB 27.29 28.41 30.62 34.72 32.57 34.85 30.64 33.06 31.25�GTotal 21.83 22.80 25.09 28.64 26.32 29.31 24.49 27.68 25.25
Membranea) �GLW −3.39 −3.89 −4.12 −5.38 −4.95 −3.26 −4.12 −3.89 −2.85�GAB 37.22 39.40 35.93 38.52 36.14 37.97 36.80 39.68 32.56�GTotal 33.83 35.52 31.81 33.13 31.19 34.71 32.68 35.79 29.70
a)Taken from Aasim et al. [22], LF stands for Lactoferrin, IgG for immunoglobulin G, BSA for bovine serum albumin, CHY for chymosin,PGase for polygalacturonase, β-Gal for beta galactosidase, APR for aspartic protease, LYS for lysozyme, and APP for aminopeptidase.
in this study are presented in Table 6 (Phenyl Sepharose FF),Table 7 (Toyopearl Phenyl 650-C), and Table 8 (Source 15Phenyl). The values contained in the mentioned tables arevalid at the shortest distance of approximation (0.157 nm).
A global examination of Tables 6–8 resulted in the fol-lowing observations:
(i) Each one of the model proteins presented a charac-teristic set of free energy of interaction values (�GLW,�GAB, �GTOTAL), which are dependent on: (a) the type ofthe supporting material utilized for protein-layer forma-tion and contact angle determination (e.g. glass, plastic,or membrane) and (b) on the type of chromatography
Table 7. Free energies of interaction (mJ m−2) between several model proteins and Toyopearl Phenyl 650-C. Calculations were performedassuming interaction in 20 mM phosphate buffer at pH 7.0
Support surface LF IgG BSA CHY PGase β-Gal APR LYS APP
Glass �GLW −2.61 −2.71 −2.87 −2.71 −2.66 −2.65 −2.61 −2.78 −2.43�GAB 23.64 41.94 29.38 39.75 25.18 24.06 26.43 41.43 36.47�GTotal 21.03 39.22 26.51 37.03 22.52 21.41 23.82 38.64 34.04
Plastic �GLW −3.05 −3.13 −3.09 −3.40 −3.49 −3.09 −3.44 −3.01 −3.36�GAB 25.30 26.11 28.14 31.95 29.94 31.63 28.43 29.97 31.25�GTotal 22.25 22.98 25.04 28.55 26.44 28.54 25.00 26.96 25.25
Membrane �GLW −1.89 −2.17 −2.30 −3.01 −2.77 −1.82 −2.30 −2.17 −1.59�GAB 33.31 35.19 31.88 34.25 32.12 34.00 32.62 35.24 28.71�GTotal 31.41 33.01 29.58 31.24 29.35 32.18 30.32 33.06 27.11
LF stands for lactoferrin, IgG for immunoglobulin G, BSA for bovine serum albumin, CHY for chymosin, PGase for polygalacturonase, β-Galfor beta galactosidase, APR for aspartic protease, LYS for lysozyme, and APP for aminopeptidase.
Table 8. Free energies of interaction (mJ m−2) between several model proteins and Source 15 Phenyl. Calculations were performedassuming interaction in 20 mM phosphate buffer at pH 7.0
Support surface LF IgG BSA CHY PGase β-Gal APR LYS APP
Glass �GLW −1.92 −2.00 −2.11 −2.00 −1.96 −1.96 −1.92 −2.05 −1.79�GAB 23.82 41.43 29.31 39.19 25.28 24.31 26.42 38.83 35.95�GTotal 21.91 39.44 27.20 37.20 23.32 22.36 24.50 36.79 34.16
Plastic �GLW −2.24 −2.30 −2.27 −2.50 −2.57 −2.27 −2.53 −2.21 −2.47�GAB 25.36 26.09 28.11 31.93 29.91 31.47 28.50 29.79 31.25�GTotal 23.11 23.78 25.83 29.43 27.34 29.20 25.98 28.78 3.06
Membrane �GLW −1.39 −1.60 −1.69 −2.21 −2.03 −1.34 −1.69 −1.60 −1.17�GAB 32.9 34.80 31.46 33.82 31.71 33.66 32.18 34.78 28.26�GTotal 31.6 33.20 29.77 31.61 29.68 32.32 30.48 33.18 27.09
LF stands for lactoferrin, IgG for immunoglobulin G, BSA for bovine serum albumin, CHY for chymosin, PGase for polygalacturonase, β-Galfor beta galactosidase, APR for aspartic protease, LYS for lysozyme, and APP for aminopeptidase.
C© 2012 WILEY-VCH Verlag GmbH & Co. KGaA, Weinheim www.jss-journal.com

1074 M. Aasim et al. J. Sep. Sci. 2012, 35, 1068–1078
adsorbent (Phenyl Sepharose FF, Toyopearl Phenyl 650-C, and Source 15 Phenyl).
(ii) The values for �GLW are comparatively higher for all themodel proteins in the dehydrated state (e.g. as measuredon glass and on plastic) as compared to the hydrated state(e.g. as measured on membrane). This trend is valid forall the chromatography adsorbents under study. TakingSource 15 Phenyl beads as an example, the average �GLW
value for all the model proteins measured on plastic(−2.37 ± 0.1 mJ m−2) or glass (–1.97 ± 0.1 mJ m−2) ishigher than the average value measured on a membrane(–1.64 ± 0.3 mJ m−2). This data indicates that �GLW
values are modified as a function of the presence (orabsence) of bound water molecules and as a function ofprotein conformational state;
(iii) The opposite was observed for �GAB values, which aregenerally higher for proteins in the hydrated state thanfor proteins in the dehydrated state. This trend is validfor all the chromatography adsorbents under study. Forexample, in the case of Source 15 Phenyl the follow-ing �GAB values are observed: 29.16 ± 2.3 mJ m−2 (onplastic, dehydrated state) and 32.62 ± 2.0 mJ m−2 (onmembrane, hydrated state). This trend reflects a changein interaction energy on the basis of the general proteinstate.
(iv) However, �GAB values obtained from measurements ofcontact angles on glass showed a wide dispersion foreach of the individual proteins as judged by the observedcoefficient of variation i.e. 31.62 ± 7.2 mJ m−2 for Source15 Phenyl, 35.07 ± 9.0 mJ m−2 for Phenyl Sepharose FF,and 32.03 ± 7.8 mJ m−2 for Toyopearl Phenyl 650–C.In this case, the variations occurring at the level of everyindividual protein are much larger than the general trenddescribed in the preceding point. It is clear that, uponprotein immobilization on glass, main conformationalchanges may be present.
(v) �GTOTAL values followed a similar trend as described for�GAB. This indicates the overall influence of AB forcesin relation to total interfacial interaction energies. Forexample, in the case of Toyopearl Phenyl 650–C the fol-lowing average values were registered: 29.36 ± 7.7 mJm−2 (glass) and 25.96 ± 2.3 mJ m−2 (plastic) for the de-hydrated state but 31.00 ± 2.0 mJ m−2 in the hydratedstate (membrane).
(vi) There is a noticeable difference between the average�GLW values for proteins interacting with different ad-sorbent beads, when comparisons are established onthe basis of CAMs performed on the same surface.For example, for measurements on glass slides, �GLW
equals to –4.73 ± 0.3 mJ m−2 for Phenyl Sepharose FF,–2.67 ± 0.1 mJ m−2 for Toyopearl Phenyl 650–C, and1.97 ± 0.1 mJ m−2 for Source 15 Phenyl. This obser-vation demonstrates that we can also differentiate be-tween the beads on the basis of this energy component.�GLW values in general are – irrespective of the methodutilized to perform the CAMs – lower in the case ofSource 15 Phenyl, intermediate in the case of Toyopearl
Phenyl 650-C, and the highest in the case of PhenylSepharose FF. Considering global averages, it was ob-served that �GLW took the following values: −1.99 ± 0.3mJ m−2 for Source 15 Phenyl, –2.71 ± 0.5 mJ m−2 forToyopearl Phenyl 650–C, and –4.71 ± 0.9 mJ m−2 forPhenyl Sepharose FF.
(vii) On the other hand, �GAB values are generally higher inthe case of Phenyl Sepharose FF (34.56 ± 2.8 mJ m−2)as compared to Source 15 Phenyl (31.13 ± 1.8 mJ m−2)or Toyopearl Phenyl 650–C (31.42 ± 2.0 mJ m−2).
Summarizing, both the hydrated (or dehydrated) stateof the protein and the nature of the adsorbent bead mightplay a role in adsorption behavior during HIC. For exam-ple, it is known that when proteins are free of bound watermolecules an increase in the �GLW energy component maytrigger protein precipitation [19, 22]. On the other hand, pro-tein molecules in the hydrated state are believed to increasedintermolecular repulsion and thus, to increase its solubilityin aqueous media [21, 26]. Similar phenomena may occurduring protein-adsorbent interaction.
3.4 Extended DLVO calculations
The �GLW and �GAB values described in the preceding sec-tion can be further employed to calculate interaction en-ergy profiles as a function of distance [14, 16]. In doing so,additional information could be provided by the zeta poten-tial values of both the proteins and the chromatographic sup-ports. However, in the presence of salt the influence of in-teractions mediated by charge tends to become much lesssignificant than AB forces [22]. Table 2 summarizes the setof equations required to produce energy versus distance pro-files. These equations assume a sphere (protein molecule) toplane (adsorbent bead) geometry [14, 28].
In short, all the above-mentioned parameter can be em-ployed to obtain an overall energy profile, which character-ized the interaction between two bodies in aqueous mediaaccording to the extended DLVO theory. Figure 1 shows thevalues taken by the interfacial energy of interaction (U) be-tween to selected model proteins i.e. HEWL or hT-IgG andToyopearl Phenyl 650-C beads, as a function of distance (H).The profiles are represented by areas rather than by singlelines to account for the influence of the method of contact an-gle determination (e.g. on glass, plastic, or membrane) which– in turn – represents the dehydrated (glass and plastic) orhydrated (membrane) state of the protein layers onto whichmeasurements were actually performed. It was observed thatcalculated energy values are higher, in absolute terms, whencontact angle determinations were performed on glass andplastic than when measurements were performed on a hy-drophilic cellulose membrane. Despite of this, the two pro-teins presented a clearly differentiated energy profile; IgGshowed a deeper energy minimum (∼|0.15| kT) than HEWL(∼|0.03| kT), which would correspond to an increased inter-action for IgG with the chromatography bead. Taken as a
C© 2012 WILEY-VCH Verlag GmbH & Co. KGaA, Weinheim www.jss-journal.com

J. Sep. Sci. 2012, 35, 1068–1078 Liquid Chromatography 1075
Figure 1. Interaction energy (U) versus distance (H) profile forlysozyme (black area) and immunoglobulin G (gray area), to hy-drophobic beads (Toyopearl Phenyl 650-C), immobilized on dif-ferent surfaces. The ranges cover the interaction energies in thehydrated state and dehydrated states.
Figure 2. Comparison of energy versus distance profile for inter-action between immunoglobulin G and hydrophobic interactionbeads i.e. Source 15 Phenyl (black area), Toyopearl Phenyl 650-C(gray area), and Phenyl Sepharose FF (light gray area), immo-bilized on different surfaces. The highlighted areas define theranges of the interaction energy minimum for the protein immo-bilized on different support surfaces.
whole, energy-area profiles – as depicted in Fig. 1 – can illus-trate the range of values that interaction energies may take asa function of the ammonium sulfate concentration present inthe mobile phase. These ranges can define the interaction en-ergy region from a condition of moderate salt concentration(protein hydrated state) to a condition of high salt (protein de-hydrated state) concentration in the chromatographic mobilephase.
Figure 2 depicts the interaction energy profiles obtainedfor IgG on three different adsorbent beads. It can be ob-served that, at least in this particular case, the protein (IgG)
seems to interact strongly with Phenyl Sepharose FF thanwith Toyopearl Phenyl 650-C or Source 15 Phenyl. The aver-age secondary energy minimum to Toyopearl Phenyl 650-C(|0.14| kT) is half of the corresponding parameter for PhenylSepharose FF (|0.28| kT) while the energy pocket for Source 15Phenyl (|0.08| kT) is lower to the one observed for ToyopearlPhenyl 650-C. This trend was repeatedly observed with mostof the model protein utilized in this study. Considering thatthe same ligand is present in the three of the adsorbents andthat the solution chemistry (i.e. mobile phase composition) isthe same, the observed differences between adsorbent beadscan only be attributed to the nature of the matrix backbone orthe type of immobilization chemistry.
The utilization of crushed beads can be accepted consid-ering that (i) the correlation would be valid under equilibriumconditions, and thus mass transfer effects are not relevant;and (ii) considering the fact that protein adsorption takesplace – for the main part – within the porous (internal) struc-ture of a chromatography bead. Moreover, Table 3 showsa comparison between CAMs performed on crushed beads(harboring ligands) and on fragments of control beads (noligand). For example, there is a clear difference between thePhenyl Sepharose and its control counterpart i.e. Sepharose4B; the same is true for the Toyopearl family. The aboveresults indicate that CAMs are able to reflect the overall prop-erties of the materials under study and that no artifact isintroduced by utilizing disrupted beads during sample prepa-ration.
3.5 Separation behavior during chromatography
The elution behavior of a collection of nine different modelproteins was studied employing three commercial HIC beads.Chromatography procedures were defined so as to operateunder “standard” conditions i.e. utilizing a gradient elu-tion from 1.7 M ammonium sulphate (in 20 mM phosphatebuffer, pH 7.0) to plain phosphate buffer. Figure 3 depictstwo typical chromatograms (superimposed) as observed fora nonretained protein (aminopeptidase) and a moderately re-tained protein (lysozyme). Protein separation behavior wasaccounted for according to the recorded retention volumeunder identical conditions e.g. mobile phase, column dimen-sions, flow rate, and gradient development.
Chromatographic experiments allowed the classificationof the model proteins into two subgroups:
(i) Group A: hydrophilic proteins showing almost no reten-tion, even at high concentration of ammonium sulphatein the mobile phase. This group included aspartic pro-tease, chymosin, polygalacturonase, and aminopeptidase(Table 9).
(ii) Group B: interacting proteins that were (moderately) re-tained in all the tested adsorbents. The latter group wasrecovered by decreasing the concentration of ammoniumsulphate in the mobile phase and therefore, an essentiallyreversible interaction was present in all the cases ana-
C© 2012 WILEY-VCH Verlag GmbH & Co. KGaA, Weinheim www.jss-journal.com

1076 M. Aasim et al. J. Sep. Sci. 2012, 35, 1068–1078
Figure 3. Hydrophobic interaction chromatography: elution pro-file for a hydrophilic (aminopeptidase) and moderately hydropho-bic (lysozyme) on a 2 mL column Tricon 5/100 filled with ToyopearlPhenyl 650-C. Buffer A: 20 mM phosphate pH 7.0, (NH4)2SO4 1.7M, buffer B: 20 mM phosphate pH 7.0. – mAU1; absorbance ofaminopeptidase, — mAU2; absorbance of lysozyme, . . . % B isthe gradient length of 10 CV.
lyzed. This group included lactoferrin, lysozyme, BSA,IgG, and beta-galactosidase (Table 9).
3.6 Retention behavior and interfacial energy
minimum: a correlation
Interfacial energy of interaction profiles were obtained as perthe extended DLVO theory employing experimentally deter-mined contact angles and zeta potentials. These profiles al-
Table 9. Retention volumes of model proteins onto ToyopearlPhenyl 650-C and Source 15 Phenyl and PhenylSepharose FF, in 10 CV gradient
Proteins Retention volume (mL)
Toyopearl Phenyl Source Phenyl Sepharose650-C 15 Phenyl FFa)
LF 17.84 22.19 22.80IgG 21.64 27.62 25.70BSA 15.00 22.60 20.00CHY 2.05 1.95 3.16PGase 1.98 1.90 30.00β-Gal 16.64 22.24 26.00APR 2.01 1.88 2.50LYS 14.82 17.98 16.00APP 2.27 2.54 2.60
a) Taken from Aasim et al. [22], LF stands for lactoferrin, IgGfor immunoglobulin G, BSA for bovine serum albumin, CHY forchymosin, PGase for polygalacturonase, β-Gal for beta galactosi-dase, APR for aspartic protease, LYS for lysozyme, and APP foraminopeptidase.
Figure 4. Correlation graph between the depth of secondary en-ergy pocket of model proteins, immobilized on different supports,and the corresponding retention volume with different chromato-graphic supports (��) Phenyl Sepharose FF, (x) Toyopearl Phenyl650-C, and (�)- Source 15 Phenyl.
lowed to observe the energy minima reached for every singlecase i.e. for every model protein on every commercial adsor-bent. The value observed in each individual case was plottedagainst the corresponding elution volume. Figure 4 showsthe correlation between U (absolute value) and the retentionvolume of all the model proteins (n = 9) on all the commercialadsorbents (n = 3). Three points are included for each inter-action protein-bead pair so as to account for the potentialvariability introduced by the protein hydrated versus dehy-drated state, which may change during HIC. In this way,Fig. 4 is able to represent the relationship between the in-teraction energy and the chromatographic behavior for eachcombination possible.
Several observations can be drawn from Fig. 4:
(i) Proteins in Group A (no retention) shown lower inter-action energy minima. This remains valid for the threecommercial adsorbents. For example, the average energypocket for the proteins in Group A is |0.04| ± |0.01| kT,|0.06| ± |0.01| kT, and |0.12| ± |0.02| kT for Source, Toyo-pearl, and Sepharose, respectively. On the other hand,the average energy pocket for the proteins in Group B is|0.07| ± |0.02| kT, |0.10| ± |0.03| kT, and |0.20| ± |0.05|kT for Source, Toyopearl, and Sepharose, respectively.
(ii) Second, trend lines are distinct for the three commercialadsorbents under consideration. It is clear that Source 15Phenyl generally induce lower interaction energy valuesthan Toyopearl Phenyl 650-C. The later, in turn, inducelower energy of interaction values than Sepahrose. Theobserve shift in interaction energies can be attributed tothe influence of the matrix backbone since the ligandhas remained the same.
(iii) There are certain deviations observed within the datathat could be due to impurities present in the protein
C© 2012 WILEY-VCH Verlag GmbH & Co. KGaA, Weinheim www.jss-journal.com

J. Sep. Sci. 2012, 35, 1068–1078 Liquid Chromatography 1077
material. Another important aspect to consider is thatchromatography is not operated under true equilibriumconditions. A better correlation could be attempted byrunning the chromatography experiments employinga shallow gradient development pattern (unpublisheddata).
(iv) The extended DLVO method has potential as a predictorof protein separation during chromatography on variousmodes of operation.
Summarizing, hydrophilic proteins that are nonretainedduring HIC showed less interfacial energy of interaction min-ima while the opposite is true. Moreover, the energy valuesare able to identify an intrinsic property of the adsorbentbead, which is related to the nature of the physicochemicalenvironment provided by the matrix backbone per se and notby the chemical structure of the ligand. According to theseobservations it can be concluded that the extended DLVOapproach can be proposed as a novel tool to understand pro-tein interaction to chromatography adsorbents and to guidefuture adsorbent design [16, 17, 20, 22].
This work was performed to understand protein bindingor no-binding under quasiequilibrium conditions. These con-ditions were approached by a chromatographic developmentcharacterized by a very shallow gradient (40 CV). Thereforethe influence of mass transfer limitations would be mini-mized a fact that would exclude the influence of factors likebead porosity and bed size. Information gathered from ther-modynamics could be later on incorporated into appropriatemodels accounting for such factors. This approach would pro-vide a more comprehensive understanding of a packed bedadsorption system.
4 Concluding remarks
A surface thermodynamics approach is proposed to under-stand protein adsorption onto hydrophobic chromatographicbeads. The method is able to distinguish between those pro-teins, which display affinity for the chromatography adsor-bent, and those that are not retained during such process.Extended DLVO theory-based calculations were performedutilizing the experimentally gathered contact angle and zetapotential values. By careful selection of the conditions underwhich contact angles are measured it was possible to antici-pate the effect of the hydrated versus dehydrated state for themacromolecules in salt-containing solutions.
A correlation trend was observed between the calculationsbased on the extended DLVO theory and the chromatographicbehavior of the model proteins, for all the chromatographicadsorbents. Correlations showed two groups on the basis ofinteraction energies and retention data i.e. strongly retainedwith and loosely retained. So, this method has the capability tointerpret proteins separation during adsorption chromatog-raphy onto different supports.
Interestingly, there was a clear differentiation betweenthe interaction energies onto three different commercial chro-
matographic beads, all of them harboring the same (Phenyl)ligand but different backbone chemistry. This is an extremelyinteresting and previously unreported observation.
M. A. is thankful to Higher Education Commission of Pak-istan (University of Malakand) for financial support. M. F.-L.is member of the Consejo Nacional de Investigaciones Cientificas(CONICET) (Buenos Aires, Argentina). This work has been par-tially supported be the European Commission under the ProjectFP7-SME-2007-1 ELECTROEXTRACTION 222220 and DFGProject FE-3 AFM-DLVO-Theorien, Project No. 50364.
The authors have declared no conflict of interest.
Nomenclature
A Hamaker constant (J or kT)�G interfacial free energy at 1.57 × 10⁻¹⁰ m approach (J m−2)
h distance between surfaces, measured from outer edge (m)h0 closest distance of approximation (1.57 × 10⁻¹⁰ m)
k Boltzmann constant (J K−1)R radius of the particle (m)T absolute temperature (K)U interfacial energy of interaction (J or kT)w aqueous environment� dielectric constant of the medium
�0 permittivity of vacuum (8.85 × 10⁻¹² J m−1 V−2)�AB polar or acid–base component of surface tension (J m−2)�LW apolar or Lifshitz–Van der Waals component of surface tension
(J m−2)�− electron-donor component of surface tension (Lewis base)
(J m−2)�+ electron-acceptor component of surface tension (Lewis acid)
(J m−2) inverse of Debye length (m−1) viscosity of the dispersant� zeta potential (V)� contact angle (degrees)
5 References
[1] Kato, Y., Nakamura, K., Kitamura, T., Moriyama, H.,Hasegawa, M., Sasaki, H., J. Chromatogr. A 2002, 971,143–149.
[2] Lienqueo, M. E., Mahn, A., Asenjo, J. A., J. Chromatogr.A 2002, 978, 71–79.
[3] Queiroz, J. A., Tomaz, C. T., Cabral, J. M. S., J. Biotechnol.2001, 87, 143–159.
[4] Lin, F., Chen, W., Ruaan, R., Huang, H., J. Chromatogr. A2000, 872, 37–47.
[5] Roettger, B. F., Ladisch, M. R., Biotechnol. Adv. 1989, 7,15–29.
[6] Lienqueo, M. E., Mahn, A., Salgado, J. C., Asenjo, J. A.,J. Chromatogr. B 2007, 849, 53–68.
C© 2012 WILEY-VCH Verlag GmbH & Co. KGaA, Weinheim www.jss-journal.com

1078 M. Aasim et al. J. Sep. Sci. 2012, 35, 1068–1078
[7] Van Oss, C. J., Good, R. J., Chaudhury, M. K., J. Chro-matogr. 1986, 376, 111–119.
[8] Lin, F., Chen, W., Anal. Chem. 2001, 73, 3875–3883.
[9] Chen, J., Yang, T., Luo, Q., Breneman, C. M., Cramer, S.M., React. Funct. Polym. 2007, 67, 1561–1569.
[10] Salgado, J. C., Rapaport, I., Asenjo, J. A., J. Chromatogr.A 2005, 1098, 44–54.
[11] Hachem, F., Andrews, B. A., Asenjo, J. A., Enzyme Mi-crob. Technol. 1996, 19, 507–517.
[12] Lienqueo, M. E., Mahn, A., Vasquez, L., Asenjo, J. A., J.Chromatogr. A 2003, 1009, 189–196.
[13] Sharma, P. K., Hanumantha, R. K., Adv. Colloid InterfaceSci. 2002, 98, 341–463.
[14] Van der Mei, H. C., Bos, R., Busscher, H. J., FEMS Micro-biol. Rev. 1999, 23, 179–230.
[15] Vennapusa, R. R., Aasim, M., Cabrera, R., Fernandez-Lahore, M., Biotechnol. Bioprocess Eng. 2009, 14, 419–428.
[16] Vennapusa, R. R., Hunegnaw, S. M., Cabrera, R.,Fernandez-Lahore, M., J. Chromatogr. A 2008, 1181, 9–20.
[17] Vennapusa, R. R., Tari, C., Cabrera, R., Fernandez-Lahore,M., Biochem. Eng. J. 2009, 43, 16–26.
[18] Van Oss, C. J., Good, R. J., Chaudhury, M. K., J. ColloidInterface Sci. 1986, 111, 378–390.
[19] Van Oss, C. J., Moore, L. L., Good, R. J., Chaudhury, M.K., J. Protein Chem. 1985, 4, 245–263.
[20] Van Oss, C. J., Giese, R. F., Bronson, P. M., Docoslis, A.,
Edwards, P., Ruyechan, W. T., Colloids Surf., B 2003, 30,25–36.
[21] Van Oss, C. J., Interfacial Forces in Aqueous Media, Tay-lor & Francis, New York 2006.
[22] Aasim, M., Poondi, G. R., Vennapusa, R. R., Fernandez-Lahore, M., Int. Rev. Chem. Eng. 2010, 2, 263–271.
[23] Stellan, H., J. Chromatogr. B 1973, 87, 325–331.
[24] Rosengren, J., Pahlman, S., Glad, M., Hjerten, S.,Biochim. Biophys. Acta, Protein Struct. Mol. Enzymol.1975, 412, 51–61.
[25] Van Oss, C. J., Giese, R. F., J. Dispersion Sci. Technol.2004, 25, 631–655.
[26] Van Oss, C. J., Mol. Immunol. 1995, 32, 199–211.
[27] Oliveira, R., Exp. Therm. Fluid Sci. 1997, 14, 316–322.
[28] Brant, J. A., Childress, A. E., J. Membr. Sci. 2002, 203,257–273.
[29] Van Oss, C. J., Good, R. J., J. Macromol. Sci. Part A PureAppl. Chem. 1989, 26, 1183–1203.
[30] Ottewill, R. H., Shaw, J. N., J. Electroanal. Chem. 1972,37, 133–142.
[31] Huang, A. Y., Berg, J. C., J. Colloid Interface Sci. 2006,296, 159–164.
[32] Bak, H., Thomas, O. R. T., J. Chromatogr. B 2007, 848,116–130.
[33] Hahn, R., Deinhofer, K., Machold, C., Jungbauer, A., J.Chromatogr. B 2003, 790, 99–114.
C© 2012 WILEY-VCH Verlag GmbH & Co. KGaA, Weinheim www.jss-journal.com