Express Entry Year-end Report 2017 - canada.ca · Express Entry Year-end Report 2017 I. Express...
44
Express Entry Year-end Report 2017
Transcript of Express Entry Year-end Report 2017 - canada.ca · Express Entry Year-end Report 2017 I. Express...

Express Entry Year-end Report 2017
2
Table of Contents Express Entry Year-end Report 2017 ........................................................................................................ 6
I. Express Entry overview ...................................................................................................................... 6
Express Entry results to date ............................................................................................................ 7
Profiles submitted to the Express Entry pool ................................................................................... 7
Composition of the Express Entry pool ............................................................................................. 8
Results of Express Entry invitation rounds to apply for permanent residence .............................. 10
Round results: Country of residence and citizenship of invited candidates ................................... 12
Round results: Invitations issued to candidates by their occupations ........................................... 13
Applications for permanent residence through Express Entry ....................................................... 15
Express Entry processing time ........................................................................................................ 17
Admissions ...................................................................................................................................... 18
II. Special topics: Additional points ..................................................................................................... 19
Arranged Employment .................................................................................................................... 22
Canadian Educational Credentials .................................................................................................. 24
French-language Proficiency ........................................................................................................... 26
Sibling in Canada ............................................................................................................................. 28
III. Special topics: Gender-based analysis ........................................................................................... 29
IV. Conclusion ...................................................................................................................................... 43
3
List of Tables
Table 1: Profiles submitted to the Express Entry ..................................................................................... 8
Table 2: CRS score distribution of candidates in the Express Entry pool ................................................ 9
Table 3: Invitations issued to candidates in 2017 by their economic immigration program ................ 12
Table 4: Invitations issued to candidates by country of residence ........................................................ 13
Table 5: Invitations issued to candidates by country of citizenship ...................................................... 13
Table 6.1: Invitations issued to candidates in 2016 by occupation ....................................................... 15
Table 6.2: Invitations issued to candidates in 2017 by occupation ....................................................... 15
Table 7: Permanent residence applications received, approved and visas issued through Express Entry (total persons) ........................................................................................................................................ 16
Table 8: Applications for permanent residence received by province of destination in 2016 and 2017 (total persons) ........................................................................................................................................ 17
Table 9: Processing time for Express Entry based on final decision date .............................................. 18
Table 10: Admissions by province of destination and immigration categories under Express Entry in 2016 and 2017 (total persons) ............................................................................................................... 19
Table 11: Admissions in 2016 and 2017 under Express Entry by top 10 countries of citizenship (total persons) ................................................................................................................................................. 19
Table 12.1: Candidates in the Express Entry pool on January 3, 2018, with and without additional points, by additional point type combination* ..................................................................................... 20
Table 12.2: Candidates in the Express Entry pool on January 3, 2018, with and without additional points by additional point type combination* ...................................................................................... 21
Table 13.1: Invitations issued in 2017 to candidates with and without additional points, by additional point type combination* ....................................................................................................................... 21
Table 13.2: Invitations issued in 2017 to candidates with and without additional points, by additional point type combination* ....................................................................................................................... 22
Table 14: Candidates in the Express Entry pool as of January 3, 2018, with and without Arranged Employment by NOC and other additional point types......................................................................... 23
Table 15: Invitations issued in 2017 to candidates with Arranged Employment by NOC and other additional point types ............................................................................................................................ 24
Table 16: Candidates in the Express Entry pool on January 3, 2018, with and without a Canadian education credential* by CRS score ...................................................................................................... 25
Table 17: Invitations issued in 2017 to candidates with and without a Canadian educational credential* by CRS score ........................................................................................................................ 25
Table 18: Candidates in the Express Entry pool as of January 3, 2018, with and without Canadian Educational Credentials (CE) additional points, by CRS score ............................................................... 26
4
Table 19: Invitation issued in 2017 to candidates with and without Canadian Educational Credentials (CE) additional points, by CRS score ...................................................................................................... 26
Table 20: French-speakers in the Express Entry pool as of January 3, 2018 ......................................... 27
Table 21: Invitations issued to French-speakers in 2016 and 2017 ....................................................... 27
Table 22: Applications for permanent residence received from French-speakers in 2016 and 2017 (total persons) ........................................................................................................................................ 27
Table 23: French speaker admissions in 2016 and 2017 (total persons) ............................................... 28
Table 24: Candidates in the Express Entry pool on January 3, 2018, with and without French-language (FL) additional points, by CRS score ....................................................................................................... 28
Table 25: Invitations issued in 2017 to candidates with and without French-language (FL) additional points, by CRS score ............................................................................................................................... 28
Table 26: Candidates in the Express Entry pool on January 3, 2018, with and without SB additional points, (by CRS score .............................................................................................................................. 29
Table 27: Invitations issued in 2017 to candidates with and without SB additional pointsby CRS score ............................................................................................................................................................... 29
Table 28: Profiles submitted to the Express Entry, by gender .............................................................. 30
Table 29: CRS score distribution of candidates in the Express Entry pool on January 3, 2018, by gender ............................................................................................................................................................... 31
Table 30.1: Candidates in the Express Entry pool on January 3, 2018, with and without additional points, by additional point-type combination and gender* .................................................................. 32
Table 30.2: Candidates in the Express Entry pool as of January 3, 2018, with and without additional points, by additional point-type combination* and gender .................................................................. 33
Table 31: Candidates in the Express Entry pool as of January 3, 2018, with and without AE by NOC, other additional point types and gender ............................................................................................... 34
Table 32: CRS distribution and invitations issued in 2017 by gender .................................................... 37
Table 33: Invitations issued in 2017 to candidates by their economic immigration program and gender .................................................................................................................................................... 38
Table 34.1: Invitations issued in 2017 to candidates with and without additional points, by additional point type combination and gender* .................................................................................................... 38
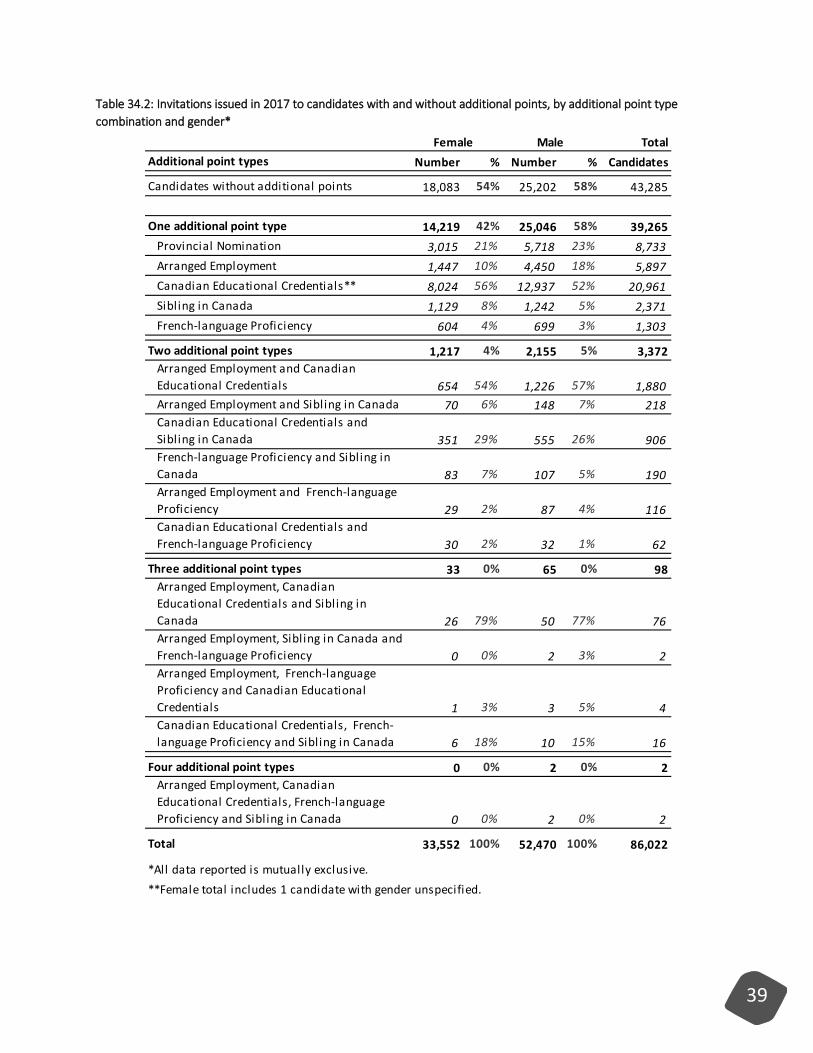
Table 34.2: Invitations issued in 2017 to candidates with and without additional points, by additional point type combination and gender* .................................................................................................... 39
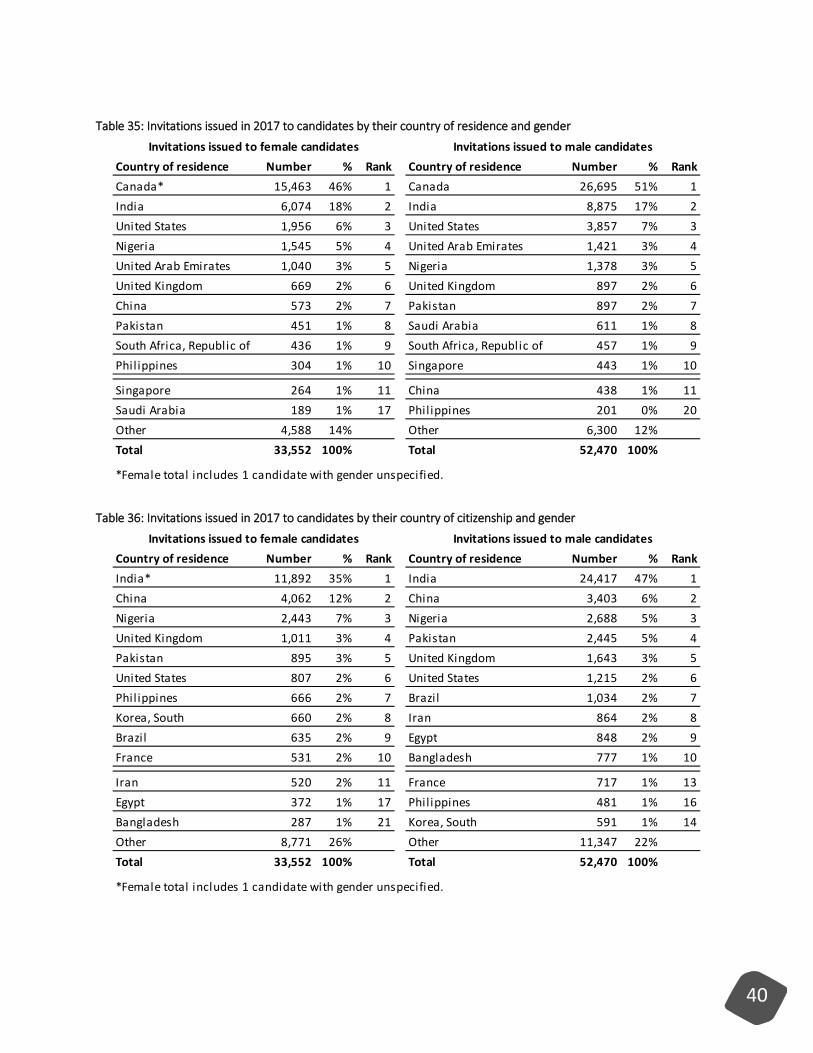
Table 35: Invitations issued in 2017 to candidates by their country of residence and gender ............. 40
Table 36: Invitations issued in 2017 to candidates by their country of citizenship and gender ........... 40
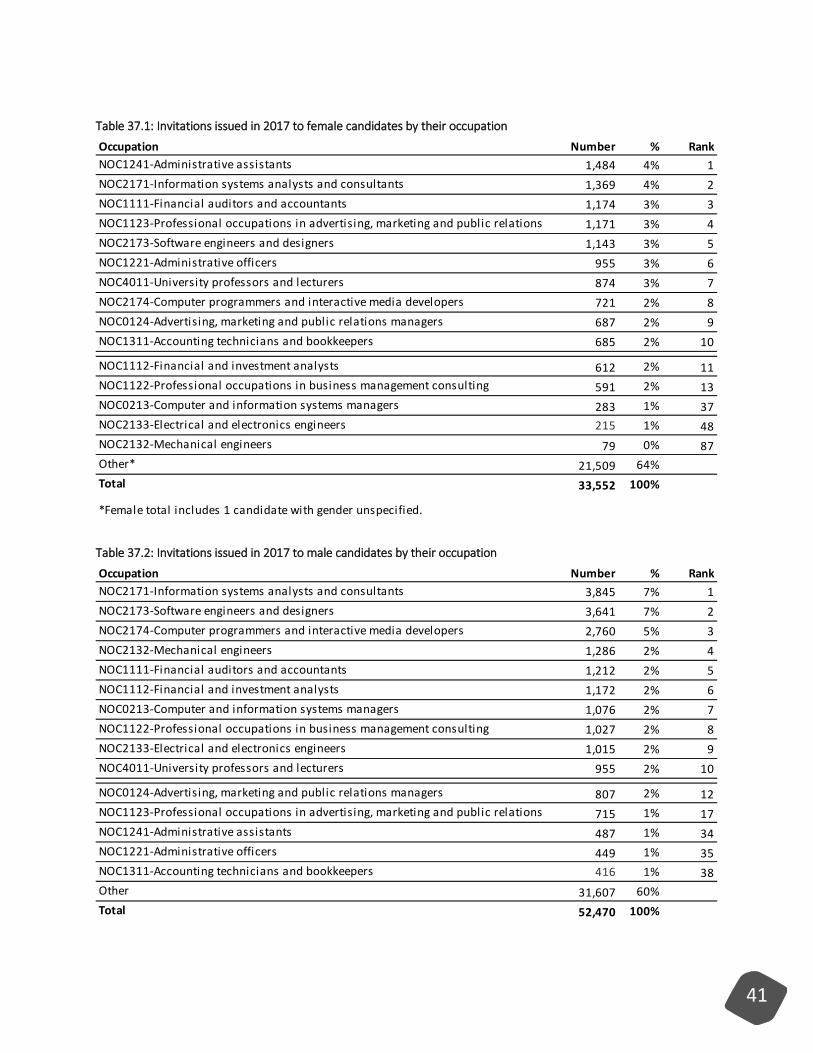
Table 37.1: Invitations issued in 2017 to female candidates by their occupation ................................ 41
Table 37.2: Invitations issued in 2017 to male candidates by their occupation ................................... 41
Table 38: Applications received between 2005 and 2014 (pre-Express Entry) by Express Entry’s economic programs and applicant's gender (cases).............................................................................. 42

5
Table 39: Permanent residence applications received through Express Entry by applicant's gender (total persons) ........................................................................................................................................ 43
Table 40: Admissions under Express Entry in 2017 by principal applicant's country of citizenship and gender (cases) ........................................................................................................................................ 43
6
Express Entry Year-end Report 2017 I. Express Entry overview
Express Entry is Canada’s flagship application management system for key economic immigration programs. These programs are the Federal Skilled Worker Program, the Federal Skilled Trades Program, the Canadian Experience Class and a portion of the Provincial Nominee Program. Potential candidates express their interest in immigrating to Canada by first completing an online profile. The profile is electronically screened to determine if the candidate meets the criteria of at least 1 of the 3 federal immigration programs mentioned above. Using the same information, candidates are given a Comprehensive Ranking System (CRS) score. They are then placed in the Express Entry pool and ranked relative to each other based on their CRS scores. The pool is dynamic and a candidate’s rank can change as other candidates join and leave the pool, or when the ranking criteria are adjusted according to ministerial instructions. CRS scores can also change as a candidate’s circumstances change. (For example, a candidate gains more work experience or is nominated by a province or territory.) Only top-ranked candidates are invited to apply for permanent residence. A candidate’s CRS score is divided into 2 components: the “core” CRS component and the additional points component. The core CRS score can reach a maximum of 600 points and is based on a combination of the candidate’s age, education, official language proficiency and work experience. These factors are strongly correlated to higher earning potential. Additional points have been a component of Express Entry since launch. The original 2 types of additional points were given for a qualifying offer of arranged employment, and a provincial or territorial nomination to ensure candidates receive an invitation in the next ITA round. As part of the targeted improvements made on November 19, 2016, Express Entry began awarding additional points to candidates with Canadian post-secondary education credentials. Arranged Employment additional points were reduced to rebalance the CRS towards candidates working in higher skilled fields. Conditions for obtaining Arranged Employment additional points were also relaxed. On June 6, 2017, further improvements were made to Express Entry by introducing 2 new types of additional points:
• French-language proficiency points are granted to candidates who score 7 or higher on Niveaux de compétence linguistique canadiens for all 4 of their French language skills (listening, speaking, reading and writing). These candidates receive:
o Fifteen additional points if they scored 4 or lower on the Canadian Language Benchmark (CLB) for all 4 of their English language skills.
o Thirty additional points if they scored 5 or higher on their CLB for all 4 of their English language skills.
.
7
• Sibling in Canada points are granted: o If the candidate, or if the candidate’s accompanying spouse or common-law partner, has
a sibling who is: living in Canada a citizen or permanent resident of Canada
o The sibling needs to be: eighteen years or older related by blood, marriage, common-law partnership or adoption, and have a parent in common
IRCC made other improvements to Express Entry: • Job bank registration became voluntary for all candidates. Candidates who meet minimum entry
criteria for Express Entry are automatically placed into the pool and immediately eligible for invitations rounds. Candidates still have the option to create a Job Match account with Job Bank to look for employment in Canada. Canadian employers are still able to find high-skilled Express Entry candidates in Job Bank.
• IRCC introduced a new tie-breaking rule. At the time of invitation, candidates in the pool are ranked by their CRS score. When there is a tie between candidates at the targeted invited-to-apply (ITA) cut-off score, all tied candidates are ranked again based on the date and time of their profile submission. The tie-breaking rule was first implemented in November 2017, and only the top-ranked candidates based on the planned number of invitations issued were invited. Breaking CRS ties using profile submission date and time resulted in a more precise alignment between monthly invitations sent and IRCC’s multi-year immigration levels plan.
Express Entry results to date Between January 2017 and August 2017, IRCC increased ITA round sizes to create a working inventory of applications as pre-Express Entry backlog for the Federal Skilled Worker Program and the Canadian Experience Class was almost depleted. Once the working inventory of Express Entry applications was created, ITA rounds were reduced to ensure a steady application intake to meet our committed processing time for Express Entry applications. The Express Entry pool is now the main source of permanent residence applications for the economic immigration category of IRCC’s multi-year immigration levels plan. In 2017, 86,022 invitations were sent, 109,497 applications were received, 93,596 visas were issued and 65,401 permanent residents and their families were admitted into Canada. Profiles submitted to the Express Entry pool As of January 3, 2018:
• There were 71,087 active candidates in the Express Entry pool. • ITA candidates who had not yet applied for permanent residence totalled 9,569.
8
Table 1: Profiles submitted to the Express Entry
Composition of the Express Entry pool Express Entry automatically assigns a CRS score to candidates who submit a profile. A candidate’s CRS score is divided into 2 portions. The candidate’s “core” CRS score can reach a maximum of 600 points and is based on the candidate’s age, education, official language proficiency, work experience and combinations of these human capital attributes. A maximum of 600 points is awarded to the candidate if they meet policy or other objectives such as: having a provincial nomination, a qualifying offer of arranged employment, Canadian educational credentials, French-language proficiency and a sibling in Canada. Candidates can have different combinations of additional point types. A candidate’s maximum CRS score is 1,200 points. All information is self-reported and must be supported with appropriate documentation at the application stage or the application will be refused. The CRS score distribution of candidates in the pool as at January 3, 2017, and January 3, 2018, are presented in Table 2. To raise their ranking in the pool, candidates are encouraged to upgrade their human capital attributes. (For example, by improving their knowledge of official languages, finding arranged employment, or obtaining a Canadian educational credential.) Candidates can also increase their CRS score by providing an Educational Credential Assessment for their education acquired abroad, or information on their accompanying spouse or partner’s education and language proficiency.
Cumulative As of January 3, 2016 As of January 3, 2017 As of January 3, 2018Profile Intake
Profiles submitted 188,262 353,230 598,507Not eligible 88,048 170,221 283,396Pending† 1,303 1,554 15
Profiles no longer in the poolExpired 2,656 47,859 80,137Profile withdrawn from the pool 13,684 27,192 50,333Applications submitted for processing* 18,634 41,466 103,970
AnnualProfiles in the pool
Active candidates 60,042 58,328 71,087Outstanding Invitations to apply 3,895 6,610 9,569
†Pending profiles in 2016 and up to June 5, 2017, indicated that those candidates needed to regis ter with Job Bank before their profi le could enter the pool . Pending profi les decreased between 2016, 2017 and 2018 i s due to the removal of mandatory Job Bank regis tration on June 6, 2017. As of January 3, 2018, there were 15 pending profi les . Those profi les were no longer el igible in Express Entry, but had not been removed prior to the date of data extraction. Veri fi cation of a candidate’s nomination by a province or terri tory i s s ti l l required.*Tota l appl ications submitted for permanent res idence in years 2015, 2016 and 2017 exclude cancel led cases .

9
Table 2: CRS score distribution of candidates in the Express Entry pool
CRS scoreNumber of candidates
on January 3, 2017Number of candidates on
January 3, 2018
>1000 401 36950 - 999 63 76900 - 949 19 69850 - 899 2 17800 - 849 0 1750 - 799 1 1700 - 749 0 3650 - 699 2 0600 - 649 2 0550 - 599 11 10500 - 549 136 97450 - 499 7,009 1,177400 - 449 14,041 20,404
440 - 449 2,815 1,355430 - 439 3,140 4,224420 - 429 2,262 4,167410 - 419 2,718 4,889400 - 409 3,106 5,769
350 - 399 19,716 28,983390 - 399 3,053 5,254380 - 389 3,585 5,707370 - 379 4,304 6,283360 - 369 4,304 5,917350 - 359 4,470 5,822
300 - 349 14,488 17,385340 - 349 4,278 5,189330 - 339 3,702 4,418320 - 329 2,990 3,557310 - 319 2,144 2,532300 - 309 1,374 1,689
250 - 299 1,949 1,976200 - 249 289 466150 - 199 127 279100 - 149 54 84<100 18 23Total 58,328 71,087
10
Results of Express Entry invitation rounds to apply for permanent residence The following tables show the distribution of candidates invited by economic immigration programs managed within Express Entry, country of residence, country of citizenship and occupation. Over time, we expect these distributions to continue to evolve as the composition of invited candidates changes. IRCC may choose to conduct program-specific rounds of invitations. On May 26, 2017, and November 1, 2017, only candidates from the Provincial Nominee Program and the Federal Skilled Trades Program were invited. Between January and August 2017, processing permanent residences applications received prior to the launch of Express Entry was well advanced. The pre-Express Entry backlog for the Federal Skilled Worker Program and the Canadian Experience Class was almost depleted. During this time, IRCC increased invitations sent per ITA round to create a working inventory of applications, which will be processed over the next 6 months in the majority of cases. Excluding the program-specific rounds held on May 26, 2017, and November 1, 2017, IRCC sent, on average, 3,257 invitations per round. The CRS cutoff reached a low of 413 points during the May 31, 2017, invitation round. Towards the end of 2017, as planned, 2,750 invitations per round were sent. With the working inventory created, ITA round sizes were reduced to ensure a steady application intake to meet our committed processing time for Express Entry applications. In total, 86,022 invitations were issued in 2017, an increase of 52,240 from 2016 1. Candidates may be invited more than once if they decline their first invitation. There were 31,676 unique candidates invited in 2016 and 79,869 unique candidates invited in 2017. Between 2016 and 2017, the biggest increase in invitations issued by economic program was in the Canadian Experience Class and the Federal Skilled Worker Program. Invitations issued to candidates in the Canadian Experience Class rose from 15,102 in 2016 to 35,020 in 2017. Invitations issued to candidates in the Federal Skilled Worker Program rose from 8,332 in 2016 to 41,364 in 2017. Invitations issued to provincial nominees remained similar between 2016 and 2017. Reducing Arranged Employment additional points from 600 to 50 (or 200 points for senior executive positions) had a significant impact on candidates who qualified for the Federal Skilled Trades Program as they generally have a lower core CRS score but often have qualifying arranged employment due to that program’s requirements. IRCC held 2 rounds specifically for the Federal Skilled Trades Program on May 26, 2017, and November 1, 2017, to provide more candidates with work experience in a skilled trade an opportunity to apply for permanent residence. From these 2 rounds, a total of 905 invitations were sent to candidates who
1 Canada, Immigration, Refugees and Citizenship Canada, Express Entry Year-End Report 2016, Ottawa, 2017, p. 10.
11
qualified for the Federal Skilled Trades Program. To ensure provincial nominees were also invited, a Provincial Nominee Program-only round was held on the same day. Even though IRCC held 2 Federal Skilled Trades Program-only rounds, the number of invitations sent to qualified candidates decreased between 2016 and 2017. Before November 19, 2016, a steady but small number of invitations were sent to candidates that qualified for the Federal Skilled Trades Program during each general invitation round. A total of 1,550 invitations were sent to candidates that qualified in 20162. In 2017, 905 invitations were sent to Federal Skilled Trades Program-qualified candidates, which marks a decrease of 645 invitations between 2016 and 2017.
2 IRCC, Express Entry Year-End Report 2016, p.10
12
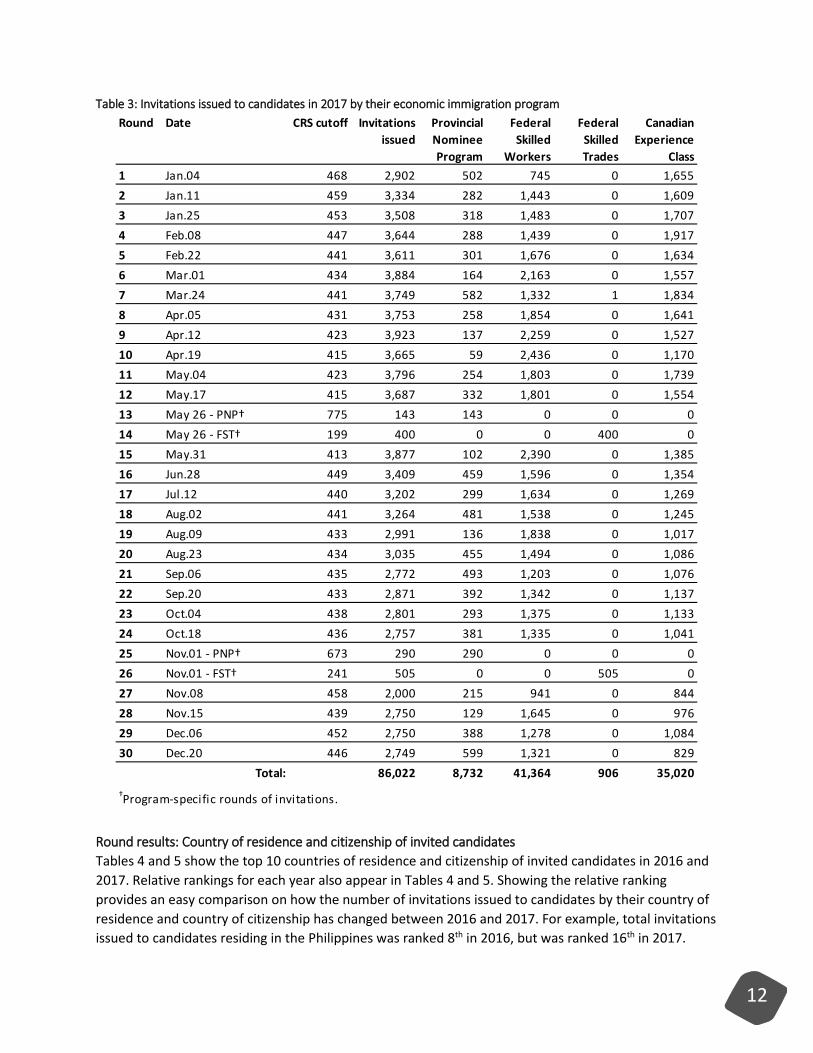
Table 3: Invitations issued to candidates in 2017 by their economic immigration program
Round results: Country of residence and citizenship of invited candidates Tables 4 and 5 show the top 10 countries of residence and citizenship of invited candidates in 2016 and 2017. Relative rankings for each year also appear in Tables 4 and 5. Showing the relative ranking provides an easy comparison on how the number of invitations issued to candidates by their country of residence and country of citizenship has changed between 2016 and 2017. For example, total invitations issued to candidates residing in the Philippines was ranked 8th in 2016, but was ranked 16th in 2017.
Round Date CRS cutoff Invitations issued
Provincial Nominee Program
Federal Skilled
Workers
Federal Skilled Trades
Canadian Experience
Class1 Jan.04 468 2,902 502 745 0 1,6552 Jan.11 459 3,334 282 1,443 0 1,6093 Jan.25 453 3,508 318 1,483 0 1,7074 Feb.08 447 3,644 288 1,439 0 1,9175 Feb.22 441 3,611 301 1,676 0 1,6346 Mar.01 434 3,884 164 2,163 0 1,5577 Mar.24 441 3,749 582 1,332 1 1,8348 Apr.05 431 3,753 258 1,854 0 1,6419 Apr.12 423 3,923 137 2,259 0 1,52710 Apr.19 415 3,665 59 2,436 0 1,17011 May.04 423 3,796 254 1,803 0 1,73912 May.17 415 3,687 332 1,801 0 1,55413 May 26 - PNP† 775 143 143 0 0 014 May 26 - FST† 199 400 0 0 400 015 May.31 413 3,877 102 2,390 0 1,38516 Jun.28 449 3,409 459 1,596 0 1,35417 Jul.12 440 3,202 299 1,634 0 1,26918 Aug.02 441 3,264 481 1,538 0 1,24519 Aug.09 433 2,991 136 1,838 0 1,01720 Aug.23 434 3,035 455 1,494 0 1,08621 Sep.06 435 2,772 493 1,203 0 1,07622 Sep.20 433 2,871 392 1,342 0 1,13723 Oct.04 438 2,801 293 1,375 0 1,13324 Oct.18 436 2,757 381 1,335 0 1,04125 Nov.01 - PNP† 673 290 290 0 0 026 Nov.01 - FST† 241 505 0 0 505 027 Nov.08 458 2,000 215 941 0 84428 Nov.15 439 2,750 129 1,645 0 97629 Dec.06 452 2,750 388 1,278 0 1,08430 Dec.20 446 2,749 599 1,321 0 829
Total: 86,022 8,732 41,364 906 35,020†Program-specific rounds of invitations.
13
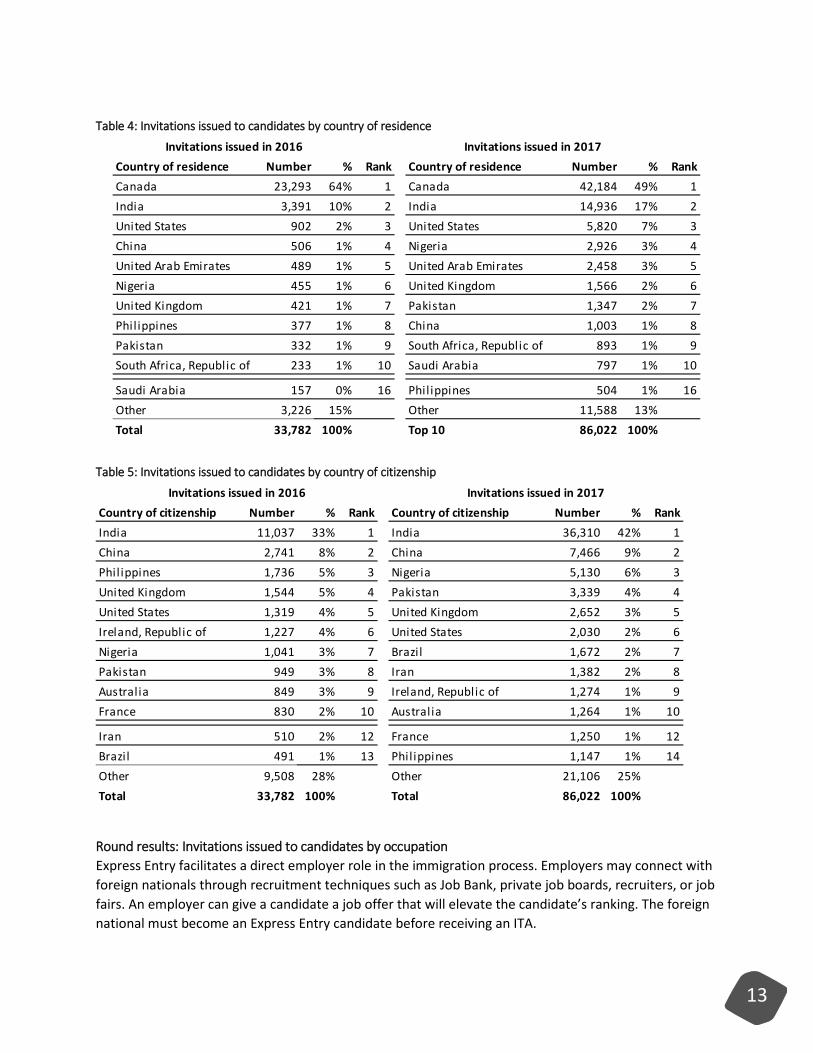
Table 4: Invitations issued to candidates by country of residence
Table 5: Invitations issued to candidates by country of citizenship
Round results: Invitations issued to candidates by occupation Express Entry facilitates a direct employer role in the immigration process. Employers may connect with foreign nationals through recruitment techniques such as Job Bank, private job boards, recruiters, or job fairs. An employer can give a candidate a job offer that will elevate the candidate’s ranking. The foreign national must become an Express Entry candidate before receiving an ITA.
Country of residence Number % Rank Country of residence Number % RankCanada 23,293 64% 1 Canada 42,184 49% 1India 3,391 10% 2 India 14,936 17% 2United States 902 2% 3 United States 5,820 7% 3China 506 1% 4 Nigeria 2,926 3% 4United Arab Emirates 489 1% 5 United Arab Emirates 2,458 3% 5Nigeria 455 1% 6 United Kingdom 1,566 2% 6United Kingdom 421 1% 7 Pakistan 1,347 2% 7Philippines 377 1% 8 China 1,003 1% 8Pakistan 332 1% 9 South Africa, Republic of 893 1% 9South Africa, Republic of 233 1% 10 Saudi Arabia 797 1% 10
Saudi Arabia 157 0% 16 Philippines 504 1% 16Other 3,226 15% Other 11,588 13%Total 33,782 100% Top 10 86,022 100%
Invitations issued in 2016 Invitations issued in 2017
Country of citizenship Number % Rank Country of citizenship Number % RankIndia 11,037 33% 1 India 36,310 42% 1China 2,741 8% 2 China 7,466 9% 2Philippines 1,736 5% 3 Nigeria 5,130 6% 3United Kingdom 1,544 5% 4 Pakistan 3,339 4% 4United States 1,319 4% 5 United Kingdom 2,652 3% 5Ireland, Republic of 1,227 4% 6 United States 2,030 2% 6Nigeria 1,041 3% 7 Brazil 1,672 2% 7Pakistan 949 3% 8 Iran 1,382 2% 8Australia 849 3% 9 Ireland, Republic of 1,274 1% 9France 830 2% 10 Australia 1,264 1% 10
Iran 510 2% 12 France 1,250 1% 12Brazil 491 1% 13 Philippines 1,147 1% 14Other 9,508 28% Other 21,106 25%Total 33,782 100% Total 86,022 100%
Invitations issued in 2016 Invitations issued in 2017
14
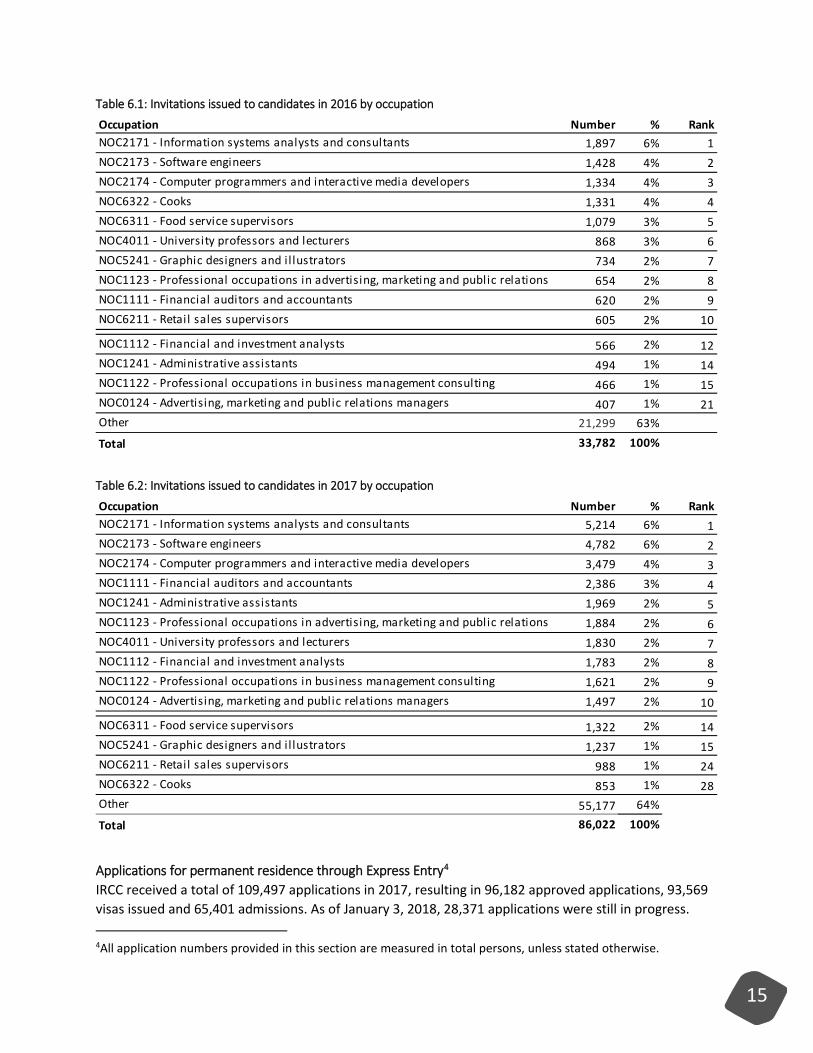
As economic immigration programs are designed for skilled immigration, all qualifying offers of arranged employment are in professional or skilled trade occupations as defined by the National Occupational Classification (NOC) maintained by Employment and Social Development Canada. Tables 6.1 and 6.2 show the number of invitations sent to candidates in 2016 and 2017 by their primary occupation. Within each table, occupations were ranked by the total number of invitations issued per year. Top-10 occupations and their relative ranking in that year appear in both tables. Targeted improvements made to Express Entry in November 2016 appear to have significant impact on the occupation mix of candidates that received an invitation. The Arranged Employment additional points are now balanced with the core CRS (that is, human capital), which means that candidates with a qualifying arranged employment need a sufficiently high core CRS to receive an invitation. Starting on November 19, 2016, candidates are eligible for a Labour Market Impact Assessment (LMIA)-exempt qualifying offer of arranged employment if they meet certain criteria. Candidates working in Canada temporarily with a work permit issued under a temporary LMIA exemption – under categories such as international agreement, intra-company transferees, and significant benefit to Canada – may qualify for Arranged Employment additional points. The qualifying Arranged Employment duration requirement also changed from indeterminate to at least 1 year. As of January 5, 2018, there were 579 candidates in the pool with LMIA-exempt Arranged Employment additional points3. In 2017, 43% of all invited candidates with Arranged Employment points benefited from a LMIA exemption.
3 For technical reasons, this data is based on pool data from January 5, 2018, and other pool data are from January 3, 2018. There may be minor differences due to the 2-day difference.
15
Table 6.1: Invitations issued to candidates in 2016 by occupation
Table 6.2: Invitations issued to candidates in 2017 by occupation
Applications for permanent residence through Express Entry4 IRCC received a total of 109,497 applications in 2017, resulting in 96,182 approved applications, 93,569 visas issued and 65,401 admissions. As of January 3, 2018, 28,371 applications were still in progress. 4All application numbers provided in this section are measured in total persons, unless stated otherwise.
Occupation Number % RankNOC2171 - Information systems analysts and consultants 1,897 6% 1NOC2173 - Software engineers 1,428 4% 2NOC2174 - Computer programmers and interactive media developers 1,334 4% 3NOC6322 - Cooks 1,331 4% 4NOC6311 - Food service supervisors 1,079 3% 5NOC4011 - University professors and lecturers 868 3% 6NOC5241 - Graphic designers and i l lustrators 734 2% 7NOC1123 - Professional occupations in advertising, marketing and public relations 654 2% 8NOC1111 - Financial auditors and accountants 620 2% 9NOC6211 - Retail sales supervisors 605 2% 10
NOC1112 - Financial and investment analysts 566 2% 12NOC1241 - Administrative assistants 494 1% 14NOC1122 - Professional occupations in business management consulting 466 1% 15NOC0124 - Advertising, marketing and public relations managers 407 1% 21Other 21,299 63%
Total 33,782 100%
Occupation Number % RankNOC2171 - Information systems analysts and consultants 5,214 6% 1NOC2173 - Software engineers 4,782 6% 2NOC2174 - Computer programmers and interactive media developers 3,479 4% 3NOC1111 - Financial auditors and accountants 2,386 3% 4NOC1241 - Administrative assistants 1,969 2% 5NOC1123 - Professional occupations in advertising, marketing and public relations 1,884 2% 6NOC4011 - University professors and lecturers 1,830 2% 7NOC1112 - Financial and investment analysts 1,783 2% 8NOC1122 - Professional occupations in business management consulting 1,621 2% 9NOC0124 - Advertising, marketing and public relations managers 1,497 2% 10
NOC6311 - Food service supervisors 1,322 2% 14NOC5241 - Graphic designers and i l lustrators 1,237 1% 15NOC6211 - Retail sales supervisors 988 1% 24NOC6322 - Cooks 853 1% 28Other 55,177 64%
Total 86,022 100%
16
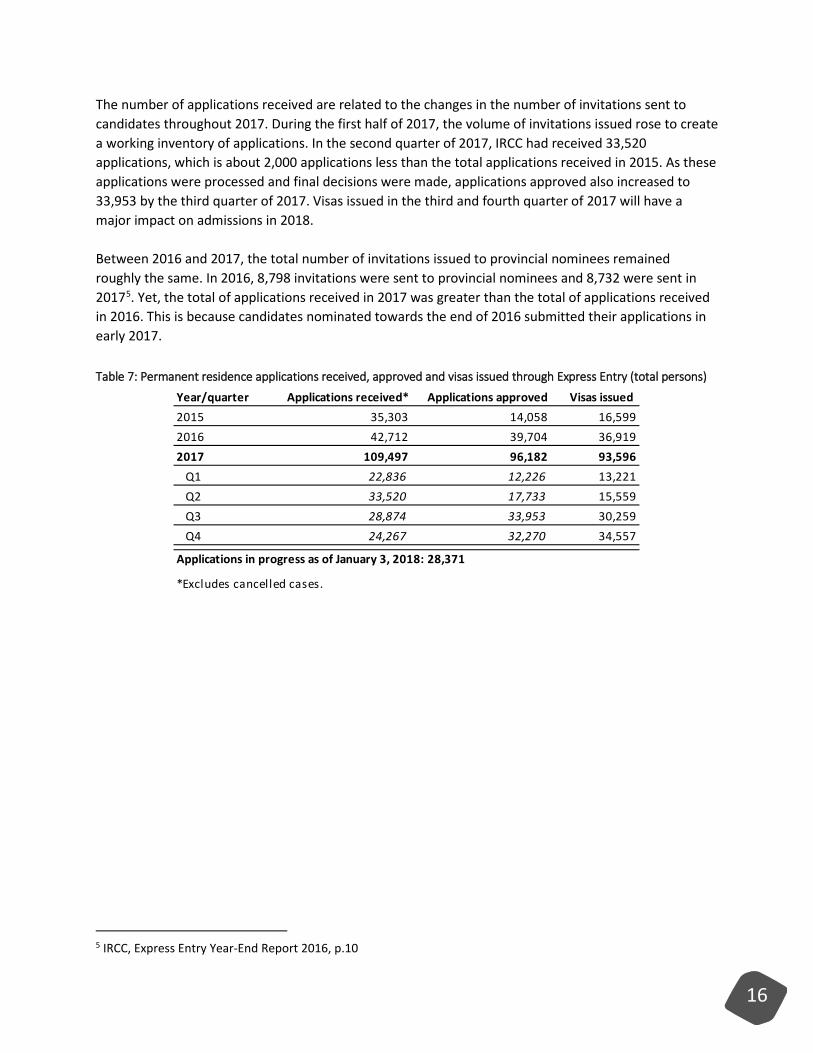
The number of applications received are related to the changes in the number of invitations sent to candidates throughout 2017. During the first half of 2017, the volume of invitations issued rose to create a working inventory of applications. In the second quarter of 2017, IRCC had received 33,520 applications, which is about 2,000 applications less than the total applications received in 2015. As these applications were processed and final decisions were made, applications approved also increased to 33,953 by the third quarter of 2017. Visas issued in the third and fourth quarter of 2017 will have a major impact on admissions in 2018. Between 2016 and 2017, the total number of invitations issued to provincial nominees remained roughly the same. In 2016, 8,798 invitations were sent to provincial nominees and 8,732 were sent in 20175. Yet, the total of applications received in 2017 was greater than the total of applications received in 2016. This is because candidates nominated towards the end of 2016 submitted their applications in early 2017. Table 7: Permanent residence applications received, approved and visas issued through Express Entry (total persons)
5 IRCC, Express Entry Year-End Report 2016, p.10
Year/quarter Applications received* Applications approved Visas issued 2015 35,303 14,058 16,5992016 42,712 39,704 36,9192017 109,497 96,182 93,596
Q1 22,836 12,226 13,221Q2 33,520 17,733 15,559Q3 28,874 33,953 30,259Q4 24,267 32,270 34,557
*Excludes cancelled cases.
Applications in progress as of January 3, 2018: 28,371
17
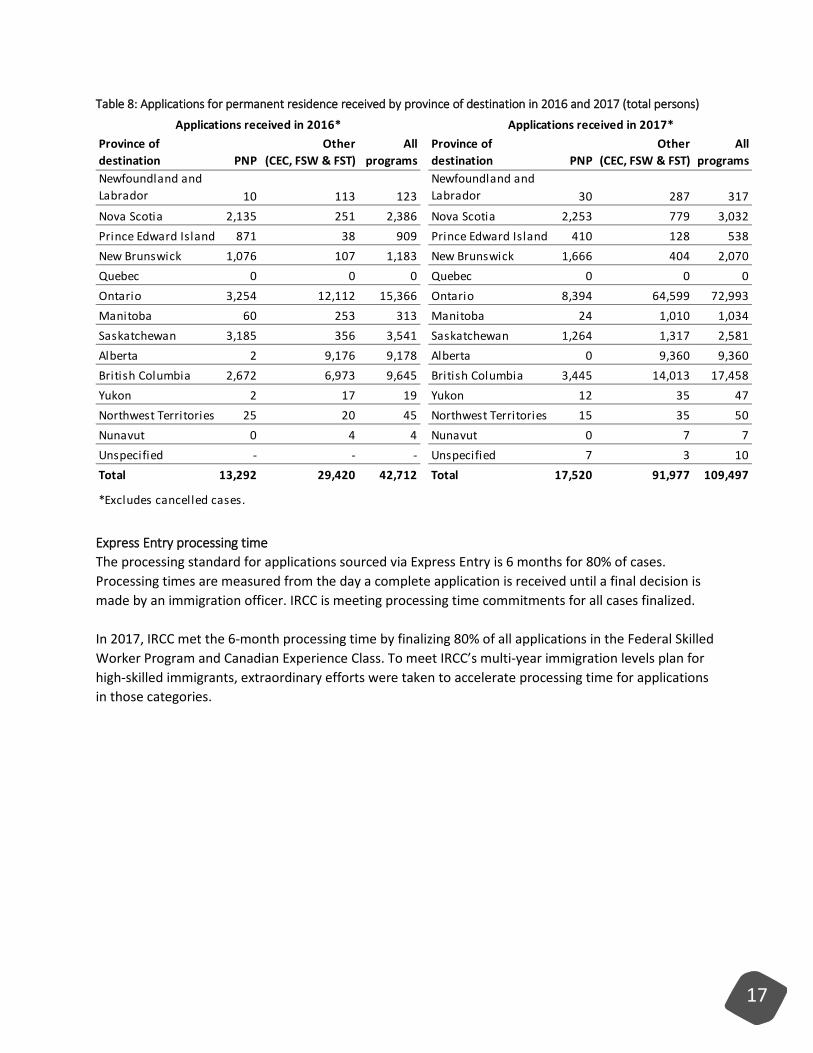
Table 8: Applications for permanent residence received by province of destination in 2016 and 2017 (total persons)
Express Entry processing time The processing standard for applications sourced via Express Entry is 6 months for 80% of cases. Processing times are measured from the day a complete application is received until a final decision is made by an immigration officer. IRCC is meeting processing time commitments for all cases finalized. In 2017, IRCC met the 6-month processing time by finalizing 80% of all applications in the Federal Skilled Worker Program and Canadian Experience Class. To meet IRCC’s multi-year immigration levels plan for high-skilled immigrants, extraordinary efforts were taken to accelerate processing time for applications in those categories.
Province of destination PNP
Other (CEC, FSW & FST)
All programs
Province of destination PNP
Other (CEC, FSW & FST)
All programs
Newfoundland and Labrador 10 113 123
Newfoundland and Labrador 30 287 317
Nova Scotia 2,135 251 2,386 Nova Scotia 2,253 779 3,032Prince Edward Island 871 38 909 Prince Edward Island 410 128 538New Brunswick 1,076 107 1,183 New Brunswick 1,666 404 2,070Quebec 0 0 0 Quebec 0 0 0Ontario 3,254 12,112 15,366 Ontario 8,394 64,599 72,993Manitoba 60 253 313 Manitoba 24 1,010 1,034Saskatchewan 3,185 356 3,541 Saskatchewan 1,264 1,317 2,581Alberta 2 9,176 9,178 Alberta 0 9,360 9,360British Columbia 2,672 6,973 9,645 British Columbia 3,445 14,013 17,458Yukon 2 17 19 Yukon 12 35 47Northwest Territories 25 20 45 Northwest Territories 15 35 50Nunavut 0 4 4 Nunavut 0 7 7Unspecified - - - Unspecified 7 3 10Total 13,292 29,420 42,712 Total 17,520 91,977 109,497
*Excludes cancelled cases.
Applications received in 2016* Applications received in 2017*
18
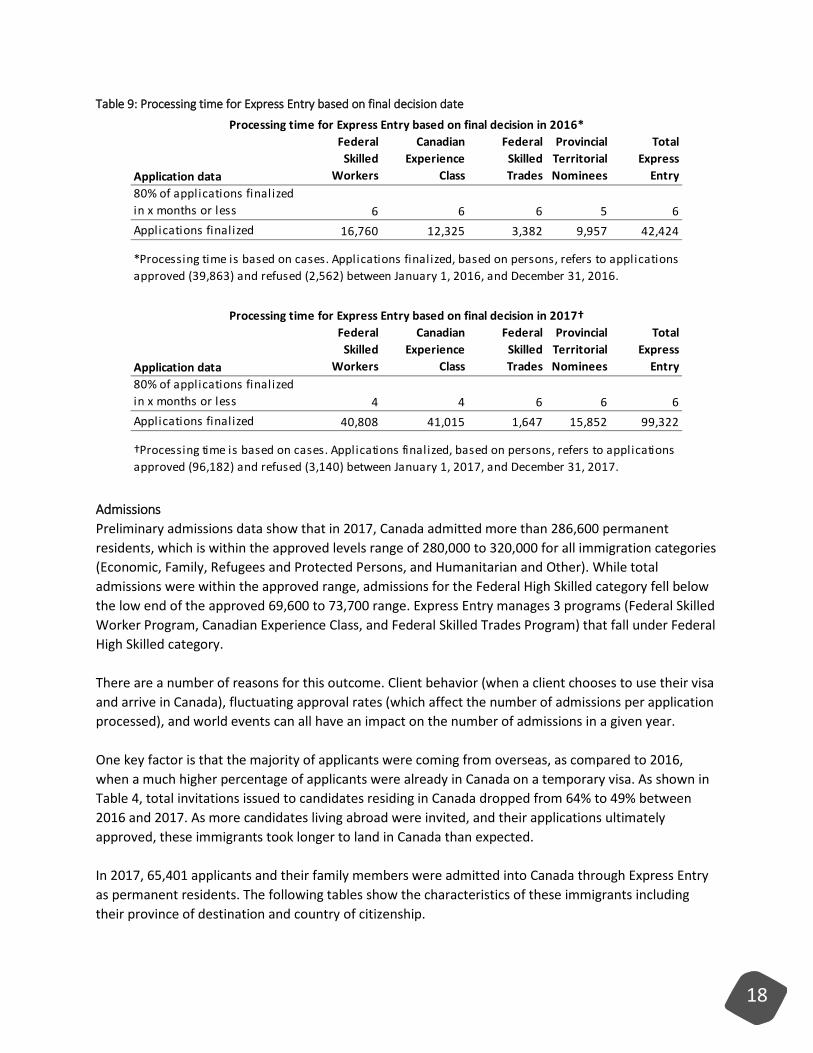
Table 9: Processing time for Express Entry based on final decision date
Admissions Preliminary admissions data show that in 2017, Canada admitted more than 286,600 permanent residents, which is within the approved levels range of 280,000 to 320,000 for all immigration categories (Economic, Family, Refugees and Protected Persons, and Humanitarian and Other). While total admissions were within the approved range, admissions for the Federal High Skilled category fell below the low end of the approved 69,600 to 73,700 range. Express Entry manages 3 programs (Federal Skilled Worker Program, Canadian Experience Class, and Federal Skilled Trades Program) that fall under Federal High Skilled category. There are a number of reasons for this outcome. Client behavior (when a client chooses to use their visa and arrive in Canada), fluctuating approval rates (which affect the number of admissions per application processed), and world events can all have an impact on the number of admissions in a given year. One key factor is that the majority of applicants were coming from overseas, as compared to 2016, when a much higher percentage of applicants were already in Canada on a temporary visa. As shown in Table 4, total invitations issued to candidates residing in Canada dropped from 64% to 49% between 2016 and 2017. As more candidates living abroad were invited, and their applications ultimately approved, these immigrants took longer to land in Canada than expected. In 2017, 65,401 applicants and their family members were admitted into Canada through Express Entry as permanent residents. The following tables show the characteristics of these immigrants including their province of destination and country of citizenship.
Application data
Federal Skilled
Workers
Canadian Experience
Class
Federal Skilled Trades
Provincial Territorial Nominees
Total Express
Entry80% of applications finalized in x months or less 6 6 6 5 6Applications finalized 16,760 12,325 3,382 9,957 42,424
Application data
Federal Skilled
Workers
Canadian Experience
Class
Federal Skilled Trades
Provincial Territorial Nominees
Total Express
Entry80% of applications finalized in x months or less 4 4 6 6 6Applications finalized 40,808 41,015 1,647 15,852 99,322
Processing time for Express Entry based on final decision in 2016*
*Processing time is based on cases. Applications finalized, based on persons, refers to applications approved (39,863) and refused (2,562) between January 1, 2016, and December 31, 2016.
Processing time for Express Entry based on final decision in 2017†
†Processing time is based on cases. Applications finalized, based on persons, refers to applications approved (96,182) and refused (3,140) between January 1, 2017, and December 31, 2017.

19
Table 10: Admissions by province of destination and immigration categories under Express Entry in 2016 and 2017 (total persons)
Table 11: Admissions in 2016 and 2017 under Express Entry by top 10 countries of citizenship (total persons)
II. Special topics: Additional points
Additional points have been a component of Express Entry since its launch. At the beginning, Express Entry awarded 600 additional points to candidates with a qualifying arranged employment and 600 points to candidates with a nomination from a province or territory.
Province of destination PNP
Other (CEC, FSW & FST)
All programs
Province of destination PNP
Other (CEC, FSW & FST)
All programs
Newfoundland and Labrador 3 87 90
Newfoundland and Labrador 8 198 206
Nova Scotia 1,410 201 1,611 Nova Scotia 1,851 418 2,269Prince Edward Island 426 17 443 Prince Edward Island 740 79 819New Brunswick 367 72 439 New Brunswick 1,249 189 1,438Quebec 0 0 0 Quebec 0 0 0Ontario 1,948 10,449 12,397 Ontario 4,420 31,667 36,087Manitoba 99 205 304 Manitoba 47 492 539Saskatchewan 1,678 321 1,999 Saskatchewan 2,154 715 2,869Alberta 0 9,492 9,492 Alberta 2 8,685 8,687British Columbia 1,877 4,703 6,580 British Columbia 3,019 9,382 12,401Yukon 0 15 15 Yukon 6 17 23Northwest Territories 10 22 32 Northwest Territories 32 23 55Nunavut 0 9 9 Nunavut 0 8 8Total 7,818 25,593 33,411 Total 13,528 51,873 65,401
Admissions in 2016 Admissions in 2017
Country of Citizenship* Number % Number %India 9,584 29% 26,340 40%China 2,657 8% 5,758 9%Nigeria 1,036 3% 2,885 4%United States 1,245 4% 2,826 4%Philippines 3,736 11% 2,685 4%United Kingdom 1,990 6% 2,358 4%Pakistan 819 2% 1,525 2%Brazil 470 1% 1,439 2%Ireland, Republic of 1,126 3% 1,239 2%Korea, South 741 2% 1,174 2%Other 10,007 30% 17,172 26%Total 33,411 100% 65,401 100%0%*Based on 2017 ranking.
Admissions2016 2017
20
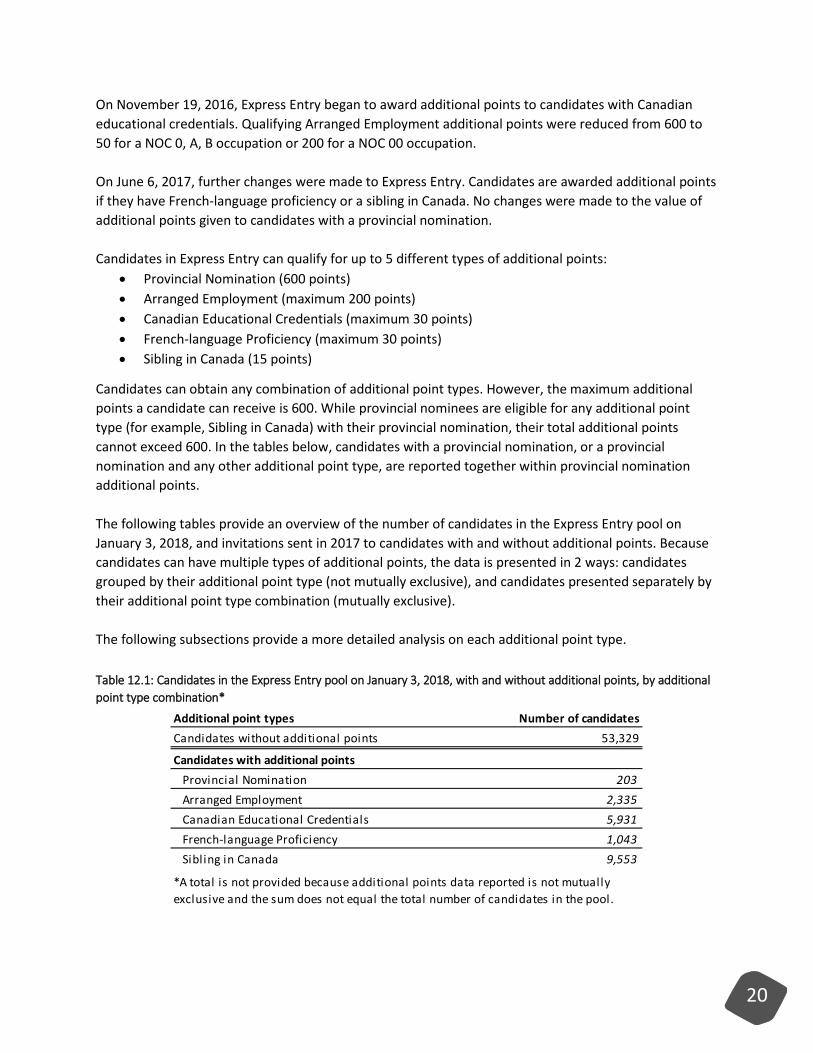
On November 19, 2016, Express Entry began to award additional points to candidates with Canadian educational credentials. Qualifying Arranged Employment additional points were reduced from 600 to 50 for a NOC 0, A, B occupation or 200 for a NOC 00 occupation. On June 6, 2017, further changes were made to Express Entry. Candidates are awarded additional points if they have French-language proficiency or a sibling in Canada. No changes were made to the value of additional points given to candidates with a provincial nomination. Candidates in Express Entry can qualify for up to 5 different types of additional points:
• Provincial Nomination (600 points) • Arranged Employment (maximum 200 points) • Canadian Educational Credentials (maximum 30 points) • French-language Proficiency (maximum 30 points) • Sibling in Canada (15 points)
Candidates can obtain any combination of additional point types. However, the maximum additional points a candidate can receive is 600. While provincial nominees are eligible for any additional point type (for example, Sibling in Canada) with their provincial nomination, their total additional points cannot exceed 600. In the tables below, candidates with a provincial nomination, or a provincial nomination and any other additional point type, are reported together within provincial nomination additional points. The following tables provide an overview of the number of candidates in the Express Entry pool on January 3, 2018, and invitations sent in 2017 to candidates with and without additional points. Because candidates can have multiple types of additional points, the data is presented in 2 ways: candidates grouped by their additional point type (not mutually exclusive), and candidates presented separately by their additional point type combination (mutually exclusive). The following subsections provide a more detailed analysis on each additional point type. Table 12.1: Candidates in the Express Entry pool on January 3, 2018, with and without additional points, by additional point type combination*
Additional point types Number of candidatesCandidates without additional points 53,329
Candidates with additional pointsProvincial Nomination 203Arranged Employment 2,335Canadian Educational Credentials 5,931French-language Proficiency 1,043Sibling in Canada 9,553
*A total is not provided because additional points data reported is not mutually exclusive and the sum does not equal the total number of candidates in the pool.

21
Table 12.2: Candidates in the Express Entry pool on January 3, 2018, with and without additional points by additional point type combination*
Table 13.1: Invitations issued in 2017 to candidates with and without additional points, by additional point type combination*
Additional point types Number of candidates %
Candidates without additional points 53,329 75%
One additional point type 16,483 23%
Provincial Nomination 203 1%Arranged Employment 1,779 11%Canadian Educational Credentials 5,125 31%French-language Proficiency 818 5%Sibling in Canada 8,558 52%
Two additional point types 1,243 2%
Arranged Employment and Canadian Educational Credentials 236 19%Arranged Employment and Sibling in Canada 264 21%Canadian Educational Credentials and Sibling in Canada 525 42%French-language Proficiency and Sibling in Canada 175 14%Arranged Employment and French-language Proficiency 26 2%Canadian Educational Credentials and French-language Proficiency 17 1%
Three additional point types 32 0%Arranged Employment, Canadian Educational Credentials and Sibling in Canada 25 78%Arranged Employment, Sibling in Canada and French-language Proficiency 4 13%Arranged Employment, French-language Proficiency and Canadian Educational Credentials 1 3%Canadian Educational Credentials, French-language Proficiency and Sibling in Canada 2 6%
Four additional point types 0 0%Arranged Employment, Canadian Educational Credentials, French-language Proficiency and Sibling in Canada 0 0%
Total 71,087 100%
*All data reported is mutually exclusive.
Additional point types Invitations issuedCandidates without additional points 43,285
Candidates with additional pointsProvincial Nomination 8,733Arranged Employment 8,195Canadian Educational Credentials 23,907French-language Proficiency 1,695Sibling in Canada 3,781
*A total is not provided because additional points data reported is not mutually exclusive and the sum does not equal the total number invitations issued.
22
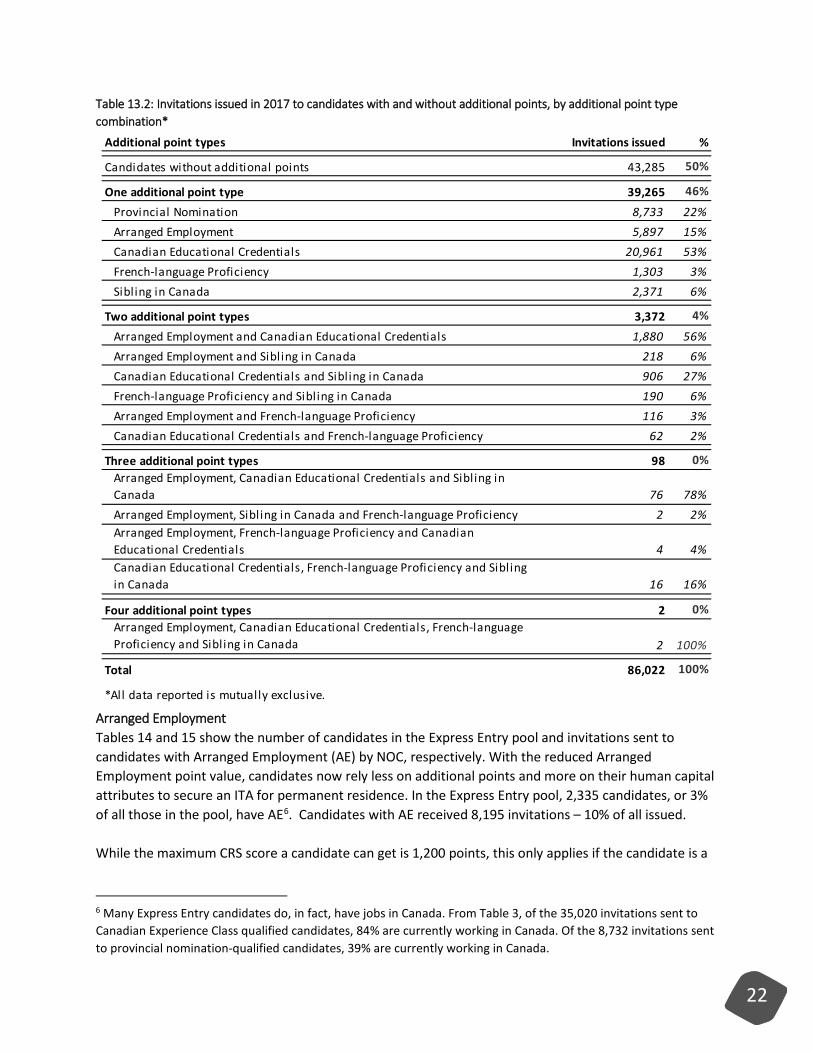
Table 13.2: Invitations issued in 2017 to candidates with and without additional points, by additional point type combination*
Arranged Employment Tables 14 and 15 show the number of candidates in the Express Entry pool and invitations sent to candidates with Arranged Employment (AE) by NOC, respectively. With the reduced Arranged Employment point value, candidates now rely less on additional points and more on their human capital attributes to secure an ITA for permanent residence. In the Express Entry pool, 2,335 candidates, or 3% of all those in the pool, have AE6. Candidates with AE received 8,195 invitations – 10% of all issued. While the maximum CRS score a candidate can get is 1,200 points, this only applies if the candidate is a
6 Many Express Entry candidates do, in fact, have jobs in Canada. From Table 3, of the 35,020 invitations sent to Canadian Experience Class qualified candidates, 84% are currently working in Canada. Of the 8,732 invitations sent to provincial nomination-qualified candidates, 39% are currently working in Canada.
Additional point types Invitations issued %
Candidates without additional points 43,285 50%
One additional point type 39,265 46%
Provincial Nomination 8,733 22%Arranged Employment 5,897 15%Canadian Educational Credentials 20,961 53%French-language Proficiency 1,303 3%Sibling in Canada 2,371 6%
Two additional point types 3,372 4%
Arranged Employment and Canadian Educational Credentials 1,880 56%Arranged Employment and Sibling in Canada 218 6%Canadian Educational Credentials and Sibling in Canada 906 27%French-language Proficiency and Sibling in Canada 190 6%Arranged Employment and French-language Proficiency 116 3%Canadian Educational Credentials and French-language Proficiency 62 2%
Three additional point types 98 0%Arranged Employment, Canadian Educational Credentials and Sibling in Canada 76 78%Arranged Employment, Sibling in Canada and French-language Proficiency 2 2%Arranged Employment, French-language Proficiency and Canadian Educational Credentials 4 4%Canadian Educational Credentials, French-language Proficiency and Sibling in Canada 16 16%
Four additional point types 2 0%Arranged Employment, Canadian Educational Credentials, French-language Proficiency and Sibling in Canada 2 100%
Total 86,022 100%
*All data reported is mutually exclusive.

23
provincial nominee. Candidates who are not provincial nominees can get a maximum 875 points if they are senior executives (primary occupation NOC 00), or a maximum 725 points in all other cases. Table 14: Candidates in the Express Entry pool as of January 3, 2018, with and without Arranged Employment by NOC and other additional point types
Occupation AE 50 pts* AE 200 pts* Total AE AE and PN Without AETotal
candidatesNOC6322-Cooks 204 0 204 2 280 486NOC6311-Food service supervisors 175 0 175 0 426 601NOC5241-Graphic designers and i l lustrators 80 0 80 1 449 530NOC2173-Software engineers and designers 73 0 73 0 4,913 4,986NOC0631-Restaurant and food service managers 72 0 72 0 463 535NOC8252-Agricultural service contractors, farm supervisors and specialized l ivestock workers 69 0 69 0 22 91NOC7271-Carpenters 64 0 64 0 82 146NOC6211-Retail sales supervisors 61 0 61 0 407 468NOC2171-Information systems analysts and consultants 56 0 56 0 5,258 5,314NOC2174-Computer programmers and interactive media developers 52 0 52 0 2,361 2,413Top 10 906 0 906 3 14,661 15,570Other 1,400 29 1,429 9 54,079 55,517Total 2,306 29 2,335 12 68,740 71,087
*Includes candidates with other additional point types (for example, Arranged Employment and Sibling in Canada), except those with Provincial Nomination additional points.
24
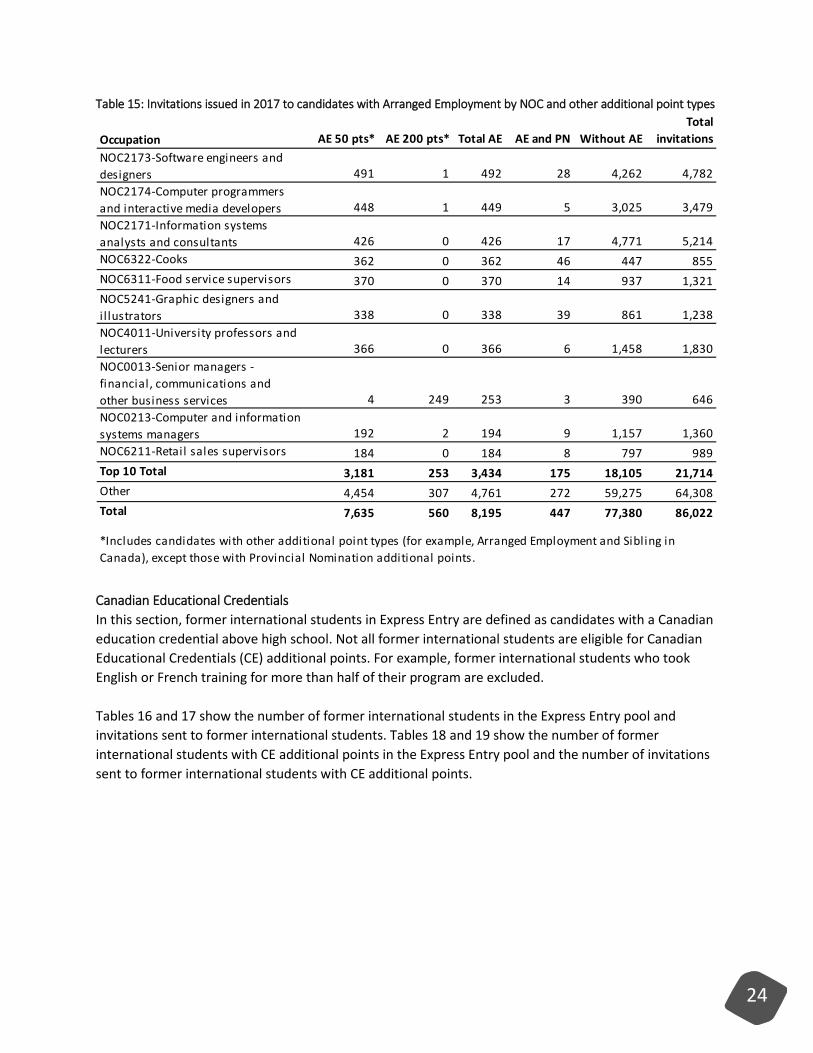
Table 15: Invitations issued in 2017 to candidates with Arranged Employment by NOC and other additional point types
Canadian Educational Credentials In this section, former international students in Express Entry are defined as candidates with a Canadian education credential above high school. Not all former international students are eligible for Canadian Educational Credentials (CE) additional points. For example, former international students who took English or French training for more than half of their program are excluded. Tables 16 and 17 show the number of former international students in the Express Entry pool and invitations sent to former international students. Tables 18 and 19 show the number of former international students with CE additional points in the Express Entry pool and the number of invitations sent to former international students with CE additional points.
Occupation AE 50 pts* AE 200 pts* Total AE AE and PN Without AETotal
invitationsNOC2173-Software engineers and designers 491 1 492 28 4,262 4,782NOC2174-Computer programmers and interactive media developers 448 1 449 5 3,025 3,479NOC2171-Information systems analysts and consultants 426 0 426 17 4,771 5,214NOC6322-Cooks 362 0 362 46 447 855NOC6311-Food service supervisors 370 0 370 14 937 1,321NOC5241-Graphic designers and i l lustrators 338 0 338 39 861 1,238NOC4011-University professors and lecturers 366 0 366 6 1,458 1,830NOC0013-Senior managers - financial, communications and other business services 4 249 253 3 390 646NOC0213-Computer and information systems managers 192 2 194 9 1,157 1,360NOC6211-Retail sales supervisors 184 0 184 8 797 989Top 10 Total 3,181 253 3,434 175 18,105 21,714Other 4,454 307 4,761 272 59,275 64,308Total 7,635 560 8,195 447 77,380 86,022
*Includes candidates with other additional point types (for example, Arranged Employment and Sibling in Canada), except those with Provincial Nomination additional points.
25
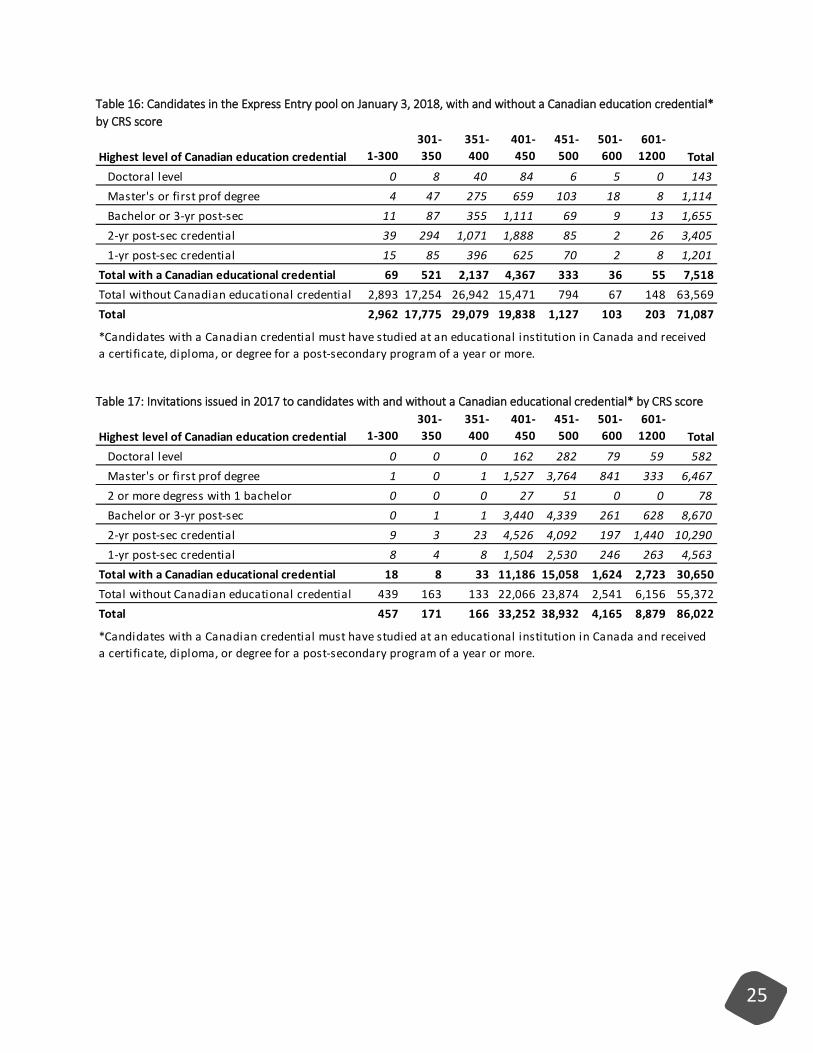
Table 16: Candidates in the Express Entry pool on January 3, 2018, with and without a Canadian education credential* by CRS score
Table 17: Invitations issued in 2017 to candidates with and without a Canadian educational credential* by CRS score
Highest level of Canadian education credential 1-300301-350
351-400
401-450
451-500
501-600
601-1200 Total
Doctoral level 0 8 40 84 6 5 0 143Master's or first prof degree 4 47 275 659 103 18 8 1,114Bachelor or 3-yr post-sec 11 87 355 1,111 69 9 13 1,6552-yr post-sec credential 39 294 1,071 1,888 85 2 26 3,4051-yr post-sec credential 15 85 396 625 70 2 8 1,201
Total with a Canadian educational credential 69 521 2,137 4,367 333 36 55 7,518Total without Canadian educational credential 2,893 17,254 26,942 15,471 794 67 148 63,569Total 2,962 17,775 29,079 19,838 1,127 103 203 71,087
*Candidates with a Canadian credential must have studied at an educational institution in Canada and received a certificate, diploma, or degree for a post-secondary program of a year or more.
Highest level of Canadian education credential 1-300301-350
351-400
401-450
451-500
501-600
601-1200 Total
Doctoral level 0 0 0 162 282 79 59 582Master's or first prof degree 1 0 1 1,527 3,764 841 333 6,4672 or more degress with 1 bachelor 0 0 0 27 51 0 0 78Bachelor or 3-yr post-sec 0 1 1 3,440 4,339 261 628 8,6702-yr post-sec credential 9 3 23 4,526 4,092 197 1,440 10,2901-yr post-sec credential 8 4 8 1,504 2,530 246 263 4,563
Total with a Canadian educational credential 18 8 33 11,186 15,058 1,624 2,723 30,650Total without Canadian educational credential 439 163 133 22,066 23,874 2,541 6,156 55,372Total 457 171 166 33,252 38,932 4,165 8,879 86,022
*Candidates with a Canadian credential must have studied at an educational institution in Canada and received a certificate, diploma, or degree for a post-secondary program of a year or more.
26
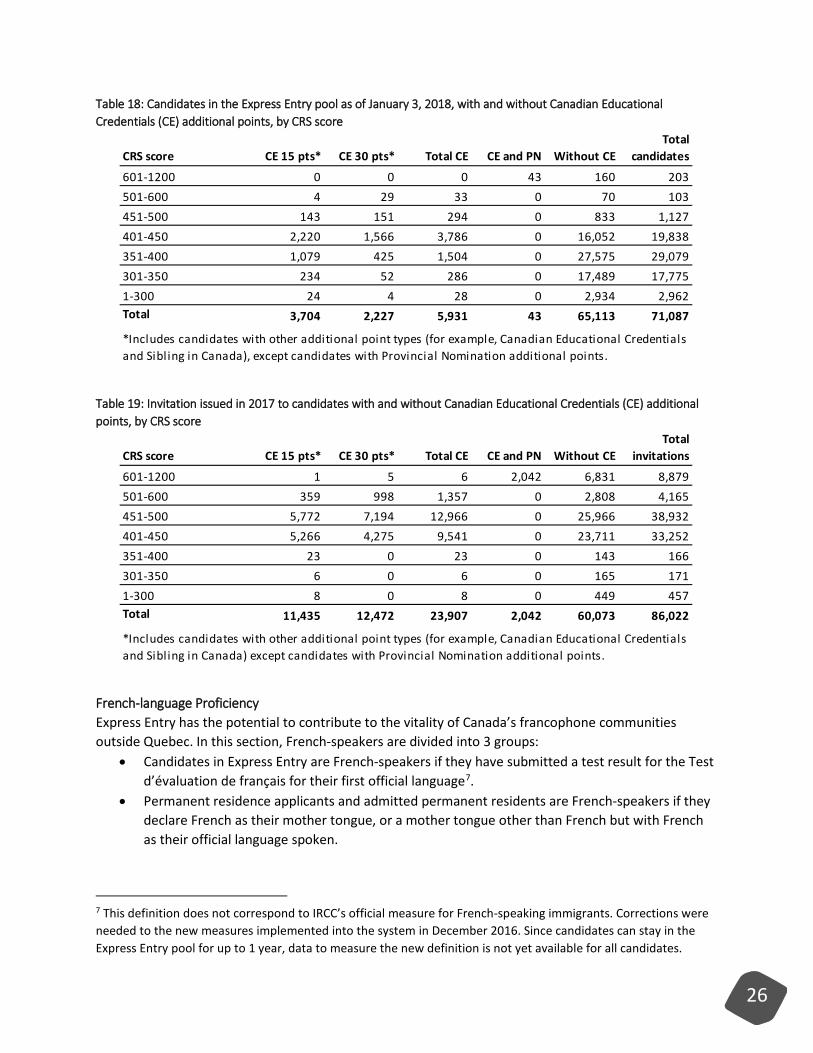
Table 18: Candidates in the Express Entry pool as of January 3, 2018, with and without Canadian Educational Credentials (CE) additional points, by CRS score
Table 19: Invitation issued in 2017 to candidates with and without Canadian Educational Credentials (CE) additional points, by CRS score
French-language Proficiency Express Entry has the potential to contribute to the vitality of Canada’s francophone communities outside Quebec. In this section, French-speakers are divided into 3 groups:
• Candidates in Express Entry are French-speakers if they have submitted a test result for the Test d’évaluation de français for their first official language7.
• Permanent residence applicants and admitted permanent residents are French-speakers if they declare French as their mother tongue, or a mother tongue other than French but with French as their official language spoken.
7 This definition does not correspond to IRCC’s official measure for French-speaking immigrants. Corrections were needed to the new measures implemented into the system in December 2016. Since candidates can stay in the Express Entry pool for up to 1 year, data to measure the new definition is not yet available for all candidates.
CRS score CE 15 pts* CE 30 pts* Total CE CE and PN Without CETotal
candidates
601-1200 0 0 0 43 160 203501-600 4 29 33 0 70 103451-500 143 151 294 0 833 1,127401-450 2,220 1,566 3,786 0 16,052 19,838351-400 1,079 425 1,504 0 27,575 29,079301-350 234 52 286 0 17,489 17,7751-300 24 4 28 0 2,934 2,962Total 3,704 2,227 5,931 43 65,113 71,087
*Includes candidates with other additional point types (for example, Canadian Educational Credentials and Sibling in Canada), except candidates with Provincial Nomination additional points.
CRS score CE 15 pts* CE 30 pts* Total CE CE and PN Without CETotal
invitations
601-1200 1 5 6 2,042 6,831 8,879501-600 359 998 1,357 0 2,808 4,165451-500 5,772 7,194 12,966 0 25,966 38,932401-450 5,266 4,275 9,541 0 23,711 33,252351-400 23 0 23 0 143 166301-350 6 0 6 0 165 1711-300 8 0 8 0 449 457Total 11,435 12,472 23,907 2,042 60,073 86,022
*Includes candidates with other additional point types (for example, Canadian Educational Credentials and Sibling in Canada) except candidates with Provincial Nomination additional points.
27
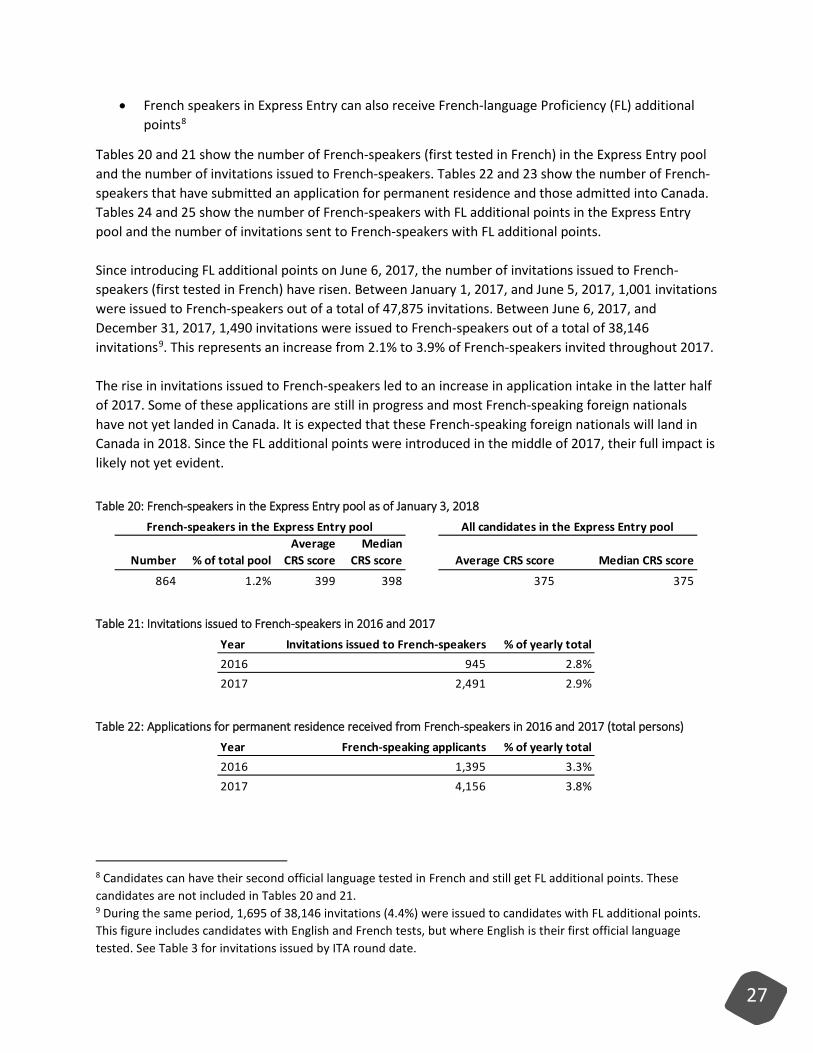
• French speakers in Express Entry can also receive French-language Proficiency (FL) additional points8
Tables 20 and 21 show the number of French-speakers (first tested in French) in the Express Entry pool and the number of invitations issued to French-speakers. Tables 22 and 23 show the number of French-speakers that have submitted an application for permanent residence and those admitted into Canada. Tables 24 and 25 show the number of French-speakers with FL additional points in the Express Entry pool and the number of invitations sent to French-speakers with FL additional points. Since introducing FL additional points on June 6, 2017, the number of invitations issued to French-speakers (first tested in French) have risen. Between January 1, 2017, and June 5, 2017, 1,001 invitations were issued to French-speakers out of a total of 47,875 invitations. Between June 6, 2017, and December 31, 2017, 1,490 invitations were issued to French-speakers out of a total of 38,146 invitations9. This represents an increase from 2.1% to 3.9% of French-speakers invited throughout 2017. The rise in invitations issued to French-speakers led to an increase in application intake in the latter half of 2017. Some of these applications are still in progress and most French-speaking foreign nationals have not yet landed in Canada. It is expected that these French-speaking foreign nationals will land in Canada in 2018. Since the FL additional points were introduced in the middle of 2017, their full impact is likely not yet evident. Table 20: French-speakers in the Express Entry pool as of January 3, 2018
Table 21: Invitations issued to French-speakers in 2016 and 2017
Table 22: Applications for permanent residence received from French-speakers in 2016 and 2017 (total persons)
8 Candidates can have their second official language tested in French and still get FL additional points. These candidates are not included in Tables 20 and 21. 9 During the same period, 1,695 of 38,146 invitations (4.4%) were issued to candidates with FL additional points. This figure includes candidates with English and French tests, but where English is their first official language tested. See Table 3 for invitations issued by ITA round date.
Number % of total poolAverage
CRS scoreMedian
CRS score Average CRS score Median CRS score
864 1.2% 399 398 375 375
All candidates in the Express Entry poolFrench-speakers in the Express Entry pool
Year Invitations issued to French-speakers % of yearly total2016 945 2.8%2017 2,491 2.9%
Year French-speaking applicants % of yearly total2016 1,395 3.3%2017 4,156 3.8%
28
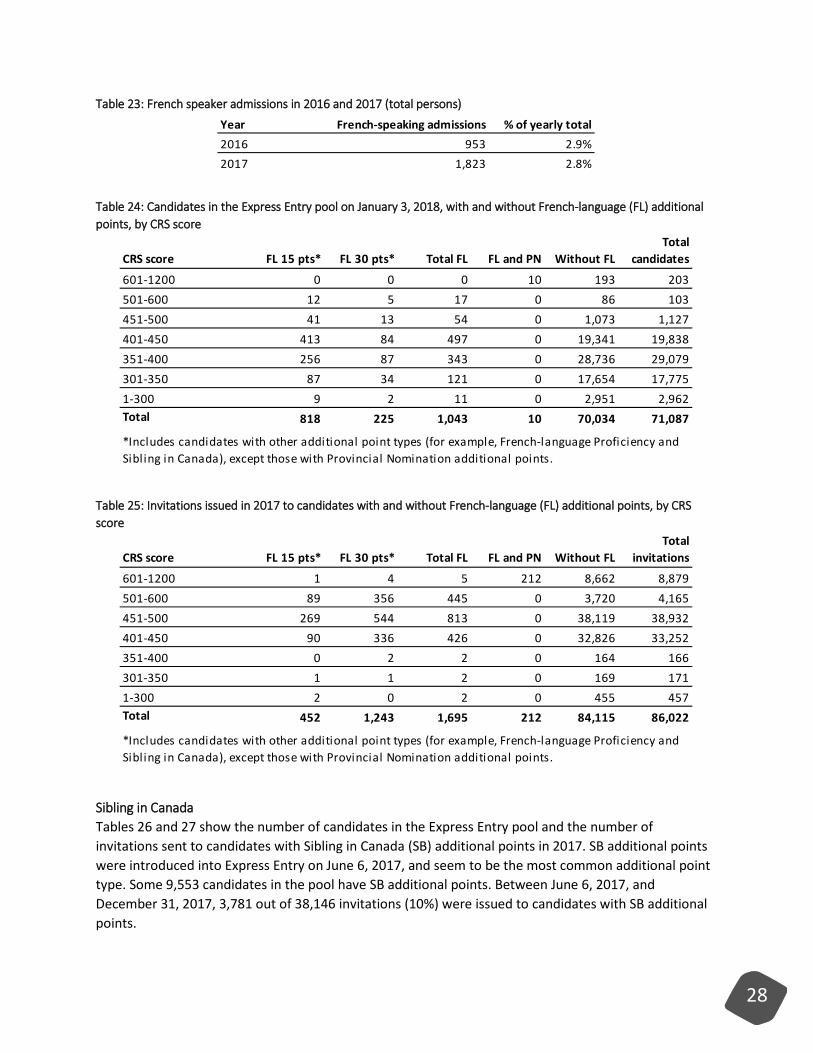
Table 23: French speaker admissions in 2016 and 2017 (total persons)
Table 24: Candidates in the Express Entry pool on January 3, 2018, with and without French-language (FL) additional points, by CRS score
Table 25: Invitations issued in 2017 to candidates with and without French-language (FL) additional points, by CRS score
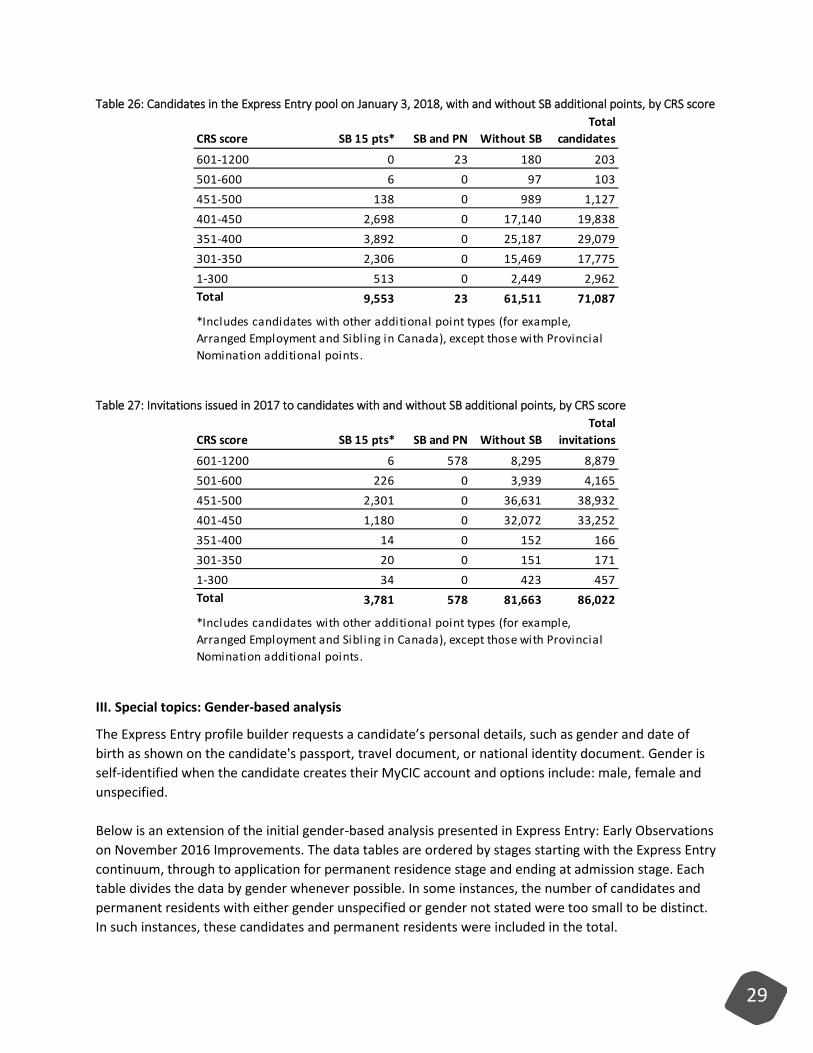
Sibling in Canada Tables 26 and 27 show the number of candidates in the Express Entry pool and the number of invitations sent to candidates with Sibling in Canada (SB) additional points in 2017. SB additional points were introduced into Express Entry on June 6, 2017, and seem to be the most common additional point type. Some 9,553 candidates in the pool have SB additional points. Between June 6, 2017, and December 31, 2017, 3,781 out of 38,146 invitations (10%) were issued to candidates with SB additional points.
Year French-speaking admissions % of yearly total2016 953 2.9%2017 1,823 2.8%
CRS score FL 15 pts* FL 30 pts* Total FL FL and PN Without FLTotal
candidates
601-1200 0 0 0 10 193 203501-600 12 5 17 0 86 103451-500 41 13 54 0 1,073 1,127401-450 413 84 497 0 19,341 19,838351-400 256 87 343 0 28,736 29,079301-350 87 34 121 0 17,654 17,7751-300 9 2 11 0 2,951 2,962Total 818 225 1,043 10 70,034 71,087
*Includes candidates with other additional point types (for example, French-language Proficiency and Sibling in Canada), except those with Provincial Nomination additional points.
CRS score FL 15 pts* FL 30 pts* Total FL FL and PN Without FLTotal
invitations
601-1200 1 4 5 212 8,662 8,879501-600 89 356 445 0 3,720 4,165451-500 269 544 813 0 38,119 38,932401-450 90 336 426 0 32,826 33,252351-400 0 2 2 0 164 166301-350 1 1 2 0 169 1711-300 2 0 2 0 455 457Total 452 1,243 1,695 212 84,115 86,022
*Includes candidates with other additional point types (for example, French-language Proficiency and Sibling in Canada), except those with Provincial Nomination additional points.
29
Table 26: Candidates in the Express Entry pool on January 3, 2018, with and without SB additional points, by CRS score
Table 27: Invitations issued in 2017 to candidates with and without SB additional points, by CRS score
III. Special topics: Gender-based analysis
The Express Entry profile builder requests a candidate’s personal details, such as gender and date of birth as shown on the candidate's passport, travel document, or national identity document. Gender is self-identified when the candidate creates their MyCIC account and options include: male, female and unspecified. Below is an extension of the initial gender-based analysis presented in Express Entry: Early Observations on November 2016 Improvements. The data tables are ordered by stages starting with the Express Entry continuum, through to application for permanent residence stage and ending at admission stage. Each table divides the data by gender whenever possible. In some instances, the number of candidates and permanent residents with either gender unspecified or gender not stated were too small to be distinct. In such instances, these candidates and permanent residents were included in the total.
CRS score SB 15 pts* SB and PN Without SBTotal
candidates
601-1200 0 23 180 203501-600 6 0 97 103451-500 138 0 989 1,127401-450 2,698 0 17,140 19,838351-400 3,892 0 25,187 29,079301-350 2,306 0 15,469 17,7751-300 513 0 2,449 2,962Total 9,553 23 61,511 71,087
*Includes candidates with other additional point types (for example, Arranged Employment and Sibling in Canada), except those with Provincial Nomination additional points.
CRS score SB 15 pts* SB and PN Without SBTotal
invitations
601-1200 6 578 8,295 8,879501-600 226 0 3,939 4,165451-500 2,301 0 36,631 38,932401-450 1,180 0 32,072 33,252351-400 14 0 152 166301-350 20 0 151 1711-300 34 0 423 457Total 3,781 578 81,663 86,022
*Includes candidates with other additional point types (for example, Arranged Employment and Sibling in Canada), except those with Provincial Nomination additional points.
30
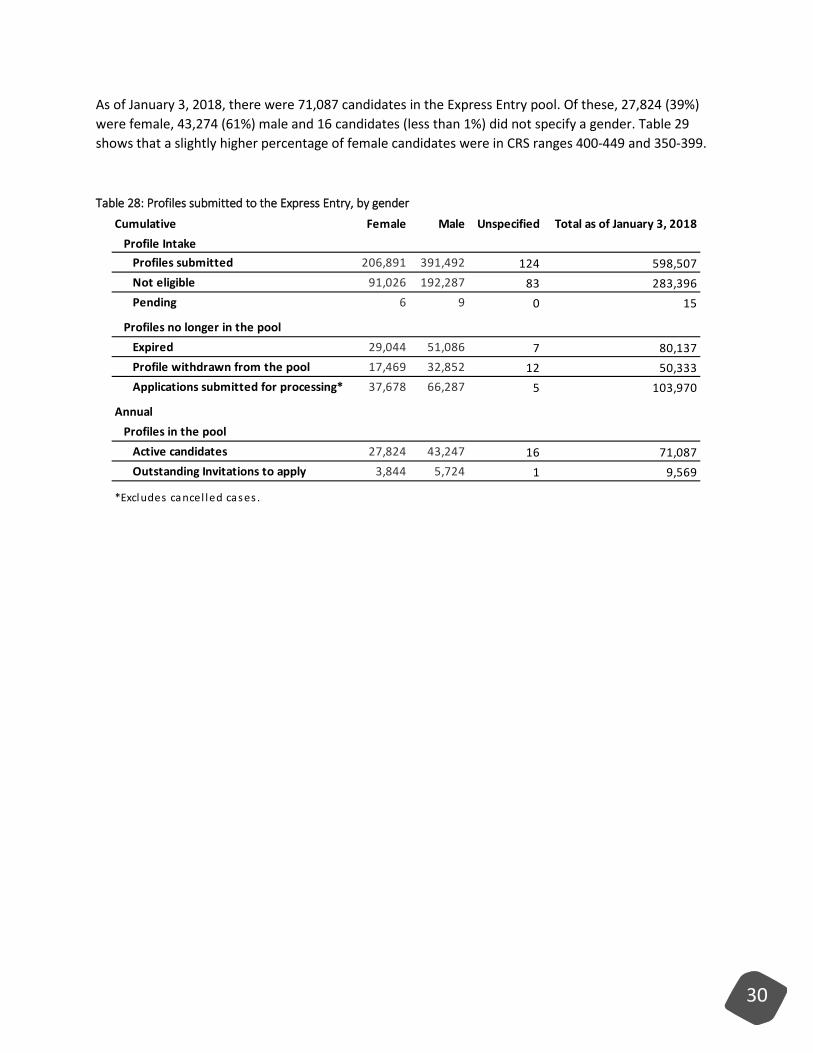
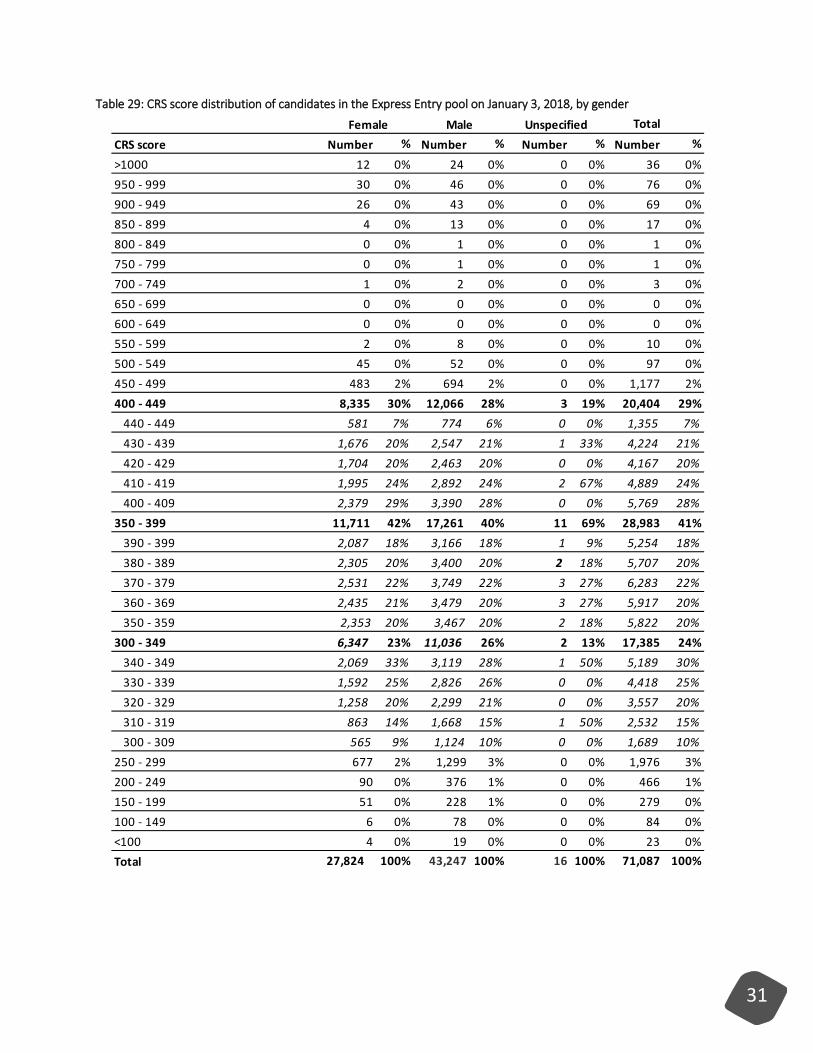
As of January 3, 2018, there were 71,087 candidates in the Express Entry pool. Of these, 27,824 (39%) were female, 43,274 (61%) male and 16 candidates (less than 1%) did not specify a gender. Table 29 shows that a slightly higher percentage of female candidates were in CRS ranges 400-449 and 350-399. Table 28: Profiles submitted to the Express Entry, by gender
Cumulative Female Male Unspecified Total as of January 3, 2018Profile Intake
Profiles submitted 206,891 391,492 124 598,507Not eligible 91,026 192,287 83 283,396Pending 6 9 0 15
Profiles no longer in the poolExpired 29,044 51,086 7 80,137Profile withdrawn from the pool 17,469 32,852 12 50,333Applications submitted for processing* 37,678 66,287 5 103,970
AnnualProfiles in the pool
Active candidates 27,824 43,247 16 71,087Outstanding Invitations to apply 3,844 5,724 1 9,569
*Excludes cancel led cases .
31
Table 29: CRS score distribution of candidates in the Express Entry pool on January 3, 2018, by gender
Total
CRS score Number % Number % Number % Number %
>1000 12 0% 24 0% 0 0% 36 0%950 - 999 30 0% 46 0% 0 0% 76 0%900 - 949 26 0% 43 0% 0 0% 69 0%850 - 899 4 0% 13 0% 0 0% 17 0%800 - 849 0 0% 1 0% 0 0% 1 0%750 - 799 0 0% 1 0% 0 0% 1 0%700 - 749 1 0% 2 0% 0 0% 3 0%650 - 699 0 0% 0 0% 0 0% 0 0%600 - 649 0 0% 0 0% 0 0% 0 0%550 - 599 2 0% 8 0% 0 0% 10 0%500 - 549 45 0% 52 0% 0 0% 97 0%450 - 499 483 2% 694 2% 0 0% 1,177 2%400 - 449 8,335 30% 12,066 28% 3 19% 20,404 29%
440 - 449 581 7% 774 6% 0 0% 1,355 7%430 - 439 1,676 20% 2,547 21% 1 33% 4,224 21%420 - 429 1,704 20% 2,463 20% 0 0% 4,167 20%410 - 419 1,995 24% 2,892 24% 2 67% 4,889 24%400 - 409 2,379 29% 3,390 28% 0 0% 5,769 28%
350 - 399 11,711 42% 17,261 40% 11 69% 28,983 41%390 - 399 2,087 18% 3,166 18% 1 9% 5,254 18%380 - 389 2,305 20% 3,400 20% 2 18% 5,707 20%370 - 379 2,531 22% 3,749 22% 3 27% 6,283 22%360 - 369 2,435 21% 3,479 20% 3 27% 5,917 20%350 - 359 2,353 20% 3,467 20% 2 18% 5,822 20%
300 - 349 6,347 23% 11,036 26% 2 13% 17,385 24%340 - 349 2,069 33% 3,119 28% 1 50% 5,189 30%330 - 339 1,592 25% 2,826 26% 0 0% 4,418 25%320 - 329 1,258 20% 2,299 21% 0 0% 3,557 20%310 - 319 863 14% 1,668 15% 1 50% 2,532 15%300 - 309 565 9% 1,124 10% 0 0% 1,689 10%
250 - 299 677 2% 1,299 3% 0 0% 1,976 3%200 - 249 90 0% 376 1% 0 0% 466 1%150 - 199 51 0% 228 1% 0 0% 279 0%100 - 149 6 0% 78 0% 0 0% 84 0%<100 4 0% 19 0% 0 0% 23 0%Total 27,824 100% 43,247 100% 16 100% 71,087 100%
Female Male Unspecified

32
Tables 30.1 and 30.2 show the number of candidates in the Express Entry pool with and without additional points by gender. Table 30.1 groups all candidates by additional point types and Table 30.2 separates all candidates by each additional point type combination. In absolute terms, more male candidates in the Express Entry pool have additional point types but the percentage distribution for each additional point-type combination is similar for male and female candidates. In relative terms, neither gender has more additional point-type combinations than the other. Table 30.1: Candidates in the Express Entry pool on January 3, 2018, with and without additional points, by additional point-type combination and gender*
Additional point types Female Male UnspecifiedCandidates without additional points 20,469 32,851 9
Candidates with additional pointsProvincial Nomination 73 130 0Arranged Employment 686 1,648 1Canadian Educational Credentials 2,423 3,502 4French-language Proficiency 447 596 0Sibling in Canada 4,247 5,300 2
*A total is not provided because additional points data reported is not mutually exclusive and the sum does not equal the total number of candidates in the pool.
33
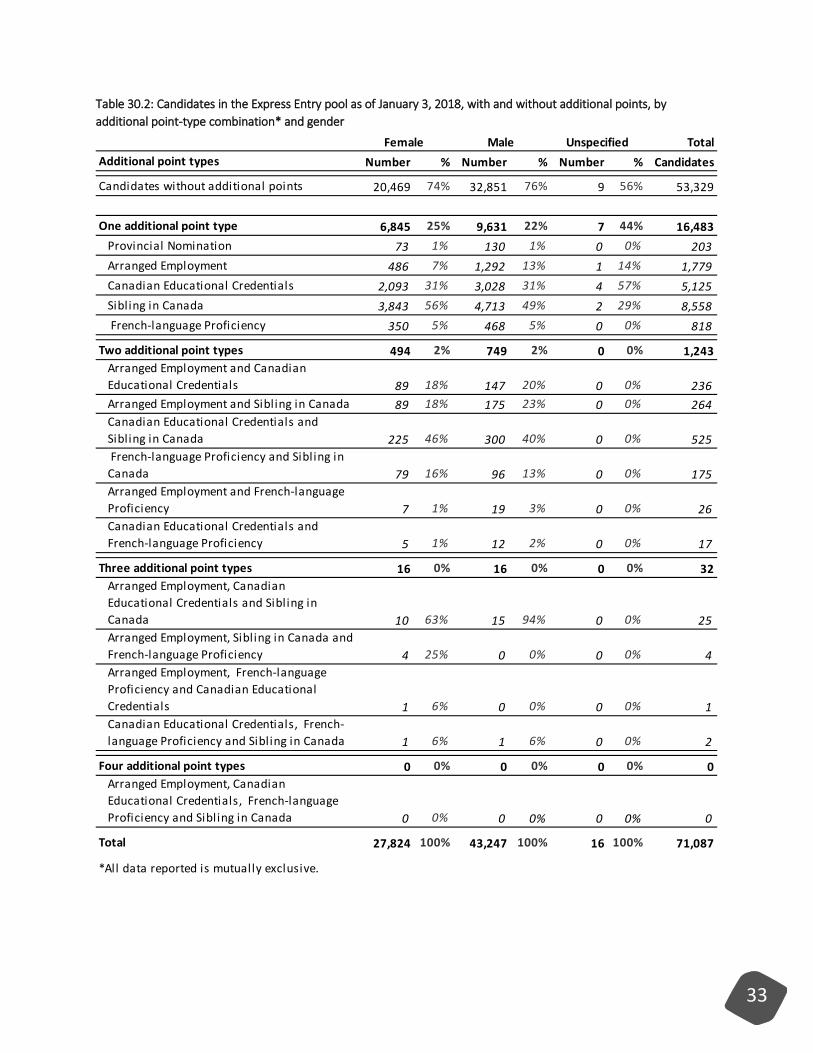
Table 30.2: Candidates in the Express Entry pool as of January 3, 2018, with and without additional points, by additional point-type combination* and gender
TotalAdditional point types Number % Number % Number % Candidates
Candidates without additional points 20,469 74% 32,851 76% 9 56% 53,329
One additional point type 6,845 25% 9,631 22% 7 44% 16,483Provincial Nomination 73 1% 130 1% 0 0% 203Arranged Employment 486 7% 1,292 13% 1 14% 1,779Canadian Educational Credentials 2,093 31% 3,028 31% 4 57% 5,125Sibling in Canada 3,843 56% 4,713 49% 2 29% 8,558 French-language Proficiency 350 5% 468 5% 0 0% 818
Two additional point types 494 2% 749 2% 0 0% 1,243Arranged Employment and Canadian Educational Credentials 89 18% 147 20% 0 0% 236Arranged Employment and Sibling in Canada 89 18% 175 23% 0 0% 264Canadian Educational Credentials and Sibling in Canada 225 46% 300 40% 0 0% 525 French-language Proficiency and Sibling in Canada 79 16% 96 13% 0 0% 175Arranged Employment and French-language Proficiency 7 1% 19 3% 0 0% 26Canadian Educational Credentials and French-language Proficiency 5 1% 12 2% 0 0% 17
Three additional point types 16 0% 16 0% 0 0% 32Arranged Employment, Canadian Educational Credentials and Sibling in Canada 10 63% 15 94% 0 0% 25Arranged Employment, Sibling in Canada and French-language Proficiency 4 25% 0 0% 0 0% 4Arranged Employment, French-language Proficiency and Canadian Educational Credentials 1 6% 0 0% 0 0% 1Canadian Educational Credentials, French-language Proficiency and Sibling in Canada 1 6% 1 6% 0 0% 2
Four additional point types 0 0% 0 0% 0 0% 0Arranged Employment, Canadian Educational Credentials, French-language Proficiency and Sibling in Canada 0 0% 0 0% 0 0% 0
Total 27,824 100% 43,247 100% 16 100% 71,087
*All data reported is mutually exclusive.
Female Male Unspecified
34
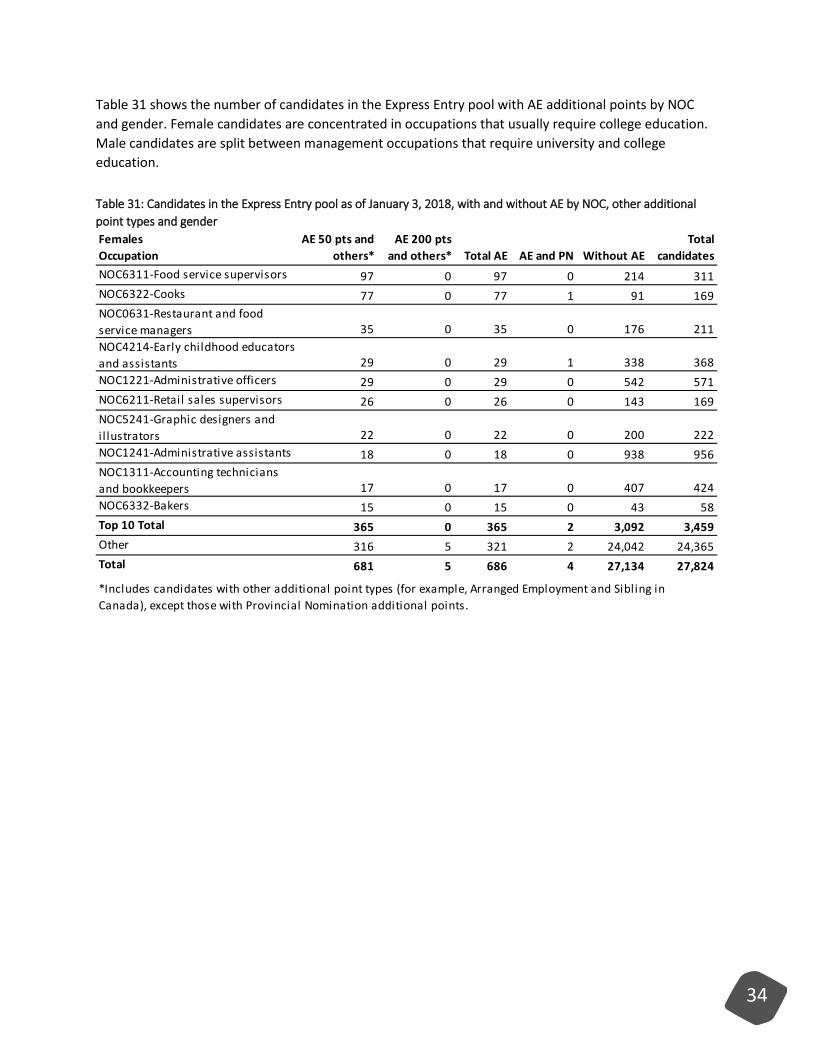
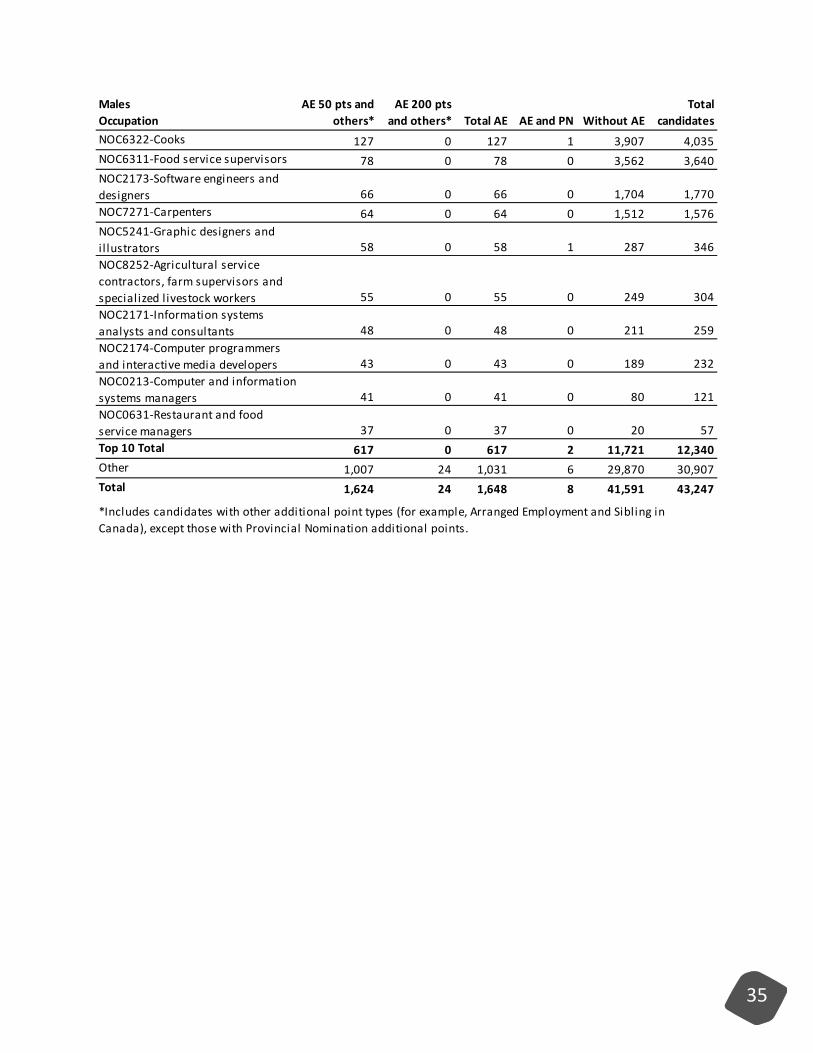
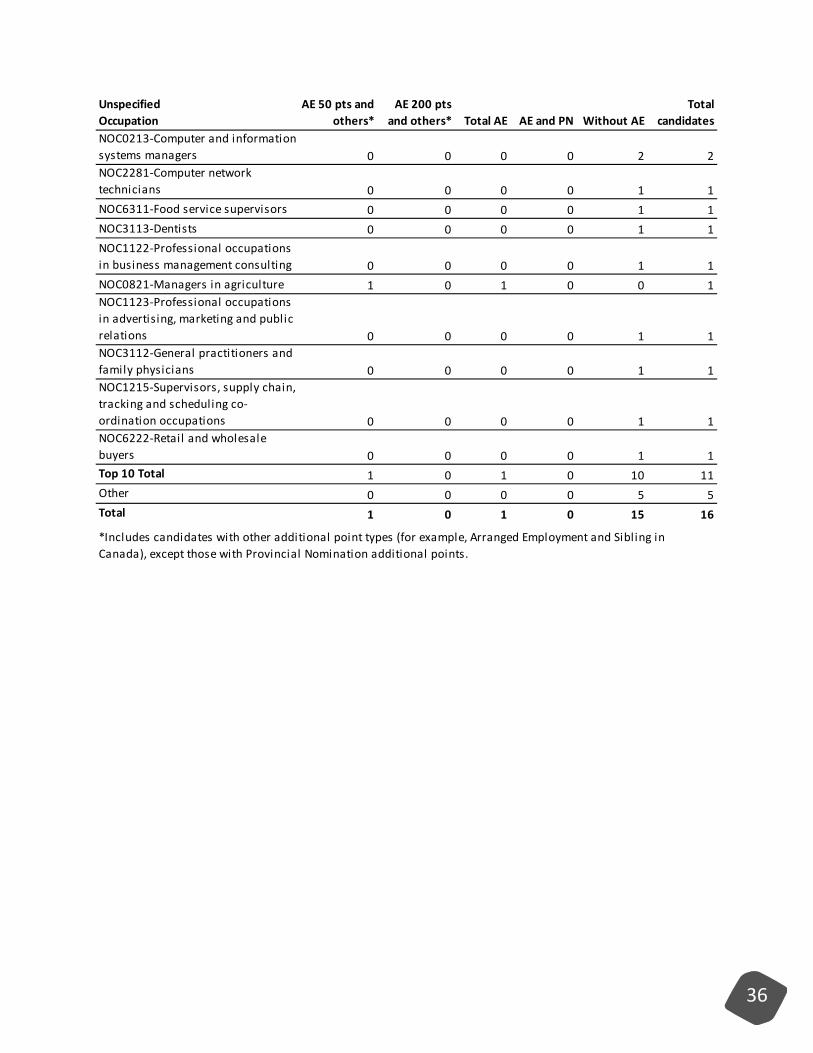
Table 31 shows the number of candidates in the Express Entry pool with AE additional points by NOC and gender. Female candidates are concentrated in occupations that usually require college education. Male candidates are split between management occupations that require university and college education. Table 31: Candidates in the Express Entry pool as of January 3, 2018, with and without AE by NOC, other additional point types and gender
FemalesOccupation
AE 50 pts and others*
AE 200 pts and others* Total AE AE and PN Without AE
Total candidates
NOC6311-Food service supervisors 97 0 97 0 214 311NOC6322-Cooks 77 0 77 1 91 169NOC0631-Restaurant and food service managers 35 0 35 0 176 211NOC4214-Early childhood educators and assistants 29 0 29 1 338 368NOC1221-Administrative officers 29 0 29 0 542 571NOC6211-Retail sales supervisors 26 0 26 0 143 169NOC5241-Graphic designers and i l lustrators 22 0 22 0 200 222NOC1241-Administrative assistants 18 0 18 0 938 956NOC1311-Accounting technicians and bookkeepers 17 0 17 0 407 424NOC6332-Bakers 15 0 15 0 43 58Top 10 Total 365 0 365 2 3,092 3,459Other 316 5 321 2 24,042 24,365Total 681 5 686 4 27,134 27,824
*Includes candidates with other additional point types (for example, Arranged Employment and Sibling in Canada), except those with Provincial Nomination additional points.
35
MalesOccupation
AE 50 pts and others*
AE 200 pts and others* Total AE AE and PN Without AE
Total candidates
NOC6322-Cooks 127 0 127 1 3,907 4,035NOC6311-Food service supervisors 78 0 78 0 3,562 3,640NOC2173-Software engineers and designers 66 0 66 0 1,704 1,770NOC7271-Carpenters 64 0 64 0 1,512 1,576NOC5241-Graphic designers and i l lustrators 58 0 58 1 287 346NOC8252-Agricultural service contractors, farm supervisors and specialized l ivestock workers 55 0 55 0 249 304NOC2171-Information systems analysts and consultants 48 0 48 0 211 259NOC2174-Computer programmers and interactive media developers 43 0 43 0 189 232NOC0213-Computer and information systems managers 41 0 41 0 80 121NOC0631-Restaurant and food service managers 37 0 37 0 20 57Top 10 Total 617 0 617 2 11,721 12,340Other 1,007 24 1,031 6 29,870 30,907Total 1,624 24 1,648 8 41,591 43,247
*Includes candidates with other additional point types (for example, Arranged Employment and Sibling in Canada), except those with Provincial Nomination additional points.
36
UnspecifiedOccupation
AE 50 pts and others*
AE 200 pts and others* Total AE AE and PN Without AE
Total candidates
NOC0213-Computer and information systems managers 0 0 0 0 2 2NOC2281-Computer network technicians 0 0 0 0 1 1NOC6311-Food service supervisors 0 0 0 0 1 1NOC3113-Dentists 0 0 0 0 1 1NOC1122-Professional occupations in business management consulting 0 0 0 0 1 1NOC0821-Managers in agriculture 1 0 1 0 0 1NOC1123-Professional occupations in advertising, marketing and public relations 0 0 0 0 1 1NOC3112-General practitioners and family physicians 0 0 0 0 1 1NOC1215-Supervisors, supply chain, tracking and scheduling co-ordination occupations 0 0 0 0 1 1NOC6222-Retail and wholesale buyers 0 0 0 0 1 1Top 10 Total 1 0 1 0 10 11Other 0 0 0 0 5 5Total 1 0 1 0 15 16
*Includes candidates with other additional point types (for example, Arranged Employment and Sibling in Canada), except those with Provincial Nomination additional points.
37
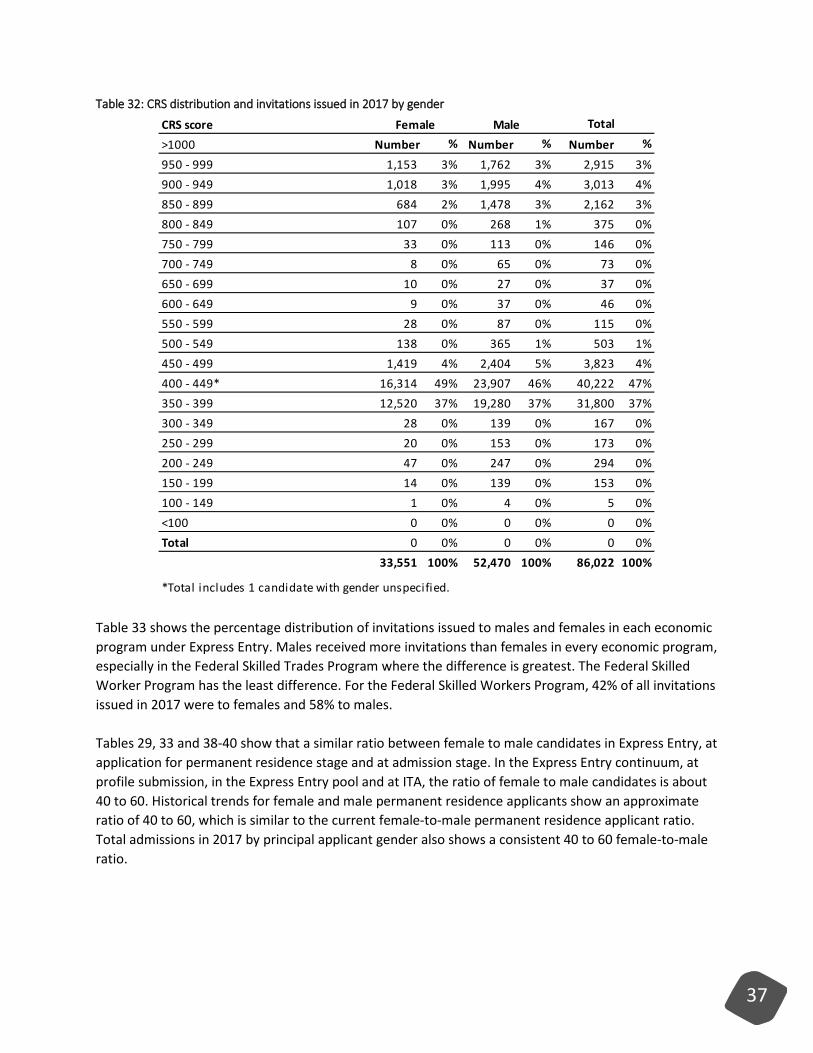
Table 32: CRS distribution and invitations issued in 2017 by gender
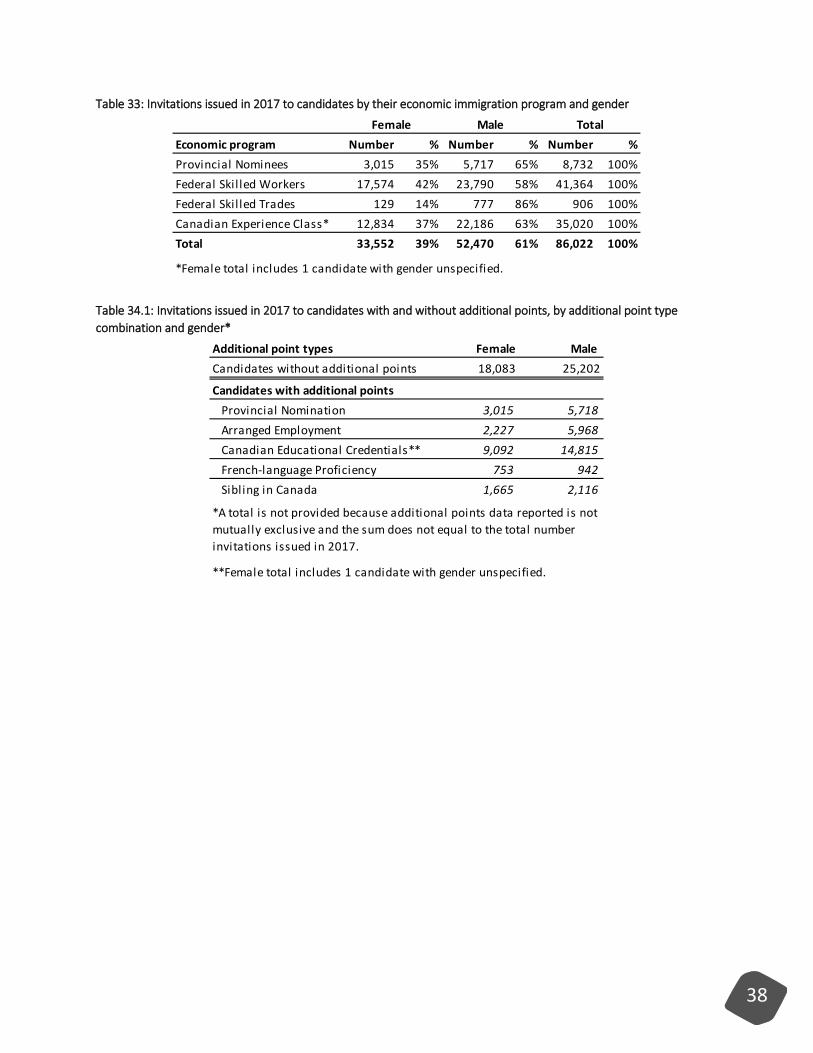
Table 33 shows the percentage distribution of invitations issued to males and females in each economic program under Express Entry. Males received more invitations than females in every economic program, especially in the Federal Skilled Trades Program where the difference is greatest. The Federal Skilled Worker Program has the least difference. For the Federal Skilled Workers Program, 42% of all invitations issued in 2017 were to females and 58% to males. Tables 29, 33 and 38-40 show that a similar ratio between female to male candidates in Express Entry, at application for permanent residence stage and at admission stage. In the Express Entry continuum, at profile submission, in the Express Entry pool and at ITA, the ratio of female to male candidates is about 40 to 60. Historical trends for female and male permanent residence applicants show an approximate ratio of 40 to 60, which is similar to the current female-to-male permanent residence applicant ratio. Total admissions in 2017 by principal applicant gender also shows a consistent 40 to 60 female-to-male ratio.
CRS score Total
>1000 Number % Number % Number %
950 - 999 1,153 3% 1,762 3% 2,915 3%900 - 949 1,018 3% 1,995 4% 3,013 4%850 - 899 684 2% 1,478 3% 2,162 3%800 - 849 107 0% 268 1% 375 0%750 - 799 33 0% 113 0% 146 0%700 - 749 8 0% 65 0% 73 0%650 - 699 10 0% 27 0% 37 0%600 - 649 9 0% 37 0% 46 0%550 - 599 28 0% 87 0% 115 0%500 - 549 138 0% 365 1% 503 1%450 - 499 1,419 4% 2,404 5% 3,823 4%400 - 449* 16,314 49% 23,907 46% 40,222 47%350 - 399 12,520 37% 19,280 37% 31,800 37%300 - 349 28 0% 139 0% 167 0%250 - 299 20 0% 153 0% 173 0%200 - 249 47 0% 247 0% 294 0%150 - 199 14 0% 139 0% 153 0%100 - 149 1 0% 4 0% 5 0%<100 0 0% 0 0% 0 0%Total 0 0% 0 0% 0 0%
33,551 100% 52,470 100% 86,022 100%
*Total includes 1 candidate with gender unspecified.
Female Male
38
Table 33: Invitations issued in 2017 to candidates by their economic immigration program and gender
Table 34.1: Invitations issued in 2017 to candidates with and without additional points, by additional point type combination and gender*
Economic program Number % Number % Number %Provincial Nominees 3,015 35% 5,717 65% 8,732 100%Federal Skil led Workers 17,574 42% 23,790 58% 41,364 100%Federal Skil led Trades 129 14% 777 86% 906 100%Canadian Experience Class* 12,834 37% 22,186 63% 35,020 100%Total 33,552 39% 52,470 61% 86,022 100%
*Female total includes 1 candidate with gender unspecified.
Female Male Total
Additional point types Female Male Candidates without additional points 18,083 25,202
Candidates with additional pointsProvincial Nomination 3,015 5,718Arranged Employment 2,227 5,968Canadian Educational Credentials** 9,092 14,815French-language Proficiency 753 942Sibling in Canada 1,665 2,116
**Female total includes 1 candidate with gender unspecified.
*A total is not provided because additional points data reported is not mutually exclusive and the sum does not equal to the total number invitations issued in 2017.
39
Table 34.2: Invitations issued in 2017 to candidates with and without additional points, by additional point type combination and gender*
TotalAdditional point types Number % Number % Candidates
Candidates without additional points 18,083 54% 25,202 58% 43,285
One additional point type 14,219 42% 25,046 58% 39,265Provincial Nomination 3,015 21% 5,718 23% 8,733Arranged Employment 1,447 10% 4,450 18% 5,897Canadian Educational Credentials** 8,024 56% 12,937 52% 20,961Sibling in Canada 1,129 8% 1,242 5% 2,371French-language Proficiency 604 4% 699 3% 1,303
Two additional point types 1,217 4% 2,155 5% 3,372Arranged Employment and Canadian Educational Credentials 654 54% 1,226 57% 1,880Arranged Employment and Sibling in Canada 70 6% 148 7% 218Canadian Educational Credentials and Sibling in Canada 351 29% 555 26% 906French-language Proficiency and Sibling in Canada 83 7% 107 5% 190Arranged Employment and French-language Proficiency 29 2% 87 4% 116Canadian Educational Credentials and French-language Proficiency 30 2% 32 1% 62
Three additional point types 33 0% 65 0% 98Arranged Employment, Canadian Educational Credentials and Sibling in Canada 26 79% 50 77% 76Arranged Employment, Sibling in Canada and French-language Proficiency 0 0% 2 3% 2Arranged Employment, French-language Proficiency and Canadian Educational Credentials 1 3% 3 5% 4Canadian Educational Credentials, French-language Proficiency and Sibling in Canada 6 18% 10 15% 16
Four additional point types 0 0% 2 0% 2Arranged Employment, Canadian Educational Credentials, French-language Proficiency and Sibling in Canada 0 0% 2 0% 2
Total 33,552 100% 52,470 100% 86,022
*All data reported is mutually exclusive.**Female total includes 1 candidate with gender unspecified.
Female Male
40
Table 35: Invitations issued in 2017 to candidates by their country of residence and gender
Table 36: Invitations issued in 2017 to candidates by their country of citizenship and gender
Country of residence Number % Rank Country of residence Number % RankCanada* 15,463 46% 1 Canada 26,695 51% 1India 6,074 18% 2 India 8,875 17% 2United States 1,956 6% 3 United States 3,857 7% 3Nigeria 1,545 5% 4 United Arab Emirates 1,421 3% 4United Arab Emirates 1,040 3% 5 Nigeria 1,378 3% 5United Kingdom 669 2% 6 United Kingdom 897 2% 6China 573 2% 7 Pakistan 897 2% 7Pakistan 451 1% 8 Saudi Arabia 611 1% 8South Africa, Republic of 436 1% 9 South Africa, Republic of 457 1% 9Philippines 304 1% 10 Singapore 443 1% 10
Singapore 264 1% 11 China 438 1% 11Saudi Arabia 189 1% 17 Philippines 201 0% 20Other 4,588 14% Other 6,300 12%Total 33,552 100% Total 52,470 100%
*Female total includes 1 candidate with gender unspecified.
Invitations issued to female candidates Invitations issued to male candidates
Country of residence Number % Rank Country of residence Number % RankIndia* 11,892 35% 1 India 24,417 47% 1China 4,062 12% 2 China 3,403 6% 2Nigeria 2,443 7% 3 Nigeria 2,688 5% 3United Kingdom 1,011 3% 4 Pakistan 2,445 5% 4Pakistan 895 3% 5 United Kingdom 1,643 3% 5United States 807 2% 6 United States 1,215 2% 6Philippines 666 2% 7 Brazil 1,034 2% 7Korea, South 660 2% 8 Iran 864 2% 8Brazil 635 2% 9 Egypt 848 2% 9France 531 2% 10 Bangladesh 777 1% 10
Iran 520 2% 11 France 717 1% 13Egypt 372 1% 17 Philippines 481 1% 16Bangladesh 287 1% 21 Korea, South 591 1% 14Other 8,771 26% Other 11,347 22%Total 33,552 100% Total 52,470 100%
*Female total includes 1 candidate with gender unspecified.
Invitations issued to female candidates Invitations issued to male candidates
41
Table 37.1: Invitations issued in 2017 to female candidates by their occupation
Table 37.2: Invitations issued in 2017 to male candidates by their occupation
Occupation Number % RankNOC1241-Administrative assistants 1,484 4% 1NOC2171-Information systems analysts and consultants 1,369 4% 2NOC1111-Financial auditors and accountants 1,174 3% 3NOC1123-Professional occupations in advertising, marketing and public relations 1,171 3% 4NOC2173-Software engineers and designers 1,143 3% 5NOC1221-Administrative officers 955 3% 6NOC4011-University professors and lecturers 874 3% 7NOC2174-Computer programmers and interactive media developers 721 2% 8NOC0124-Advertising, marketing and public relations managers 687 2% 9NOC1311-Accounting technicians and bookkeepers 685 2% 10
NOC1112-Financial and investment analysts 612 2% 11NOC1122-Professional occupations in business management consulting 591 2% 13NOC0213-Computer and information systems managers 283 1% 37NOC2133-Electrical and electronics engineers 215 1% 48NOC2132-Mechanical engineers 79 0% 87Other* 21,509 64%Total 33,552 100%
*Female total includes 1 candidate with gender unspecified.
Occupation Number % RankNOC2171-Information systems analysts and consultants 3,845 7% 1NOC2173-Software engineers and designers 3,641 7% 2NOC2174-Computer programmers and interactive media developers 2,760 5% 3NOC2132-Mechanical engineers 1,286 2% 4NOC1111-Financial auditors and accountants 1,212 2% 5NOC1112-Financial and investment analysts 1,172 2% 6NOC0213-Computer and information systems managers 1,076 2% 7NOC1122-Professional occupations in business management consulting 1,027 2% 8NOC2133-Electrical and electronics engineers 1,015 2% 9NOC4011-University professors and lecturers 955 2% 10
NOC0124-Advertising, marketing and public relations managers 807 2% 12NOC1123-Professional occupations in advertising, marketing and public relations 715 1% 17NOC1241-Administrative assistants 487 1% 34NOC1221-Administrative officers 449 1% 35NOC1311-Accounting technicians and bookkeepers 416 1% 38Other 31,607 60%Total 52,470 100%
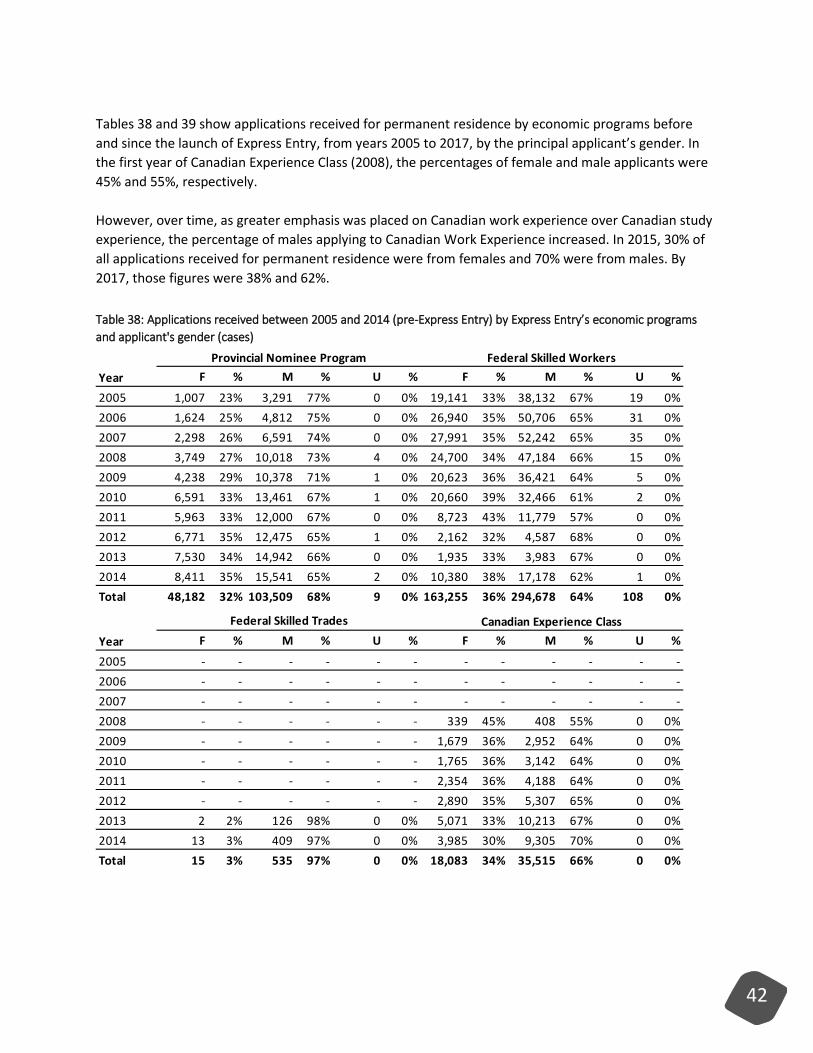
42
Tables 38 and 39 show applications received for permanent residence by economic programs before and since the launch of Express Entry, from years 2005 to 2017, by the principal applicant’s gender. In the first year of Canadian Experience Class (2008), the percentages of female and male applicants were 45% and 55%, respectively. However, over time, as greater emphasis was placed on Canadian work experience over Canadian study experience, the percentage of males applying to Canadian Work Experience increased. In 2015, 30% of all applications received for permanent residence were from females and 70% were from males. By 2017, those figures were 38% and 62%. Table 38: Applications received between 2005 and 2014 (pre-Express Entry) by Express Entry’s economic programs and applicant's gender (cases)
Year F % M % U % F % M % U %
2005 1,007 23% 3,291 77% 0 0% 19,141 33% 38,132 67% 19 0%2006 1,624 25% 4,812 75% 0 0% 26,940 35% 50,706 65% 31 0%2007 2,298 26% 6,591 74% 0 0% 27,991 35% 52,242 65% 35 0%2008 3,749 27% 10,018 73% 4 0% 24,700 34% 47,184 66% 15 0%2009 4,238 29% 10,378 71% 1 0% 20,623 36% 36,421 64% 5 0%2010 6,591 33% 13,461 67% 1 0% 20,660 39% 32,466 61% 2 0%2011 5,963 33% 12,000 67% 0 0% 8,723 43% 11,779 57% 0 0%2012 6,771 35% 12,475 65% 1 0% 2,162 32% 4,587 68% 0 0%2013 7,530 34% 14,942 66% 0 0% 1,935 33% 3,983 67% 0 0%2014 8,411 35% 15,541 65% 2 0% 10,380 38% 17,178 62% 1 0%Total 48,182 32% 103,509 68% 9 0% 163,255 36% 294,678 64% 108 0%
Year F % M % U % F % M % U %
2005 - - - - - - - - - - - -2006 - - - - - - - - - - - -2007 - - - - - - - - - - - -2008 - - - - - - 339 45% 408 55% 0 0%2009 - - - - - - 1,679 36% 2,952 64% 0 0%2010 - - - - - - 1,765 36% 3,142 64% 0 0%2011 - - - - - - 2,354 36% 4,188 64% 0 0%2012 - - - - - - 2,890 35% 5,307 65% 0 0%2013 2 2% 126 98% 0 0% 5,071 33% 10,213 67% 0 0%2014 13 3% 409 97% 0 0% 3,985 30% 9,305 70% 0 0%Total 15 3% 535 97% 0 0% 18,083 34% 35,515 66% 0 0%
Provincial Nominee Program Federal Skilled Workers
Federal Skilled Trades Canadian Experience Class
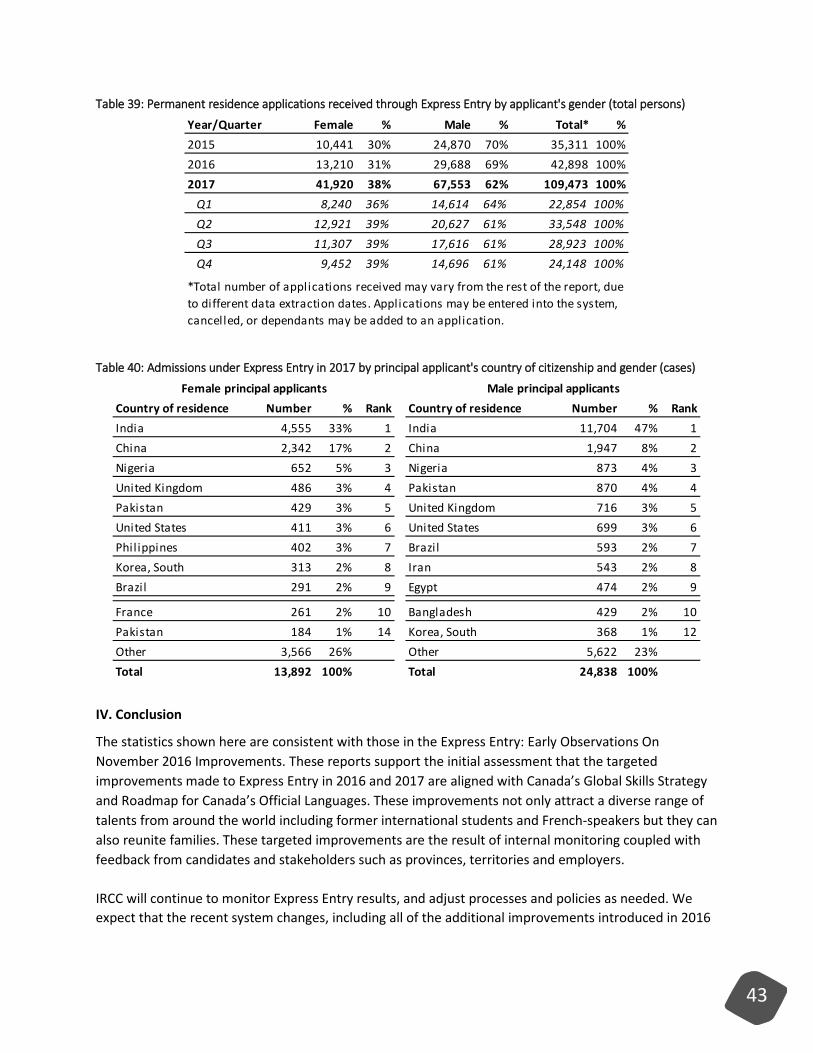
43
Table 39: Permanent residence applications received through Express Entry by applicant's gender (total persons)
Table 40: Admissions under Express Entry in 2017 by principal applicant's country of citizenship and gender (cases)
IV. Conclusion
The statistics shown here are consistent with those in the Express Entry: Early Observations On November 2016 Improvements. These reports support the initial assessment that the targeted improvements made to Express Entry in 2016 and 2017 are aligned with Canada’s Global Skills Strategy and Roadmap for Canada’s Official Languages. These improvements not only attract a diverse range of talents from around the world including former international students and French-speakers but they can also reunite families. These targeted improvements are the result of internal monitoring coupled with feedback from candidates and stakeholders such as provinces, territories and employers. IRCC will continue to monitor Express Entry results, and adjust processes and policies as needed. We expect that the recent system changes, including all of the additional improvements introduced in 2016
Year/Quarter Female % Male % Total* %2015 10,441 30% 24,870 70% 35,311 100%2016 13,210 31% 29,688 69% 42,898 100%2017 41,920 38% 67,553 62% 109,473 100%
Q1 8,240 36% 14,614 64% 22,854 100%Q2 12,921 39% 20,627 61% 33,548 100%Q3 11,307 39% 17,616 61% 28,923 100%Q4 9,452 39% 14,696 61% 24,148 100%
*Total number of applications received may vary from the rest of the report, due to different data extraction dates. Applications may be entered into the system, cancelled, or dependants may be added to an application.
Country of residence Number % Rank Country of residence Number % RankIndia 4,555 33% 1 India 11,704 47% 1China 2,342 17% 2 China 1,947 8% 2Nigeria 652 5% 3 Nigeria 873 4% 3United Kingdom 486 3% 4 Pakistan 870 4% 4Pakistan 429 3% 5 United Kingdom 716 3% 5United States 411 3% 6 United States 699 3% 6Philippines 402 3% 7 Brazil 593 2% 7Korea, South 313 2% 8 Iran 543 2% 8Brazil 291 2% 9 Egypt 474 2% 9
France 261 2% 10 Bangladesh 429 2% 10Pakistan 184 1% 14 Korea, South 368 1% 12Other 3,566 26% Other 5,622 23%Total 13,892 100% Total 24,838 100%
Female principal applicants Male principal applicants

44
and 2017, will result in Canada welcoming more immigrants with the diversified skills and experience needed to grow our economy by fulfilling regional and labour market needs.