Exposure and Effects of Microplastics on Wildlife · Exposure and Effects of Microplastics on...
39
Exposure and Effects of Microplastics on Wildlife A review of existing data Anna Kärrman, Christine Schönlau, Magnus Engwall 2016-03-01 Funded by Swedish Environmental Protection Agency 1
Transcript of Exposure and Effects of Microplastics on Wildlife · Exposure and Effects of Microplastics on...
Exposure and Effects of Microplastics on Wildlife A review of existing data
Anna Kärrman, Christine Schönlau, Magnus Engwall
2016-03-01
Funded by Swedish Environmental Protection Agency
1

Report written by Anna Kärrman, Christine Schönlau, and Magnus Engwall at MTM Research Centre and
published in DiVA (www.diva-portal.org)
MTM Research Centre School of Science and Technology Örebro University, Sweden Front page pictures: Anna Kärrman
2
CONTENT
Summary ..................................................................................................................................................... 4
Sammanfattning .......................................................................................................................................... 6
Abbreviations .............................................................................................................................................. 8
1. Background ......................................................................................................................................... 9
2. Occurrence of microplastics in the environment ............................................................................. 11
2.1 Marine waters ................................................................................................................................. 12
2.2 Fresh waters .................................................................................................................................... 13
2.3 Vertical distribution ........................................................................................................................ 15
2.4 Size distribution .............................................................................................................................. 16
2.5 Polymer type ................................................................................................................................... 17
2.6 Models predicting plastic occurrence and distribution .................................................................. 18
2.7 Terrestrial environment .................................................................................................................. 18
3. Effects ............................................................................................................................................... 19
3.1 Ingestion, distribution and excretion .............................................................................................. 19
3.2 Biomagnification ............................................................................................................................. 21
3.3 Sorption and desorption of pollutants ............................................................................................ 23
3.4 Additives and monomers ................................................................................................................ 24
3.5 Organisms at risk ............................................................................................................................. 26
3.6 Humans ........................................................................................................................................... 28
4. Knowledge gaps and recommendations .......................................................................................... 29
Literature................................................................................................................................................... 31
3
Summary
The Swedish Environmental Protection Agency has been assigned by the government to identify important sources of microplastics and to suggest actions in order to reduce the production and emissions to the environment. This report was compiled by Örebro University to serve as a review of the current knowledge of exposure and effects of microplastics on wildlife. Scientific articles and reports were reviewed in December 2015-February 2016 and a selection of the information found is compiled here to give an overview of knowledge and knowledge gaps regarding effects of microplastics.
Microplastics are defined as particles less than 5 mm and larger than 100 nm however to fully understand the effect of microplastics in the environment it is important to include plastic particles of all sizes. Plastic will persist for long time but can be weathered and fragment to smaller particles. The complete degradation of plastic polymers into natural elements can take centuries or even millennia. The time spent at the water surface, the fragmentation rate, the potential of biofouling, time spent in the water column and ultimate fate of particles of different sizes and polymer types are all important factors for effect based management. Global distribution of microplastics in the aquatic environment has been shown, from densely populated areas to remote areas in the Arctic and Antarctica. Global assessments of floating plastics in the world´s oceans span from 14 400 tons to 268 940 tons and the uncertainty reflects current knowledge gaps in occurrence, distribution, and environmental fate of plastics. Surface water counts range from hundreds of particles per m3 water down to 1e10-6 particles/m3. Microplastics are also found in the water column, sediments, and in fresh water systems. Lakes and rivers have received less attention compared to marine waters but there are indications that they are equally contaminated by microplastics. Sediments are often considered as the final sink of plastics and up to 2000 particles/m2 in deep oceanic sediment has been reported. The nature and location of sources as well as environmental conditions are influencing the occurrence in the environment and areas of plastic particle emissions, transport, and accumulation in the aquatic environment have been identified. So far there is little knowledge of the occurrence and fate of microplastics in the terrestrial environment.
Potential hazards of plastics are many which contribute to the issue´s complex nature. Physical stress can originate from macro- and microplastics by entanglement or intake, the latter causing suffocation, gastrointestinal obstruction, or even starvation. Microplastics are readily ingested by numerous organisms and can transfer between trophic levels. Intake and accumulation of macro- and microplastics have been demonstrated for a broad range of filter organisms, invertebrates, fish, mammals, and birds. It has also shown to enter the food chain relevant for humans. Translocation from the gastrointestinal tract has been shown for µm and nm particles. Effects from ingestion of plastics have been seen for zooplankton (affected photosynthesis), bivalves (affected filtering, decreased larval development), marine worms (oxidative stress), crustaceas (decreased fecundity), fish (liver toxicity), and birds (decreased body condition). Biological effects can be caused by leaching of additive chemicals, added to the polymer to give certain properties, or monomers and by-products remaining in the product from the manufacture process. Besides carrying additive chemicals and monomers, chemicals from the surrounding environment, like persistent organic pollutants, polyaromatic compounds, and metals, can sorb to the particle surface or partition into the bulk polymer. Polymers like polyvinylchloride (PVC) and polyurethane (PU) contains and potentially leach hazardous additives and monomers of concern. Polyethylene (PE) on
4

the other hand sorb and release chemical pollutants to a higher degree than other polymer types. Plastics can also carry invasive species to new environments and act as a hard substrate for organisms.
Ecological consequences and effects on population levels are not well studied and reported in the scientific literature. The high ratio of plastic fragments in the world’s oceans relative to zooplankton is only one of the ecological concerns. There is a need for dose-response relationships and adverse effect concentrations to fully assess the risk with microplastics for wildlife and humans. Occurrence and fate of synthetic fibers, formation of nanoplastics, and the occurrence and fate of microplastics in the terrestrial environment are identified as areas where research regarding effects are needed.
5

Sammanfattning Naturvårdsverket har fått i uppdrag av regeringen att identifiera viktiga källor till mikroplaster och föreslå åtgärder för att minska produktionen och utsläppen till miljön. Denna rapport har sammanställts av Örebro universitet och syftar till att ge en överblick av nuvarande kunskap om exponering och effekter av mikroplaster på djurliv. Vetenskapliga artiklar och rapporter granskades mellan december 2015 och februari 2016 och ett urval av den information som återfanns sammanställs här för att ge en översikt över kunskap och kunskapsluckor när det gäller effekter av mikroplaster.
Definitionen av mikroplaster är vanligtvis partiklar som är mindre än 5 mm och större än 100 nm men för att förstå effekten av mikroplaster i miljön är det viktigt att även inkludera plastpartiklar av andra storlekar. Plast är långlivad och kommer bestå under lång tid men kan vittra sönder till mindre fragment. Fullständig nedbrytning av plastpolymerer i naturliga miljöer kan ta århundraden eller till och med årtusenden. Viktiga faktorer för att förstå problemet och genomföra de åtgärder som krävs för att reducera miljöpåverkan är tiden som mikroplaster spenderar vid vattenytan, hur fort fragmentering och nedbrytning sker, potential påväxt av biologiskt material, tiden som spenderas i vattenkolumnen och vad som slutligen händer med partiklar av olika storlekar och polymertyper. Undersökningar visar på en global spridning av mikroplaster i vattenmiljön, från tätbefolkade områden till avlägsna områden i Arktis och Antarktis. Uppskattningar av mängden flytande plast i världshaven sprider från 14 400 ton till 268 940 ton och osäkerheten återspeglar de aktuella kunskapsluckor gällande förekomst och spridning i miljön. I ytvatten finns allt från hundratals partiklar per m3 vatten ner till 1e10-6 partiklar/m3. Mikroplaster återfinns också på djupet, i sediment och i sötvattensystem. Sjöar och floder har fått liten uppmärksamhet jämfört med havsmiljön men kan vara lika förorenade av mikroplaster. Sediment betraktas som den mest betydelsefulla sänkan för mikroplaster och upp till 2000 partiklar/m2 har rapporterats från djuphavssediment. Förekomst av mikroplaster i miljön påverkas av vilka utsläppskällorna är, vart de befinner sig samt hur miljöförhållanden styr spridningen. Tydliga ackumuleringszoner där partiklar samlas har identifierats. Hittills finns den mesta kunskapen om mikroplasters förekomst och spridning i vattenmiljöer och det saknas data från land och spridning från t.ex. avloppsslam.
Möjliga risker med plast är många vilket bidrar till problemets komplexa natur. Fysisk stress kan vara ett resultat av att djurliv trasslar in sig eller äter makro- och mikroplaster, den senare kan orsaka kvävning, inflammationer, eller till och med svält. Mikroplaster kan lätt intas av många organismer och kan överföras mellan trofiska nivåer. Intag och ackumulering av makro- och mikroplaster har påvisats för ett brett spektrum av filterorganismer, ryggradslösa djur, fiskar, däggdjur och fåglar. Mikroplaster har också hittats i föda som är relevant för människor. Partiklar i mikro- och nanostorlek har visat sig tas upp från mag- och tarmkanalen. Effekter från intag av plast har setts för djurplankton (påverkan på fotosyntesen), musslor (påverkan på filtrering, minskade larvutveckling), marina maskar (oxidativ stress), kräftdjur (minskad reproduktion), fisk (levertoxicitet) och fåglar (nedsatt allmäntillstånd). Biologiska effekter kan orsakas av att tillsatskemikalier som används för att ge vissa egenskaper till plasten läcker ut och tas upp av organismen. På samma sätt kan monomerer och biprodukter som finns kvar i produkten från framställningsprocessen läcka ut. Förutom tillsatskemikalier och monomerer kan även kemikalier från den omgivande miljön, t.ex. långlivade organiska föroreningar, binda till partikelytan eller kapslas in i bulkpolymeren. Polymerer som polyvinylklorid (PVC) och polyuretan (PU) innehåller och kan potentiellt
6

läcka farliga tillsatser och monomerer. Polyeten (PE) har visat sig binda och släppa ifrån sig kemiska föroreningar från omgivande miljön i högre grad än andra polymertyper. Plast kan också föra med sig främmande arter till nya miljöer och fungera som ett hårt underlag för organismer.
Ekologiska konsekvenser och effekter på populationsnivå är inte tillräckligt studerade och rapporterade i den vetenskapliga litteraturen. Den höga andelen av plastfragment i världshaven i förhållande till djurplankton är troligtvis bara ett av de ekologiska problemen. Sambandet mellan dos och respons samt vid vilka koncentrationer negativa effekter uppstår saknas och behövs för att kunna bedöma riskerna med mikroplaster för djur och människor. Områden där det finns kunskapsluckor är t.ex. förekomst och spridning av syntetiska fibrer, bildningsprocessen av nanopartiklar, och förekomst och effekter av mikroplaster i landmiljön.
7

Abbreviations ABS acrylonitrile butadiene styrene
BFRs brominated flame retardants
Bio-Teq bioanalytical Toxic Equivalency
DDT dichlorodiphenyltrichloroethane
FTIR fourier transform infrared
HBCD hexabromocyclododecane
HD high density
LD low density
mm millimeter, 10-3 meter
NIR near Infrared
nm nanometer, 10-9 meter
PA polyamide
PAHs polycyclic aromatic hydrocarbons
PBDEs polybrominated diphenyls
PBT persistent, bioaccumulating and toxic
PCBs poly chlorinated biphenyls
PE polyethylene
PES polyester
PET polyethylene terephthalate
PLA polyacetic acid
PMMA poly(methyl methacrylate)
POPs persistent organic pollutants
PP polypropylene
PS polystyrene
PTFE polyethylene terephthalate
PU polyurethane
PVC polyvinylchloride
TBBPA tetra-brominated bisphenol A
µm micrometer, 10-6 meter
UV Ultra violet
WWTPs waste water treatment plants
8
1. Background Accumulation of plastic waste in the oceans has become a pressing issue ever since the plastic mass production started in the 1950s. The annual global demand for plastic has increased exponentially and was in year 2011 245 million tons. The global production is dominated by mainly six types of polymers; polypropylene (PP), polyethylene (PE), polyvinyl chloride (PVC), polyethylene terephthalate (PET) polystyrene (PS), and polyurethane (PU) (Lithner et al. 2011). Packaging materials are the major application constituting nearly 40% of the European plastic market using mainly PE (low density and high density), PP and PET (PlasticsEurope 2015).
Thorough assessments of the amount of plastic that globally enters the environment are scarce. Leakage of plastics into the environment can come from production plastics (called virgin pellets), after-use products and landfilled plastic waste. The plastic waste generated by 192 coastal countries in 2010 was calculated to be 275 million tons out of which 2-5% were assumed to be mismanaged thus ending up in the oceans (Jambeck et al. 2015). While emission is the starting point of the problem, the underlying cause of environmental effects is the slow degradation of plastic polymers in the environment. During the long residence time plastic particles can travel long distances through wind and water transport. Plastic polymers that are lighter than water will float on the surface and become brittle as an effect of UV-radiation that starts a chain of photo-degradation inducing autocatalytic oxidation (Singh and Sharma 2008). Fragmentation of the brittle pieces is then governed by wave action, grinding and animal contact. Smaller fragments are formed and the increased surface area will increase biofouling until the particle´s density exceeds water and it will sink trough the water column (Lobelle and Cunliffe 2011; Ye and Andrady 1991).
The plastic particle can persist in its initial shape for many years depending on the polymer type, initial shape and form. There is presently no reliable method to determine the age of weathered fragments and the importance of variables like temperature, salinity, and biofouling on fragmentation rate needs more attention, especially regarding further fragmentation of old plastics. With decreasing particle size the process of fragmentation is expected to slow down resulting in an increasing amount of microparticles which in turn slowly will form nanoparticles (Gregory and Andrady 2003). Different definitions of microplastics exists, GESAMP defined microplastics with a size range between 1 nm to 5 mm (GESAMP 2015). However nanoparticles are defined as materials between 1 and 100 nm (ASTM 2012). The complete degradation of plastic polymers into natural elements can take centuries or even millennia (Barnes et al. 2009). Plastic particles of micrometer range from facial cleansers and synthetic fibers from e.g. clothes are released to the environment since wastewater treatment plants do not fully retain small particles (Magnusson and Wahlberg 2014).
Despite the lack of standardized methods to assess number and amounts of plastics in the environment it is clear that microplastics is a growing potential threat. Results from different studies indicate that the amount of microplastics are increasing in several oceans but there are also inconclusive data pointing on more stable abundance of plastic accumulation (Barnes et al. 2009; Goldstein et al. 2012). At the same time the micrometer fraction of pollutants seems to be increasing as well as the geographical distribution.
The toxic effects are still not well characterized and the potential hazards of plastics are many which contribute to the issue´s complex nature. Physical stress can originate from macro- and microplastics by
9
entanglement or intake, the latter causing suffocation, gastrointestinal obstruction, or even starvation (Lusher 2015). Intake of macro- and microplastics have been demonstrated for a broad range of filter organisms, invertebrates, fish, mammals, and birds (Lusher 2015). Plastics usually contain additive chemicals, giving the product certain properties, which can cause biological effects in the host organism (Lithner et al. 2009). Monomers used to synthesize the polymer and by-products can potentially also be released from plastics. Besides carrying additive chemicals and monomers, chemicals from the surrounding environment, like persistent organic pollutants, polyaromatic compounds, and metals, can sorb to the particle surface or partition into the bulk polymer (Teuten et al. 2007). Plastics can also carry invasive species to new environments and act as a hard substrate for organisms (Barnes et al. 2009; Cózar et al. 2014).
Size, shape and abundance of the polymer can influence uptake and thus the effects. Fragmentation rate is not only depending on the access to UV-radiation and other environmental factors, but also the polymer type and presence of additives. Antioxidants and UV light absorbers are added to polymers, especially for outdoor applications, in order to slow down discoloration and impairment from heat and UV-exposure (Lithner et al. 2011). Additives, residual monomers, by-products and solvents are all low molecular chemicals that can leach out from the polymer to air, water, and organisms.
The surface area available for biofouling and sorption of pollutants differs between polymer types. Effects from sorbed chemicals have been demonstrated in for example fish and worms thus proving the capability of microplastics acting as vector for pollutants (Rochman et al. 2013c; Teuten et al. 2007).
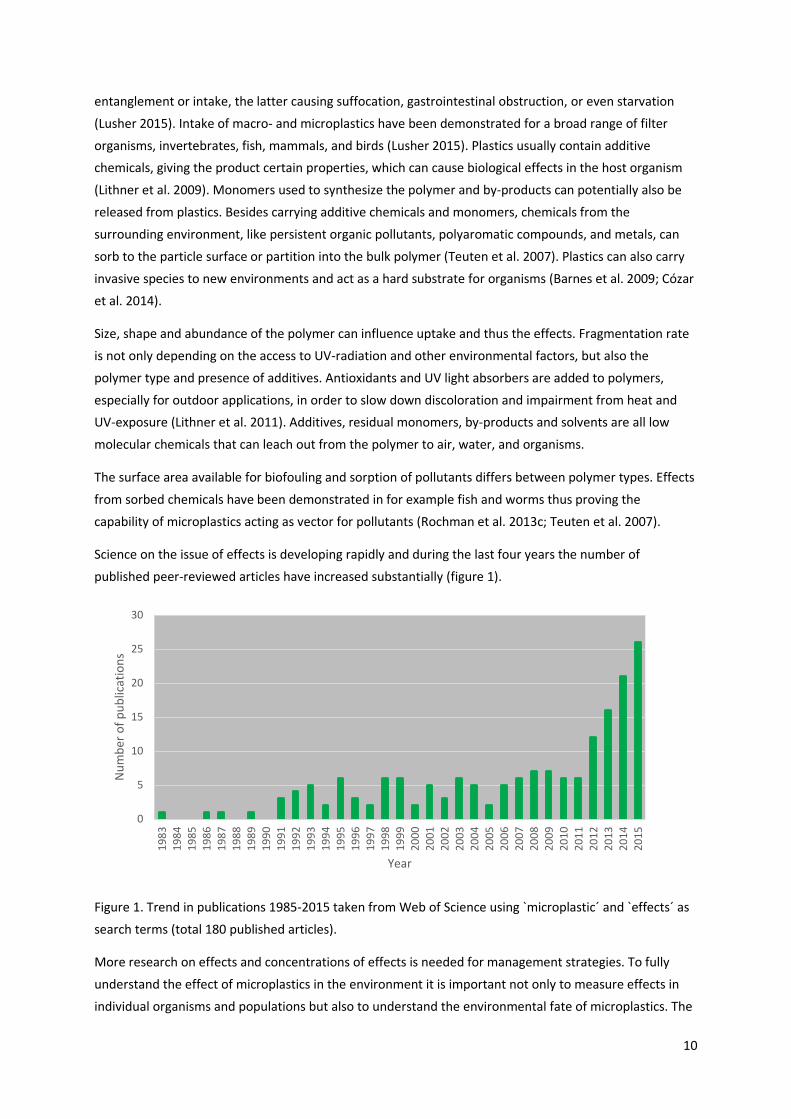
Science on the issue of effects is developing rapidly and during the last four years the number of published peer-reviewed articles have increased substantially (figure 1).
Figure 1. Trend in publications 1985-2015 taken from Web of Science using `microplastic´ and `effects´ as search terms (total 180 published articles).
More research on effects and concentrations of effects is needed for management strategies. To fully understand the effect of microplastics in the environment it is important not only to measure effects in individual organisms and populations but also to understand the environmental fate of microplastics. The
0
5
10
15
20
25
30
1983
1984
1985
1986
1987
1988
1989
1990
1991
1992
1993
1994
1995
1996
1997
1998
1999
2000
2001
2002
2003
2004
2005
2006
2007
2008
2009
2010
2011
2012
2013
2014
2015
Num
ber o
f pub
licat
ions
Year
10

time spent at the water surface, the fragmentation and biofouling rate, time spent in the water column and ultimate fate of particles of different sizes and polymer types are all important factors for effect based management. Knowledge of occurrence and accumulation rate of plastics and polymer types in different environmental compartments are thus also needed.
2. Occurrence of microplastics in the environment Plastic particles have been detected in numerous sites around the world in costal as well as more remote offshore areas (Doyle et al. 2011; Eriksen et al. 2013c; Hidalgo-Ruz et al. 2012; Ivar do Sul et al. 2014b), even in deep sea sediments (Fischer et al. 2015; Van Cauwenberghe et al. 2013). The nature and location of sources as well as environmental conditions are influencing the occurrence in the environment. Sources including mismanaged plastic waste on land or at sea, virgin pellets, leakage from transport of goods, weathering and wear of plastic goods, fishing equipment, and waste water effluents all contribute to macro- and microplastics in the environment. To fully assess the risks of microplastics it is important to consider the ultimate fate of particles and the time spent in different compartments (figure 2). The buoyance of plastic polymers differs, PE (HD and LD) and PP are floating on a water surface, PS has approximately the same density as water while PVC and PET have a higher density than water. Several other variables, that are more or less studied, are important to consider for the occurrence and effects of microplastics in different environmental compartments including:
• Circulation and accumulation zones (global and regional)
• Closed-in oceans, water exchange, and predominant currents
• Influence of hot-spots and proximity to populated areas
• Movement within the water column
• Influence by organisms including uptake
• Change of the buoyance (biofouling)
• Fragmentation rate (size distribution)
• Degradation rate (persistence)
Size is an important factor for distribution, dispersal and not least biological effects. Larger particles are capable of being transported in water longer distances than smaller particles as shown by models of distribution of micro- and macro particles (Lebreton et al. 2012). Smaller particles, especially fibers, can be subjected to air transport. The total atmospheric fallout in Paris was average 118 particles/day/m2 with a composition of 90% fibers (Dris et al. 2015). Small particles are easier taken up in the food web however the residence time before resuspension via feces in organisms is not well studied. Formation processes of microplastics by fragmentation on land, in sea and sediments are not very well studied and the importance of for example additive chemicals, presence of sunlight and mechanical impact are not fully known.
Occurrence in water is measured by several techniques including towing with nets, filtering many thousands of litres of water through common 300 µm mesh, or pumping water through filters, commonly 1-100 litres through 10 µm or larger pore filters. Surface sampling is dominating and it should be noted that it can cause underestimations of the plastic particle counts if the wind conditions drive particles downward due to surface layer mixing (Kukulka et al. 2012). Sediments and sand are usually sieved. Biota are usually checked for objects in their stomach content. Analysis of the composition of macro- and
11

microplastics to around 10 µm is performed by spectroscopic methods, like Raman, Near Infrared (NIR), and Fourier Transform Infrared (FTIR). Still there are uncontrolled variables affecting the results and this hampers comparison between studies. Range of sampling equipment, different size extraction, post-treatments to separate plastic polymers from natural particles, and not least report metrics makes comparisons and synthesis of data challenging. Different units to measure for example surface water concentrations are sometimes not interconvertible (m-2 and m-3, number of particles and weight). In addition there are also variables identified that contribute to uncertainties in reported concentrations. Some variables that need to be addressed in the future is weather conditions during sampling, size effects of aggregation of microplastics with naturally occurring particles, and particles difficult to sample (i.e. particles with marginal buoyancy) and detect (i.e. dark colors). The development of reliable and efficient protocols is still ongoing.
Figure 2. Overview of the important processes for transport and fate of macro- and microplastics at sea
2.1 MARINE WATERS Floating litter consisting mainly of plastic was first reported from the northern hemisphere already in the 1960s. Since then plastic litter has been discovered in waters globally with coverage increasing for every year. Areas of plastic particle emissions, transport, and accumulation have been identified. Five major accumulation zones are described in each of the five world oceans; the Atlantic (north and south), the Pacific (north and south), and the Indian Ocean (Eriksen et al. 2013c; Law et al. 2010). A compilation of more than a decade´s study of floating plastics in the Eastern Pacific Ocean highlights that a large variability in the location of the accumulation zones and the abundance of microplastics exists (Law et al. 2014). Regional and smaller accumulation zones are formed due to currents, winds, water stratification, and by bays and gulfs (Hinojosa and Thiel 2009; Reisser et al. 2013; Ryan 2013). Consequently the occurrence of microplastics can appear patchy, and low particle counts are found in migration areas where wildlife is supposedly less affected compared to accumulation zones. Attempts to assess the
12
magnitude on a global scale have been performed. For instance Eriksen et al. (Eriksen et al. 2014) estimated floating plastics globally to 268 940 tons while Cózar and colleagues (Cózar et al. 2014) estimated the global load in surface waters of the open ocean to 14 400 tons. A third estimate of the accumulated plastics in surface waters in 2014 range from 93 000-236 000 tonnes (12-51 trillion particles) (van Sebille et al. 2015). Largest uncertainties are for low concentration areas where more sampling data are needed. The three different model estimations show values far less than estimated inputs to the marine environment (Jambeck et al. 2015), the van Sebille model predicts worldwide occurrence on ocean surfaces in the order of 1% of the annual input of plastics from land-based sources.
Occurrence of microplastic is generally reported in weights or counts of particles, and in two dimensions or three dimensions, usually the sampling area covered (km-2) or the water volume measured (m-3). Most published studies are using a plankton net with mesh size of around 300 µm. Measurement studies have been reviewed with an attempt to recalculate results to the same, comparable unit by Lusher (Lusher 2015) which have been used here for comparison reasons. Figure 3 demonstrates occurrence of microplastics in marine and fresh waters from selected studies using approximately the same sampling mesh size and the same report unit.
Studies have shown microplastic abundance ranging from 279 particles/m3 to 1-10 particles/m3 in the North Pacific central gyre and Santa Monica Bay, California (Desforges et al. 2014; Lusher et al. 2014; Moore et al. 2001; Moore et al. 2002). Several other reports from subtropical north Pacific, South Pacific, Bering Sea, and from the Japanese and Australian coast show less than 1 to five orders of magnitude lower particle counts than the above mentioned densities (Doyle et al. 2011; Eriksen et al. 2013c; Reisser et al. 2013; Yamashita and Tanimura 2007). Studies in the Atlantic Ocean show similar results, 2.46 particles (m-3) offshore Ireland (Lusher et al. 2014), 0.27 in the English channel (Cole et al. 2014), 4 e-2 – 2e-4 particles m-3 in the North Atlantic Ocean (Law et al. 2010; Thompson et al. 2004), coastal areas outside South America 0.03 particles m-3 (Ivar do Sul et al. 2014b), the Caribbean sea several orders of magnitude less (Law et al. 2010). In Mediterranean waters particle counts ranging between 0.012-0.27 particles m-3 have been reported (Collignon et al. 2012; de Lucia et al. 2014). Measurements in the Indian Ocean are few however one transect was included in the global measurement by Eriksen and colleagues (Eriksen et al. 2014) and it was estimated that the Indian Ocean has a greater particle count than the South Atlantic and South Pacific combined. Norén and colleagues have shown results from the Swedish west coast that far exceeds previously reported data from other marine waters (Norén 2007). However this is likely due to different sampling methods and mesh sizes used. More comparable with previous studies is results of microplastics from the West Coast of Sweden (0.01-0.14 particles/m-3,(Norén 2007)), and the coast of Finland (0-0.74 particles/m-3) (Magnusson 2014). Average counts of a three week transect sampling through the Baltic Sea was 0.27 particles m-3 (Kärrman et al. 2016a).
An increasing trend in microplastic concentrations over time has been observed in the North Pacific Ocean (Goldstein et al. 2012). It has been shown however that the distribution is not static and trends are not uniformly demonstrating increasing densities worldwide (Barnes et al. 2009).
2.2 FRESH WATERS Freshwater ecosystems have received less attention than open ocean water. This is an important study area considering that it is likely that a large part of the plastic litter from land is introduced into the
13

marine environment through lakes and rivers. Reports have demonstrated the presence of microplastic particles in freshwater systems of lakes and rivers in Europe, Asia and North America (Eriksen et al. 2013a; C. M. Free et al. 2014; Imhof et al. 2013; Lechner et al. 2014). Reported abundances are for example 48,146 particles/km2 surface water in Lake Geneva (Faure et al. 2012) and 43,157 particles/km2 in the Laurentian Great Lakes (Eriksen et al. 2013b). Microplastics in a remote lake in Mongolia has also been reported with an average density of 20,264 particles/km² (C.M. Free et al. 2014). Abundance is governed by proximity to densely populated areas, wind and water circulation. Measurements in Swedish lakes (Kärrman et al. 2016b; Landbecker 2012) show similar particle counts compared to marine waters (figure 3).
Figure 3. Abundance (number of pieces/m3 water, logarithmic scale) of microplastic in ocean and fresh water. Sampling volumes and net mesh sizes vary but the latter is around 300 µm.
Large differences between lakes are reported with a strong influence of point-sources and converging currents. Generally, lake samples reported points to a domination by smaller particles and where polymer type has been determined it is mainly PP and PE. Possible sources for microplastics in lakes are personal care products and fibers from waste water treatment plants (Eriksen et al. 2013b). Microbeads similar to ingredients in consumer products were found in high abundance (up to 105 particles/m2) in sediment from St. Lawrence River, Canada (Castaneda et al. 2014). More than 90% of identified plastics were fibers in Lake Geneva lakeshore sediments (Faure et al. 2012). That large rivers might act as a major pathway for land-based plastic litter is reflected by the amount of plastic input via the Danube into the Black Sea which was estimated to be 4.2 tonnes per day, the substantial part being industrial plastics (pellets, flakes, spheres) (Lechner et al. 2014). Run-off is one potential source of microplastics and it has been shown that
14

river water contained more small size plastics after a rain event, 16 times and 3 times higher in Los Angeles river and San Gabriel river, respectively, resulting in 2.3 billion particles introduced into the environment over a period of 3 days (Moore et al. 2011).
2.3 VERTICAL DISTRIBUTION A few measurements including both surface and sub-surface waters indicate a similar range in particle counts (Figure 3). Finding neutral buoyance and mixing forces determines the particle´s vertical distribution. Size and shape can also influence the rising and sinking velocities (Ballent et al. 2013). Studies have shown that sinking rates can vary between 10-150 meters/day (McDonnell and Buesseler 2010). Particles can travel great distances horizontally by the force of currents and there is a considerable lag time spent in the water column before ending up at the sea bed. Microplastic concentrations have been shown to decrease exponentially from the air-seawater surface down to 5 m below (Reisser et al. 2015) however the distribution is size-dependent. Modelled distributions show that PE and PP particles ≥ 1 mm are at the surface but the 100 µm and 10 µm particles are influenced by turbulence and 50% were found in the upper 24 m and 33 m, respectively. Storm events will affect the mixing at the surface and to the middle of the water column meaning that biological effects are not limited to surface waters. Kukulka and colleagues (Kukulka et al. 2012) published a model for vertical distribution of buoyant plastic as an effect of wind. Even moderate wind speed > 5m/s is enough to significantly underestimate surface measurements. One example is the assessment of sea surface plastic concentration in waters around Australia based on surface trawls that increase by 100% from 4256.4 pieces km-2 to 8966.3 pieces km-2 after taken vertical wind mixing into consideration (Reisser et al. 2013).
An important factor for the buoyancy and thus vertical distribution of plastic particles is biofouling. Formation of biofilm has been studied showing that the physicochemical properties of the polymer changes (Lobelle and Cunliffe 2011). Biofilms developed rapidly on PE plastic bags submerged in waters off Plymouth, UK, making the plastic less hydrophobic and changing the buoyance. Polymers with a positive buoyance can sink below the surface after biofouling (Ye and Andrady 1991) and biofilms can also facilitate increased attachment of specific invertebrates (Zardus et al. 2008). Rapid defouling has also been shown (Ye and Andrady 1991) meaning that submerged plastic can reappear at the water surface.
The ultimate fate of microplastics are often considered to be burial in sediments but capsuling in Arctic ice glacier has also been suggested as an important sink (Trevail et al. 2015). Microplastics have been reported in sediments worldwide in oceans, lakes, beaches (van Cauwenberghe et al. 2015) even in deep sea sediments (Van Cauwenberghe et al. 2013). Abundance range from more than 1000 particles per meter beach to up to 2000 particles /m2 deep oceanic sediment. Different ways to report occurrence, for example per distance, weight or volume of sediment, dry or wet, make comparisons difficult. It has been suggested that amounts of microplastics in sediment are positively associated with the amount of organic carbon, indicating an increased accumulation in depositional areas (Strand and Tairova 2016). This is believed to be connected to biofouling and aggregation. Increasing amounts of microplastics in sediment cores along the Belgian coast reflected the increase of global plastic production the last 20 years (Claessens et al. 2011). The absence of sunlight, oxygen and microbial communities in sediments results in virtually no biodegradation of polymers, thus sediments can function as continues sources (Watters et al. 2010).
15

2.4 SIZE DISTRIBUTION It is assumed that most small microplastics in the environment are fragments from the breakdown of larger plastic items with the exception of fibers, for example from clothes, and industrial virgin pellets. Photo-degradation is one of the primary damage factors and the polymer type will influence the disintegration rate since different polymers absorb radiations of different wavelengths (Singh and Sharma 2008). A linear carbon chain only will make the polymer more resistance to microorganisms, and unsaturation in the carbon chain makes them more susceptible to oxidation. Generally, introducing functional groups leads to a higher disintegration rate. High molecular polymers degrade slower than lower molecular weight polymers (Singh and Sharma 2008). High humidity and temperature can accelerate the light-induced degradation. The result is degradants with lower molecular weight. Collected beach plastics from Hawaii were examined for effects of degradation and heavily oxidized surfaces were seen (Cooper and Corcoran 2010). It was suggested that while chemical degradation begins at sea, it is mechanical processes producing fractures and grooves where oxidative processes preferentially occur. Plastics of PE seemed to be more heavily affected by oxidation compared to PP in that study.
Considering the longtime of usage and leakage of plastics it is therefore expected that the smallest microplastics are more abundant than larger microplastics. Although increasing trends of microplastics in ocean waters have been reported, studies are not uniformly demonstrating increasing amounts in the marine environment (Barnes et al. 2009). Abundance of 20 µm microplastics in archived plankton samples taken at 10 m depth showed a significant increase in amounts from 1960s/1970s to levels in 1980s and from there a level off in the 1990s sample (Thompson et al. 2004). Small plastic pieces were also reported to increase in the North Pacific Ocean between 1976 and 1985 (Day and Shaw 1987). Global assessments of microplastics in surface waters also recognized a missing fraction of plastics with size less than a 1 millimeter (Cózar et al. 2014) and 4.5 millimeter (Eriksen et al. 2014), respectively. Abundance increased with decreasing size in a study in the Northeast Atlantic Ocean until the size fraction < 1.25 mm (Lusher et al. 2014). This surface loss can be due to ingestion by organisms, sinking due to biofouling, rapid degradation to nano-size particles, or other unknown processes. The sampling technique and subsurface vertical processes can also be explanations for the disappearing size fraction since smaller size particles, although of neutral buoyance, have been shown to residence at greater depths (Reisser et al. 2015).
Approximately 40% of identified microplastic samples transecting the North Atlantic subtropical gyre was fibers (543 particles and 340 fibers) with a majority of fibers and particles being less than 900 and 40 µm, respectively (Enders et al. 2015). There was a steady increase in abundance with decreasing size, down to 100 µm, compared to 4.5 mm reported by Eriksen (Eriksen et al. 2014) and 1 mm reported by Cozár (Cózar et al. 2014). Low density particles (e.g. PP, PE) in the Atlantic open ocean were significantly larger in size compared to high density particles, for example polyesters and polyamide. The same trend was not seen for fibers. In waters around Australia predominately small, secondary microplastic fragments with median length 2.8 mm were found using surface trawl sampling (Reisser et al. 2013). Abundance steadily increased with decreasing plastic size with <2.4 mm being the smallest fraction. The smallest fraction contained predominately “hard plastic” however the larger fractions contained mostly “soft” plastics.
Reported size distribution and amounts can also be depending on the sampling method. Comparing two trawl with different mesh size on the Seine River (France) resulted in 3-106 particles/m3 using 80 µm mesh compared to 0.28 to 0.45 particles/m3 using 330 µm mesh (Dris et al. 2015).
16

2.5 POLYMER TYPE Microplastics found in the water column and larger items of plastic found in the environment often consists of PP, PE or PS due to their buoyance and usage in packaging materials however these polymers are also detected in sediments (Claessens et al. 2011), probably as a result of biofouling and changes in physicochemical properties due to degradation. Composition in remote areas can also differ due to transport issues. Characterization of polymer type can be performed by different spectroscopic methods (Song et al. 2015) and even by analyzing indicator chemicals by gas chromatography coupled to mass spectrometry (Nilsen et al. 2014). Visual inspection of microplastics cannot determine the polymer types therefore some studies classify particles based on shape such as fragments, pellets, granules, fibers and compressed foam (Styrofoam).
Open water analysis from the European coastline north of the English channel to the Azores and then further south-west through the North Atlantic subtropical gyre using 10 µm filters showed that 42% of the microplastics were PE, 6% PP, 4% PS, 11% PA, 3% PU, 1.8% PVC, and 6% PES. PMMA was also found (0.4%) and 26.3% was unidentified polymers. The composition profile differed from south to north and from west to east. The fraction of PE increased going from the south- and north edges of the accumulation zone into the middle. PE and PP increased in composition percentage from European coastal areas to the Atlantic open ocean (Enders et al. 2015). Transect measurements in the Baltic sea resulted in over 80% PE and PP polymers (with PE being the predominating polyolefin), 3% PS, and 11% unidentified polymers (Kärrman et al. 2016a).
Arctic ice cores contained microplastic of different composition compared to reported surface water. Instead of domination of PE/PP the ice cores consisted of 54% Rayon, 21% polyester, 16% polyamide, 3% polypropylene, 2% polyethylene, 2% polystyrene, and 2% acrylic (Trevail et al. 2015).
In the North Pacific central gyre the most frequently sampled types of identifiable plastic were thin films, polypropylene/monofilament line and unidentified plastic, most of which were miscellaneous fragments (Moore et al. 2001). 891 visual surveys worldwide in the five accumulation zones revealed that foamed polystyrene items were the most frequently observed macroplastics (1116 out of 4291 items) using 300 µm mesh (Eriksen et al. 2014).
Plastic polymer types in wildlife have also been reported. Plastics found in Antarctic fur seal scats were determined to be of 93% PE, 4% PP, 2% poly(1-Cl-1-butenylene) polychloroprene, 0.5% melamine-urea (phenol) (formaldehyde) resin, and 0.5% cellulose (rope fiber) (Eriksson and Burton 2003). Ingested plastic in albatross was divided into categories and distribution was on average (Laysan/Black-footed) 4.8/3.8 particles of fragments, 1/16.7 line, 0.4/0.1 pellets, and 0.3/0.1 foam (Gray et al. 2012). Another study characterized ingested plastics in Laysan Albatross in the North Pacific yielded the proportions 68.4% PP, 20.5% PVC, 8.5% PET, 6.8% PS, 0.8% HDPE (Nilsen et al. 2014).
Two studies report the change in plastic type with time. The amount of plastic did not change in short-tailed shearwaters in the Bearing Sea from the 1970s until 2001 but a clear shift in plastic type was seen (Vlietstra and Parga 2002). Plastic type was divided into industrial pellets, user plastic, and others (vinyl, rubber, string) and the proportion of industrial pellets decreased from 72.5%-54.6% in the 1970s to 32.9% in 1997-2001. User plastic increased from 25.6% to 63.9%. The same trend was seen for amounts of industrial plastic in stomachs of Northern Fulmars which significantly decreased 1979 – 2007. Consumer
17
plastics increased but not significantly throughout all age groups of birds. The data also suggested that fisheries and shipping play a major role in the pollution of the North Sea area (van Franeker et al. 2011).
2.6 MODELS PREDICTING PLASTIC OCCURRENCE AND DISTRIBUTION Models of distribution of debris are mainly directed towards ocean surface transport. The dynamics of distribution of debris in marine oceans has been addressed by using data from drifting buoys (Maximenko et al. 2012). Models based on the drifters reveal the formation of the five major accumulation zones after 10 years assuming an initial homogenous state. Another model based on the Global Drifter Program including seasonal cycle to study the distribution from coastal regions worldwide predicts six major accumulation zones (van Sebille et al. 2012). The additional zone is in the Barents Sea. An inter-ocean exchange is predicted as well, indicating that significant amounts of the debris released outside of the North Atlantic will end up in the North Pacific, on a multi-millennial timescale. The distribution of microplastics around an Archipelago of the Equatorial Atlantic showed that microplastics might be retained close to the Archipelago with an outward gradient of mean plastic particle densities (Ivar do Sul et al. 2014a).
Models describing how wind speed influence the microplastic position in the water column have been presented (Kukulka et al. 2012). However, not enough process data describing rate of fragmentation and how different particle sizes are affected by biofouling is available in order to understand and predict the distribution and fate during the entire plastic life time.
2.7 TERRESTRIAL ENVIRONMENT The majority of plastic litter entering the aquatic system is considered to originate from land based sources. This includes recreational activities on shores, inappropriate or illegal dumping of domestic and industrial litter, plastic manufacturing facilities, transportation as well as sewage treatment and surface runoff of street litter (GESAMP 2010). Plastics are also present in most waste, which can be categorized as municipal, industrial, agricultural, construction and demolition waste. Plastic waste generated by 192 coastal countries worldwide in 2010 was estimated to 275 million tons out of which 2-5% were assumed to be mismanaged and ending up in the oceans (Jambeck et al. 2015). Fate of plastic waste in the terrestrial environment is probably not different but not well studied or analyzed.
Sewage sludge appears to be an important sink of microplastics. A study on microliter in influent and effluent water from three Swedish waste water treatment plants (WWTP) revealed that microlitter could be retained to 70-100% by the WWTPs, but still showing significant amounts in effluent waters. Especially small particles < 300 µm and > 20 µm could be retained to a much lesser extent than particles > 300 µm (Magnusson and Wahlberg 2014). The same findings, with an efficient reduction but still a substantial amount released, have also been reported for other sites (Helcom 2014).The occurrence of fibers in sewage sludge was further confirmed by the finding of >250 % more microplastic at historical sewage disposal-sites not used for more than a decade compared to reference site (Browne et al. 2011).
Using sewage sludge for agricultural fertilization can therefore spread microplastics, predominately fibers, in the terrestrial environment. The transport and fate of fibers spread on land is unclear. Possible effects from using plastic mulch to suppress weeds in crop production are also unclear, and accumulation in soil is a potential concern.
18

The degradation kinetics of plastic polymers on land differs from that in fresh or saline water. Although not extensively studied, it is expected that degradation on land is faster than in water and the difference has been attributed to temperature and that polymers floating on water surfaces are more shielded from light by shading and fouling (Andrady et al. 1993; O´Brine and Thompson 2010). The availability to sunlight is important, PE and PS films buried under soil degraded much slower compared to exposed films (Kijchavengkul et al. 2010; Williams and Simmons 1996) and the microbial cultures and soil type also affects the degradation rate.
3. Effects Numerous aquatic species are reported to be exposed to microplastic via ingestion, entanglement and so called “ghost fishing”. Over 180 species of animals including turtles, marine mammals, fish and birds were first reported to ingest plastic particles (Laist 1997). A more recent study state that 663 species are affected by ingestion and entanglement by marine debris of which over 80% is attributed to plastic debris. Out of this fraction 11% was microplastic, 24% rope and netting, 20% plastic fragments, 17% packaging, 16% other fishing debris (CBD 2012). Impacts of entanglement include drowning, reduced ability to catch food or escape predators, and wounds. Ingestion can block the ingestion tract, cause suffocation, and damage stomach linings. The occurrence of plastic litter in the marine environment poses not only a physical threat to organisms via entanglement and ingestion, it might also pose a toxicological threat to wildlife. Plastics, especially in the marine environment, might also act as a vector for nonindigenous species and therefore represents a threat to domestic species (Barnes et al. 2009; Cózar et al. 2014). Plastic particles in the environment can also carry chemicals of two different origins; chemicals that were added or used during manufacturing (additives, monomers, by-products) and environmental pollutants sorbed to the plastic surface.
The hazards with microplastics in the environment are:
• physical effects
• bioaccumulation
• desorption and toxicity of pollutants
• leaching and toxicity of additives and monomers
• transport of invasive species
3.1 INGESTION, DISTRIBUTION AND EXCRETION It has already been demonstrated that microplastics exposure for biota occurs in aquatic environments but studies are lacking for the terrestrial environment.
The small size of microplastic particles makes them available for ingestion to a wide variety of biota in benthic and pelagic habitats. Plastic particles have been found in all trophic levels starting from zooplanktonic species such as copepods and salps to invertebrates like polychaetes and bivalves, as well as vertebrates like fish, birds, and marine mammals (Ivar do Sul and Costa 2014; Wright et al. 2013b). A summary of selected studies demonstrating effects from plastic ingestion for different species is given in table 1. Ingestion in field studies have been shown worldwide including in the Arctic and Antarctica (Eriksson and Burton 2003; Provencher et al. 2010). Organisms might feed directly on microplastic by mistaking it for food or selectively feed on microplastic instead of prey (Lusher 2015). Exposure has also
19
been shown to occur through the gills of the shore crab (Carcinus maenas) by ventilation from the water column (Watts et al. 2014).
Ingestion of microplastics in the environment is likely a result of particle concentration, feeding mode and the encounter rate in a patchy environment (Setälä et al. 2016). Out of 504 fish of 10 different species 37% had plastic in the gastrointestinal tract (average 1.9 pieces/fish) (Lusher et al. 2013). Northern fulmar Fulmarus glacialis had an average amount of 35 plastic pieces of weighing 0.31 g in their stomachs (van Franeker et al. 2011). A distinct geographical distribution with the highest level in the English-French Channel area, decreasing northwards and demonstrating the lowest occurrence for the North Sea area around the Scottish Islands was also reported. Plastic ingestion by albatrosses were higher outside South America compared to off the east coast of South Africa (Ryan et al. 2016). Fur seal scats sampled in the 1990s between Australia and Antarctica contained plastic fragments but fur seal scats from the southeast Indian and central South Atlantic Oceans did not contain plastics. Species specific ingestion of plastic was demonstrated in a small scale mesocosm study to mimic natural habitat (Setälä et al. 2016). A range of animals (bivalves, free swimming crustaceans and benthic, deposit-feeding animals) in a coastal community of the northern Baltic Sea were exposed to relatively low concentrations of 10 µm PS microbeads. The beads were ingested by all animals in all experimental concentrations (5, 50 and 250 beads mL-1). Bivalves (Mytilus trossulus, Macoma balthica) contained significantly higher amounts of beads compared with the other groups. Free-swimming crustaceans ingested more beads compared with the benthic animals that were feeding only on the sediment surface.
Some effects have been linked to ingested plastics in field studies. A study on 120 Norwegian lobsters (Nephrops norvegicus) in the Clyde Sea demonstrated that 83% of the animals had plastics, mostly fibers, in their stomachs (Murray and Cowie 2011). No significant differences were observed between male and female species, but a difference of ingested plastic litter was observed in relation to the dorsal exoskeleton (carapace) softness which is an indicator of the moult phase. Twentyfour percent of Nephrobs with a jelly carapace were observed to have no plastic in their stomachs compared to 17% and 11% in soft and hard carapace species. The Nephrobs fishery represents the most valuable fishery in Scotland and therefore such a high abundance of plastic present in this species is of concern for the health of the stock. Most of the plastic particles found in the Norwegian lobster was observed to originate from fishing gear.
Numerous studies investigate the presence of plastics in the gastrointestinal tract. There are evidence for translocation to tissues but it is not extensively studied. Microplastic spheres of 0.5 µm have been shown to translocate to the haemolymph and tissues of crab (Farrell and Nelson 2013). There are multiple laboratory studies with blue mussels on the uptake of different plastic polymers and different size ranges into the gut of the organism and even a translocation into the circulatory system was reported for polystyrene microspheres of 3 and 10 µm (Bouwmeester et al. 2015). Translocation from the gut into the circulatory system has also been shown for mussels (Browne et al. 2008). Uptake of plastic microparticles into the lymphatic system has been shown for rodents causing effects like cellular damage and thrombosis (Hussain et al. 2001). The pore size of cell membranes only allow nanosize particles to enter. Oxidative stress and lysosomal perturbations were effects after intra-cellular uptake of nanoparticles by bivalve species (Canesi et al. 2012) but effects of nanosize plastic polymers have not been reported except for a few articles. One study found that nanoparticles of polystyrene could affect feeding, behavior and
20

physiology of larvae of the brine shrimp (Artemia franciscana) (Bergami et al. 2016). It is however difficult to estimate the relevance of the nanoparticle concentrations in that study, since no field measurements of aquatic concentrations of nanoparticles are available.
Residence time in organisms has been evaluated under laboratory conditions. Particle size and shape influence time between ingestion and excretion. Smaller particles have a longer residence time before excretion (Browne et al. 2008). Residence times vary between species but have not been fully studied. Studies indicating residence time report over 48 days in mussels (Browne et al. 2008), less than 21 days for crabs (Farrell and Nelson 2013), and over 24 h for lobsters (Murray and Cowie 2011).
3.2 BIOMAGNIFICATION Biomagnification of ingested or inspirated plastic particles is likely, for example ingestion of plastic by planktivorous fishes is known and they are preyed on by top predators (Boerger et al. 2010). Plastic particles in fur seal scats were hypothesized to first have been ingested by pelagic fish that in turn was consumed by the fur seals (Eriksson and Burton 2003). Biomagnification has been speculated to occur in several other studies, for example possible pathways for plastic in gut contents of Mediterranean Sea bluefin tuna, albacore and swordfish was reported to be ingestion of particles during the hunt (primary ingestion) as well as secondary ingestion (biomagnification) via the prey (Romeo et al. 2015). Plastic biomagnification has been shown under laboratory conditions. Trophic level transfer of microplastics was shown for crabs (Carcinus maenas) that were fed with mussels (Mytilus edulis) that were previously fed with 0.5 µm fluorescent polystyrene microspheres (Farrell and Nelson 2013). The number of microspheres in the haemolymph of the crabs were observed over a time period of 21 days, demonstrating the highest amount of microspheres after 24 h with almost a complete removal after 21 days. A second study with the same species also demonstrated trophic transfer from mussels to crabs (Watts et al. 2014). Herein mussels were fed with 8 – 10 µm fluorescently labeled polystyrene microspheres and microspheres could be retained in the foregut of the crabs up to 14 days after ingestion. Even transfer of microplastics from zooplankton to shrimps has been demonstrated (Setälä et al. 2014).
21

Table 1. Summary of selected studies showing effects of microplastics for different species.
PS, polystyrene. PVC, polyvinylchloride. PE, polyethylene. PP, polypropylene. HD, high density. LD, low density. Dw, dry weight.
Group Species Exposure route Exposure method and concentration
Particle type Effect Reference
Chlorophyta Scenedesmus ssp. Spiked water 1.6 – 40 mg/mL 20 nm PS Absorption, ROS increased, photosynthesis affected (Bhattacharya et al. 2010)
Polychaeta Lugworm (Arenicola marina)
Spiked sediment
5% of PVC pre-spiked with chemicals and clean PVC
PVC Uptake of chemicals from plastic, decreased ability to engineer sediments, > 30% more susceptible to oxidative stress by clean PVC (Browne et al.
2013)
Arenicola marina Spiked sediment
0 – 5 % by weight 130 µm unplasticized PVC Ingestion, reduced feeding, increased phagocytic activity, reduced available energy reserves, lower lipid reserves
(Wright et al. 2013a)
Arenicola marina Spiked sediment
0, 0.074, 0.74, 7.4% dw in sediment
400 – 1300 µm PS Ingestion, reduced feeding, weight loss (Besseling et al. 2013)
Bivalvia Blue musel (Mytilus edulis) Spiked water 0, 0.1, 0.2, 0.3 g/L 30 nm PS Ingestion, particles in pseudofaeces, reduced filtering (Wegner et al. 2012)
Mytilus edulis Spiked water 2.5 g/L 0 – 80 µm HDPE Retention in digestive tract, transfer to lymph system, strong inflammatory response
(von Moos et al. 2012)
Mytilus edulis Spiked water 0.51 g/L 3, 9.6 µm PS Ingestion, retention up to over 48 days, translocation to haemolymph (Browne et al. 2008)
Pacific oyster (Crassostrea gigas)
Spiked water 0.023 mg/L 2, 6 µm PS Increased filtration and assimilation, decreased oocyte number, diameter and sperm velocity, decreased larval yield and larval development of MP exposed parents, significant shift of energy allocation from reproduction to structural growth
(Sussarellu et al. 2016)
Crustacea Shore crab (Carcinus maenas)
Spiked mussels 50 µL of suspended 0.5 µm PS particles
0.5 µm PS Translocation into haemolymph and tissue of crabs (Farrell and Nelson 2013)
Carcinus maenas Spiked mussels Spiked water
1.5 x 10⁵ PS/g of mussel 9.4 x 10⁵ PS/L
8 – 10 µm PS Retention of particles up to 14 d in foregut; ingestion via gills and retention up to 21 d
(Watts et al. 2013)
Tigriopus japonicus Spiked water 5.25 x 10⁵ PS/mL 9.1 108 PS/mL 9.1 x 10¹¹ PS/mL
6 µm PS 0.5 µm PS 0.05 µm PS
Ingestion, egestion, mortality, decreased fecundity (Lee et al. 2013)
Chordata Common goby, juveniles (Pomatoschistos microps)
Spiked water 18.4, 184 µg/L 1 – 5 µm PE Modulation of bioavailability and biotransformation of pyrene, decreased energy in simultaneous exposure of PE and pyrene, reduced acetylcholinesterase (Lind et al.) activity,
(Oliveira et al. 2013)
Japanese medaka (Oryzias latipes)
Spiked food Ground up as 10% of diet
3 mm LDPE pre-exposed in marine environment
Liver toxicity, liver pathology, hepatic stress (Rochman et al. 2013c)
Oryzias latipes Spiked food Ground up as 10% of diet
3 mm virgin PE pellets and pre-exposed marine PE pellets were ground to < 0.5 mm
Decreased choriogenin expression (Chg H) in males exposed to marine plastic, vitellogenin and increased estrogen receptor alpha expression in females exposed to virgin and marine plastic
(Rochman et al. 2014a)
European Seabass larvae (Dicentrarchus labrax)
Spiked food 0.1 and 10 microbeads/g diet
10 – 45 µm PE Ingestion, egestion, slight impact on mortality rate only with highest concentration of PE, cytochrome-P450-1A1 expression significantly positive correlated to number of microbeads scored per larvae
(Mazurais et al. 2015)
22

3.3 SORPTION AND DESORPTION OF POLLUTANTS Several studies show that various anthropogenic environmental pollutants can be found, sorbed on different types of marine plastic debris (Andrady 2011; Teuten et al. 2009). Most of these substances are considered to be harmful to humans and wildlife. Plastics are currently associated with at least 78% of the priority pollutants and 61% of priority substances listed as toxic by the United States Environmental Protection Agency and European Union (Rochman et al. 2013a). They can act as mutagens, carcinogens and endocrine disruptors. These include hydrophobic pollutants such as polycyclic aromatic hydrocarbons (PAHs), poly chlorinated biphenyls (PCBs) and other persistent organic pollutants (POPs), and metals (Rochman et al. 2013b; Teuten et al. 2009). The International Pellet Watch project has with help of volunteers collected plastic pellets from beaches all around the world that are analyzed for sorbed pollutants. PE pellets showed to have PCB concentrations up to 600 ng/g pellet and dichlorodiphenyltrichloroethane (DDT) concentrations up to 300 ng/g (Ogata et al. 2009). Geographical distributions and amounts corresponded well with closeness to urban areas and with the results from the Mussel Watch project.
The rate of hydrophobic organic contaminant sorption and desorption are influenced by the sorbent properties, size, dissolved organic compounds in the water phase, pH, temperature and the sorbate properties itself. Salinity increased the sorption of PCB from water to micro PE and nano-PS (Velzeboer et al. 2014). Both PE and PS showed higher adsorption concentration of PCB congeners 118 and 126 compared to sediment. Sorption to nano-PS was 1-2 orders of magnitude stronger compared to micro-PE which illustrates the increased sorption capacity of smaller particles due to the increased surface area to weight. The large and hydrophobic surface of microplastics means that these particles can become heavily contaminated with waterborne pollutants, up to six orders of magnitude higher than the ambient seawater (Hirai et al. 2011; Mato et al. 2001).
Stronger sorption of PAHs to polyethylene and polyurethane foams compared to other polymers was observed in two different studies. Virgin plastics were deployed in San Diego Day for several months and then analyzed for PAHs. High density PE and low density PE together with PU sorbed significantly higher concentrations PAHs than PET, PP and PVC from the surrounding water. PP demonstrated ability to sorb an intermediate concentration compared to the other polymers (Rochman et al. 2013b; Rochman et al. 2013d). The same plastic deployed in San Diego Bay was further analyzed with respect to Ah-receptor activity which gives a selective response for dioxin-like chemicals. While the PAH concentrations increased with time, the Ah-receptor response decreased meaning that other chemicals that can interact with the receptor are present. The highest effect after nine months deployment was obtained for PE particles resulting in a Bio-Teq25 of ~300 pg/g (Schönlau et al. 2016). The second highest response was seen for PP followed by PVC and PET.
The desorption of contaminants from plastic was found to be greatly enhanced by the presence of organic matter and surfactants, which suggests that leaching of chemicals from plastic will increase under gastric conditions (Teuten et al. 2009). Reinforcing this hypothesis, digestive surfactants from deposit feeders have been shown to enhance desorption of contaminants including PCBs and PAHs (Ahrens et al. 2001). The potential for plastics to constitute an important vector for the uptake of hydrophobic contaminants in sediment-dwelling organisms was indicated by a study with the lugworm Arenicola marina where it was estimated that an addition of 1 ppm of phenanthrene contaminated PE pellets to sandy sediment would
23

result in an 80 percent increase of phenanthrene concentration in the tissue of the worm (Teuten et al. 2007).
Another laboratory study of desorption of four different organic pollutants from microplastic under simulated physiological conditions demonstrated a significantly higher desorption of pollutants under the simulation of gut surfactants and an even greater desorption under the simulation of physiological conditions of warm blooded organism (Bakir et al. 2014). It was observed that there is a possibility of a 30 times higher desorption rate of some compounds in warm blooded organisms compared to seawater, although desorption rates highly differ among polymer types and compounds. Phenanthrene sorbed to PE plastic was found to have the greatest potential of a transfer to organisms in this study.
Transfer of PBDEs from plastic to organisms, including fish, via ingestion has been demonstrated under laboratory conditions (Browne et al. 2013; Rochman et al. 2013c). A study of ingested plastic pieces and tissue concentrations of POPs in 76 Northern Fulmars showed that 82% of the birds had plastic pieces in their stomach. The data from a modelling approach of the relationship between plastic-derived POPs ingested by Northern Fulmars and tissue concentrations of POPs demonstrated that plastic contributed only to a very small extent to the total bioaccumulation of POPs in the birds and is rather negligible (Herzke et al. 2016). However, it is very difficult to estimate the residence time of the ingested plastic in the stomach of the birds and nothing is known about the load of contaminants on the plastic before ingestion and how much has been transferred from the plastic to tissue of the Northern Fulmar.
Lower chlorinated PCB congeners have been suggested as indicator chemicals of plastic-derived exposure to organisms. Lower chlorinated congeners are less abundant in fish tissue because of faster metabolism, whereas plastic concentrates PCB congeners from ambient seawater without the occurrence of metabolic processes (Teuten et al. 2009). In feeding experiments with chicks of streaked shearwater (Calonectris leucomelas) an uptake of lower chlorinated PCBs from contaminated PE pellets into the tissue of the chicks could be observed compared to a control group that was fed with the natural prey.
Metals can sorb to polymers and are also used as additive pigments. Metals have been detected on marine plastic debris, for example lead and chromium on beach PE plastics (Nakashima et al. 2011), usually in low concentrations however studies on transfer into organisms are lacking (Ashton et al. 2010). Metals sorbed to plastic surfaces are however likely to be relatively bioaccessible.
3.4 ADDITIVES AND MONOMERS Plastic polymers are made by polymerizing monomers into macromolecular chains. Additives such as stabilizers, flame retardants, pigments, and fillers are often supplemented to plastics during molding to give desired properties to consumer plastics (OECD 2004). Polymerization is however rarely complete and both residual monomers and additives can leach out from the plastic polymer to air, water, food, etc. A ranking based on the most hazardous monomers has been suggested and the polymers with the most toxic (carcinogenicity, mutagenicity, reproduction toxicity) monomers are PU flexible foam, polyacrylonitrile, plasticized PVC, rigid PVC, PU rigid foam, epoxy, modacrylic, acrylonitrile-butadiene-styrene terpolymer, styrene-acrylonitrile copolymer, high-impact PS, and polyoxymethylene copolymer (Lithner et al. 2011) (table 2). The least toxic monomers were found in for example PP, LDPE, and HDPE. PET obtained a low hazard ranking but >60% of the PET material is made of non-classified substances that could not be assessed. In the study additional polymers were mentioned containing monomers under
24

scrutiny for endocrine disrupting potential, including different forms of PS, unsaturated polyesters, and polycarbonate.
Leaching from consumer plastics to water has been demonstrated to occur and be toxic to fresh water organisms. Out of 32 products of PVC, PP, ABS, PTFE, PU, PS, and PE, nine products resulted in Daphnia Magna 48h EC50 of 5-80 g plastic material/L water. The products inducing effects were made of polycarbonate, PVC, and PU. No effect was seen for the remaining products at the highest dose 70-100 g/L (Lithner et al. 2009).
Consumer products were also tested using micro-crustacean Nitocra spinipes in a weathering study with PP, PS, PE, PVC, PET, Bio-PET, polyacetic acid (PLA), and bio-starch/polyester (Bejgarn et al. 2015). Products were grinded and exposed for 72h with artificial sunlight and brackish water from the Baltic Sea. Eight out of 21 products showed toxicity and 4 products, made of PU, PVC, PLA, and bio-starch/polyester, became more toxic after sunlight exposure. The three remaining products that showed toxicity for Nitocra spinipes and became less toxic after sunlight exposure were made of PP, HDPE, and one unknown polymer blend.
Additive chemicals incorporated into polymers are numerous and some of the most important from an environmental point of view are those with endocrine disruptive potential. They include bisphenol A, several phthalates, and epichlorohydrin (Lithner et al. 2011). Brominated flame retardants (BFRs) are also commonly used in a variety of plastics, such as electronics and polyurethane foams (de Wit 2002). Commercially important flame retardants are polybrominated diphenyls (PBDEs), hexabromocyclododecane (HBCD) and tetra-brominated bisphenol A (TBBPA). Heat stabilizers with lead also belongs to the most hazardous additives.
Additives bisphenol A, octylphenol and nonylphenol have been detected in marine plastic fragments (Teuten et al. 2009). Nonylphenol was also found in yellowtail (Seriola Lalandi) from the North Pacific Central Gyre and this was considered as evidence for plastic-mediated exposure since nonylphenol is not associated with long range transport (Gassel et al. 2013). Rochman et al. investigated the bioaccumulation of different hazardous chemicals in myctophid fish and the association with plastic litter in the South Atlantic Ocean (Rochman et al. 2014b). The fishes caught in sampling sites with a higher plastic density demonstrated a significantly higher concentration of higher brominated PBDEs (BDEs 183–209) in their tissues, but lower brominated BDEs were predominant in water samples. This indicates that higher brominated congeners originated from the plastic as an additive substance and where not sorbed from ambient seawater. Hence, tissue concentration of higher brominated PBDEs might be indicative of plastic pollution in the particular habitat (Rochman et al. 2014b). Another study suggested a transfer of plastic-derived PBDEs to the pelagic petrel short tailed shearwaters (Puffinus tenuirostris), especially the higher brominated congeners BDE209 and BDE183 (Tanaka et al. 2013). These PBDEs were detected in the bird’s abdominal adipose tissue and in plastic found in the bird’s stomachs. The time for an uptake of such contaminants to organism remains yet unclear. The same group also demonstrated a 15% leaching of PBDEs from pieces of plastic when seabirds´ stomach oil was used as leaching solution, which was 20 times more efficient leaching compared to sea water (Tanaka et al. 2015).
It has beeb suggested that marine plastic might be more important as a vector of phenolic additive-derived substances like nonylphenol and bisphenol-A to higher trophic level animals such as sea birds
25

(Teuten et al. 2009). In contrast to persistent pollutants such as PCBs and PBDEs, biomagnification of phenols through the food web is negligible due to their hydrophilic group that makes metabolization easier.
For many lower trophic level organisms the amount of contaminant uptake from ingested plastic will be determined by equilibrium partitioning with the surrounding environment, whereas for higher trophic level organisms the transfer is even more complex because of addition by biomagnification throughout the food web (Teuten et al. 2009). Hydrophobic and poorly metabolized pollutants, such as PCBs, can be amplified through the food chain and higher trophic level organism like seabirds can be exposed to high concentrations of such substances via their prey (e.g. fish). This means that plastic-derived chemicals adds to the chemicals introduced by the natural prey in regard to the contaminant burden of the predator. Therefore the contaminants present in the natural prey need to be considered in order to examine the potential threat of ingested plastic-derived contaminants (Teuten et al. 2009).
Comparing effects caused by different polymer types include leaching and toxicity of additives and monomers, and sorption, desorption and toxicity of pollutants. A ranking system for polymers have been suggested by Lithner and colleagues including hazardous monomers and additives (Lithner et al. 2011). PE is judged to be of low hazard rank but a few studies indicate that sorption and desorption kinetics for PE results in a potential high risk for transferring pollutants to organisms (table 2).
Table 2. Global production volume and hazard rank of polymers (Lithner et al. 2011) together with assessment of sorption capacity for POPs**.
PP PE PET PS PVC PU
Global production
volume (tonnes/year) [1] 45
39 (LD)
32 (HD) 33
13
>4* 37 9
Sorption and desorption
capacity for POPs** [2] [3]
Inter-
mediate High Yes Yes Yes Yes
Hazard rank for polymer
1=most hazardous
37=least hazardous [1]
37 36 36 35
34* 5-11 1-7
[1] Lithner 2011 [2] Rochman 2013b [3] Schönlau 2016 *Expandable PS ** PCBs, DDE, PAHs, and Ah-receptor response. PS, polystyrene. PVC, polyvinylchloride. PE, polyethylene. PP, polypropylene. HD, high density. LD, low density. PET, polyethylene terephthalate. PU, polyurethane.
3.5 ORGANISMS AT RISK Population effect studies and risk assessments of microplastics are lacking in the scientific literature. Several reports state that wildlife in the areas of the world´s largest accumulation zones are heavily affected, for example albatrosses in the North Pacific Ocean. Laysan Albatrosses ingest large quantities of mostly macroplastics but population effects are poorly understood. A correlation between ingested plastic load and decreased body condition in albatross chicks has been reported (Auman et al. 1997). The
26

occurrence of a high ratio of plastic fragments relative to zooplankton is also of concern and might cause population effects due to disturbed energy balance in zooplankton feeders (Lattin et al. 2004; Moore et al. 2002; Panti et al. 2015). Six times higher mass of plastic particles compared to plankton was found at the North Pacific gyre (Moore et al. 2001). There are most likely other organisms in areas heavily polluted by microplastics that are affected but have not been studied yet.
Few studies have addressed the risk for entire populations. One study reports a risk model for turtles using probability of debris ingestion as end point (Schuyler et al. 2016). The results show that up to 52% of sea turtles globally may have ingested debris. Olive ridley turtles are the most at-risk and the highest risk regions for turtle populations are the east coasts of the US, Australia and South Africa, and the East Indian Ocean, and Southeast Asia. Another potential oceanic impact from microplastics affecting an entire population is the enhanced oviposition in the endemic pelagic insect Halobates sericeus (Goldstein et al. 2012). An increase in microplastic abundance could be associated with increase in H. sericeus which was interpreted as a substantial expansion of hard substrate available to H. sericeus and other substrate-associated organisms.
So far it remains unclear if chemicals that are adsorbed to plastic or chemicals originating from plastic itself pose a considerable risk to wildlife via the uptake of these substances that are often classified as persistent, bioaccumulating and toxic (PBT).
Plastics can add significant effects to an already stressed ecosystem. Some of the species that are affected by plastic pollution in the marine environment are endangered, in fact 15 % of the species that are affected by entanglement and ingestion are on the IUCN Red List (CBD 2012). In particular the critically endangered Hawaiian monk seal Monachus schauinslandi, the endangered loggerhead turtle Caretta caretta, northern fur seal Callorhinus ursinus and white chinned petrel Procellaria aequinoctialis are of concern. Effects on the population level can be seen in species like the northern fulmar Fulmarus glacialis (van Franeker et al. 2011) and in lobster Nephrops norvegicus which are commercially important species (Murray and Cowie 2011). The northern fulmar represents a very good species for the ecological monitoring of marine litter due to its high abundance and wide distribution in the environment. Within OSPAR an Ecological Quality Objective (EcoQC) was developed on the basis of abundance of plastic litter in the stomachs of the birds (van Franeker et al. 2011). The Ecological Quality Objective is also used in the European Marine Strategy Framework Directive (MSFD) as an indicator for good environmental status. In this EcoQC acceptable ecological conditions are defined as:
“There should be less than 10% of northern fulmar having 0.1 g or more plastic in the stomach in samples of 50 – 100 beached fulmars from each of 5 different regions of the North Sea over a period of at least 5 years”.
In the time period 2003 – 2007 95% of 1295 fulmars sampled in the North Sea had plastic in their stomach and 58% of the birds exceeded the critical level of 0.1 g plastic in the stomach. The average amount of plastic in the stomachs was found to be 35 pieces weighing 0.31 g and higher loads of plastic were found in juvenile birds compared to adults.
27

3.6 HUMANS There is mounting evidence of the occurrence of plastic particles in marine organism that are part of the human food chain and this might also represent a potential threat to human health via biomagnification. A possible exposure pathway of humans to microplastic is represented by the diet, especially since there are studies available that demonstrate the presence of microplastic in commercially important fishes, shrimps and mussels (Devriese et al. 2015; Romeo et al. 2015; Van Cauwenberghe and Janssen 2014). Microscopic fibers ranging from 200-1500 µm have been found in mussels (average 3.5 fibres/10 g mussel) from Belgian stores which was in the same range as wild caught mussels in the same study (De Witte et al. 2014). Furthermore, synthetic fibers were reported in 63% of commercially important brown shrimp caught in the Southern North Sea and Channel area (Devriese et al. 2015). There are also studies that reported non-marine sources of microplastic in the food chain. For example nineteen honey samples were analyzed for colored fibres and fragments and colored material was found in all of the samples (Liebezeit and Liebezeit 2013). Fiber counts ranged from 40/kg up to 660/kg of honey and fragments ranged from 0 – 38/kg of honey. Sources were identified as introduction of particles during the processing of honey and/or particles were introduced by the bees into the hive. Honey samples originated mostly from Germany but also from France, Italy, Spain and Mexico. Five commercial sugars were analyzed as well and in all refined samples fibers (mean 217 ± 123/kg of sugar) and fragments (32 ± 7/kg of sugar) were found. Unrefined cane sugar was found to contain 560 fibers and 540 fragments per kilogram of honey. Furthermore, a total of 24 German beer brands was analyzed in a study for microplastic fibres, fragments and granular material (Liebezeit and Liebezeit 2014). Contamination was found in all samples with fiber counts ranging from 2 to 79 fibers /L, 12 – 109 fragments/L and 2 – 66 granules/L. As potential sources of the contamination natural and synthetic fibers in clothing that become airborne, materials that were used during the production process and bottles that might have been already contaminated or became contaminated during the cleaning process were pointed out. A study on 15 different table salts in China demonstrated the presence of microplastics in the samples (Yang et al. 2015). The amount of microplastics ranged from 550 – 681 particles/ kg in sea salts, 43 – 364 particles/kg in lake salts and 7 – 204 particles/kg in rock/well salts. Sea salts were found to be significantly higher contaminated with microplastics than other salts which underlines the contamination of marine products. In sea salts particles measuring less than 200 µm were detected to be the predominant type of microplastic, accounting for 55% of the particles with PET as the most abundant polymer type followed by PE and cellophane. Furthermore, a few studies have demonstrated the presence of microplastics in freshwater systems which might be a reason to raise concern about the presence of microplastic in drinking water since human population is highly dependent on freshwater systems for drinking water supply and food resources (Eerkes-Medrano et al. 2015). For example a study on beach sediments from Lake Garda, Italy, revealed an abundance of 1 108 ± 983 microplastic particles/m2 at the north shore of the lake used for drinking water supply (Imhof et al. 2013). Most of the plastic particles were identified as secondary microplastics, most likely originating from post-consumer products whereas detected fibers were found to originate from lakeside sources such as fishing gear and ropes.
The risk of microplastic transfer from the gastrointestinal tract in humans and other mammals to other tissues is real. Hussain and colleagues showed that PE particles could transfer from the gut to lymph and circulatory system in humans (Hussain et al. 2001). PS particles up to 240 nm was shown to be taken up by the placenta in a human ex vivo study (Wick et al. 2010). Nanosize particles of PS also decreased cell
28
contractility of human muscle cells and resulted in cellular damage of human blood vessels (Berntsen et al. 2010; Fröhlich et al. 2010). Further effects related to the plastic polymer itself is not described however knowledge can probably be extracted from the field of medical transplants using polymer materials of different types.
Another concern in regard of exposure of microplastics to humans are the plastic-associated chemicals (PACs) such as bisphenol A and phthalates. These compounds are well-known as endocrine disruptors and interfere with the hormone system. In one population-based human study levels of BPA and several phthalate metabolites were associated with lipid infiltration of the vascular wall and therefore suggesting that these chemicals play a role in atherosclerosis (Lind and Lind 2011). Furthermore BPA was reported to be positively associated with cardio vascular disease and prevalent myocardial infarction in a cross-sectional analysis of 1455 adults (Lind and Lind 2012).
4. Knowledge gaps and recommendations Adverse effect concentrations of various plastic types, particle forms and sizes are lacking for all species. It is known that plastics are ingested, that chemicals can sorb to particles and desorb in species, and that biological effects can occur. However, it is currently not possible to assess the risk of microplastics since the reported studies do not present dose-response relationships. The most prevalent polymer types found in the environment is PP, PE and different polymers in the shape of fibers and it is therefore recommended to prioritize these in effects studies. There are indications that smaller size particles are more hazardous; they can easier enter the food web, they have a larger capacity to sorb or incorporate pollutants, and larger particles will eventually fragment to smaller particles. The goals must therefore be to generate relevant dose response relationships and adverse effect concentrations with emphasis on exposure to the dominant size fractions and forms of PP, PE, and PS particles and synthetic fibers from clothes (polyesters, polyamide). Tests should be done on ecologically and economically relevant marine and freshwater species (invertebrates and fish) under standardized conditions. In such tests it is also critical to develop standardized methods for expressing plastics doses, taking particle form, polymer type and size distribution into consideration. Preferably, the doses should be expressed in the same way as in field measurements and it would be helpful if field surveys reports both abundance, weight, and type of plastics. This would greatly facilitate the possibility to perform actual risk assessments, putting critical effect levels in relation to actual exposure levels. The toxicity testing should be designed so effects of microplastics and effects of microplastics-associated chemicals can be distinguished. The testing would generate new knowledge regarding mechanisms of toxicity of microplastics and associated additives and adsorbed chemicals. Crucial in this research is the issue of bioavailability of plastics associated chemicals in living organism. Therefore, mechanisms that influence desorption in gastrointestinal tract of sorbed and incorporated chemicals, and the extent of chemical uptake should be studied. The relative role of organ accumulation of plastics-associated chemicals to the total load of chemicals from the surrounding environment including diet should also be quantified.
Besides effects testing, a standardized global qualitative and quantitative biomonitoring program focusing on temporal and geographical variation of occurrence of microplastics in freshwater and marine ecosystems on all trophic levels should be implemented. These data will be crucial in understanding point
29

sources, trends, microplastic dynamics regarding fate and behavior and development of potential risks and to guide plastics management strategies.
Another area of focus is studies on occurrence of microplastics in the terrestrial environment with emphasis on synthetic fibers and agricultural areas using sewage sludge as fertilizers.
The question whether microplastics will fragment to nanoplastics in significant amounts remains to be answered. Therefore it is crucial to direct research resources towards elucidation of occurrence of nanoplastics in freshwater and marine ecosystems. Further, laboratory studies on fragmentation processes from micro- to nanoplastic should be performed, as should uptake and toxicity studies of nanoplastics in relevant organisms.
Human exposure of microplastics is not well studied. Putative exposure pathways include microplastics entering lungs via air, or entering the gastrointestinal tract via water and food. None of these pathways have been quantified. Therefore it is crucial to assess and quantify the exposure pathways of microplastics to humans. The effects of microplastics on humans is to a great extent unknown although knowledge from the pharmaceutical field should be carefully reviewed. Therefore, a systematic assessment of microplastics toxicity on human should be carried out. Typically, for effects assessment this would entail extrapolation of effects found in experimental animal studies and from occupational settings. Exposure scenarios and actual measurements of microplastics exposure are also needed. Put together, generation of this kind of research data should facilitate human risk assessment of microplastics of different size, form and polymer type. The risk assessment should also include effects of microplastics-associated additives and also effects of nanoplastics if there is a potential human exposure of this particle size class.
30

Literature Ahrens MJ, Hertz J, Lamoureux EM, Lopez GR, McElroy AE, Brownawell BJ. 2001. The role of digestive surfactants in determining bioavailability of sediment-bound hydrophobic organic contaminants to 2 deposit-feeding polychaetes. Mar Ecol Prog Ser 212:145-157.
Andrady A, Pegram JE, Nakatsuka S. 1993. Studies on enhanced degradable plastics:1. The geographic variability in outdoor lifetimes of enhanced photodegradable polyethylenes. Journal of Environmental Polymer Degradation 1:31-43.
Andrady AL. 2011. Microplastics in the marine environment. Mar Pollut Bull 62:1596-1605.
Ashton K, Holmes L, Turner A. 2010. Association of metals with plastic production pellets in the marine environment. Mar Pollut Bull 60:2050-2055.
ASTM. 2012. Standard terminology relating to nanotechnology. Vol. ASTM E2456-06. American Society for Testing and Materials.
Auman HI, Ludwig JP, Giesy JP, Colborn T. 1997. Plastic ingestion by laysan albatross chicks on sand island, midway atoll, in 1994 and 1995. Albatross Biology and Conservation:239-244.
Bakir A, Rowland SJ, Thompson RC. 2014. Enhanced desorption of persistent organic pollutants from microplastics under simulated physiological conditions. Environ Pollut 185:16-23.
Ballent A, Pando S, Purser A, Juliano MF, Thomsen L. 2013. Modelled transport of benthic marine microplastic pollution in the nazaré canyon. Biogeosciences 10:7957-7970.
Barnes DKA, Galgani F, Thompson RC, Barlaz M. 2009. Accumulation and fragmentation of plastic debris in global environments. Philos T R Soc B 364:1985-1998.
Bejgarn S, MacLeod M, Bogdal C, Breitholtz M. 2015. Toxicity of leachate from weathering plastics: An exploratory screening study with nitocra spinipes. Chemosphere 132:114-119.
Bergami E, Bocci E, Vannuccini ML, Monopoli M, Salvati A, Dawson KA, et al. 2016. Nano-sized polystyrene affects feeding, behaviour and physiology of brine shrimp artemia franciscana larvae. Ecotoxicology and Environmental Safety 123:18-25.
Berntsen P, Park CY, Rothen-Rutishauser B, Tsuda A, Sager TM, Molina RM, et al. 2010. Biomechanical effects of environmental and engineered particles on human airway smooth muscle cells. Journal of the Royal Society Interface 7:S331-S340.
Besseling E, Wegner A, Foekema EM, van den Heuvel-Greve MJ, Koelmans AA. 2013. Effects of microplastic on fitness and pcb bioaccumulation by the lugworm arenicola marina (l.). Environ Sci Technol 47:593-600.
Bhattacharya P, Lin SJ, Turner JP, Ke PC. 2010. Physical adsorption of charged plastic nanoparticles affects algal photosynthesis. J Phys Chem C 114:16556-16561.
Boerger CM, Lattin GL, Moore SL, Moore CJ. 2010. Plastic ingestion by plantivorous fishes in teh north pacific central gyre. Mar Pollut Bull 60:2275-2278.
Bouwmeester H, Hollman PCH, Peters RJB. 2015. Potential health impact of environmentally released micro- and nanoplastics in the human food production chain: Experiences from nanotoxicology. Environ Sci Technol 49:8932-8947.
31

Browne MA, Dissanayake A, Galloway TS, Lowe DM, Thompson RC. 2008. Ingested microscopic plastic translocates to the circulatory system of the mussel, mytilus edulis (l.). Environ Sci Technol 42:5026-5031.
Browne MA, Crump P, Niven SJ, Teuten E, Tonkin A, Galloway T, et al. 2011. Accumulation of microplastic on shorelines woldwide: Sources and sinks. Environ Sci Technol 45:9175-9179.
Browne MA, Niven SJ, Galloway TS, Rowland SJ, Thompson RC. 2013. Microplastic moves pollutants and additives to worms, reducing functions linked to health and biodiversity. Curr Biol 23:2388-2392.
Canesi L, Ciacci C, Fabbri R, Marcomini A, Pojana G, Gallo G. 2012. Bivalve molluscs as a unique target group for nanoparticle toxicity. Mar Environ Res 76:16-21.
Castaneda RA, Avlijas S, Simard MA, Ricciardi A. 2014. Microplastic pollution in st. Lawrence river sediments. Canadian Journal of Fisheries & Aquatic Sciences 71:1767-1771.
CBD. 2012. Secretariat of the convention on biological diversity and the scientific and technical advisory panel - gef. Impacts of marine debris on biodiversity: Current status and potential solutions. Montreal, Technical Series 67:61.
Claessens M, De Meester S, van Landuyt L, de Clerck K, Janssen CR. 2011. Occurrence and distribution of microplastics in marine sediments along the belgian coast. Mar Pollut Bull 62:2199-2204.
Cole M, Webb H, Lindeque PK, Fileman ES, Halsband C, Galloway TS. 2014. Isolation of microplastics in biota-rich seawater samples and marine organisms. Sci Rep-Uk 4:1-8.
Collignon A, Hecq J-H, Glagani F, Voisin P, Collard F, Goffart A. 2012. Neustonic microplastic and zooplankton in the north western mediterranean sea. Mar Pollut Bull 64:861-864.
Cooper DA, Corcoran PL. 2010. Effects of mechanical and chemical processes on the degradation of plastic beach debris on the island of kauai, hawaii. Mar Pollut Bull 60:650-654.
Cózar A, Echevarria F, Gonzalez-Gordillo JI, Irigoien X, Ubeda B, Hernandez-Leon S, et al. 2014. Plastic debris in the open ocean. P Natl Acad Sci USA 111:10239-10244.
Day RH, Shaw DG. 1987. Patterns in the abundance of pelagic plastic and tar in the north pacific ocean, 1976-185. Mar Pollut Bull 18:311-316.
de Lucia GA, Caliani I, Marra S, Camedda A, Coppa S, Alcaro L, et al. 2014. Amount and distribution of neustonic micro-plastic off the western sardinian coast (central-west mediterranean sea). Mar Environ Res 100:10-16.
de Wit CA. 2002. An overview of brominated flame retardants in the environment. Chemosphere 46:583-624.
De Witte B, Devriese L, Bekaert K, Hoffman S, Vandermeersch G, Cooreman K, et al. 2014. Quality assessment of the blue mussel (mytilus edulis): Comparison between commercial and wild types. Mar Pollut Bull 85:146-155.
Desforges J-PW, Galbraith M, Dangerfield N, Ross PS. 2014. Widespread distribution of microplastics in subsurface seawater in the ne pacific ocean. Mar Pollut Bull 79:94-99.
Devriese LI, van der Meulen MD, Maes T, Bekaert K, Paul-Pont I, Frere L, et al. 2015. Microplastic contamination in brown shrimp (crangon crangon, linnaeus 1758) from coastal waters of the southern north sea and channel area. Mar Pollut Bull 98:179-187.
32

Doyle MJ, Watson W, Bowlin NM, Sheavly SB. 2011. Plastic particles in coastal pelagic ecosystems of the northeast pacific ocean. Mar Environ Res 71:41-52.
Dris R, Gasperi J, Rocher V, Saad M, Renault N, Tassin B. 2015. Microplastic contamination in an urban area: A case study in greater paris. Environment Chemistry 12:592-599.
Eerkes-Medrano D, Thompson RC, Aldridge DC. 2015. Microplastics in freshwater systems: A review of the emerging threats, identification of knowledge gaps and prioritisation of research needs. Water Res 75:63-82.
Enders K, Lenz R, Stedmon CA, Nielsen TG. 2015. Abundance, size and polymer composition of marine microplastics >= 10um in the atlantic ocean and their modelled vertical distribution. Mar Pollut Bull 100:70-81.
Eriksen M, Mason S, Wilson S, Box C, Zellers A, Edwards W, et al. 2013a. Microplastic pollution in the surface waters of the laurentian great lakes. Mar Pollut Bull 77:177-182.
Eriksen M, Mason S, Wilson S, Box C, Zellers A, Edwards W, et al. 2013b. Microplastic pollution in the surface waters of the laurentian great lakes. Mar Pollut Bull 77:177-182.
Eriksen M, Maximenko N, Thiel M, Cummins A, Lattin G, Wilson S, et al. 2013c. Plastic pollution in the south pacific subtropical gyre. Mar Pollut Bull 68:71-76.
Eriksen M, Lebreton LCM, Carson HS, Thiel M, Moore CJ, Borerro JC, et al. 2014. Plastic pollution in the world's oceans: More than 5 trillion plastic pieces weighing over 250,000 tons afloat at sea. Plos One 9.
Eriksson C, Burton H. 2003. Origins and biological accumulation of small plastic particles in fur seals from macquarie island. Ambio 32:380-384.
Farrell P, Nelson K. 2013. Trophic level transfer of microplastic: Mytilus edulis (l.) to carcinus maenas (l.). Environ Pollut 177:1-3.
Faure F, Corbaz M, Baecher H, De Alencastro LF. 2012. Pollution due to plastics and microplastics in lake geneva and in the mediterranean sea. Archives des Sciences 65:157-164.
Fischer V, Elsner NO, Brenke N, Schwabe E, Brandt A. 2015. Plastic pollution of the kuril-kamchatka trench area (nw pacific). Deep-Sea Res Part II-Top Stud Oceanogr 111:399-405.
Free CM, Jensen OP, Mason SA, Eriksen M, Williamson NJ, Boldgiv B. 2014. High-levels of microplastic pollution in a large, remote, mountain lake. Mar Pollut Bull 85:156-163.
Fröhlich E, Kueznik T, Samberger C, Roblegg E, Wrighton C, Pieber TR. 2010. Size-dependent effects of nanoparticles on the activity of cytochrome p450 isoenzymes. Toxicol Appl Pharm 242:326-332.
Gassel M, Harwani S, Park J-S, Jahn A. 2013. Detection of nonylphenol and persistent organic pollutants in fish from the north pacific central gyre. Mar Pollut Bull 73:231-242.
GESAMP. 2010. Proceedings of the gesamp international workshop on microplastic particles as a vector in transporting persistent, bioaccumulating and toxic substances in the oceans GESAMP Rep Stud No 82:68.
GESAMP. 2015. Sources, fate and effects of microplastics in the marine environment: A global assessment. (IMO/FAO/UNESCO-IOC/UNIDO/WMO/IAEA/UN/UNEP/UNDP Joint Group of Experts on the Scientific Aspects of Marine Environmental Protection).
33

Goldstein MC, Rosenberg M, Chemg L. 2012. Increased oceanic microplastic debris enhances oviposition in an endemic pelagic insect. Biological Letters 8:817-820.
Gray H, Lattin GL, Moore CJ. 2012. Incidence, mass and variety of plastics ingested by laysan (phoebastria immutabilis) and black-footed albatrosses (p. Nigripes) recovered as by-catch in the north pacific ocean. Mar Pollut Bull 64:2190-2192.
Gregory MR, Andrady AL. 2003. Plastics in the marine environment. In: Plastics in the environment, (Andrady AL, ed). USA:John Wiley & Sons.
Helcom. 2014. Base project 2012-2014: Preliminary study on synthetic microfibers and particles at a municipal waste water treatment plant.
Herzke D, Anker-Nilssen T, Nost TH, Gotsch A, Christensen-Dalsgaard S, Langset M, et al. 2016. Negligible impact of ingested microplastics on tissue concentrations of persistent organic pollutants in northern fulmars off coastal norway. Environ Sci Technol 50:1924-1933.
Hidalgo-Ruz V, Gutow L, Thompson RC, Thiel M. 2012. Microplastics in the marine environment: A review of the methods used for identification and quantification. Environ Sci Technol 46:3060-3075.
Hinojosa IA, Thiel M. 2009. Floating marine debris in fjords, gulfs and channels of southern chile. Mar Pollut Bull 58:341-350.
Hirai H, Takada H, Ogata Y, Yamashita R, Mizukawa K, Saha M, et al. 2011. Organic micropollutants in marine plastics debris from the open ocean and remote and urban beaches. Mar Pollut Bull 62:1683-1692.
Hussain N, Jaitley V, Florence AT. 2001. Recent advances in the understanding of uptake of microparticulates across the gastrointestinal lymphatics. Advanced Drug Delivery Reviews 50:107-142.
Imhof HK, Ivleva NP, Schmid J, Niessner R, Laforsch C. 2013. Contamination of beach sediments of a subalpine lake with microplastic particles. Curr Biol 23:R867-R868.
Ivar do Sul JA, Costa MF, Fillmann G. 2014a. Microplastics in the pelagic environment around oceanic islands of the western tropical atlantic ocean. Water, Air, and Soil Pollution 225.
Ivar do Sul JA, Costa MF, Fillmann G. 2014b. Microplastics in the pelagic environment around oceanic islands of the western tropical atlantic ocean. Water Air Soil Poll 225.
Ivar do Sul JAI, Costa MF. 2014. The present and future of microplastic pollution in the marine environment. Environ Pollut 185:352-364.
Jambeck JR, Geyer R, Wilcox C, Siegler TR, Perryman M, Andrady A, et al. 2015. Plastic waste inputs from land into the ocean. Science 347:768-771.
Kijchavengkul T, Auras R, Rubino M, Alvarado E, Montero JRC, Rosales JM. 2010. Atmospheric and soil degradation of aliphatic–aromatic polyester films. Polymer Degradation and Stability 95.
Kukulka T, Proskurowski G, Moret-Ferguson S, Meyer DW, Law KL. 2012. The effect of wind mixing on the vertical distribution of buoyant plastic debris. Geophysical research letters 39:1-6.
Kärrman A, Schönlau C, Karlsson T, Engwall M, van Bavel B. 2016a. Baltic sea expedition 2014. Report to the Swedish EPA. In preparation.
Kärrman A, Vigren D, Karlsson C, van Bavel B. 2016b. Pilot study on the occurence and disposition of microplastics in lake Vättern. Report to Vätternvårdsförbundet. In preparation.
34

Laist DW. 1997. Impacts of marine debris: Entanglement of marine life in debris including a comprehensive list of species with entanglement and ingestion records. Marine Debris - Sources, Impacts and Solutions Springer Series on Environmental Management 99-139.
Landbecker D. 2012. Anthropogenic particles in lake mälaren. Bachelor thesis. (Uppsala University).
Lattin GL, Moore CJ, Zellers AF, Moore SL, Weisberg SB. 2004. A comparison of neustonic plastic and zooplankton at different depths near the southern california shore. Mar Pollut Bull 49:291-294.
Law KL, Moret-Ferguson S, Maximenko NA, Proskurowski G, Peacock EE, Hafner J, et al. 2010. Plastic accumulation in the north atlantic subtropical gyre. Science 329:1185-1188.
Law KL, Moret-Ferguson SE, Goodwin DS, Zettler ER, De Force E, Kukulka T, et al. 2014. Distribution of surface plastic debris in the eastern pacific ocean from an 11-year data set. Environ Sci Technol 48:4732-4738.
Lebreton LC-M, Greer SD, Borrero JC. 2012. Numerical modelling of floating debris in the world´s oceans. Mar Pollut Bull 64:653-661.
Lechner A, Keckeis H, Lumesberger-Loisl F, Zens B, Krusch R, Tritthart M, et al. 2014. The danube so colourful: A potpourri of plastic litter outnumbers fish larvae in europe's second largest river. Environ Pollut 188:177-181.
Lee KW, Shim WJ, Kwon OY, Kang JH. 2013. Size-dependent effects of micro polystyrene particles in the marine copepod tigriopus japonicus. Environ Sci Technol 47:11278-11283.
Liebezeit G, Liebezeit E. 2013. Non-pollen particulates in honey and sugar. Food Addit Contam A 30:2136-2140.
Liebezeit G, Liebezeit E. 2014. Synthetic particles as contaminants in german beers. Food Addit Contam A 31:1574-1578.
Lind L, Lind PM. 2012. Can persistent organic pollutants and plastic-associated chemicals cause cardiovascular disease? J Intern Med 271:537-553.
Lind L, Simon T, Johansson L, Kotti S, Hansen T, Machecourt J, et al. 2012. Circulating levels of secretory- and lipoprotein-associated phospholipase a2 activities: Relation to atherosclerotic plaques and future all-cause mortality. Eur Heart J 33:2946-2954.
Lind PM, Lind L. 2011. Circulating levels of bisphenol a and phthalates are related to carotid atherosclerosis in the elderly. Atherosclerosis 218:207-213.
Lithner D, Damberg J, Dave G, Larsson Å. 2009. Leachates from plastic consumer products - screening for toxicity with daphnia magna. Chemosphere 74:1195-1200.
Lithner D, Larsson Å, Dave G. 2011. Environmental and health hazard ranking and assessment of plastic polymers based on chemical composition. Sci Total Environ 409:3309-3324.
Lobelle D, Cunliffe M. 2011. Early microbial biofilm formation on marine plastic debris. Mar Pollut Bull 62:197-200.
Lusher A. 2015. Microplastics in the marine environment: Distribution, interactions and effects. In: Marine anthropogenic litter, Vol. 1, (Bergmann M, Gutow L, Klages M, eds):Springer International Publishing, 447.
35

Lusher AL, McHugh M, Thompson RC. 2013. Ocurrence of microplastics in the gastrointestinal tract of pelagic and demersal fish from the english channel. Mar Pollut Bull 67:94-99.
Lusher AL, Burke A, O´Connor I, Officer R. 2014. Microplastic pollution in the northeast atlantic ocean: Validated and opportunistic sampling. Mar Pollut Bull 88:325-333.
Magnusson K. 2014. Microlitter and other microscopic anthropogenic particles in the sea area off auma and Turku, Finland. IVL Swedish Environmental Research Institute. U4645.
Magnusson K, Wahlberg C. 2014. Mikroskopiska skräppartiklar i vatten från avloppsreningsverk. IVL Swedish Environmental Research Institute. Stockholm.
Mato Y, Isobe T, Takada H, Kanehiro H, Ohtake C, Kaminuma T. 2001. Plastic resin pellets as a transport medium for toxic chemicals in the marine environment. Environ Sci Technol 35:318-324.
Maximenko N, Hafner J, Niiler P. 2012. Pathways of marine debris derived from trajectories of lagrangian drifters. Mar Pollut Bull 65:51-62.
Mazurais D, Ernande B, Quazuguel P, Severe A, Huelvan C, Madec L, et al. 2015. Evaluation of the impact of polyethylene microbeads ingestion in european sea bass (dicentrarchus labrax) larvae. Mar Environ Res 112:78-85.
McDonnell AMP, Buesseler KO. 2010. Variability in the average sinking velocity of marine particles. Limnology and Oceanography 55:2085-2096.
Moore CJ, Moore SL, Leecaster MK, Weisberg SB. 2001. A comparison of plastic and plankton in the north pacific central gyre. Mar Pollut Bull 42:1297-1300.
Moore CJ, Moore SL, Weisberg SB, Lattin GL, Zellers AF. 2002. A comparison of neustonic plastic and zooplankton abundance in southern california's coastal waters. Mar Pollut Bull 44:1035-1038.
Moore CJ, lattin GL, Zellers AF. 2011. Quantity and type of plastic debris flowing from two urban rivers to coastal waters and beaches of southern california. Journal of Integrated Coastal Zone management 11:65-73.
Murray F, Cowie PR. 2011. Plastic contamination in the decapod crustacean nephrops norvegicus (linnaeus, 1758). Mar Pollut Bull 62:1207-1217.
Nakashima E, Isobe A, Kako S, Magome S, Deki N, Itai T, et al. 2011. Toxic metals in polyethylene plastic litter. Interdisciplinary studies on Environmental Chemistry - Marine Environmental modeling and analysis:271-277.
Nilsen F, Hyrenbach KD, Fang J, Jensen B. 2014. Use of indicator chemicals to characterize the plastic fragments ingested by lysan albatross. Mar Pollut Bull 87:230-236.
Norén F. 2007. Mikroskopiska plastpartiklar i svenska vatten. Report, KIMO.
O´Brine T, Thompson RC. 2010. Degradation of plastic carrier bags in the marine environment. Mar Pollut Bull 60:2279-2283.
OECD. 2004. Emission scenario document on plastic additives. OECD Environment Health and Safety Publications Series on Emission Scenario Documents No 3. ENV/JM/MONO(2004)8/REV1. Paris.
36

Ogata Y, Takada H, Mizukawa K, Hirai H, Iwasa S, Endo S, et al. 2009. International pellet watch: Global monitoring of persistent organic pollutants (pops) in coastal waters. 1. Initial phase data on pcbs, ddts, and hchs. Mar Pollut Bull 58:1437-1446.
Oliveira M, Ribeiro A, Hylland K, Guilhermino L. 2013. Single and combined effects of microplastics and pyrene on juveniles (0+group) of the common goby pomatoschistus microps (teleostei, gobiidae). Ecol Indic 34:641-647.
Panti C, Giannetti M, Baini M, Rubegni F, Minutoli R, Fossi MC. 2015. Ocurrence, relative abundance and spatial distribution of microplastics and zooplankton nw of sardinia in the pelagos sanctuary protected area, mediterranean sea. Environmental Chemistry 12:618-626.
PlasticsEurope. 2015. Plastics - the facts 2014/2015. http://wwwplasticseuropeorg/Document/plastics-the-facts-20142015aspx?FolID=2.
Provencher JF, Gaston AJ, Mallory ML, O´hara PD, Gilchrist HG. 2010. Ingested plastic in a diving seabird, the thick-billed murre (uria lomvia), in the eastern canadian arctic. Mar Pollut Bull 60:1406-1411.
Reisser J, Shaw J, Wilcox C, Hardesty BD, Proietti M, Thums M, et al. 2013. Marine plastic pollution in waters around australia: Characteristics, concentrations, and pathways. Plos One 8:1-11.
Reisser J, Slat B, Noble K, du Plessis K, Epp M, Proietti M, et al. 2015. The vertical distribution of buoyant plastics at sea: An observational study in the north atlantic gyre. Biogeosciences 12:1249-1256.
Rochman CM, Browne MA, Halpern BS, Hentschel BT, Hoh E, Karapanagioti HK, et al. 2013a. Classify plastic waste as hazardous. Nature 494:169-171.
Rochman CM, Hoh E, Hentschel BT, Kaye S. 2013b. Long-term field measurement of sorption of organic contaminants to five types of plastic pellets: Implications for plastic marine debris. Environ Sci Technol 47:1646-1654.
Rochman CM, Hoh E, Kurobe T, Teh SJ. 2013c. Ingested plastic transfers hazardous chemicals to fish and induces hepatic stress. Sci Rep-Uk 3.
Rochman CM, Manzano C, Hentschel BT, Simonich SLM, Hoh E. 2013d. Polystyrene plastic: A source and sink for polycyclic aromatic hydrocarbons in the marine environment. Environ Sci Technol 47:13976-13984.
Rochman CM, Kurobe T, Flores I, Teh SJ. 2014a. Early warning signs of endocrine disruption in adult fish from the ingestion of polyethylene with and without sorbed chemical pollutants from the marine environment. Sci Total Environ 493:656-661.
Rochman CM, Lewison RL, Eriksen M, Allen H, Cook AM, Teh SJ. 2014b. Polybrominated diphenyl ethers (pbdes) in fish tissue may be an indicator of plastic contamination in marine habitats. Sci Total Environ 476:622-633.
Romeo T, Pietro B, Peda C, Consoli P, Andaloro F, Fossi MC. 2015. First evidence of presence of plastic debris in stomach of large pelagic fish in the mediterranean sea. Mar Pollut Bull 95:358-361.
Ryan PG. 2013. A simple technique for counting marine debris at sea reveals steep litter gradients between the straits of malacca and the bay of bengal. Mar Pollut Bull 69:128-136.
Ryan PG, de Bruyn PJN, Bester MN. 2016. Regional differences in plastic ingestion among southerrn ocean fur seals and albatrosses. Mar Pollut Bull In press.
37

Schuyler QA, Wilcox C, Townsend KA, Wedemeyer-Strombel KR, Balazs G, van Sebille E, et al. 2016. Risk analysis reveals global hotspots for marine debris ingestion by sea turtles. Global Change Biology 22:567-576.
Schönlau C, Larsson M, Lam M, Rochman CM, Engwall M, Kärrman A. 2016. Ah-receptor mediated activity of four different plastic polymers deployed in the san diego bay area, california. In preparation.
Setälä O, Fleming-Lehtinen V, Lehtiniemi M. 2014. Ingestion and transfer of microplastics in the planktonic food web. Environ Pollut 185:77-83.
Setälä O, Norkko J, Lehtiniemi M. 2016. Feeding type affects microplastic ingestion in a coastal invertebrate community. Mar Pollut Bull 102:95-101.
Singh S, Sharma N. 2008. Mechanistic implications of plastic degradation. Polymer Degradation and Stability 93:561-584.
Song YK, Hong SH, Jang M, Han GM, Rani M, Lee J, et al. 2015. A comparison of microscopic and spectroscopic identification methods for analysis of microplastics in environmental samples. Mar Pollut Bull 93:202-209.
Strand J, Tairova Z. 2016. Microplastic particles in north sea sediments 2015. Scientific report from Danish Centre for Environment and Energy No 178.
Sussarellu R, Suquet M, Thomas Y, Lambert C, Fabioux C, Pernet ME, et al. 2016. Oyster reproduction is affected by exposure to polystyrene microplastics. Proc Natl Acad Sci U S A.
Tanaka K, Takada H, Yamashita R, Mizukawa K, Fukuwaka M, Watanuki Y. 2013. Accumulation of plastic-derived chemicals in tissues of seabirds ingesting marine plastics. Mar Pollut Bull 69:219-222.
Tanaka K, Takada H, Yamashita R, Mizukawa K, Fukuwaka M, Watanuki Y. 2015. Facilitated leaching of additive-derived pbdes from plastic by seabirds´stomach oil and accumulation tissues. Environ Sci Technol 49:11799-11807.
Teuten EL, Rowland SJ, Galloway TS, Thompson RC. 2007. Potential for plastics to transport hydrophobic contaminants. Environ Sci Technol 41:7759-7764.
Teuten EL, Saquing JM, Knappe DRU, Barlaz MA, Jonsson S, Bjorn A, et al. 2009. Transport and release of chemicals from plastics to the environment and to wildlife. Philos T R Soc B 364:2027-2045.
Thompson RC, Olsen Y, Mitchell RP, Davis A, Rowland SJ, John AWG, et al. 2004. Lost at sea: Where is all the plastic? Science 304:838-838.
Trevail AM, Gabrielsen GW, Kuhn S, Van Franeker JA. 2015. Elevated levels of ingested plastic in a high arctic seabird, the northern fulmar (fulmarus glacialis). Polar Biol 38:975-981.
Van Cauwenberghe L, Vanreusel A, Mees J, Janssen CR. 2013. Microplastic pollution in deep-sea sediments. Environ Pollut 182:495-499.
Van Cauwenberghe L, Janssen CR. 2014. Microplastics in bivalves cultured for human consumption. Environ Pollut 193:65-70.
van Cauwenberghe L, Devriese LI, Galgani F, Robbens J, Janssen CR. 2015. Microplastics in sediments: A review of techniques, occurence and effects. Mar Environ Res 111:5-17.
38

van Franeker JA, Blaize C, Danielsen J, Fairclough K, Gollan J, Guse N, et al. 2011. Monitoring plastic ingestion by the northern fulmar fulmarus glacialis in the north sea. Environ Pollut 159:2609-2615.
van Sebille E, England MH, Froyland G. 2012. Origin, dynamics and evolution of ocean garbage patches from observed surface drifters. Environmental Research Letters 7:1-6.
van Sebille E, Wilcox C, Lebreton LCM, Maximenko N, Hardesty BD, van Franeker JA, et al. 2015. A global inventory of small floating plastic debris. Environmental Research Letters 10:1-11.
Watters DL, Yoklavich MM, Love MS, Schroeder DM. 2010. Assessing marine debris in deep seafloor habitats off california. Mar Pollut Bull 60:131-138.
Watts AJR, Lewis C, Goodhead RM, Beckett SJ, Moger J, Tyler CR, et al. 2014. Uptake and retention of microplastics by the shore crab carcinus maenas. Environ Sci Technol 48:8823-8830.
Wegner A, Besseling E, Foekema EM, Kamermans P, Koelmans AA. 2012. Effects of nanopolystyrene on the feeding behavior of the blue mussel (mytilus edulis l.). Environ Toxicol Chem 31:2490-2497.
Velzeboer I, Kwadijk CJAF, Koelmans AA. 2014. Strong sorption of pcbs to nanoplastics, microplastics, carbon nanotubes, and fullerenes. Environ Sci Technol 48:4869-4876.
Wick P, Malek A, Meili D, X. M-A, Diener L, Diener PA, et al. 2010. Barrier capacity of human placenta for nanosized materials. Environ Health Persp 118:432-436.
Williams AT, Simmons SL. 1996. The degradation of plastic litter in rivers: Implications for beaches. Journal of Coastal Conservation 2:63-72.
Vlietstra LS, Parga JA. 2002. Long-term changes in the type, but not amount, of ingested plastic particles in short-tailed shearwaters in the southeastern bering sea. Mar Pollut Bull 44:945-955.
von Moos N, Burkhardt-Holm P, Kohler A. 2012. Uptake and effects of microplastics on cells and tissue of the blue mussel mytilus edulis l. After an experimental exposure. Environ Sci Technol 46:11327-11335.
Wright SL, Rowe D, Thompson RC, Galloway TS. 2013a. Microplastic ingestion decreases energy reserves in marine worms. Curr Biol 23:R1031-R1033.
Wright SL, Thompson RC, Galloway TS. 2013b. The physical impacts of microplastics on marine organisms: A review. Environ Pollut 178:483-492.
Yamashita R, Tanimura A. 2007. Floating plastic in the kuroshio current area, western pacific ocean. Mar Pollut Bull 54:485-488.
Yang DQ, Shi HH, Li L, Li JN, Jabeen K, Kolandhasamy P. 2015. Microplastic pollution in table salts from china. Environ Sci Technol 49:13622-13627.
Ye S, Andrady AL. 1991. Fouling of floating plastic debris under biscayne bay exposure conditions. Mar Pollut Bull 22:608-613.
Zardus JD, Nedved BT, Huang Y, Tran C. 2008. Microbial biofilms facilitate adhesion in biofouling invertebrates. Biological Bulletin 214:91-98.
39