Exports and Women Workers in Formal Firms
91
Policy Research Working Paper 9527 Exports and Women Workers in Formal Firms Mohammad Amin Asif M. Islam Development Economics Global Indicators Group January 2021 Public Disclosure Authorized Public Disclosure Authorized Public Disclosure Authorized Public Disclosure Authorized
Transcript of Exports and Women Workers in Formal Firms

Policy Research Working Paper 9527
Exports and Women Workers in Formal Firms Mohammad Amin
Asif M. Islam
Development Economics Global Indicators GroupJanuary 2021
Pub
lic D
iscl
osur
e A
utho
rized
Pub
lic D
iscl
osur
e A
utho
rized
Pub
lic D
iscl
osur
e A
utho
rized
Pub
lic D
iscl
osur
e A
utho
rized

Produced by the Research Support Team
Abstract
The Policy Research Working Paper Series disseminates the findings of work in progress to encourage the exchange of ideas about development issues. An objective of the series is to get the findings out quickly, even if the presentations are less than fully polished. The papers carry the names of the authors and should be cited accordingly. The findings, interpretations, and conclusions expressed in this paper are entirely those of the authors. They do not necessarily represent the views of the International Bank for Reconstruction and Development/World Bank and its affiliated organizations, or those of the Executive Directors of the World Bank or the governments they represent.
Policy Research Working Paper 9527
Theory suggests several ways in which exporting may benefit women’s employment. However, the empirical evidence is mixed and limited, especially for developing countries. This paper uses firm-level survey data for 91 developing coun-tries to estimate the relationship between exporting and the share of women workers at the firm. The analysis pays close attention to endogeneity concerns. First, it proxies a given firms’ exports by the average exports of all other firms in the same country-year-industry cell. Second, it exploits the repeated cross-section nature of the data and analyzes how changes over time in exporting activity are associated with changes in the share of women workers. The strategy is more immune to endogeneity problems than pure cross-section regressions. Third, it tests several mechanism or mediating factors as predicted by the theory through which exporting impacts women’s employment prospects. The predictions
are confirmed in the data, an unlikely scenario if exports were a mere proxy for other correlated drivers of women’s employment. The results show a large, positive impact of higher exports on the share of women workers. A conser-vative estimate is that for each percentage point increase in the ratio of exports to total sales, the share of women workers increases by 0.16 percentage point. Consistent with the theoretical predictions, this positive relationship is much larger (more positive) in industries that rely more on women workers, in country-industry pairs where com-petitive pressure is largely from international markets in comparison to less competitive domestic markets, when social attitudes and labor laws are more favorable toward women’s work, and when the law and order situation is more business friendly.
This paper is a product of the Global Indicators Group, Development Economics. It is part of a larger effort by the World Bank to provide open access to its research and make a contribution to development policy discussions around the world. Policy Research Working Papers are also posted on the Web at http://www.worldbank.org/prwp. The authors may be contacted at [email protected].

Exports and Women Workers in Formal Firms
By: Mohammad Amin* and Asif M. Islam**
Keywords: Trade, Exports, Gender, Women workers, Globalization JEL: F15, F16, J21, F66 We would like to thank Norman Loayza, Jorge Luis Rodriguez Meza and participants at a seminar organized by Enterprise Surveys, World Bank for providing helpful comments. All remaining errors are our own. * Corresponding author. Enterprise Analysis Unit, World Bank Country Office in Kuala Lumpur, Malaysia and Washington DC, USA. Email: [email protected]. Phone: +1 202-412-5723. ** Office of the Chief Economist, Middle East and North Africa Region, World Bank, Washington DC. Email: [email protected]. Phone: 202-458- 5246.

2
1. Introduction
Trade in goods increased from about 43 percent of GDP in 1995 to almost 60 percent in 2017
(World Bank 2020). Increasing globalization has sparked interest along several dimensions. One
such dimension, the focus of the present study, is the impact of exporting activity on job market
prospects of women relative to men. Theory suggests several reasons for such a relationship. For
instance, greater competition associated with international trade raises employers’ cost of
discriminating against female workers and thereby increases female employment. Reallocation of
resources from non-exporting firms to exporting firms can affect female employment depending
on how intensively females are employed by the two types of firms. Access to foreign technology
and greater mechanization linked to trading activity shifts job requirements from less “brawn” to
more “brains”, favoring females more than males.
The empirical validity of the relationship between exporting activity and female
employment remains to be properly established, especially for the case of developing countries.
The present paper attempts to fill this gap in the literature. We do so by using firm-level survey
data for several developing countries to estimate the relationship between exporting activity and
female (relative to male) employment. We provide several endogeneity checks. We also pay close
attention to the mechanisms at play and the mediating factors that may enhance or mitigate the
impact of exporting on female employment. These checks not only help to uncover the relationship
between exporting activity and female employment, but also help raise our confidence against
possible endogeneity concerns (discussed below).
There is a growing literature on the impact of trade on female employment. However, most
of the studies in the area are restricted to specific countries, and the cross-country studies that do
exist tend to rely on macro-level data. Available empirical evidence is mixed. Some of the studies

3
that find greater trade openness to be associated with higher female employment include, for
example, Ozler (2000), Wood (1991), Cagatay and Ozler (1995), Cagatay and Berik (1990),
Kasnakoglu and Dikbayir (1997), Chen et al. (2013), Juhn et al. (2014), Ederington et al. (2010),
Aguayo-Tellez et al. (2010), Spieldoch (2004), Gaddis and Pieters (2012), Pradhan (2005),
Bussman (2009), Rocha and Winkler (2019), World Bank (2020) and United Nations (2009). In
contrast, studies showing no effect or a negative effect or contradictory effects of trade
liberalization on female employment in developing countries include, for example, Meyer (2006),
Wamboye and Seguino (2014), Joekes (1995), Gray et al. (2006) and Cooray et al. (2012).
Our study provides several contributions to the literature. First, we use firm-level survey
data for 44,539 manufacturing firms across 91 (mostly) developing economies covering multiple
waves of surveys between 2006 and 2017. Second, regressing female employment in a firm on
exporting activity of the same firm is fraught with endogeneity problems. Thus, we follow the
broader literature and proxy firms’ exporting activity by the average exporting activity of all other
firms in the same country-year-industry cell (“cell average”). As discussed below, use of cell
averages has been made in the literature and it helps to considerably reduce the possible spurious
correlation problem. We go beyond and exploit the repeated cross-section nature of the data. That
is, the identification of our main results comes from changes in exporting activity of firms within
a country-industry pair over time and the associated change in female employment. This helps
limit several avenues of omitted variable bias that plague pure cross-sectional regressions.
Third, we test for several predictions or implications of the theoretical models in the related
literature. These tests not only serve to provide a better understanding of the relationship, but also
raise our confidence against endogeneity concerns. For instance, it is argued that greater
competition that exporters face relative to non-exporters raises the cost of discriminating against
4
female workers to the employer. The higher cost results in lower equilibrium discrimination and
therefore higher female employment. This effect is likely to be more pronounced in countries and
industries where domestic competition is low to begin with. Thus, we predict that the relationship
between exporting and female employment is larger (more positive) when domestic competition
is low. The prediction is unlikely to hold if exporting activity is a mere proxy for other correlated
variables such as the age of the firm, industry to which the firm belongs, firm-size, etc. Our
empirical results confirm this prediction. Other predictions that we test for include how the strength
of the relationship between exporting and female employment depends on the dependency of
sectors on female relative to male workers, social attitudes towards women’s work, gender
disparity in laws in the area of employment, and the law and order situation proxied by the quality
of the functioning of courts.
Fourth, the firm-level survey data we use provide information on several firm
characteristics and the quality of the business environment. This allows us to control for several
firm and industry characteristics that may spuriously affect our main results.
Our results show a positive, statistically significant and quantitatively large relationship
between the export orientation of the firms and female employment. A conservative baseline
estimate indicates that the share of female workers in a firm is higher by about 16 percentage points
for firms that export all their output compared to firms that do not export at all. This is a large
difference given that the mean share of female workers is about 29 percent. Furthermore, the
positive relationship between female employment and exporting activity is much stronger (more
positive) in countries with higher competitive pressure in international markets relative to domestic
markets, in industries that rely more on female workers, in countries where social attitudes towards
women’s work are more favorable, in countries where laws discriminate less against women’s
5
work relative to men’s work, and when the law and order situation is more business friendly. These
results are consistent with the theoretical predictions mentioned above and discussed in detail in
the next section.
2. Conceptual framework
There are several mechanisms identified in the literature that could lead exporting activity to affect
female employment. First, studies point towards a positive association between trade openness and
higher levels of income and growth (Frankel and Romer 1999, Irwin and Tervio 2002, Noguer and
Siscart 2005, Dollar and Kraay 2003). Economic development and growth can translate to more
jobs, and especially so for women (World Bank 2011). Note that at least some of the proposed
benefits here of trade openness apply to exporting as well as non-exporting firms. Thus, this
channel has limited relevance for us as our empirical strategy is based on the difference in female
employment between less vs. more exporting firms within a country.
Second, gender discrimination is a preference with a significant efficiency cost. Firms may
discriminate against female workers for pure “taste” reasons or because females are less mobile
than males due to a lack of opportunities or cultural and legal restrictions (Barth and Dale-Olsen,
2009; Boal and Ransom, 1997; Webber, 2016). The idea that greater market competition can
reduce discriminatory behavior was first suggested by Becker (1957). In a competitive setting,
non-discriminating firms will be able to produce at a lower cost by hiring females. Thus, in the
long run, discriminating firms will sustain huge efficiency losses that will drive them out of the
market (see for example, Weichselbaumer and Winter-Ebmer, 2007; Elson, 1999; Heyman and
Vlachos, 2013; Hellerstein et al.., 2002). If we assume that exporting firms selling in international
markets face greater competition than firms selling domestically, higher exporting activity is likely

6
to result in greater pressure to cut costs, leading to less discrimination against females and therefore
greater female employment (see for example, Bhagwati 2004, Chen et al. 2013, Ederington et al.
2010, Juhn et al. 2014, and World Bank 2011).
Third, recent studies have examined the comparative advantage of men vs. women within
industries and across occupations. One argument here is that females enjoy a comparative
advantage in cognitive vs. physical skills (Galor and Weil 1996, Juhn et al. 2014, Do et al. 2011).
One possibility suggested here by Juhn et al. (2014) is that by lowering the cost of entering foreign
markets, trade liberalization causes some firms to start exporting and adopt modern technologies.
The use of modern technology, such as use of computers, reduces the need for routine physical
tasks, improving females’ labor market outcomes in the blue-collar tasks, while leaving them
unchanged in the white-collar jobs. However, the issue is far from settled. Depending on the type
of technology adopted, greater export orientation can lead to worsening of female employment.
Technological upgrading and improvements on product quality following trade liberalization may
lead to higher capital and skill intensity of production processes. This is likely to adversely affect
female employment (see for example, Berik 2000, Joekes 1995, Pearson 1995).
Fourth, according to the Hecksher-Ohlin theory, a country specializes and exports the
product that uses the relatively more abundant factor of production in the country more intensively.
Since, developing countries are abundant in semi and unskilled labor relative to skilled labor,
demand for semi and unskilled labor should increase with exporting activity. In as much as women
gravitate toward low-skilled jobs and men cluster toward high-skilled jobs, trade expands job
opportunities for females, in both absolute and relative (to males) terms (see for example, Wood
1991, Cagatay and Ozler 1995, Joekes 1995, Cagatay and Berik 1990, Ozler 2000, United Nations
2011).

7
Last, females may constitute a cheaper source of labor considering not just the wage rate
but also manual dexterity, conscientious application to monotonous production processes,
employers’ contribution to social wage and working conditions. As mentioned above, trade
openness makes such cheap labor more attractive, increasing job opportunities for females (Ozler
2000, Black and Brainerd 2004, Pearson 1998, Fussell 2000, Standing 1989, Elson 1996, Seguino
1997, 2000). One caveat here is that exporting firms may demand more flexible workers. The
burden of care as well as the other forms of discrimination may reduce the flexibility of female
workers, and thus women may be less likely to be favorably affected by trade (Bøler et al. 2018).
We test for several predictions that follow from the theoretical models above. As argued
above, higher exporting activity causes firms to reduce discrimination leading to more female
workers hired. The larger the gap in the level of competition faced by exporters vs. non-exporters,
the bigger the pro-competitive impact of exporting on female employment. Assuming that all
exporting firms in an industry face similar a level of competition in the international market, the
pro-competitive effect of exporting on female employment will be higher the lower the level of
competition in the domestic markets. Thus, the first prediction we test is that the positive
relationship between exporting and female employment is greater (more positive) the lower the
level of competition domestically. We test this prediction using alternative measures of the level
of domestic competition. The test serves the additional purpose of raising our confidence against
endogeneity concerns with our main result. That is, while it is possible that exports may proxy for
other correlated effects on female employment, there is no reason to expect such spurious
correlation to vary systematically with the level of competition in the domestic markets. The logic
extends to other predictions that we test for (discussed below).

8
Next, we argue that while exporting may increase the demand for female workers, the
increase in equilibrium employment will be restricted if the supply of female workers is not
forthcoming. We focus on three supply side bottlenecks: unfavorable social attitudes towards
women’s employment, labor laws that are more restrictive for women than men, and poor law and
order situation as women may be more affected than men by high crime and lawlessness. Thus,
our null hypothesis is that the positive relationship between exporting and female employment is
much stronger (more positive) when social attitudes towards women’s work are more favorable,
labor laws are less discriminatory against women workers, and the law and order situation is more
business friendly.
Further, as argued above, exporting increases women’s employment more when relative to
non-exporters, exporters use female workers more intensively than male workers. To test for this
prediction, we follow the related literature and classify industries by their dependence on female
workers. The estimates for the dependence on female workers are taken from Do et al. (2011) and
based on UNIDO data. The testable hypothesis is that the positive relationship between exporting
and female workers is stronger (more positive) in sectors that rely more on female workers.
3. Data and main variables
The main data source we use is firm-level surveys for 91 (mostly developing) countries. These
surveys were conducted by the World Bank’s Enterprise Surveys (ES) between 2006 and 2017.
The ES are nationally representative surveys of the non-agricultural private sector of the
economies. A common sampling methodology, stratified random sampling, is followed in all the
surveys together with a common questionnaire. For each country, the sample is stratified by
industry, firm-size, and location within the country. Weights are provided in the survey and used

9
throughout the analysis to correct for oversampling and ensure that the sample is representative of
the non-agricultural private sector of the economy.
We focus on the sample of manufacturing firms and all countries for which data are
available.1 The two most recent rounds of the ES in the country are used in the regressions. Note
that since the ES do not track firms over time, the sample used is a repeated cross-section rather
than firm-panel. Our baseline sample consists of 44,539 manufacturing firms. We complement the
ES with other data sources such as World Development Indicators (WDI), World Bank, Doing
Business (World Bank), World Value Surveys, and so on. In the online appendix, Table A1
provides the list of countries in our baseline sample; Table A2 provides the summary statistics of
all the variables used in the regressions; and Table A3 contains the correlations between our main
explanatory variable, exports (defined below), and other variables used as controls.
All our regressions use Huber-White robust standard errors clustered at the country-ES
time-industry level, where “ES time” is the final or initial ES (survey round) in the country;
industry grouping is at the 2-digit ISIC Rev. 3.1 level (31 industries in the baseline sample).
3.1 Estimation method
The baseline regression exercise involves estimating the following equation:
𝑌𝑌𝑖𝑖𝑖𝑖𝑖𝑖𝑖𝑖 = 𝛼𝛼 + 𝛽𝛽1𝐸𝐸𝐸𝐸𝐸𝐸𝐸𝐸𝐸𝐸𝐸𝐸𝐸𝐸𝑖𝑖𝑖𝑖𝑖𝑖𝑖𝑖
+ 𝐶𝐶𝐶𝐶𝐶𝐶𝐸𝐸𝑖𝑖𝑖𝑖 + 𝑌𝑌𝐶𝐶𝐸𝐸 + 𝐶𝐶𝐹𝐹𝐸𝐸𝐹𝐹 𝐶𝐶𝐸𝐸𝐶𝐶𝐸𝐸𝐸𝐸𝐸𝐸𝐶𝐶𝐸𝐸𝑖𝑖𝑖𝑖𝑖𝑖𝑖𝑖 + 𝐶𝐶𝐸𝐸𝐶𝐶𝐶𝐶𝐸𝐸𝐸𝐸𝐶𝐶 𝐶𝐶𝐸𝐸𝐶𝐶𝐸𝐸𝐸𝐸𝐸𝐸𝐶𝐶𝐸𝐸𝑖𝑖𝑖𝑖 + 𝐶𝐶𝑖𝑖𝑖𝑖𝑖𝑖𝑖𝑖 (1)
1 Enterprise Surveys do not cover the primary sector, public sector, mining, and services sectors such as education and health.

10
where subscript i denotes the firm, j the industry (2-digit ISIC rev. 3.1) to which the firm belongs,
t denotes ES survey round (latest vs. first round), and k denotes the country where the firm is
located. The dependent variable, Y, is the percentage of female workers at the firm; Exports, our
main explanatory variable, is a measure of exporting activity of the firm (defined in detail below);
CIFE is a set of dummy variables indicating the country-industry group to which the firm belongs
(Country-Industry fixed effects); YFE is year fixed effects where year is the calendar year covered
by the ES; Firm Controls and Country Controls include the various controls used and discussed in
detail below; u is the usual error term.
As discussed above, we go beyond and explore how the relationship between female
workers and exports varies depending on several country and industry characteristics. These
heterogeneities are estimated using the following equation:
𝑌𝑌𝑖𝑖𝑖𝑖𝑖𝑖𝑖𝑖 = 𝛼𝛼 + 𝛽𝛽1𝐸𝐸𝐸𝐸𝐸𝐸𝐸𝐸𝐸𝐸𝐸𝐸𝐸𝐸𝑖𝑖𝑖𝑖𝑖𝑖𝑖𝑖 + 𝛽𝛽2𝐸𝐸𝐸𝐸𝐸𝐸𝐸𝐸𝐸𝐸𝐸𝐸𝐸𝐸𝑖𝑖𝑖𝑖𝑖𝑖𝑖𝑖 ∗ 𝑍𝑍𝑖𝑖𝑖𝑖𝑖𝑖 + 𝛽𝛽3 ∗ 𝑍𝑍𝑖𝑖𝑖𝑖𝑖𝑖
+ 𝐶𝐶𝐶𝐶𝐶𝐶𝐸𝐸𝑖𝑖𝑖𝑖 + 𝑌𝑌𝐶𝐶𝐸𝐸 + 𝐶𝐶𝐹𝐹𝐸𝐸𝐹𝐹 𝐶𝐶𝐸𝐸𝐶𝐶𝐸𝐸𝐸𝐸𝐸𝐸𝐶𝐶𝐸𝐸𝑖𝑖𝑖𝑖𝑖𝑖𝑖𝑖 + 𝐶𝐶𝐸𝐸𝐶𝐶𝐶𝐶𝐸𝐸𝐸𝐸𝐶𝐶 𝐶𝐶𝐸𝐸𝐶𝐶𝐸𝐸𝐸𝐸𝐸𝐸𝐶𝐶𝐸𝐸𝑖𝑖𝑖𝑖
+ 𝐶𝐶𝐶𝐶𝐸𝐸𝐼𝐼𝐸𝐸𝐼𝐼𝐼𝐼𝐸𝐸𝐹𝐹𝐸𝐸𝐶𝐶 𝐶𝐶𝐸𝐸𝐶𝐶𝐸𝐸𝐸𝐸𝐸𝐸𝐶𝐶𝐸𝐸𝑖𝑖𝑖𝑖𝑖𝑖𝑖𝑖 + 𝐶𝐶𝑖𝑖𝑖𝑖𝑖𝑖𝑖𝑖 (2)
Equation (2) differs from equation (1) in two ways. First, it includes the interaction term between
our exports variable and country and/or industry characteristics captured by Z. These interaction
terms estimate how the relationship between female workers and exports varies with factors such
as the dependence of sectors on female workers, level of competition in the domestic markets,
social attitudes towards women’s right to scarce jobs and other rights, law & order situation, and
gender disparity in labor laws. The interaction terms are included one by one (separate regressions)
11
and all simultaneously. The second change in equation (2) from equation (1) is that it includes
additional controls for interaction terms such as between exports and GDP per capita, etc.
3.2 Dependent variable
Our main dependent variable is the percentage of all permanent full-time workers employed at the
firm at the end of the last fiscal year (from the date of the ES) that are females (Female Workers).
In our baseline sample, the mean value of the variable is 29.2 percent and the standard deviation
equals 28.
We would like to note that since our dependent variable is female employment relative to
total employment, factors such as overall economic development, job availability and labor market
conditions that may affect the employment of males and females equally do not pose any omitted
variable bias problem.
3.3 Main explanatory variable
Our main explanatory variable is a measure of export orientation of the firms. Information is
available in the ES on the percentage of firms’ sales made abroad (direct exports). However, this
variable cannot be used directly in the regressions as it is likely to be endogenous to (share of)
female workers. That is, reverse causality from the female workers to exports cannot be ruled out
as cheap labor provided by females can help firms in the international markets. Similarly, firm
characteristics such as firm-size, industry to which it belongs, age of the firm, foreign ownership,
availability of skilled workers, etc., that are likely to impact exports may also affect female
employment – omitted variable bias problem.

12
One solution suggested in the broader literature is to proxy a given firms’ exports by the
average level of exports of all other firms in the same location-industry cell (henceforth, cell
average). Note that the cell average excludes the firm in question. Thus, reverse causality from the
share of female workers at the firm to exporting activity of other firms in the cell is highly unlikely.
Similarly, firm characteristics that may impact a given firms’ share of female workers are less
likely to be correlated with other firms’ exporting activity than with the exporting activity of the
own firm. Using the cell average also helps to control for potential measurement error if some
firms choose not to respond or misreport the regulatory burden (Pounov 2016). The use of cell
averages to mitigate endogeneity concerns has been made in the literature. See for example, Amin
and Soh (2020), Aterido et al. (2011) and Fisman and Svensson (2007).
Thus, we define our main explanatory variable, Exports, as the average of the percentage
of firms’ sales made abroad (direct exports) where the average is taken over all firms in the
country-ES time-industry cell and excluding the firm in question. Industry grouping here is at the
2-digit ISIC Revision 3.1 level. In our baseline sample, there are 31 industries. To ensure adequate
thickness within the cells, all cells with fewer than 5 firms are excluded from the sample. Thus,
we are left with 1,659 cells in our baseline sample. In this sample, the mean value of Exports equals
9.45 percent and the standard deviation equals 13.96 percent. For later reference, the term “CI
avg.” denotes the cell average at the country-ES time-industry level in the sense defined in this
paragraph.

13
3.4 Baseline controls
To further raise our confidence against omitted variable bias problem, we control for several
potential drivers of female employment. The controls are motivated by the existing literature on
the drivers of female employment and discussed in detail below.
We take advantage of the fact that multiple rounds of survey data are available for the same
country-industry pair over time. Thus, in all our regressions, we control for dummy variables
indicting the country-industry pair to which a firm belongs (Country-Industry fixed effects). Note
that the “country” here is the geographical region and independent of ES round. Use of country-
industry fixed effects as controls implies that our regressions control for all time invariant country-
industry specific characteristics. It also implies that all time invariant country characteristics such
as culture, social attitudes towards women’s work, legal origin, etc., that may impact female
employment are accounted for in the regressions. Similarly, all time invariant characteristics
common to firms globally within an industry (that is, industry fixed effects) are captured by the
country-industry fixed effects. For instance, studies report a heavier concentration of females
relative to males in some industries than in others (Juhn et al. 2014, Amin and Islam 2014, Rendall
2010, Do et al. 2011). Some of the reasons suggested for this in the literature include, for example,
the brawn vs. brains content of jobs, the ease with which work can be combined with family
responsibility, and culture. Our results are unaffected by such industry-wide features.
Thus, identification of the relationship between female workers and exports comes from
differences over time and within a country-industry pair rather than across countries and industries.
In this sense, our results are less susceptible to the omitted variable bias problem than is typically
the case with pure cross-country regressions.

14
The ES rounds were conducted in different years across countries. It is possible that global
shocks to female employment could bias our estimation results. Thus, all our regressions control
for dummy variables for the year the ES was conducted (Year fixed effects).
The remaining controls can be divided into macro and micro level controls. First, consider
the controls at the micro or firm-level. Firm-size and age are known to be highly positively
correlated with exporting activity. Firm size and age are also important proxy measures for various
firm characteristics, potentially correlated with several firm attributes such as the tendency to
innovate, firm-efficiency and growth (Acs and Audretsch 1988, Pagano and Schivardi 2003,
Cohen and Klepper 1996, Soderbom and Teal 2004, Diaz-Mayans and Sanchez 2008). The
relationship between women’s employment and the age and size of the firm is not obvious but it
cannot be ruled out. For example, being more visible to the public, large firms may discriminate
less against women workers than the small firms. On the other hand, small firms may be more
flexible, offering a better work-family life balance that is important for women’s participation in
the labor market. Younger firms may be less tied to traditional notions of gender roles and therefore
more open to hiring women workers. Thus, we control for firm-size proxied by the (log of) number
of permanent full-time employees at the firm at the end of the last fiscal year (No. of Workers).
For age, we use the (log of) age of the firm at the time the ES was conducted in the country.
Women workers are also more likely in firms that have women owners or women top
managers as women owners and managers are less likely to discriminate against women workers
than men owners and managers. The empirical evidence on this issue, however, is somewhat mixed
(Nelson and Bridges 1999, Penner and Toro-Tulla 2010). Apart from exports, another aspect of
globalization is the presence of foreign firms and foreign ownership among domestic firms. There
is little research on how foreign ownership affects women’s employment. One possibility is that

15
foreign ownership may come with foreign values and culture that tend to be more favorable for
women’s employment. Women may be particularly sensitive to the law and order situation and the
prevalence of crime as criminals tend to target women more than men (Glaeser and Sacerdote
1999; Islam 2013).
Based on the discussion in the previous paragraph, we control for the following variables:
a dummy variable equal to 1 if the firm has one or more female owners and 0 otherwise; proportion
of firms’ ownership that is with foreign individuals or companies (Foreign Ownership); a dummy
variable equal to 1 if the firm experienced losses due to crime, theft and disorder and 0 otherwise
(Crime Losses); and a measure of the quality of courts based on a question in the ES on how severe
is the (lack of proper) functioning of courts as an obstacle for firms’ current operations (on 0-4
scale). Like for exports, we use cell averages at the country-ES round-industry level of the
responses to the question on courts’ functioning (Courts Obstacle).
The remaining firm-level controls are intended to capture recent investment by the firm in
physical capital and various aspects of the business environment as experienced by the firm. The
assumption here is that recent investment and business environment are likely to impact firm
efficiency and therefore its ability to compete in international markets. If the share of female
workers also happens to vary systematically with the quality of the business environment, our main
results for the relationship between exports and female workers could suffer from omitted variable
bias problem. For recent investment, we use as a control a dummy variable equal to 1 if the firm
purchased fixed assets during the last year and 0 otherwise. For the business environment we
control for hours of power outages experienced by the firm in a typical month in the last year
(Power Outages); a dummy variable equal to 1 if the firm was inspected by tax officials during
the last year and 0 otherwise (Firm Inspected); and severity level (on 0-4 scale) of the following

16
variables as obstacles for firms’ current operations: high tax rates, labor laws, inadequately
educated workers (Skills Obstacle), and lack of proper transport facilities.
We now consider macro-level controls. Unless stated otherwise, we use 1 year lagged
(from the year the ES was conducted) values of all the macro-level variables.
We argued above that one of the ways in which trade affects women’s employment is by
raising incomes and overall economic development. However, differences in the level of
development across countries cannot be solely attributed to trade. This implies that at least part of
the observed relationship between exports and women’s employment may be spuriously driven by
aspects of overall economic development unrelated to exporting activity. To guard against this
problem, we control for the (log of) GDP per capita, PPP adjusted and at constant 2011
international dollars. The data source for the variable is WDI, World Bank.
As discussed above, greater competition in the domestic markets makes discrimination
against female workers more costly to the employer. Thus, a positive relationship between greater
competition domestically and female workers is expected. This could bias our main results if
exporting activity happens to vary systematically with the level of competition in the domestic
markets. Thus, we control for two proxy measures of the competitive pressure faced by the firm
in the domestic markets. The first measure is based on entry regulations as measured by the World
Bank’s Doing Business sub-indicator Starting a Business. We use the “distance to frontier”
summary measure for the Starting a Business indicator. Higher values of the variable imply fewer
entry restrictions and therefore greater competition in the domestic markets. The second measure
of competition that we use is the traditional Herfindahl-Hirschman index for the annual sales of
the firms in the ES. The index is defined at the country-ES time-industry level. Industry grouping
is at the same level as used for computing cell averages for our exports variable. Note that higher

17
values of the Herfindahl-Hirschman index imply greater concentration of sales/output among firms
in the industry and therefore lower competition.
Next, we control for supply-side factors. These include the proportion of women in total
population and the fertility rate. The data source for these variables is WDI, World Bank. Fertility
rate represents the number of children that would be born to a woman if she were to live to the end
of her childbearing years and bear children in accordance with current age-specific fertility rates.
High fertility rates have a direct effect on women’s involvement in the labor market via less time
available for working (see for example, Bloom et al. 2009; Morrison et al. 2007; World Bank
2011). Regarding the proportion of women in total population, a higher proportion implies a larger
supply of women workers and therefore proportionately more women in the workforce.
Labor laws that discriminate against women vs. men can have significant impact on
women’s participation (relative to men’s) in the formal labor market. For instance, using firm-
level survey data for a cross-section of countries, Amin and Islam (2016) find that the share of
women in total workers among registered private firms is significantly higher in countries that
have implemented laws that prohibits discrimination against women in hiring practices. Islam et
al. (2019) reach a similar result for an overall measure of gender-based disparity in the laws.
Following this body of work, we control for an overall measure of disparity in the laws as they
apply to women vs. men in the area of starting a job. We control two additional variables for
disparity in the laws that we believe may alter the strength of the relationship between exports and
female workers. These variables are a dummy variable equal to 1 if women can work in the same
industries as men and 0 otherwise, and a dummy variable equal to 1 if women can work the same
night hours as men and 0 otherwise. Data for all the controls for legal gender disparity are from
Women, Business and Law (WBL), World Bank.

18
There is some indication in the literature that urbanization alters women’s position inside
and outside the household. More job opportunities, better access to education, lower fertility rates,
and more favorable attitudes towards women’s paid work are some of the channels through which
urbanization may positively impact women’s employment. Thus, we control for the percentage of
the country’s population living in urban areas (Urbanization). The data source for the variable is
WDI, World Bank.
Differences in fixed costs associated with different technologies, production methods,
degree of mechanization and automation imply that market size may play important role in the
choice of production technology and therefore the demand for female relative to male workers.
Thus, we control for market size proxied by the (log of) total population in the country taken from
WDI, World Bank. Last, we control for macroeconomic stability using the rate of inflation based
on the consumer price index as a proxy. The data source for the variable is WDI, World Bank.
3.5 Robustness controls
In the robustness section, we show that our main result of a positive and significant relationship
between exports and the share of female workers continues to hold with additional controls. Some
of these controls are not included in the baseline controls because they involve a noticeable decline
in sample size (missing data). Hence, we use them for robustness purposes only.
We argued above that women owners and top managers are less likely to discriminate
against women workers than men owners and top managers. Information on the gender of the top
manager is available in the ES but missing for about 15 percent of our baseline sample. Thus, our
first robustness control is a dummy variable equal to 1 if the top manager of the firm is a female
and 0 otherwise.

19
Next, we control for possible self-selection of female workers into less productive and less
dynamic firms. To control for firm productivity, we use labor productivity of the firm equal to (log
of) total sales of the firm (deflated to 2009 USD) in the last fiscal year divided by the total number
of workers employed at the end of last fiscal year (Labor Productivity). We complement this with
a dummy variable equal to 1 if the firm has an internationally recognized quality certificate and 0
otherwise (Quality Certificate). For less vs. more dynamic firms, we use as control the annual
growth rate of total employment at the firm over the last 3 fiscal years (Employment Growth).
Next, we include controls for digitization and ICT use, provision of training by the firm,
and expenses on security incurred by the firm. Greater digitization, use of computers and ICT is
considered to improve women’s chances to employment. Thus, we control for a dummy variable
equal to 1 if the firm has own website and 0 otherwise. In addition, since women tend to lag behind
men in education and technical skills in many parts of the developing world, provision of training
to employees by firms may be particularly attractive to women especially when informal networks
in the firm are male-dominated (see for example, Rowley 2013, Ragins and Sundstrom 1989).
Thus, we control for a dummy variable equal to 1 if the firm provides training to its workers and
0 otherwise. We argued above that more than men, women workers are concerned about the law
& order situation, crime and security. We complement the controls in the baseline for crime and
law order with a dummy variable equal to 1 if the firm spent on security (personnel, equipment,
etc.) during the last fiscal year and 0 otherwise.
While differences in GDP per capita across countries reflect long-term and structural
forces, the growth rate of GDP per capita in the recent past is a useful proxy measure of the current
state of demand in the labor market (see for example, Wamboye and Seguino 2014). Further,
compulsions of democracy may lead to force government to implement policies for better access

20
to jobs for women. Hence, we control for the annual real growth rate of real GDP per capita. The
data source for the variable is World Development Indicators, World Bank; and for the quality of
democracy proxied by the “Polity” index taken from the Polity IV database.
There are several ways in which more education for all (men and women) and especially
for women may improve women’s labor market outcomes. For example, improved access to
education for women is likely to add to their skills and also create awareness among them about
available opportunities in the labor markets; it raises the cost to women of staying home; more
educated women in society helps to change social attitudes towards women’s work, making
women’s labor market activity socially more acceptable; (World Bank 2011, Chioda et al. 2011,
Contrareras and Plaza 2010, Morrison et al. 2007). More education overall (among men and
women) can also result in a more favorable attitude towards women’s work and their rights. Thus,
we control for two measures related to access to education: gross enrollment rate in primary
education in the country, and the gender parity index for gross enrollment rate in primary
education. The data source for the variable is WDI, World Bank.
4. Estimation results
4.1 Base regression results
Our baseline regression results are provided in Table 1. For all the specifications considered, the
relationship between female workers and exports is large, positive and statistically significant at
the 1 percent level. The estimated coefficient value of exports ranges between 0.160 and 0.191.
Thus, for each percentage point increase in exports, the associated increase in female workers
equals 0.160 to 0.191 percentage points.
21
Without any other controls (except for year and country-industry fixed effects), the
estimated coefficient value of exports equals 0.169 (column 1). The coefficient value increases to
0.178 when we control for GDP per capita (not shown); it remains roughly unchanged equaling
0.180 when we also control for firm-size (column 2). Adding the remaining firm-level controls to
the previous specification causes the coefficient value to increase further to 0.191 (column 5). It
declines to 0.160 when we add all the remaining macro-level controls to the previous specification
(column 5).
Several controls show a significant relationship with female workers and in the expected
direction. Unless stated otherwise, all the relationships discussed in this paragraph are significant
at the 5 percent level or less. Greater competition as captured by lower values of the Herfindahl-
Hirschman index and higher values of the Starting a Business (DTF) measure is associated with a
significantly higher share of female workers. This is consistent with the general understanding in
the literature that greater competition forces managers to higher more females than they would do
otherwise. Greater gender parity in the laws as reflected in higher values of the WBL index is
associated with a significant increase in female workers, confirming some of the earlier findings
in the literature (discussed above). For the remaining macro-level controls, the share of female
workers is significantly higher in countries that are smaller (population wise) and in countries with
greater urbanization, larger share of females in total population, and lower fertility rates. The result
for country size should be treated with due caution as it disappears when we include additional
country-level controls (section 4.2). GDP per capita is also significantly positively correlated with
the share of female workers, but this relationship becomes insignificant when we control for some
of the other macro-level variables (column 5). Regarding firm-level controls, the share of female
workers is significantly higher in firms with a female owner vs. all male owners, in relatively large

22
firms, and for firms that report skills shortages to be a more severe obstacle; the share is
significantly lower for firms that are relatively old, experience more power outages, and for firms
that purchased fixed assets during the last year (significant at the 10 percent level).
4.2 Robustness for other controls
Starting with the final specification in Table 1, we now add sequentially more controls for
robustness purposes. Note that as a result, the sample size declines substantially (missing data).
The robustness results are provided in Table 2. Column 1 includes the controls for firms’ labor
productivity, sales growth rate, and having quality certificate. Controls for gender of the top
manager of the firm, legal form of the firm, and whether the firm spent on security in the last year
are introduced in column 2. Controls for having own website and provision of training to workers
are added in column 3. The remaining macro-level controls for the polity index, growth rate of
GDP per capita, gross enrollment rate in primary education, and the gender parity index in primary
education are added in column 4.
Our main result survives the robustness check. That is, the estimated coefficient value of
exports remains large, positive and significant (at the 5 percent level or less) when we include the
additional controls in the specification. It declines from 0.160 in the final baseline specification to
0.149 (column 4, Table 2) with all the additional controls included in the regression. However, this
decline seems to be due to the decline in sample size because of missing data on the additional
controls.

23
5. Interaction term results
In this section, we discuss the results for the interaction terms between exports and several other
variables including the dependence of sectors on female workers, level of competition in domestic
markets, social attitudes towards women’s work and rights, gender-based disparity in labor laws,
and law and order situation at the sub-national level.
A natural concern with the interaction term results is that the interaction terms could be picking up
the differential effect of exports on female employment in rich vs. poor countries. For instance,
social attitudes towards women’s work are likely to be correlated with income level (GDP per
capita). So, the interaction term between exports and social attitudes could simply be a proxy for
the interaction term between exports and overall economic development or GDP per capita. Hence,
we guard against this problem by controlling for the additional interaction term as controls. These
controls are the interaction terms between exports and GDP per capita, and between firm-size and
the variable that is interacted with exports (listed in the previous paragraph). For brevity, results
are shown only for the final baseline specification with and without controlling for the interaction
term controls. Regression results for the remaining baseline specifications are provided in the
online appendix (stated below).
5.1 Competition
Regression results for the interaction term between exports and the Herfindahl-Hirschman index
for the final baseline specification are provided in columns 1 and 2 of Table 3. Results for the
remaining baseline specifications are provided in Table A4 in the online appendix. To reiterate,
our expectation is that the positive impact of higher exports on the share of female workers due to
greater competition in international vs. domestic markets is larger when competition in the

24
domestic markets is low. Thus, a positive interaction term between exports and the Herfindahl-
Hirschman index is predicted.
The results in columns 1 and 2 of Table 3 and in Table A4 confirm the prediction. That is,
the interaction term between exports and the Herfindahl-Hirschman index is positive, large and
significant at the 5 percent level. Based on the results in column 1 in Table 3, each percentage
point increase in exports is associated with an increase of 0.099 percentage points in female
workers (significant at the 10 percent level) at the lowest value of the Herfindahl-Hirschman index
(highest domestic competition). The corresponding increase at the highest value of the Herfindahl-
Hirschman index (lowest domestic competition) is much larger at 0.872 percentage points
(significant at the 1 percent level).
Regression results for the interaction term between exports and Starting a Business are
provided in columns 3 and 4 of Table 3 and more detailed results are provided in Table A5 in the
online appendix. The prediction here is that the interaction term is negative reflecting the fact that
higher exports lead to a much larger increase in the share of female workers when domestic
competition is low (low values of Starting a Business). Regression results in Table 3 and Table A5
confirm this prediction. That is, the interaction term between exports and Starting a Business is
negative, large and significant at the 1 percent level. For instance, results for the final baseline
specification (column 3, Table 3) indicate that a one percentage point increase in exports is
associated with an increase of 0.398 percentage points (significant at the 1 percent level) in female
workers at the lowest value of Starting a Business (lowest domestic competition). The
corresponding increase at the highest value of Starting a Business (highest domestic competition)
equals a mere 0.066 percentage points, insignificant at the 10 percent level.
25
5.2 Dependence of sectors on female workers
Results for the interaction term between exports and the dependence of sectors on female workers
for the final baseline specification are provided in columns 5 and 6 of Table 3. More detailed
results are provided in Table A6 in the online appendix. As discussed above, our prediction is that
the sectors more dependent on female workers are more likely to benefit from higher exports in
terms of female employment.
Regression results in Table 3 and in Table A6 confirm the prediction. That is, the
interaction term between exports and the index for the dependence of sectors on female workers
is positive, large and statistically significant at the 10 percent level or less.2 For the results based
on the final baseline specification (column 5, Table 3), a one percentage point increase in exports
is associated with an increase in the share of female workers by 0.043 percentage points
(insignificant at the 10 percent level) in sectors least dependent on female workers. The
corresponding increase in sectors most dependent on female workers is much larger equaling 0.306
percentage points (significant at the 1 percent level).
5.3 Social attitudes towards women’s work and their rights
As discussed above, increase in demand for female workers (due to higher exports) is likely to
result in a larger increase in female workers when supply of female workers is forthcoming. This
is more likely to occur when social attitudes towards women’s work and their rights are more
favorable to women. Thus, we predict that the interaction term between exports and our proxy
measures of the social attitudes is positive.
2 The interaction term is significant at the 5 percent level in some specifications and at the 10 percent level in other specifications including the final baseline specification (see Table A6 in the online appendix).

26
Regression results for the interaction term between exports and social attitudes towards the
rights of women vs. men to scarce jobs are provided in columns 1 and 2 of Table 4 (for the final
baseline specification) and in Table A7 in the online appendix (all baseline specifications).
Likewise, results for the interaction term between exports and the rights of women vs. men in
general are provided in columns 3-4 in Table 4 and in Table A8 in the online appendix. Note that
all these results are based on a much smaller sample size due to missing data on social attitudes.
Thus, the results should be treated with due caution.
The results confirm our prediction above. That is, the interaction term between exports and
more favorable attitudes towards women’s work and women’s rights is positive, large and
significant at the 1 percent level. To provide an example, consider the results based on the final
baseline specification in column 1 of Table 4. A one percentage point increase in exports is
associated with a decrease in female workers by 0.472 percentage points (significant at the 5
percent level) when social attitudes towards women’s right to scarce jobs are least favorable for
women. The corresponding change in female workers when the attitude is most favorable for
women is an increase of 0.638 percentage points (significant at the 1 percent level).
5.4 Courts’ quality
Interaction term results between exports and the quality of courts functioning as perceived by the
firms and defined at the country-industry level (for each ES round separately) are provided in
columns 5 and 6 of Table 4 (final baseline specification) and the more detailed results are provided
in Table A9 in the online appendix. The prediction is that worse functioning courts, reflecting
worse law and order and less security for women, dampens the positive impact of exports on
female employment.

27
Regression results confirm the prediction. That is, the interaction term between exports and
courts obstacle is large, negative and significant at the 5 percent level in most specifications and
at the 10 percent level in one specification. Based on the results for the final baseline specification
(column 5, Table 4), a one percentage point increase in exports is associated with an increase in
female workers by 0.254 percentage points (significant at the 1 percent level) when courts
functioning is at its best. In contrast, when the functioning of courts is at its worst, the
corresponding change in female workers is a decline of 0.137 percentage points, insignificant at
the 10 percent level.
5.5 Legal gender disparity
Next, we consider the role of gender-based labor laws in enhancing or mitigating the positive
impact of exports on female employment. Results for the interaction term between exports and a
dummy variable equal to 1 if women can work night shifts like men and 0 otherwise are provided
in columns 1 and 2 of Table 5 (final baseline specification) and in Table A10 in online appendix
(all baseline specifications). Similarly, results for the interaction term between exports and a
dummy variable equal to 1 if women can work in the same industries as men and 0 otherwise are
provided in columns 3 and 4 of Table 5 (final baseline specification) and in Table A11 in online
appendix (all baseline specifications). We make one change in the specification from above. That
is, we now include as controls the interaction term between the WBL index and exports and
between the WBL index and firm-size. These interaction terms ensure that our results for the
gender-based labor laws are not spuriously picking up the effect of the broader gender-based
disparity in the laws related to the employment of women.

28
As discussed above, the prediction is that the interaction term between exports and the two
gender-based labor laws is positive, implying that exports increase female employment more when
labor laws do not hinder female relative to male employment. The regression results confirm this
prediction. That is, the interaction term between exports and the dummy for night work for women
is positive, large and significant at the 1 percent level in all the specifications considered. For
instance, for the final baseline specification, a one percentage point increase in exports is
associated with an increase in the share of female workers by 0.301 percentage points (significant
at the 1 percent level) when women can work in the same industries as men. The corresponding
increase in female workers when the women cannot work in the same industries as men is much
lower equaling 0.030 percentage points (insignificant at the 10 percent level).
The interaction term between exports and the dummy for women allowed to work in the
same industries as men is also large, positive and significant at the 1 percent level in the final
specifications (column 3 and 4, Table 5), significant at the 5 percent and 10 level in some of the
other specifications (see Table A11 in the online appendix). However, as can be seen from
column1 of Table A11, the interaction term is insignificant at the 10 percent level in the
specification with no other controls (except for year and country-industry fixed effects).
We also experimented by controlling for the interaction terms between exports and both
the gender specific labor laws simultaneously. However, this did not change the qualitative nature
of the results discussed above (see Table A12 in the online appendix).
5.6 All interaction terms simultaneously
Last, we include all the interaction terms discussed above simultaneously except that only one of
the competition variables (Herfindahl-Hirschman index and Starting a Business) is included at a

29
time. This is because the two competition variables are close substitutes and intended to capture
the same phenomenon. Table A13 and Table A14 in the online appendix provide the regression
results. The tables show that the qualitative nature of the results for the various interaction terms
discussed above remain unchanged.
6. Conclusion
Rapid globalization over the last few decades has brought numerous economic benefits. However,
it has also raised concerns about how vulnerable sections such as female workers are impacted.
Theory suggests that several avenues through trade may impact female workers, but these come
with important caveats. Empirical evidence on the issue is mixed. It is also limited, especially for
the case of developing countries. The present paper attempts to fill this gap in the literature. It does
so by using firm-level survey data for 91 (mostly) developing countries to estimate the relationship
between exporting activity and the share of females in total workers in firms. We pay close
attention to endogeneity concerns. We also test for several predictions of the theoretical models,
which helps raise our confidence against endogeneity concerns.
The results show that there is a large positive impact of higher exports (to sales ratio) on
the proportion of female workers. Further, consistent with theoretical predictions, this positive
relationship is much larger (more positive) in industries that rely more on female workers, in
country-industry pairs where domestic competition is low, in countries where social attitudes and
labor laws are more favorable towards women’s work, and when the law and order situation is
better.
Several questions remain to be answered. We highlight a few of them to motivate future
research in the area. First, our results show that exporting activity benefits females in terms of jobs,

30
but the impact on wages is not analyzed due to data limitations. The concern with female
employment is not only about the number of jobs but also the quality of jobs. Closing the gender
disparity gap requires not only more jobs for females but also better paying jobs. It will be
interesting to see how exporting activity impacts the wages of female relative to male workers.
Second, our analysis focused on the formal private sector. However, available evidence indicates
that more people work in the informal sector than the formal sector, especially females. Do the
interlinkages between the formal and informal sectors imply that exporting activity in the formal
sector affects job prospects of females in the informal sector? This is an important question that
remains to be answered. We hope that the present paper motivates future work in this area.

31
References Abraham, Vinoj and S.K. Sasikumar (2011), “Labor Cost and Export Behaviour of Firms in Indian Textile and Clothing Industry,” Economics, Management, and Financial Markets, 6(1): 258–282. Acs, Zoltan J. and David Audretsch (1988), “Innovation in Large and Small Firms: An Empirical Analysis,” American Economic Review, 78 (4): 678-690. ADB (2006), Asian Development Outlook 2006: Routes for Asia’s Trade, Manila: Asian Development Bank, ADB. Adhikari, Ratnakar and Yumiko Yamamoto (2007), “The Textile and Clothing Industry: Adjusting to the Post-quota World,” in Industrial Development for the 21st Century: Sustainable Development Perspectives edited volume, United Nations, pp: 183-234. Aguayo-Tellez, Ernesto, Jim Airola and Chinhui Juhn (2010), “Did Trade Liberalization Help Women? The Case of Mexico in the 1990s,” NBER Working Paper No. 16195. Alesina, Alberto and Romain Wacziarg (1998), “Openness, Country Size and Government,” Journal of Public Economics, 69(3): 305-321. Altonji, J. G. and R. M. Blank (1999), "Race and Gender in the Labor Market," Handbook of Labor Economics, Volume 3, Eds. O. Ashenfelter and D. Card. Amsterdam: Elsevier Science. Amin, M. and Soh, Y. C. (2020). Does Greater Regulatory Burden Lead to More Corruption? Evidence Using Firm-Level Survey Data for Developing Countries. Forthcoming World Bank Economic Review. https://doi.org/10.1093/wber/lhaa007 Amin, Mohammad and Asif Islam (2015), “Does Mandating Nondiscrimination in Hiring Practices Influence Women's Employment? Evidence Using Firm-level Data,” Feminist Economics, forthcoming Amin, Mohammad and Asif Islam (2014), “Imports of Intermediate Inputs and Country Size,” Applied Economics Letters, 21(11): 738-741. Antecol, Heather (2000), “An Examination of Cross-Country Differences in the Gender Gap in Labor Force Participation Rates,” Labour Economics, 7(4): 409-426. Aterido, R., Hallward-Driemeier, M., & Pages, C. (2011). Big Constraints to Small Firms' Growth? Business Environment and Employment Growth Across Firms. Economic Development and Cultural Change, 59 (3): 609 – 647. Ballington, J. (2008) “Equality in Politics: A Survey of Men and Women in Parliaments,” Inter-Parliamentary Union, Reports and Documents No. 54, p.31. Barth, Erling, and Harald Dale-Olsen (2009) “Monopolistic Discrimination, Worker Turnover, and the Gender Wage Gap” Labour Economics 16:589-597

32
Barro, R. and J. Lee (1994), “Sources of Economic Growth,” Carnegie-Rochester Series on Public Policy, 40(1): 1-46. Barwell, Ian (1996), “Transport and the Village: Findings from African Village-level Travel and Transport Surveys and Related Studies,” World Bank Discussion Paper 344. Africa Region Series. Washington, D.C.: World Bank. Becker, Gary S. (1957) The Economics of Discrimination. Chicago: University of Chicago Press. Beneria, L. (2003), “Global/Local Connections: Employment Patterns, Gender, and Informalization,” Chapter 4 in Gender, Development and Globalization: Economics as if All People Mattered. New York: Routledge. Berik, Günseli (2000), “Mature Export-Led Growth and Gender Wage Inequality in Taiwan,” Feminist Economics, 6(3): 1-26. Bhagwati, J. (2004), In Defense of Globalization. New York: Oxford University Press. Black, S., and E. Brainerd (2004), “Importing inequality? The Impact of Globalization on Gender Discrimination,” Industrial Labor Relations Review, 57(4): 540–559. Bloom, David E., David Canning, Günther Fink and Jocelyn E. Finlay (2009), “Fertility, Female Labor Force Participation and the Demographic Dividend,” Journal of Economic Growth, 14:79-101. Boal, William M, and Michael R Ransom. (1997). “Monopsony in the Labor Market.” Journal of Economic Literature, 35(1): 86–112 Bøler, E. A., Javorcik, B. and K. H. Ulltveit‐Moe (2018). “Working across time zones: Exporters and the gender wage gap,” Journal of International Economics, 111, 122‐133. Brush, C., N. Carter, E.J. Gatewood, P. Greene and M. Hart, (2006), Growth Oriented Women Entrepreneurs and Their Businesses (New Horizons in Entrepreneurship). Cheltenham, UK and Northampton, MA: Edward Elgar. Bussmann, Margit (2009), “The Effect of Trade Openness on Women‘s Welfare and Work Life,” World Development, 37(6), 1027-1038. Cagatay, N., and G. Berik (1990), “Transition to Export-led Growth in Turkey: Is There a Feminization of Employment?” Review of Radical Political Economics, 22(1): 115–34. Cagatay, N. and S. Ozler (1995), “Feminization of the Labour Force: The Effects of Long- Term Development and Structural Adjustment,” World Development, 23(11): 1883–94. Carter, Sara and Eleanor Shaw (2006), “Women’s Business Ownership: Recent Research and Policy Development,” Report to the Small Business Service, U.K.

33
Chen, Zhihong, Ying Ge, and Huiwen Lai Chi Wan (2013), “Globalization and Gender Wage Inequality in China,” World Development, 44: 256-266. Chioda, Laura, Rodrigo Garcia-Verdú, and Ana María Muñoz Boudet (2011), Work and Family: Latin American Women in Search of a New Balance. Office of the Chief Economist and Poverty Gender Group, LAC. Washington, DC: World Bank Cho, S-Y. (2010), "International Human Rights Treaty to Change Social Patterns – The Convention on the Elimination of All Forms of Discrimination against Women," Center for European, Governance and Economic Development Research. Discussion paper no. 93 Clark, Roger, Thomas W. Ramsbey, and Emily S. Adler (1991), “Culture, Gender, and Labor Force Participation: A Cross-National Study,” Gender and Society, 5:47-66. Cohen, Wesley M. and Steven Klepper (1996), “A Reprise of Size and R&D,” Economic Journal, 106(437): 925-951. Coleman, S. (2007), “The Role of Human and Financial Capital in the Profitability and Growth of Women-Owned Small Firms,” Journal of Small Business Management, 45(3):303-319. Contreras, Dante and Gonzalo Plaza (2010), “Cultural Factors in Women's Labor Force Participation in Chile,” Feminist Economics, 16(2): 27-46. Cooray, A., Gaddis, I. and Wacker, K. M. 2012. Globalization and Female Labor Force Participation in Developing Countries: An Empirical (Re-) Assessment. Courant Research Center, Discussion Paper 129. University of Göttingen. Díaz-Mayans, M. A. and Sánchez R. (2008), “Firm Size and Productivity in Spain: A Stochastic Frontier Analysis, Small Business Economics, 30(3): 315-323. Do, Quy-Toan, A. Levchenko and C. Raddatz (2011), “Engendering Trade,” Policy Research Working Paper No. 5777, World Bank, Washington DC. Dollar, David and Aart Kraay (2003), “Institutions, trade, and growth,” Journal of Monetary Economics, Volume 50, Issue 1, January 2003, Pages 133–162. Dollar, David and Roberta Gatti (1999), “Gender Inequality, Income, and Growth: Are Good Times Good for Women?” Working Paper Series No. 1, Policy Research Report on Gender and Development, World Bank, USA. Duflo, Esther (2003), “Grandmothers and Granddaughters: Old Age Pension and Intra-Household Allocation in South Africa,” World Bank Economic Review, 17(1): 1-25. Duflo, Esther (2005), “Gender Equality in Development,” BREAD Policy Paper No. 11, 2005.

34
Ederington, J., J. Minier and K. Troske (2010), “Where the Girls Are: Trade and Labor Market Segregation in Colombia,” University of Kentucky, Lexington, KY, USA. Elson, D. (1996), “Appraising Recent Developments in the World Market for Nimble Fingers” in A. Chachi and R. Pittin (eds.), Confronting State, Capital and Patriarchy: Women Organizing in the Process of Industrialization. Basingstoke: Macmillan. Elson, D. (1999), “Labor Markets as Gendered Institutions: Equality, Efficiency and Empowerment Issues”, World Development, 27(3): 611-627. Elson D, and R. Pearson (1981), “The Subordination of Women and the Internationalisation of Factory Production,” In Young K, C. Wolkowitz and R. McCullagh edited Of Marriage and the Market: Women’s Subordination in International Perspective, CSE Books: London. Fisman, R., & Svensson, J. (2007). Are Corruption and Taxation Really Harmful to Growth? Firm Level Evidence. Journal of Development Economics, 83 (1): 63 – 75. Frankel, Jeffrey A., and Davind Romer (1999), “Does Trade Cause Growth?” American Economic Review, 89(3): 379-399. Fussell, E. (2000), “Making Labor Flexible: The Recomposition of Tijuana’s Maquiladora Female Labor Force,” Feminist Economics, 6(3): 59–79. Gaddis, I. and J. Pieters (2012), “Trade Liberalization and Female Labor Force Participation: Evidence from Brazil,” IZA Discussion Paper No. 6809. Galor, O. and D. N. Weil (1996), “The Gender Gap, Fertility, and Growth,” American Economic Review, 86(3): 374–387. Ghani, Ejaz, Anandi Mani and Stephen O’Connell (2013), “Can Political Empowerment Help Economic Empowerment? Women Leaders and Female Labor Force Participation in India,” Working Paper No. 6675, World Bank, USA. Gladwin, Christina ed. (1991), Structural Adjustment and African Women Farmers, Gainsville, FL, University of Florida Press. Glaeser, E.L. and B.I. Sacerdote (1999), “Why Is There More Crime In Cities,” Journal of Political Economy, 107(S6): S225-S258. Goldin, Claudia (2006), “The Quiet Revolution that Transformed Women’s Employment, Education, and Family,” American Economic Review, 96(2): 1-21. Gray, Mark M., Miki Kittilson and Wayne Sandtholtz (2006), “Women and Globalization: A Study of 180 Countries, 1975-2000,” International Organization, 60: 239-333.

35
Hajj, M. and U. Panizza (2009), “Religion and Education Gender Gap: Are Muslims Different?” Economics of Education Review, 28: 337-344. Hallward-Driemeier, Mary, Tazeen Hasan and Anca Bogdana Rusu1 (2013), “Women’s Legal Rights over 50 Years: What Is the Impact of Reform?” Working Paper No. 6617, World Bank, USA. Hausmann, R., L. D. Tyson, and S. Zahidi (2006), The Global Gender Gap Report 2006, World Economic Forum, Geneva, Switzerland. Hellerstein, J., D. Neumark, and K. R. Troske. 2002. Market Forces and Sex Discrimination. Journal of Human Resources, 37(2): 353-380 Heyman, F., H. Svaleryd and J. Vlachos. 2013. Competition, Takeovers and Gender Discrimination. ILR Review, 66(2): 409-432. Irwin, Douglas and Marko Terviö (2002), “Does Trade Raise Income?: Evidence from the Twentieth Century,” Journal of International Economics, 58(1): 1–18. Islam, Asif, Muzi, Silvia & Amin, Mohammad (2019) Unequal Laws and the Disempowerment of Women in the Labour Market: Evidence from Firm-Level Data, The Journal of Development Studies, 55:5, 822-844. Islam, Asif (2013), “Is There a Gender Bias in Crime Against Firms in Developing Economies?” Women’s Studies International Forum, 37: 1-15. Joekes, S. (1995), “Trade-Related Employment for Women in Industry and Services in Developing Countries,” Occasional Paper 5, Geneva: United Nations Research Institute for Social Development. Juhn, Chinhui, Gergely Ujhelyi, Carolina Villegas-Sanchez (2014), “Men, Women, and Machines: How Trade Impacts Gender Inequality,” Journal of Development Economics, 106: 179-193. Kabeer, Naila and Simeen Mahmud (2004), “Globalization, Gender and Poverty: Bangladeshi Women Workers in Export and Local Markets,” Journal of International Development, 16: 93-109. Kasnakoglu, Z. and G. Dikbayir (1997), “Determinants of Women's Employment in Selected Sub Sectors of Turkish Manufacturing Industry,” METU Working Paper, Ankara, Turkey. Klasen, Stephan and Francesca Lamanna (2009), “The Impact of Gender Inequality in Education and Employment on Economic Growth: New Evidence for A Panel of Countries,” Feminist Economics, 15(3): 91-132. La Porta, Rafael, Florencio Lopez-de Silanes, Andrei Shleifer and Robert Vishny (1999), “The Quality of Government,” Journal of Law, Economics and Organization, 15(1): 222-79.

36
Lippe, Tanja van der and Liset van Dijk (2002), “Comparative Research on Women’s Employment,” Annual Review of Sociology, 28: 221-241. Meyer, Lisa B. (2006), “Trade Liberalization and Women‘s Integration into National Labor Markets: A Cross-Country Analysis.” Social Indicators Research, 75: 83-121. Morrison, Andrew, Dhushyanth Raju and Nishtha Sinha (2007), “Gender Equality, Poverty and Economic Growth,” Working Paper 4349, World Bank, USA. Muravyev, Alexander, Oleksandr Talavera and Dorothea Schäfer (2009), “Entrepreneurs’ Gender and Financial Constraints: Evidence from International Data,” Journal of Comparative Economics, 37(2): 270-286. Nelson, Robert L. and William P. Bridges (1999), Legalizing Gender Inequality: Courts, Markets, and Unequal Pay for Women in America, Cambridge University Press. Noguer, Mart and Marc Siscart (2005), “Trade Raises Income: A Precise and Robust Result,” Journal of International Economics, 65(2): 447-460. Ozler, S. (2000), “Export Orientation and Female Share of Employment: Evidence from Turkey,” World Development, 28(7): 1239–48. Pagano, Patrizio and Fabiano Schivardi (2003), “Firm Size Distribution and Growth,” The Scandinavian Journal of Economics, 105(2): 255-274. Pearson, Ruth (1995), “Male Bias and Women’s Work in Mexico’s Border Industries,” In Diane Elson (ed.) Male Bias in the Development Process, 2nd edition, pp. 133–63. Manchester, U.K.: Manchester University Press. Pearson, R. (1998), Feminist Visions of Development: Research Analysis and Policy. London and New York: Routeledge. Penner, Andrew M. and Harold J. Toro-Tulla (2010), Women in power and gender wage inequality: the case of small businesses, in Christine L. Williams, Kirsten Dellinger (ed.) Gender and Sexuality in the Workplace (Research in the Sociology of Work, Volume 20), Emerald Group Publishing Limited, pp.83-105. Pradhan, Jaya P. (2005), “How Do Trade, Foreign Investment, and Technology Affect Employment Patterns in Organized Indian Manufacturing?” Indian Journal of Labor Economics, 49(2): 249-272. Ragins, B. R. and E. Sundstrom (1989), “Gender and Power in Organisations,” Psychological Bulletin, 105: 51-88. Rendall, Mitchelle (2010), “Brain versus Brawn: The Realization of Women’s Comparative Advantage,” Mimeograph, University of Zurich.

37
Robb, Alicia, and John Wolken. 2002. “Firm, Owner, and Financing Characteristics: Differences between Female- and Male-Owned Small Businesses.” Finance and Economics Discussion Series Working Paper 2002-18, Board of Governors of the Federal Reserve System, Washington, DC. Rocha and Winkler (2019), “Trade and Female Labor Participation,” Policy Research Working Paper 9098, World Bank, Washington, DC. Rowley, Chris (2013), “What Might Influence Female Manager Careers Success?” Mimeograph, Cass Business School, City University London. Sabarwal, Shwetlana and Katherine Terrell (2008), “Does Gender Matter for Firm Performance? Evidence from Eastern Europe and Central Asia,” World Bank Working Paper Series No. 4705, World Bank, USA. Seguino, Stephanie (1997), “Export-Led Growth and the Persistence of Gender Inequality in the Newly Industrialized Countries,” in Janet Rives and Mahmood Youse. (eds.) Economic Dimensions of Gender Inequality: A Global Perspective, pp. 1–33. Westport, CT: Greenwood Press. Seguino, Stephanie (2000), “Accounting for Gender in Asian Economic Growth,” Feminist Economics, 6:3, 27-58. Söderbom, Måns, and Francis Teal (2004), “Size and Efficiency in African Manufacturing Firms: Evidence from Firm‐Level Panel Data,” Journal of Development Economics, 73 (February): 369–94. Seker, Murat (2012), “Importing, Exporting, and Innovation in Developing Countries,” Review of International Economics, 20(2): 299-314. Spieldoch, A. (2004), “Women’s Rights and the Multilateral Trading System: The Politics of Gender Mainstreaming at the WTO,” Heinrich Boell Foundation (HBF) and IGTN. Standing, G. (1989), “Global Feminization through Flexible Labor,” World Development, 17 (7), 1077-1095. Thomas, Duncan (1990), “Intrahousehold Resource Allocation: An Inferential Approach,” Journal of Human Resources, 25: 635-64. Tzannatos, Zafiris (1999), “Women and Labor Market Changes in the Global Economy.” World Development, 27(3): 551-70. UNIDO (1993), “Women in Manufacturing: Participation Patterns, Determinants and Trends,” Unit for the Integration of Women in Industrial Development, United Nations.

38
United Nations (2009), “A Bird Cannot Fly With Just One Wing: Towards a Gender-Balanced Trading System,” Expert Meeting on Mainstreaming Gender in Trade Policy. The paper is available at http://unctad.org/sections/wcmu/docs/ciem2p04_en.pdf United Nations (2011), “Gender Equality & Trade Policy,” Resource Paper 2011. United Nations Inter-Agency Network on Women and Gender Equality (ANWGE). The paper is available at: http://www.un.org/womenwatch/feature/trade/gender_equality_and_trade_policy.pdf Wamboye, E. F. and S. Seguino (2014), “Gender Effects of Trade Openness in Sub-Saharan Africa,” Feminist Economics, forthcoming. Webber, Douglas A. 2016. “Firm-Level Monopsony and the Gender Pay Gap.” Industrial Relations: A Journal of Economy and Society, 55(2): 323–345.
Weichselbaumer, Doris and Rudolf Winter-Ebmer (2007), “The Effects of Competition and Equal Treatment Laws on the Gender Wage Differential,” Economic Policy, April 2007: 235-287. Wood, Adrian (1991), “North-South Trade and Female Labor in Manufacturing: An Asymmetry,” Journal of Development Studies, 27(2): 168-189. World Bank (2011), Gender Equality and Development, World Development Report 2012, World Bank, Washington DC. World Bank (2020), Women and Trade: The Role of Trade in Promoting Gender Equality, World Bank, Washington DC.

39
Table 1: Base regression results Dependent variable: Female Workers
(1) (2) (3) (4) (5) (6)
Exports (%, cell average) 0.169*** 0.180*** 0.166*** 0.171*** 0.191*** 0.160*** (0.058) (0.057) (0.060) (0.061) (0.064) (0.054)
No. of Workers (logs)
0.547** 0.714*** 0.753*** 0.916*** 0.926*** (0.244) (0.258) (0.280) (0.293) (0.294)
GDP per capita (logs)
14.162*** 14.390*** 16.082*** 15.807*** 5.808 (5.166) (5.369) (5.393) (5.801) (5.811)
Herfindahl-Hirschman Index
-6.588* -5.237 -9.126** -6.158* (3.459) (3.504) (4.085) (3.700)
Age of Firm (logs)
-0.524 -0.913*** -0.689* -0.843** (0.359) (0.341) (0.364) (0.360)
Foreign Ownership (proportion)
-0.940 -0.181 0.006 0.085
(0.845) (0.879) (0.969) (0.961)
Female Ownership Y:1 N:0
6.169*** 5.972*** 5.939*** (0.615) (0.650) (0.651)
Skills Obstacle (0-4)
0.625*** 0.699*** 0.656** (0.228) (0.270) (0.270)
How Much Of An Obstacle: Transport?
-0.031 0.022 -0.007
(0.193) (0.209) (0.209)
Firm Purchased Fixed Assets Y:1 N:0
-0.955* -1.096* -1.061*
(0.526) (0.560) (0.557)
Power Outages (days)
-0.176** -0.155** (0.070) (0.068)
Courts Obstacle (cell average)
0.100 -0.486
(0.777) (0.743)
Crime Losses Y:1 N:0
-0.603 -0.657 (0.667) (0.669)
Firm Inspected Y:1 N:0
-0.824 -0.879 (0.606) (0.606)
How Much Of An Obstacle: Tax Rates
-0.209 -0.251
(0.231) (0.229)
How Much Of An Obstacle: Labor Regulations?
0.012 0.031
(0.301) (0.301)
Population (logs)
-38.758*** (10.891)

40
Urbanization (%)
1.682*** (0.422)
WBL Index
17.365** (8.736)
Women can work the same night hours as men Y:1 N:0
2.816
(2.830)
Women can work in the same industries as men Y:1 N:0
-1.293
(2.066)
Ratio of Female to Male Population
2.502***
(0.567)
Fertility Rate
-16.125*** (3.677)
Starting a Business (DTF)
0.079** (0.039)
Inflation (%)
0.057 (0.065)
Year fixed effects Yes Yes Yes Yes Yes Yes Country-Industry fixed effects
Yes Yes Yes Yes Yes Yes
Constant 28.879*** -93.348** -94.276** -113.860** -110.443** 417.745** (1.998) (44.156) (46.013) (46.173) (49.689) (172.440)
Number of observations 44,539 44,539 43,616 41,444 36,944 36,944 R-squared 0.476 0.477 0.483 0.501 0.510 0.513 Standard errors in brackets. All standard errors are Huber-White robust and clustered on country-times-industry. Sample size varies due to missing data.

41
Table 2: Robustness for other controls Dependent variable: Female Workers
(1) (2) (3) (4)
Exports (%, cell average) 0.189*** 0.154** 0.138** 0.149** (0.059) (0.063) (0.066) (0.068)
No. of Workers (logs) 0.959*** 1.182*** 0.812** 0.917** (0.344) (0.392) (0.411) (0.415)
Herfindahl-Hirschman Index -1.344 -12.534** -11.431** -7.554 (3.792) (5.142) (5.708) (5.838)
Age of Firm (logs) -1.518*** -1.367*** -1.421*** -1.513*** (0.477) (0.507) (0.515) (0.519)
Foreign Ownership (proportion) -0.458 0.720 0.750 0.731
(1.163) (1.443) (1.475) (1.484)
Female Ownership Y:1 N:0 6.504*** 3.947*** 3.876*** 4.020*** (0.740) (0.766) (0.790) (0.799)
Skills Obstacle (0-4) 0.791*** 0.832*** 0.827** 0.795** (0.301) (0.311) (0.322) (0.332)
How Much Of An Obstacle: Transport?
-0.028 0.005 0.009 0.030
(0.232) (0.268) (0.272) (0.278)
Firm Purchased Fixed Assets Y:1 N:0
-0.580 -0.745 -0.718 -0.928
(0.600) (0.620) (0.635) (0.637)
Power Outages (days) -0.129* -0.066 -0.065 -0.049 (0.074) (0.085) (0.086) (0.087)
Courts Obstacle (cell average) -0.299 -0.395 -0.339 -0.314
(0.900) (0.950) (0.974) (1.066)
Crime Losses Y:1 N:0 -1.179 -2.207** -2.301** -1.995** (0.813) (0.925) (0.931) (0.955)
Firm Inspected Y:1 N:0 -0.814 -0.859 -0.734 -0.552 (0.659) (0.693) (0.703) (0.711)
How Much Of An Obstacle: Tax Rates
-0.279 -0.305 -0.297 -0.314
(0.257) (0.263) (0.271) (0.280)
How Much Of An Obstacle: Labor Regulations?
0.080 0.061 0.009 0.089
(0.333) (0.358) (0.366) (0.371)
GDP per capita (logs) 1.201 3.400 5.696 7.525 (6.818) (8.539) (8.715) (10.362)
Population (logs) -42.358*** 3.824 5.107 3.793 (12.527) (23.050) (23.512) (30.625)

42
Urbanization (%) 2.141*** 1.306* 1.400* 1.189 (0.492) (0.755) (0.762) (0.808)
WBL Index 12.840 5.369 6.806 9.124 (8.897) (11.969) (11.956) (12.614)
Women can work the same night hours as men Y:1 N:0
3.770 -3.051 -2.936 -3.790
(3.457) (4.147) (4.105) (4.175)
Women can work in the same industries as men Y:1 N:0
-0.319 -4.090 -4.243 -3.966
(2.323) (2.741) (2.785) (3.024)
Ratio of Female to Male Population 2.739*** 9.206 10.477 9.140
(0.712) (6.852) (7.043) (7.425)
Fertility Rate -16.438*** 2.041 3.243 4.626 (4.520) (4.315) (4.408) (4.740)
Starting a Business (DTF) 0.108** 0.056 0.071 0.024 (0.046) (0.063) (0.064) (0.079)
Inflation (%) -0.012 -0.084 -0.084 -0.090 (0.073) (0.071) (0.072) (0.079)
Labor Productivity (in 2009 USD, logs)
-0.316 -0.522* -0.598** -0.585*
(0.256) (0.292) (0.299) (0.303) Quality Certificate Y:1 N:0 0.857 0.768 0.269 -0.042
(0.880) (0.890) (0.911) (0.936) Employment Growth (%) -0.052*** -0.050*** -0.051*** -0.050***
(0.016) (0.018) (0.017) (0.018)
Legal form of the firm fixed effects
Yes Yes Yes
(2.513) (2.570) (2.629)
Firms' Top Manger is Female Y:1 N:0
8.659*** 8.694*** 8.703***
(1.029) (1.026) (1.055)
Firm Spent on Security Y:1 N:0
0.012 0.011 0.012
(0.007) (0.008) (0.008)
Firm Has Own Website Y:1 N:0
1.601* 1.279
(0.854) (0.857)
Firm Provides Training to Workers Y:1 N:0
1.266* 1.506*
(0.751) (0.771)
Polity index
1.461

43
(1.189)
Real growth rate of GDP per capita
0.197
(0.160)
Primary Enrollment (Gross, %)
-0.011
(0.177)
Primary Enrollment (Gross, %): Gender Parity Index
34.610
(44.324)
Year fixed effects Yes Yes Yes Yes Country-Industry fixed effects Yes Yes Yes Yes
Constant 481.765** -603.977 -716.956 -676.810 (201.234) (651.132) (668.326) (786.331)
Number of observations 29,279 24,966 23,890 23,635 R-squared 0.536 0.551 0.552 0.551 Standard errors in brackets. All standard errors are Huber-White robust and clustered on country-times-industry. Sample size varies due to missing data.
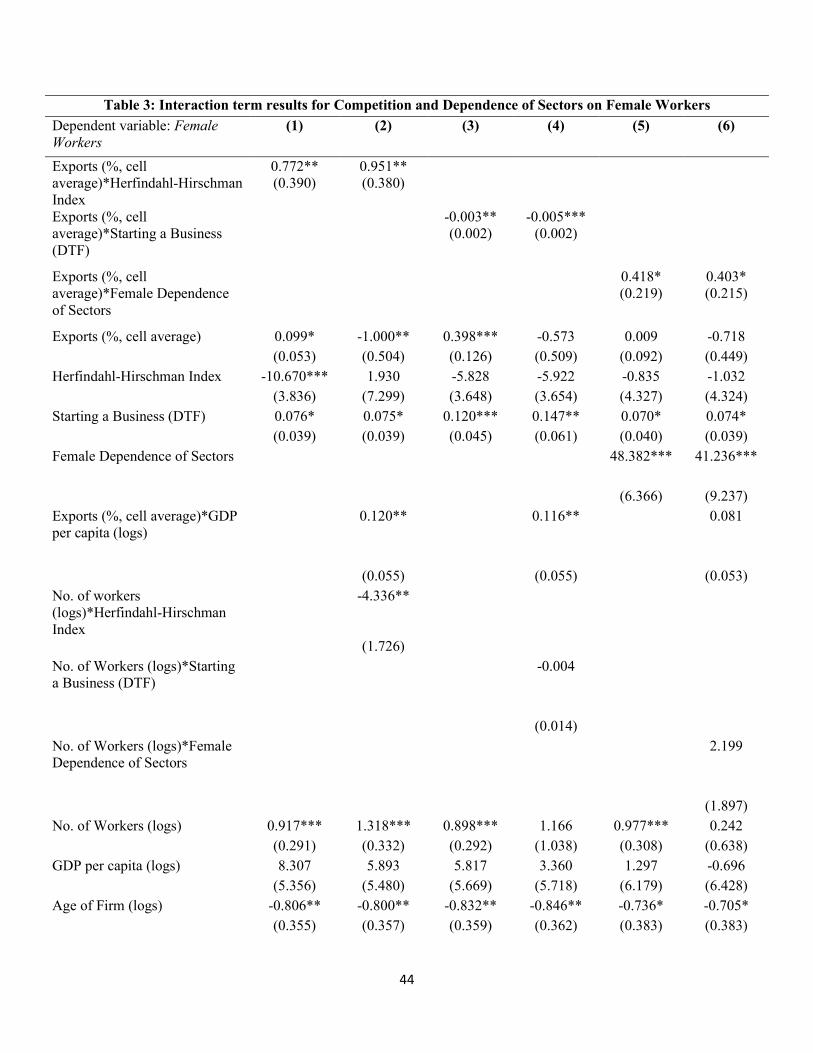
44
Table 3: Interaction term results for Competition and Dependence of Sectors on Female Workers Dependent variable: Female Workers
(1) (2) (3) (4) (5) (6)
Exports (%, cell average)*Herfindahl-Hirschman Index
0.772** (0.390)
0.951** (0.380)
Exports (%, cell average)*Starting a Business (DTF)
-0.003** (0.002)
-0.005*** (0.002)
Exports (%, cell average)*Female Dependence of Sectors
0.418* (0.219)
0.403* (0.215)
Exports (%, cell average) 0.099* -1.000** 0.398*** -0.573 0.009 -0.718 (0.053) (0.504) (0.126) (0.509) (0.092) (0.449)
Herfindahl-Hirschman Index -10.670*** 1.930 -5.828 -5.922 -0.835 -1.032 (3.836) (7.299) (3.648) (3.654) (4.327) (4.324)
Starting a Business (DTF) 0.076* 0.075* 0.120*** 0.147** 0.070* 0.074* (0.039) (0.039) (0.045) (0.061) (0.040) (0.039)
Female Dependence of Sectors
48.382*** 41.236***
(6.366) (9.237)
Exports (%, cell average)*GDP per capita (logs)
0.120**
0.116**
0.081
(0.055)
(0.055)
(0.053)
No. of workers (logs)*Herfindahl-Hirschman Index
-4.336**
(1.726)
No. of Workers (logs)*Starting a Business (DTF)
-0.004
(0.014)
No. of Workers (logs)*Female Dependence of Sectors
2.199
(1.897)
No. of Workers (logs) 0.917*** 1.318*** 0.898*** 1.166 0.977*** 0.242 (0.291) (0.332) (0.292) (1.038) (0.308) (0.638)
GDP per capita (logs) 8.307 5.893 5.817 3.360 1.297 -0.696 (5.356) (5.480) (5.669) (5.718) (6.179) (6.428)
Age of Firm (logs) -0.806** -0.800** -0.832** -0.846** -0.736* -0.705* (0.355) (0.357) (0.359) (0.362) (0.383) (0.383)
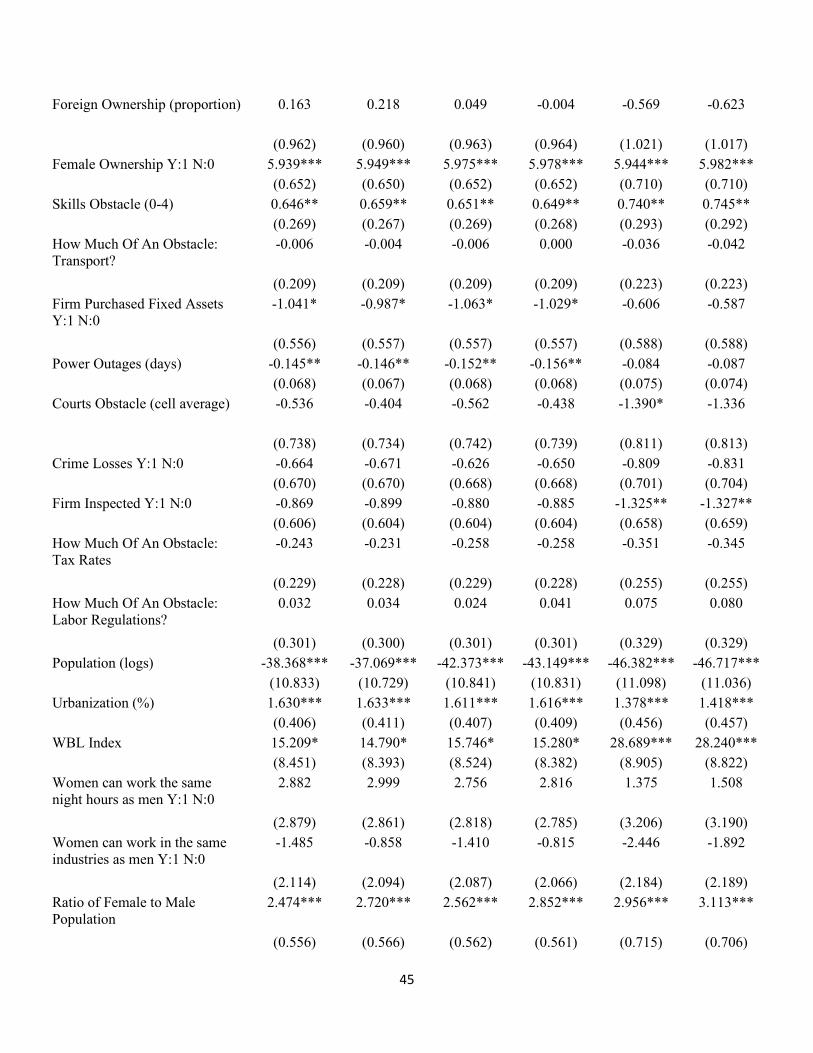
45
Foreign Ownership (proportion) 0.163 0.218 0.049 -0.004 -0.569 -0.623
(0.962) (0.960) (0.963) (0.964) (1.021) (1.017)
Female Ownership Y:1 N:0 5.939*** 5.949*** 5.975*** 5.978*** 5.944*** 5.982*** (0.652) (0.650) (0.652) (0.652) (0.710) (0.710)
Skills Obstacle (0-4) 0.646** 0.659** 0.651** 0.649** 0.740** 0.745** (0.269) (0.267) (0.269) (0.268) (0.293) (0.292)
How Much Of An Obstacle: Transport?
-0.006 -0.004 -0.006 0.000 -0.036 -0.042
(0.209) (0.209) (0.209) (0.209) (0.223) (0.223)
Firm Purchased Fixed Assets Y:1 N:0
-1.041* -0.987* -1.063* -1.029* -0.606 -0.587
(0.556) (0.557) (0.557) (0.557) (0.588) (0.588)
Power Outages (days) -0.145** -0.146** -0.152** -0.156** -0.084 -0.087 (0.068) (0.067) (0.068) (0.068) (0.075) (0.074)
Courts Obstacle (cell average) -0.536 -0.404 -0.562 -0.438 -1.390* -1.336
(0.738) (0.734) (0.742) (0.739) (0.811) (0.813)
Crime Losses Y:1 N:0 -0.664 -0.671 -0.626 -0.650 -0.809 -0.831 (0.670) (0.670) (0.668) (0.668) (0.701) (0.704)
Firm Inspected Y:1 N:0 -0.869 -0.899 -0.880 -0.885 -1.325** -1.327** (0.606) (0.604) (0.604) (0.604) (0.658) (0.659)
How Much Of An Obstacle: Tax Rates
-0.243 -0.231 -0.258 -0.258 -0.351 -0.345
(0.229) (0.228) (0.229) (0.228) (0.255) (0.255)
How Much Of An Obstacle: Labor Regulations?
0.032 0.034 0.024 0.041 0.075 0.080
(0.301) (0.300) (0.301) (0.301) (0.329) (0.329)
Population (logs) -38.368*** -37.069*** -42.373*** -43.149*** -46.382*** -46.717*** (10.833) (10.729) (10.841) (10.831) (11.098) (11.036)
Urbanization (%) 1.630*** 1.633*** 1.611*** 1.616*** 1.378*** 1.418*** (0.406) (0.411) (0.407) (0.409) (0.456) (0.457)
WBL Index 15.209* 14.790* 15.746* 15.280* 28.689*** 28.240*** (8.451) (8.393) (8.524) (8.382) (8.905) (8.822)
Women can work the same night hours as men Y:1 N:0
2.882 2.999 2.756 2.816 1.375 1.508
(2.879) (2.861) (2.818) (2.785) (3.206) (3.190)
Women can work in the same industries as men Y:1 N:0
-1.485 -0.858 -1.410 -0.815 -2.446 -1.892
(2.114) (2.094) (2.087) (2.066) (2.184) (2.189)
Ratio of Female to Male Population
2.474*** 2.720*** 2.562*** 2.852*** 2.956*** 3.113***
(0.556) (0.566) (0.562) (0.561) (0.715) (0.706)

46
Fertility Rate -14.636*** -13.769*** -15.971*** -15.471*** -15.366*** -14.999*** (3.089) (2.959) (3.466) (3.372) (4.758) (4.767)
Inflation (%) 0.041 0.030 0.053 0.046 0.054 0.051 (0.063) (0.062) (0.063) (0.063) (0.065) (0.065)
Year fixed effects Yes Yes Yes Yes Yes Yes Country-Industry fixed effects Yes Yes Yes Yes Yes Yes
Constant 391.879** 374.651** 474.786*** 489.949*** 546.231*** 559.370*** (170.766) (168.749) (172.119) (172.173) (174.131) (173.806)
Number of observations 36,944 36,944 36,944 36,944 27,366 27,366 R-squared 0.514 0.514 0.513 0.514 0.523 0.524 Standard errors in brackets. All standard errors are Huber-White robust and clustered on country-times-industry. Sample size varies due to missing data.

47
Table 4: Interaction term results for social attitudes towards women and law & order situation Dependent variable: Female Workers
(1) (2) (3) (4) (5) (6)
Exports (%, cell average)*Men have more right to scarce job (WVS)
0.624*** (0.215)
0.610*** (0.209)
Exports (%, cell average)*Women & men have same rights (WVS, 20 yr. average)
0.345*** (0.099)
0.278*** (0.099)
Exports (%, cell average)*Courts Obstacle (cell average)
-0.098** (0.046)
-0.087* (0.046)
Exports (%, cell average)
-1.177*** (0.445)
-1.238* (0.739)
-2.822*** (0.826)
-3.212*** (0.939)
0.253*** (0.068)
-0.239 (0.528)
Courts Obstacle (cell average)
-1.080 (1.471)
-1.081 (1.466)
-0.599 (1.034)
-0.494 (1.040)
0.353 (0.833)
0.501 (1.413)
Exports (%, cell average)*GDP per capita (logs)
0.009
(0.071)
0.102
(0.076)
0.053
(0.056)
No. of Workers (logs)*Women & men have same rights (WVS, 20 yr. average)
0.175
(0.459)
No. of Workers (logs)*Men have more right to scarce jobs (WVS)
-1.949** (0.858)
No. of Workers (logs)*Courts Obstacle (cell average)
-0.056 (0.359)
No. of Workers (logs) 1.151*** 5.168*** 0.671** -0.781 0.926*** 0.992** (0.398) (1.826) (0.329) (3.744) (0.294) (0.475)

48
Herfindahl-Hirschman Index (HHI)
-11.004 -11.442 -4.669 -5.691 -6.664* -6.700*
(6.920) (7.321) (4.247) (4.356) (3.627) (3.655)
Age of Firm (logs) -0.874** -0.842* -0.164 -0.151 -0.864** -0.870** (0.437) (0.435) (0.436) (0.433) (0.361) (0.362)
Foreign Ownership (proportion)
2.175* 2.309* 1.698 1.707 0.071 0.055
(1.204) (1.193) (1.118) (1.117) (0.959) (0.960)
Female Ownership Y:1 N:0
5.267*** 5.206*** 5.457*** 5.443*** 5.945*** 5.937***
(0.771) (0.776) (0.720) (0.717) (0.650) (0.652) Skills Obstacle (0-4) 0.398 0.405 0.502 0.498 0.658** 0.657**
(0.387) (0.386) (0.349) (0.348) (0.269) (0.269) How Much Of An Obstacle: Transport?
-0.254 -0.251 -0.051 -0.040 -0.013 -0.009
(0.300) (0.299) (0.274) (0.276) (0.209) (0.209)
Firm Purchased Fixed Assets Y:1 N:0
-0.520 -0.482 -0.650 -0.619 -1.046* -1.033*
(0.819) (0.818) (0.671) (0.673) (0.557) (0.558)
Power Outages (days) -0.205* -0.192* -0.074 -0.072 -0.153** -0.156** (0.105) (0.106) (0.082) (0.083) (0.068) (0.068)
Crime Losses Y:1 N:0 -1.432 -1.378 -1.285* -1.299* -0.670 -0.679 (0.910) (0.908) (0.733) (0.734) (0.668) (0.668)
Firm Inspected Y:1 N:0
-0.564 -0.552 -0.190 -0.188 -0.875 -0.879
(0.849) (0.850) (0.754) (0.752) (0.605) (0.605) How Much Of An Obstacle: Tax Rates
-0.415 -0.426 -0.448 -0.438 -0.254 -0.252
(0.321) (0.322) (0.276) (0.275) (0.229) (0.229)
How Much Of An Obstacle: Labor Regulations?
-0.193 -0.173 -0.082 -0.076 0.041 0.051
(0.401) (0.399) (0.360) (0.359) (0.300) (0.300)
GDP per capita (logs) -38.168*** -42.889*** -20.342** -21.450*** 6.526 5.296 (9.297) (10.036) (8.271) (8.223) (5.760) (5.807)
Population (logs) -46.729 -57.415 -100.948*** -94.482*** -37.758*** -37.641*** (40.569) (40.654) (36.755) (36.360) (10.909) (10.849)
Urbanization (%) -1.699 -1.623 -1.582** -1.486** 1.709*** 1.723*** (1.360) (1.355) (0.745) (0.736) (0.423) (0.427)
WBL Index -5.633 -0.854 17.887 17.764 16.988* 17.157** (12.997) (13.437) (11.050) (10.931) (8.755) (8.677)
Women can work the same night hours as men
-26.481*** -24.642*** 1.877 1.469 2.962 2.967
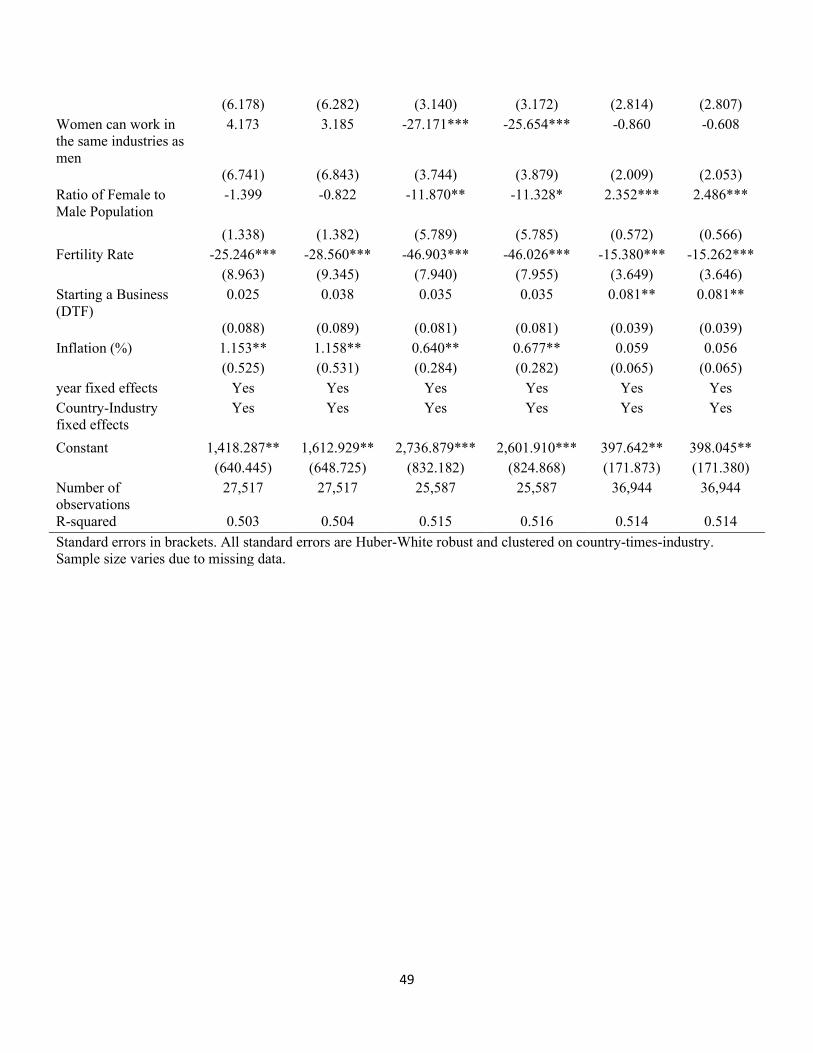
49
(6.178) (6.282) (3.140) (3.172) (2.814) (2.807)
Women can work in the same industries as men
4.173 3.185 -27.171*** -25.654*** -0.860 -0.608
(6.741) (6.843) (3.744) (3.879) (2.009) (2.053)
Ratio of Female to Male Population
-1.399 -0.822 -11.870** -11.328* 2.352*** 2.486***
(1.338) (1.382) (5.789) (5.785) (0.572) (0.566)
Fertility Rate -25.246*** -28.560*** -46.903*** -46.026*** -15.380*** -15.262*** (8.963) (9.345) (7.940) (7.955) (3.649) (3.646)
Starting a Business (DTF)
0.025 0.038 0.035 0.035 0.081** 0.081**
(0.088) (0.089) (0.081) (0.081) (0.039) (0.039) Inflation (%) 1.153** 1.158** 0.640** 0.677** 0.059 0.056
(0.525) (0.531) (0.284) (0.282) (0.065) (0.065) year fixed effects Yes Yes Yes Yes Yes Yes Country-Industry fixed effects
Yes Yes Yes Yes Yes Yes
Constant 1,418.287** 1,612.929** 2,736.879*** 2,601.910*** 397.642** 398.045** (640.445) (648.725) (832.182) (824.868) (171.873) (171.380)
Number of observations
27,517 27,517 25,587 25,587 36,944 36,944
R-squared 0.503 0.504 0.515 0.516 0.514 0.514 Standard errors in brackets. All standard errors are Huber-White robust and clustered on country-times-industry. Sample size varies due to missing data.

50
Table 5: Interaction term results for gender-based laws
Dependent variable: Female Workers (1) (2) (3) (4)
Exports (%, cell average)*Women can work the same night hours as men Y:1 N:0
0.318*** (0.091)
0.305*** (0.095)
Exports (%, cell average)*Women can work in the same industries as men Y:1 N:0
0.272*** (0.100)
0.280*** (0.098)
Exports (%, cell average) -0.128 (0.083)
-0.626 (0.535)
0.03 (0.055)
-0.723 (0.507)
Women can work the same night hours as men Y:1 N:0
0.503 (2.945)
-0.971 (3.954)
Women can work in the same industries as men Y:1 N:0
-4.652* (2.459)
-3.746 (3.127)
Exports (%, cell average)*GDP per capita (logs)
0.065
(0.078)
0.096
(0.072) Exports (%, cell average)*WBL Index
-0.112 (0.392)
-0.165 (0.370)
No. of Workers (logs)*Women can work the same night hours as men Y:1 N:0
0.445
(0.726)
No. of Workers (logs)*Women can work in the same industries as men Y:1 N:0
-0.202 (0.529)
No. of Workers (logs)*WBL Index
-3.368* (1.732)
-2.942* (1.712)
No. of Workers (logs) 0.902*** (0.291)
2.887** (1.271)
0.916*** (0.290)
3.066** (1.225)
GDP per capita (logs) 5.876 4.791 7.974 6.291
(5.710) (5.74) (5.494) (5.524) Herfindahl-Hirschman Index -5.197 -5.022 -7.021** -6.775*
(3.662) (3.709) (3.446) (3.482) Age of Firm (logs) -0.833** -0.831** -0.834** -0.834**
(0.358) (0.359) (0.355) (0.358) Foreign Ownership (proportion) 0.103
(0.961) 0.130
(0.962) 0.183
(0.961) 0.218
(0.961) Female Ownership Y:1 N:0 5.975*** 5.987*** 5.905*** 5.890***
(0.652) (0.654) (0.652) (0.653) Skills Obstacle (0-4) 0.636** 0.636** 0.625** 0.622**
(0.269) (0.269) (0.270) (0.269) How Much Of An Obstacle: Transport? -0.011 -0.016 -0.01 -0.012
(0.209) (0.209) (0.209) (0.209) Firm Purchased Fixed Assets Y:1 N:0 -1.031* -0.994* -1.042* -0.999*
(0.556) (0.558) (0.557) (0.558)

51
Power Outages (days) -0.154** -0.155** -0.151** -0.152** (0.068) (0.068) (0.067) (0.068)
Courts Obstacle (cell average) -0.454 -0.422 -0.644 -0.558 (0.739) (0.737) (0.740) (0.739)
Crime Losses Y:1 N:0 -0.633 -0.672 -0.688 -0.703 (0.669) (0.674) (0.671) (0.672)
Firm Inspected Y:1 N:0 -0.847 -0.822 -0.811 -0.78 (0.603) (0.604) (0.603) (0.604)
How Much Of An Obstacle: Tax Rates -0.253 -0.264 -0.257 -0.269 (0.229) (0.23) (0.229) (0.228)
How Much Of An Obstacle: Labor Regulations?
0.036 (0.301)
0.051 (0.300)
0.034 (0.301)
0.057 (0.300)
Population (logs) -35.364*** -35.099*** -35.761*** -35.328*** (10.96) (11.115) (10.819) (10.887)
Urbanization (%) 1.673*** 1.642*** 1.857*** 1.840*** (0.415) (0.405) (0.399) (0.391)
WBL Index 17.580** 29.339** 17.226** 28.064** (8.651) (11.496) (8.478) (11.187)
Women can work in the same industries as men Y:1 N:0
-2.120 (2.049)
-1.808 (2.127)
Women can work the same night hours as men Y:1 N:0
3.258
(2.973) 3.246
(2.949)
Ratio of Female to Male Population 3.454*** 3.508*** 2.614*** 2.680*** (0.693) (0.708) (0.587) (0.619)
Fertility Rate -15.658*** -15.345*** -15.721*** -15.204*** (3.56) (3.521) (3.33) (3.275)
Starting a Business (DTF) 0.066* 0.064* 0.062 0.061 (0.039) (0.039) (0.039) (0.039)
Inflation (%) 0.068 0.071 0.059 0.059 (0.064) (0.065) (0.062) (0.064)
Year fixed effects Yes Yes Yes Yes Country-Industry fixed effects Yes Yes Yes Yes Constant 315.970* 312.122* 336.227* 331.879*
(174.209) (179.319) (171.634) (174.104) Number of observations 36,944 36,944 36,944 36,944
R-squared 0.514 0.514 0.514 0.515 Standard errors in brackets. All standard errors are Huber-White robust and clustered on country-times-industry. Sample size varies due to missing data.

52
Online Appendix
Table A1: Countries included in the baseline sample Afghanistan Gambia, The Nigeria Albania Georgia Pakistan Angola Ghana Panama Argentina Guatemala Paraguay Armenia Guinea Peru Azerbaijan Honduras Philippines Bangladesh Hungary Poland Belarus Indonesia Romania Benin Kazakhstan Russian Federation Bhutan Kenya Rwanda Bolivia Kosovo Senegal Bosnia and Herzegovina Kyrgyz Republic Serbia Botswana Lao PDR Sierra Leone Bulgaria Latvia Slovak Republic Burundi Lesotho Slovenia Cambodia Liberia Tajikistan Cameroon Lithuania Tanzania Chad North Macedonia Timor-Leste Chile Madagascar Togo Colombia Malawi Turkey Congo, Dem. Rep. Mali Uganda Côte d'Ivoire Mauritania Ukraine Croatia Mexico Uruguay Czech Republic Moldova Uzbekistan Dominican Republic Mongolia Venezuela, RB Ecuador Montenegro Vietnam Egypt, Arab Rep. Myanmar Yemen, Rep. El Salvador Namibia Zambia Estonia Nepal Zimbabwe Eswatini Nicaragua
Ethiopia Niger

53
Table A2: Summary Statistics Variable Mean Std.
deviation Min. Max. No. of
Observations Female Workers (% of total workers) 29.217 28.009 0 100 44539 Exports (%, cell average) 9.452 13.96 0 100 44539 No. of Workers (logs) 3.061 1.231 0 10.06 44539 Herfindahl-Hirschman Index (HHI) 0.102 0.147 0 1 44539 Age of Firm (logs) 2.53 0.833 0 5.737 43911 Foreign Ownership (proportion) 0.089 0.266 0 1 44217 Female Ownership Y:1 N:0 0.34 0.474 0 1 43506 Skills Obstacle (0-4) 1.35 1.301 0 4 43892 How Much Of An Obstacle: Transport? 1.259 1.282 0 4 44074 Firm Purchased Fixed Assets Y:1 N:0 0.481 0.5 0 1 44182 Power Outages (days) 1.316 3.541 0 30 42105 Courts Obstacle (cell average) 1.016 0.715 0 3.955 43198 Crime Losses Y:1 N:0 0.178 0.383 0 1 43173 Firm Inspected Y:1 N:0 0.598 0.49 0 1 44070 How Much Of An Obstacle: Tax Rates 1.768 1.322 0 4 43885 How Much Of An Obstacle: Labor Regulations? 0.963 1.132 0 4 44003 GDP per capita (logs) 8.598 1.005 6.462 10.264 44539 Population (logs) 16.266 1.35 13.329 19.345 44539 Urbanization (%) 48.113 19.99 0 95.045 44539 WBL Index 0.691 0.164 0.176 1 44539 Women can work the same night hours as men 0.825 0.38 0 1 44539 Women can work in the same industries as men 0.463 0.499 0 1 44539 Ratio of Female to Male Population 50.251 5.534 0 56.84 44539 Fertility Rate 3.296 1.693 1.23 7.57 44539 Starting a Business (DTF) 67.956 20.73 0 95.81 44539 Inflation (%) 7.028 7.885 -8.975 81.138 44539 Labor Productivity (2009 USD, logs) 9.738 2.145 -5.089 22.663 38742 Quality Certificate Y:1 N:0 0.185 0.389 0 1 43171 Employment Growth (%) 4.874 17.859 -97.044 100 40435 Firms' Top Manger is Female Y:1 N:0 0.166 0.372 0 1 37489 Firm Spent on Security Y:1 N:0 54.704 49.779 0 100 44409 Firm Has Own Website Y:1 N:0 0.394 0.489 0 1 44381 Firm Provides Training to Workers Y:1 N:0 0.32 0.467 0 1 42208 Polity index 4.028 5.596 -9 10 44539 Real growth rate of GDP per capita 3.7 5.457 -22.331 38.69 44539 Primary Enrollment (Gross, %) 102.905 14.373 47.618 144.338 42363

54
Primary Enrollment (Gross, %): Gender Parity Index
0.95 0.086 0.406 1.072 42363
Men have more right to scarce job (Agree-Disagree)
2.054 0.349 1.13 2.796 32683
Women & men have same rights (Disagree-Agree)
8.236 0.632 6.913 9.316 30328
Female Dependence of Sectors 0.314 0.165 0.08 0.71 33328 Sample size varies due to missing data.

55
Table A3: Correlation between Exports and other variables used in the regressions as controls
Variable Exports (%, cell average)
Exports (%, cell average) 1 No. of Workers (logs) 0.169 Herfindahl-Hirschman Index (HHI) -0.105 Age of Firm (logs) 0.015 Foreign Ownership (proportion) 0.091 Female Ownership Y:1 N:0 0.067 Skills Obstacle (0-4) 0.029 How Much Of An Obstacle: Transport? -0.040 Firm Purchased Fixed Assets Y:1 N:0 0.055 Power Outages (days) -0.075 Courts Obstacle (cell average) 0.010 Crime Losses Y:1 N:0 -0.008 Firm Inspected Y:1 N:0 -0.038 How Much Of An Obstacle: Tax Rates 0.051 How Much Of An Obstacle: Labor Regulations?
0.060
GDP per capita (logs) 0.176 Population (logs) -0.184 Urbanization (%) 0.041 WBL Index 0.181 Women can work the same night hours as men
0.067
Women can work in the same industries as men
-0.016
Ratio of Female to Male Population 0.072 Fertility Rate -0.217 Starting a Business (DTF) 0.058 Inflation (%) -0.104

56
Table A4: Interaction term results for the Herfindahl-Hirschman Index Dependent variable: Female Workers
(1) (2) (3) (4) (5) (6) (7)
Exports (%, cell average)*Herfindahl-Hirschman Index
0.748 0.889* 0.972* 1.071** 1.153** 0.772** 0.951**
(0.508) (0.505) (0.552) (0.519) (0.545) (0.390) (0.380)
Exports (%, cell average)
0.106** 0.107** 0.088* 0.084* 0.098* 0.099* -1.000**
(0.052) (0.051) (0.051) (0.050) (0.054) (0.053) (0.504) Herfindahl-Hirschman Index
-10.006*** -10.794*** -11.705*** -11.128*** -15.403*** -10.67*** 1.930
(3.823) (3.533) (3.618) (3.607) (4.214) (3.836) (7.299) Exports (%, cell average)*GDP per capita (logs)
0.120**
(0.055)
No. of workers (logs)*Herfindahl-Hirschman Index
-4.336**
(1.726)
No. of Workers (logs)
0.544** 0.714*** 0.749*** 0.906*** 0.917*** 1.318***
(0.244) (0.257) (0.279) (0.291) (0.291) (0.332)
GDP per capita (logs)
16.228*** 16.436*** 18.519*** 18.865*** 8.307 5.893
(4.853) (4.915) (4.867) (5.196) (5.356) (5.480)
Age of Firm (logs)
-0.494 -0.886*** -0.656* -0.806** -0.800** (0.358) (0.337) (0.359) (0.355) (0.357)
Foreign Ownership (proportion)
-0.881 -0.103 0.125 0.163 0.218
(0.846) (0.883) (0.970) (0.962) (0.960)
Female Ownership Y:1 N:0
6.182*** 5.978*** 5.939*** 5.949***
(0.615) (0.652) (0.652) (0.650)
Skills Obstacle (0-4)
0.609*** 0.676** 0.646** 0.659** (0.226) (0.267) (0.269) (0.267)
How Much Of An Obstacle: Transport?
-0.036 0.017 -0.006 -0.004
(0.193) (0.209) (0.209) (0.209)
Firm Purchased Fixed Assets Y:1 N:0
-0.927* -1.066* -1.041* -0.987*
(0.522) (0.557) (0.556) (0.557)

57
Power Outages (days)
-0.157** -0.145** -0.146**
(0.068) (0.068) (0.067)
Courts Obstacle (cell average)
-0.098 -0.536 -0.404
(0.735) (0.738) (0.734)
Crime Losses Y:1 N:0
-0.625 -0.664 -0.671
(0.670) (0.670) (0.670)
Firm Inspected Y:1 N:0
-0.813 -0.869 -0.899
(0.607) (0.606) (0.604)
How Much Of An Obstacle: Tax Rates
-0.199 -0.243 -0.231
(0.231) (0.229) (0.228)
How Much Of An Obstacle: Labor Regulations?
0.012 0.032 0.034
(0.301) (0.301) (0.300)
Population (logs)
-38.37*** -37.069*** (10.833) (10.729)
Urbanization (%)
1.630*** 1.633*** (0.406) (0.411)
WBL Index
15.209* 14.790* (8.451) (8.393)
Women can work the same night hours as men Y:1 N:0
2.882 2.999
(2.879) (2.861)
Women can work in the same industries as men Y:1 N:0
-1.485 -0.858
(2.114) (2.094)
Ratio of Female to Male Population
2.474*** 2.720***
(0.556) (0.566)
Fertility Rate
-14.64*** -13.769*** (3.089) (2.959)
Starting a Business (DTF)
0.076* 0.075*
(0.039) (0.039)
Inflation (%)
0.041 0.030 (0.063) (0.062)
Year fixed effects Yes Yes Yes Yes Yes Yes Yes Country-Industry fixed effects
Yes Yes Yes Yes Yes Yes Yes

58
Constant 28.48*** -111.39*** -111.93*** -134.88*** -136.74*** 391.88** 374.65** (2.168) (41.395) (41.960) (41.599) (44.528) (170.766) (168.749)
Number of observations
44,539 44,539 43,616 41,444 36,944 36,944 36,944
R-squared 0.476 0.477 0.483 0.502 0.511 0.514 0.514 Standard errors in brackets. All standard errors are Huber-White robust and clustered on country-times-industry. Sample size varies due to missing data.

59
Table A5: Interaction term results for Starting a Business (DTF) Dependent variable: Female Workers
(1) (2) (3) (4) (5) (6) (7)
Exports (%, cell average)*Starting a Business (DTF)
-0.004*** (0.002)
-0.004** (0.002)
-0.004** (0.002)
-0.005** (0.002)
-0.004** (0.002)
-0.003** (0.002)
-0.005*** (0.002)
Exports (%, cell average) 0.458*** 0.444*** 0.426*** 0.488*** 0.457*** 0.398*** -0.573 (0.131) (0.132) (0.146) (0.152) (0.162) (0.126) (0.509)
Starting a Business (DTF) 0.092** 0.089** 0.104*** 0.086** 0.064 0.120*** 0.147** (0.038) (0.036) (0.037) (0.036) (0.043) (0.045) (0.061)
Exports (%, cell average)*GDP per capita (logs)
0.116** (0.055)
No. of Workers (logs)*Starting a Business (DTF)
-0.004 (0.014)
No. of Workers (logs)
0.504** 0.668*** 0.712** 0.886*** 0.898*** 1.166 (0.243) (0.256) (0.279) (0.292) (0.292) (1.038)
GDP per capita (logs)
13.923*** 14.248*** 15.284*** 14.997** 5.817 3.360 (5.053) (5.257) (5.321) (5.827) (5.669) (5.718)
Herfindahl-Hirschman Index
-6.833** (3.410)
-5.371 (3.421)
-8.963** (4.054)
-5.828 (3.648)
-5.922 (3.654)
Age of Firm (logs)
-0.526 -0.897*** -0.681* -0.832** -0.846** (0.354) (0.339) (0.362) (0.359) (0.362)
Foreign Ownership (proportion)
-0.957 -0.221 -0.038 0.049 -0.004
(0.846) (0.881) (0.972) (0.963) (0.964)
Female Ownership Y:1 N:0
6.229*** 6.017*** 5.975*** 5.978***
(0.614) (0.651) (0.652) (0.652)
Skills Obstacle (0-4)
0.610*** 0.692** 0.651** 0.649** (0.227) (0.269) (0.269) (0.268)
How Much Of An Obstacle: Transport?
-0.042 0.020 -0.006 0.000
(0.193) (0.209) (0.209) (0.209)
Firm Purchased Fixed Assets Y:1 N:0
-0.992* -1.110** -1.063* -1.029*
(0.527) (0.560) (0.557) (0.557)
Power Outages (days)
-0.172** -0.152** -0.156** (0.070) (0.068) (0.068)
Courts Obstacle (cell average)
-0.030 -0.562 -0.438
(0.759) (0.742) (0.739)

60
Crime Losses Y:1 N:0
-0.572 -0.626 -0.650 (0.666) (0.668) (0.668)
Firm Inspected Y:1 N:0
-0.833 -0.880 -0.885 (0.606) (0.604) (0.604)
How Much Of An Obstacle: Tax Rates
-0.214 -0.258 -0.258
(0.230) (0.229) (0.228)
How Much Of An Obstacle: Labor Regulations?
-0.004 (0.301)
0.024 (0.301)
0.041 (0.301)
Population (logs)
-42.373*** -43.149*** (10.841) (10.831)
Urbanization (%)
1.611*** 1.616*** (0.407) (0.409)
WBL Index
15.746* 15.280* (8.524) (8.382)
Women can work the same night hours as men Y:1 N:0
2.756 2.816
(2.818) (2.785)
Women can work in the same industries as men Y:1 N:0
-1.410 -0.815
(2.087) (2.066)
Ratio of Female to Male Population
2.562*** 2.852***
(0.562) (0.561)
Fertility Rate
-15.971*** -15.471*** (3.466) (3.372)
Inflation (%)
0.053 0.046 (0.063) (0.063)
Year fixed effects Yes Yes Yes Yes Yes Yes Yes Country-Industry fixed effects
Yes Yes Yes Yes Yes Yes Yes
Constant 19.617*** -100.241** -103.572** -116.419*** -110.468** 474.786*** 489.949*** (4.674) (42.257) (44.161) (44.513) (48.331) (172.119) (172.173)
Number of observations 44,539 44,539 43,616 41,444 36,944 36,944 36,944 R-squared 0.476 0.477 0.483 0.501 0.510 0.513 0.514 Standard errors in brackets. All standard errors are Huber-White robust and clustered on country-times-industry. Sample size varies due to missing data.

61
Table A6: Dependence of sectors on female workers Dependent variable: Female Workers
(1) (2) (3) (4) (5) (6) (7)
Exports (%, cell average)*Female Dependence of Sectors
0.586*** (0.220)
0.535** (0.216)
0.471** (0.214)
0.526** (0.207)
0.418* (0.223)
0.418* (0.219)
0.403* (0.215)
Exports (%, cell average)
-0.055 -0.025 -0.006 -0.024 0.039 0.009 -0.718
(0.101) (0.100) (0.101) (0.103) (0.109) (0.092) (0.449) Female Dependence of Sectors
43.106*** 43.900*** 45.375*** 45.061*** 48.872*** 48.382*** 41.236***
(5.772) (5.753) (5.709) (5.882) (6.343) (6.366) (9.237)
Exports (%, cell average)*GDP per capita (logs)
0.081
(0.053)
No. of Workers (logs)*Female Dependence of Sectors
2.199
(1.897)
No. of Workers (logs)
0.605** 0.800*** 0.827*** 0.971*** 0.977*** 0.242 (0.258) (0.271) (0.297) (0.310) (0.308) (0.638)
GDP per capita (logs)
15.497*** 14.906** 13.987** 10.334 1.297 -0.696 (5.678) (5.965) (6.141) (6.548) (6.179) (6.428)
Herfindahl-Hirschman Index
-1.272 0.690 -1.336 -0.835 -1.032
(3.955) (4.029) (4.759) (4.327) (4.324)
Age of Firm (logs)
-0.434 -0.873** -0.586 -0.736* -0.705* (0.381) (0.362) (0.386) (0.383) (0.383)
Foreign Ownership (proportion)
-1.549* -0.670 -0.671 -0.569 -0.623
(0.881) (0.934) (1.028) (1.021) (1.017)
Female Ownership Y:1 N:0
6.154*** 5.981*** 5.944*** 5.982***
(0.669) (0.713) (0.710) (0.710)
Skills Obstacle (0-4)
0.664*** 0.769*** 0.740** 0.745** (0.250) (0.293) (0.293) (0.292)
How Much Of An Obstacle: Transport?
-0.046 -0.011 -0.036 -0.042
(0.205) (0.223) (0.223) (0.223)
Firm Purchased Fixed Assets Y:1 N:0
-0.770 -0.658 -0.606 -0.587

62
(0.552) (0.590) (0.588) (0.588)
Power Outages (days)
-0.108 -0.084 -0.087 (0.078) (0.075) (0.074)
Courts Obstacle (cell average)
-0.707 -1.390* -1.336
(0.850) (0.811) (0.813)
Crime Losses Y:1 N:0
-0.737 -0.809 -0.831 (0.699) (0.701) (0.704)
Firm Inspected Y:1 N:0
-1.273* -1.325** -1.327**
(0.656) (0.658) (0.659)
How Much Of An Obstacle: Tax Rates
-0.290 -0.351 -0.345
(0.258) (0.255) (0.255)
How Much Of An Obstacle: Labor Regulations?
0.034 0.075 0.080
(0.330) (0.329) (0.329)
Population (logs)
-46.382*** -46.717*** (11.098) (11.036)
Urbanization (%)
1.378*** 1.418*** (0.456) (0.457)
WBL Index
28.689*** 28.240*** (8.905) (8.822)
Women can work the same night hours as men Y:1 N:0
1.375 1.508
(3.206) (3.190)
Women can work in the same industries as men Y:1 N:0
-2.446 -1.892
(2.184) (2.189)
Ratio of Female to Male Population
2.956*** 3.113***
(0.715) (0.706)
Fertility Rate
-15.366*** -14.999*** (4.758) (4.767)
Starting a Business (DTF)
0.070* 0.074*
(0.040) (0.039)
Inflation (%)
0.054 0.051 (0.065) (0.065)
Year fixed effects Yes Yes Yes Yes Yes Yes Yes Country-Industry fixed effects
Yes Yes Yes Yes Yes Yes Yes

63
Constant 13.193*** -119.999** -114.549** -111.287** -79.525 546.231*** 559.370*** (2.858) (48.274) (50.775) (52.185) (55.616) (174.131) (173.806)
Number of observations
33,328 33,328 32,576 31,001 27,366 27,366 27,366
R-squared 0.489 0.490 0.496 0.512 0.519 0.523 0.524 Standard errors in brackets. All standard errors are Huber-White robust and clustered on country-times-industry. Sample size varies due to missing data.

64
Table A7: Interaction term results for social attitudes towards women's right to scarce jobs Dependent variable: Female Workers
(1) (2) (3) (4) (5) (6) (7)
Exports (%, cell average)*Men have more right to scarce job (WVS)
0.605*** (0.211)
0.617*** (0.207)
0.658*** (0.213)
0.644*** (0.213)
0.671*** (0.214)
0.624*** (0.215)
0.610*** (0.209)
Exports (%, cell average)
-1.178*** (0.429)
-1.190*** (0.419)
-1.272*** (0.432)
-1.247*** (0.433)
-1.283*** (0.438)
-1.177*** (0.445)
-1.238* (0.739)
Exports (%, cell average)*GDP per capita (logs)
0.009
(0.071)
No. of Workers (logs)*Men have more right to scarce jobs (WVS)
-1.949** (0.858)
No. of Workers (logs)
1.072*** 1.117*** 1.213*** 1.159*** 1.151*** 5.168***
(0.327) (0.350) (0.386) (0.398) (0.398) (1.826)
GDP per capita (logs)
-12.017 -11.785 -13.799* -21.442*** -38.168*** -42.889***
(8.120) (8.180) (7.865) (7.883) (9.297) (10.036)
Herfindahl-Hirschman Index
-11.842** -10.150* -9.926 -11.004 -11.442
(5.534) (5.409) (6.465) (6.920) (7.321)
Age of Firm (logs)
-0.519 -1.007** -0.904** -0.874** -0.842* (0.421) (0.417) (0.435) (0.437) (0.435)
Foreign Ownership (proportion)
0.351 1.922* 2.104* 2.175* 2.309*
(1.098) (1.124) (1.204) (1.204) (1.193)
Female Ownership Y:1 N:0
5.461*** 5.263*** 5.267*** 5.206***
(0.730) (0.773) (0.771) (0.776)
Skills Obstacle (0-4)
0.069 0.380 0.398 0.405
(0.316) (0.387) (0.387) (0.386)
How Much Of An Obstacle: Transport?
-0.432 -0.258 -0.254 -0.251
(0.266) (0.298) (0.300) (0.299)
Firm Purchased Fixed Assets Y:1 N:0
-0.899 -0.562 -0.520 -0.482
(0.758) (0.815) (0.819) (0.818)

65
Power Outages (days)
-0.187* -0.205* -0.192*
(0.102) (0.105) (0.106)
Courts Obstacle (cell average)
-1.432 -1.080 -1.081
(1.322) (1.471) (1.466)
Crime Losses Y:1 N:0
-1.510* -1.432 -1.378
(0.907) (0.910) (0.908)
Firm Inspected Y:1 N:0
-0.590 -0.564 -0.552
(0.846) (0.849) (0.850)
How Much Of An Obstacle: Tax Rates
-0.400 -0.415 -0.426
(0.321) (0.321) (0.322)
How Much Of An Obstacle: Labor Regulations?
-0.185 -0.193 -0.173
(0.401) (0.401) (0.399)
Population (logs)
-46.729 -57.415 (40.569) (40.654)
Urbanization (%)
-1.699 -1.623 (1.360) (1.355)
WBL Index
-5.633 -0.854 (12.997) (13.437)
Women can work the same night hours as men Y:1 N:0
-26.481*** -24.642***
(6.178) (6.282)
Women can work in the same industries as men Y:1 N:0
4.173 3.185
(6.741) (6.843)
Ratio of Female to Male Population
-1.399 -0.822
(1.338) (1.382)
Fertility Rate
-25.246*** -28.560*** (8.963) (9.345)
Starting a Business (DTF)
0.025 0.038
(0.088) (0.089)
Inflation (%)
1.153** 1.158** (0.525) (0.531)
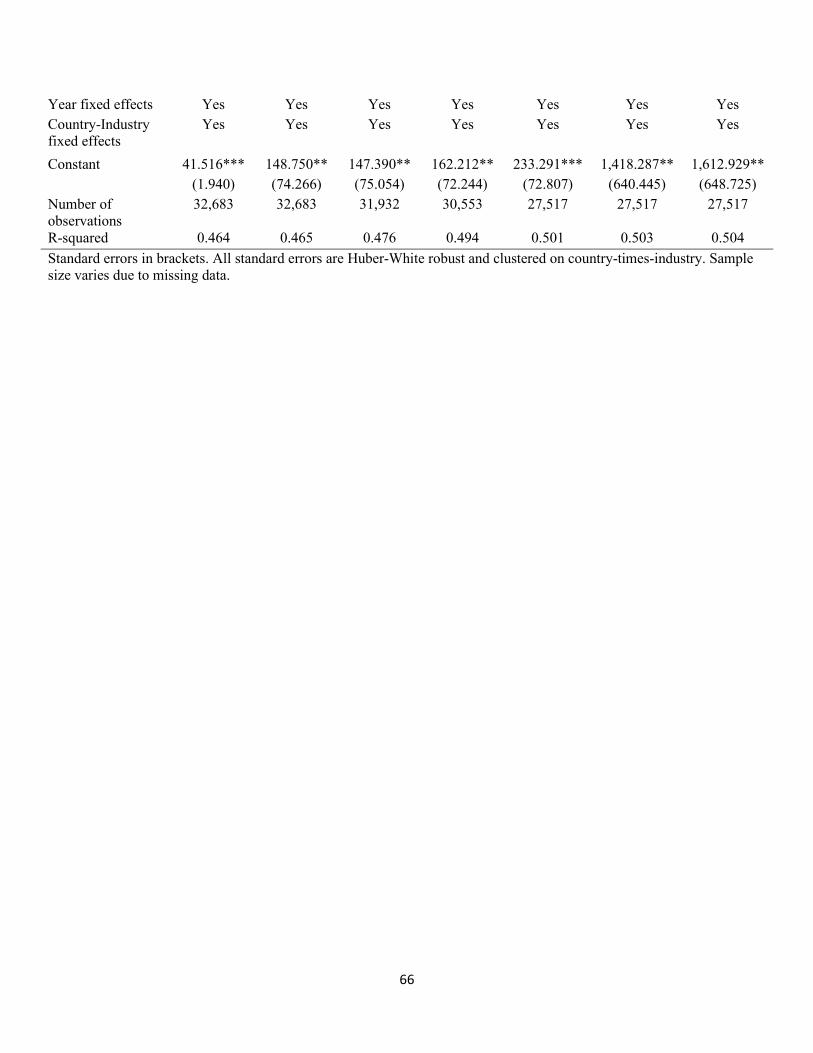
66
Year fixed effects Yes Yes Yes Yes Yes Yes Yes Country-Industry fixed effects
Yes Yes Yes Yes Yes Yes Yes
Constant 41.516*** 148.750** 147.390** 162.212** 233.291*** 1,418.287** 1,612.929** (1.940) (74.266) (75.054) (72.244) (72.807) (640.445) (648.725)
Number of observations
32,683 32,683 31,932 30,553 27,517 27,517 27,517
R-squared 0.464 0.465 0.476 0.494 0.501 0.503 0.504 Standard errors in brackets. All standard errors are Huber-White robust and clustered on country-times-industry. Sample size varies due to missing data.

67
Table A8: Interaction term results for social attitudes towards women's rights Dependent variable: Female Workers
(1) (2) (3) (4) (5) (6) (7)
Exports (%, cell average)*Women & men have same rights (WVS, 20 yr. average)
0.273*** (0.093)
0.276*** (0.095)
0.289*** (0.096)
0.333*** (0.100)
0.410*** (0.105)
0.345*** (0.099)
0.278*** (0.099)
Exports (%, cell average)
-2.226*** (0.766)
-2.247*** (0.782)
-2.363*** (0.785)
-2.710*** (0.818)
-3.339*** (0.865)
-2.822*** (0.826)
-3.212*** (0.939)
Exports (%, cell average)*GDP per capita (logs)
0.102
(0.076)
No. of Workers (logs)*Women & men have same rights (WVS, 20 yr. average)
0.175
(0.459)
No. of Workers (logs)
0.613** 0.551* 0.710** 0.675** 0.671** -0.781
(0.275) (0.297) (0.321) (0.334) (0.329) (3.744)
GDP per capita (logs)
-0.141 1.758 -0.369 -1.444 -20.342** -21.450***
(5.887) (6.072) (5.904) (6.587) (8.271) (8.223)
Herfindahl-Hirschman Index
-5.382 -4.185 -7.547 -4.669 -5.691
(4.415) (4.309) (4.688) (4.247) (4.356)
Age of Firm (logs)
0.321 -0.252 -0.072 -0.164 -0.151 (0.414) (0.420) (0.441) (0.436) (0.433)
Foreign Ownership (proportion)
-0.016 1.153 1.685 1.698 1.707
(1.127) (1.141) (1.151) (1.118) (1.117)
Female Ownership Y:1 N:0
5.506*** 5.295*** 5.457*** 5.443***
(0.703) (0.728) (0.720) (0.717)
Skills Obstacle (0-4)
0.543* 0.704** 0.502 0.498 (0.311) (0.349) (0.349) (0.348)
How Much Of An Obstacle: Transport?
-0.270 -0.075 -0.051 -0.040
(0.237) (0.270) (0.274) (0.276)
Firm Purchased Fixed Assets Y:1 N:0
-1.102* -0.804 -0.650 -0.619

68
(0.628) (0.672) (0.671) (0.673)
Power Outages (days)
-0.056 -0.074 -0.072
(0.080) (0.082) (0.083)
Courts Obstacle (cell average)
-0.454 -0.599 -0.494
(0.991) (1.034) (1.040)
Crime Losses Y:1 N:0
-1.341* -1.285* -1.299*
(0.741) (0.733) (0.734)
Firm Inspected Y:1 N:0
-0.170 -0.190 -0.188
(0.746) (0.754) (0.752)
How Much Of An Obstacle: Tax Rates
-0.418 -0.448 -0.438
(0.276) (0.276) (0.275)
How Much Of An Obstacle: Labor Regulations?
-0.140 -0.082 -0.076
(0.362) (0.360) (0.359)
Population (logs)
-100.948*** -94.482*** (36.755) (36.360)
Urbanization (%)
-1.582** -1.486** (0.745) (0.736)
WBL Index
17.887 17.764 (11.050) (10.931)
Women can work the same night hours as men Y:1 N:0
1.877 1.469
(3.140) (3.172)
Women can work in the same industries as men Y:1 N:0
-27.171*** -25.654***
(3.744) (3.879)
Ratio of Female to Male Population
-11.870** -11.328*
(5.789) (5.785)
Fertility Rate
-46.903*** -46.026*** (7.940) (7.955)
Starting a Business (DTF)
0.035 0.035
(0.081) (0.081)
Inflation (%)
0.640** 0.677** (0.284) (0.282)
Year fixed effects Yes Yes Yes Yes Yes Yes Yes

69
Country-Industry fixed effects
Yes Yes Yes Yes Yes Yes Yes
Constant 35.350*** 35.262 16.331 31.827 42.448 2,738.231*** 2,601.910*** (1.972) (53.742) (55.741) (54.459) (60.774) (832.266) (824.868)
Number of observations
30,328 30,328 29,626 28,299 25,587 25,587 25,587
R-squared 0.480 0.480 0.484 0.502 0.508 0.515 0.516 Standard errors in brackets. All standard errors are Huber-White robust and clustered on country-times-industry. Sample size varies due to missing data.
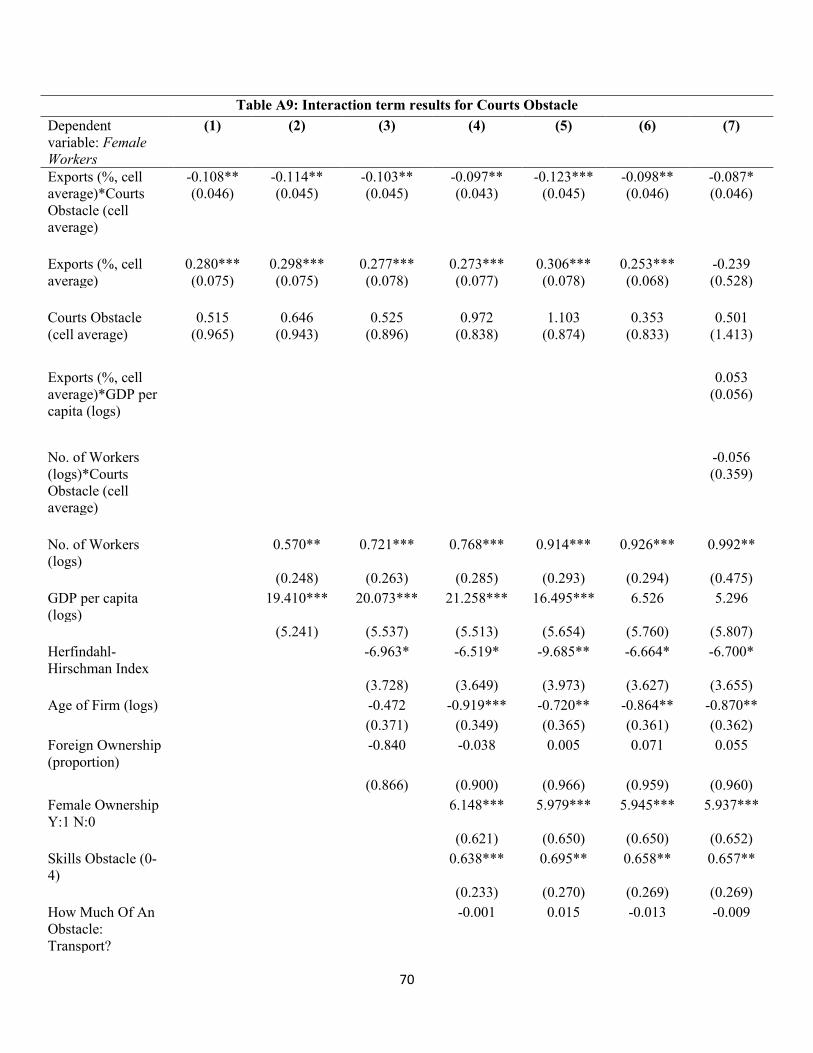
70
Table A9: Interaction term results for Courts Obstacle Dependent variable: Female Workers
(1) (2) (3) (4) (5) (6) (7)
Exports (%, cell average)*Courts Obstacle (cell average)
-0.108** (0.046)
-0.114** (0.045)
-0.103** (0.045)
-0.097** (0.043)
-0.123*** (0.045)
-0.098** (0.046)
-0.087* (0.046)
Exports (%, cell average)
0.280*** (0.075)
0.298*** (0.075)
0.277*** (0.078)
0.273*** (0.077)
0.306*** (0.078)
0.253*** (0.068)
-0.239 (0.528)
Courts Obstacle (cell average)
0.515 (0.965)
0.646 (0.943)
0.525 (0.896)
0.972 (0.838)
1.103 (0.874)
0.353 (0.833)
0.501 (1.413)
Exports (%, cell average)*GDP per capita (logs)
0.053
(0.056)
No. of Workers (logs)*Courts Obstacle (cell average)
-0.056 (0.359)
No. of Workers (logs)
0.570** 0.721*** 0.768*** 0.914*** 0.926*** 0.992**
(0.248) (0.263) (0.285) (0.293) (0.294) (0.475)
GDP per capita (logs)
19.410*** 20.073*** 21.258*** 16.495*** 6.526 5.296
(5.241) (5.537) (5.513) (5.654) (5.760) (5.807)
Herfindahl-Hirschman Index
-6.963* -6.519* -9.685** -6.664* -6.700*
(3.728) (3.649) (3.973) (3.627) (3.655)
Age of Firm (logs)
-0.472 -0.919*** -0.720** -0.864** -0.870** (0.371) (0.349) (0.365) (0.361) (0.362)
Foreign Ownership (proportion)
-0.840 -0.038 0.005 0.071 0.055
(0.866) (0.900) (0.966) (0.959) (0.960)
Female Ownership Y:1 N:0
6.148*** 5.979*** 5.945*** 5.937***
(0.621) (0.650) (0.650) (0.652)
Skills Obstacle (0-4)
0.638*** 0.695** 0.658** 0.657**
(0.233) (0.270) (0.269) (0.269)
How Much Of An Obstacle: Transport?
-0.001 0.015 -0.013 -0.009

71
(0.196) (0.208) (0.209) (0.209)
Firm Purchased Fixed Assets Y:1 N:0
-1.046** -1.073* -1.046* -1.033*
(0.527) (0.560) (0.557) (0.558)
Power Outages (days)
-0.173** -0.153** -0.156**
(0.070) (0.068) (0.068)
o.iv_h30_ci
(dropped) (dropped) (dropped)
Crime Losses Y:1 N:0
-0.623 -0.670 -0.679
(0.666) (0.668) (0.668)
Firm Inspected Y:1 N:0
-0.813 -0.875 -0.879
(0.605) (0.605) (0.605)
How Much Of An Obstacle: Tax Rates
-0.216 -0.254 -0.252
(0.230) (0.229) (0.229)
How Much Of An Obstacle: Labor Regulations?
0.027
(0.300) 0.041
(0.300) 0.051
(0.300)
Population (logs)
-37.758*** -37.641*** (10.909) (10.849)
Urbanization (%)
1.709*** 1.723*** (0.423) (0.427)
WBL Index
16.988* 17.157** (8.755) (8.677)
Women can work the same night hours as men Y:1 N:0
2.962
(2.814) 2.967
(2.807)
Women can work in the same industries as men Y:1 N:0
-0.860 (2.009)
-0.608 (2.053)
Ratio of Female to Male Population
2.352*** (0.572)
2.486*** (0.566)
Fertility Rate
-15.380*** -15.262*** (3.649) (3.646)
Starting a Business (DTF)
0.081** 0.081**

72
(0.039) (0.039)
Inflation (%)
0.059 0.056 (0.065) (0.065)
Year fixed effects Yes Yes Yes Yes Yes Yes Yes Country-Industry fixed effects
Yes Yes Yes Yes Yes Yes Yes
Constant 27.536*** -139.744*** -144.453*** -159.812*** -117.836** 397.642** 398.045** (1.995) (44.704) (47.329) (47.118) (48.419) (171.873) (171.380)
Number of observations
43,198 43,198 42,299 40,237 36,944 36,944 36,944
R-squared 0.479 0.481 0.486 0.504 0.510 0.514 0.514 Standard errors in brackets. All standard errors are Huber-White robust and clustered on country-times-industry. Sample size varies due to missing data.

73
Table A10: Interaction term results for gender specific labor laws Dependent variable: Female Workers (1) (2) (3) (4) (5) (6) (7) (8)
Exports (%, cell average)*Women can work the same night hours as men Y:1 N:0
0.247*** (0.087)
0.250*** (0.087)
0.231*** (0.089)
0.265*** (0.097)
0.276*** (0.098)
0.318*** (0.091)
0.301*** (0.097)
0.305*** (0.095)
Exports (%, cell average) -0.056 -0.047 -0.044 -0.066 -0.054 -0.128 -0.618 -0.626 (0.081) (0.081) (0.080) (0.088) (0.089) (0.083) (0.514) (0.535)
Women can work the same night hours as men Y:1 N:0
-9.626*** (2.700)
-9.150*** (2.767)
-8.745*** (2.760)
-6.629** (2.872)
-6.797** (2.889)
0.503 (2.945)
0.482 (3.945)
-0.971 (3.954)
Exports (%, cell average)*GDP per capita (logs)
0.056
(0.059) 0.065
(0.078)
Exports (%, cell average)*WBL Index
-0.112 (0.392)
No. of Workers (logs)*Women can work the same night hours as men Y:1 N:0
0.055
(0.715) 0.445
(0.726)
No. of Workers (logs)*WBL Index
-3.368* (1.732)
No. of Workers (logs)
0.533** 0.699*** 0.743*** 0.903*** 0.902*** 0.867 2.887** (0.243) (0.257) (0.280) (0.291) (0.291) (0.655) (1.271)
GDP per capita (logs)
13.906*** 14.101*** 15.962*** 15.592*** 5.876 4.688 4.791 (5.151) (5.346) (5.348) (5.748) (5.710) (5.768) (5.740)
Herfindahl-Hirschman Index
-6.321* -4.724 -8.467** -5.197 -5.364 -5.022 (3.499) (3.528) (4.117) (3.662) (3.714) (3.709)
Age of Firm (logs)
-0.522 -0.914*** -0.689* -0.833** -0.842** -0.831** (0.357) (0.339) (0.362) (0.358) (0.359) (0.359)
Foreign Ownership (proportion)
-0.904 (0.844)
-0.156 (0.879)
0.030 (0.970)
0.103 (0.961)
0.081 (0.962)
0.130 (0.962)
Female Ownership Y:1 N:0
6.203*** 6.013*** 5.975*** 5.968*** 5.987*** (0.615) (0.651) (0.652) (0.653) (0.654)

74
Skills Obstacle (0-4)
0.597*** 0.666** 0.636** 0.638** 0.636** (0.228) (0.269) (0.269) (0.269) (0.269)
How Much Of An Obstacle: Transport?
-0.035 0.017 -0.011 -0.008 -0.016
(0.193) (0.209) (0.209) (0.209) (0.209)
Firm Purchased Fixed Assets Y:1 N:0
-0.920* -1.058* -1.031* -1.018* -0.994*
(0.524) (0.558) (0.556) (0.557) (0.558)
Power Outages (days)
-0.171** -0.154** -0.156** -0.155** (0.070) (0.068) (0.068) (0.068)
Courts Obstacle (cell average)
-0.005 -0.454 -0.383 -0.422
(0.776) (0.739) (0.734) (0.737)
Crime Losses Y:1 N:0
-0.571 -0.633 -0.651 -0.672 (0.667) (0.669) (0.672) (0.674)
Firm Inspected Y:1 N:0
-0.814 -0.847 -0.854 -0.822 (0.604) (0.603) (0.604) (0.604)
How Much Of An Obstacle: Tax Rates
-0.224 -0.253 -0.250 -0.264
(0.230) (0.229) (0.230) (0.230)
How Much Of An Obstacle: Labor Regulations?
0.029 0.036 0.046 0.051
(0.301) (0.301) (0.301) (0.300)
Population (logs)
-35.364*** -35.332*** -35.099*** (10.960) (10.933) (11.115)
Urbanization (%)
1.673*** 1.692*** 1.642*** (0.415) (0.419) (0.405)
WBL Index
17.580** 17.641** 29.339** (8.651) (8.608) (11.496)
Women can work in the same industries as men Y:1 N:0
-2.120 -1.756 -1.808

75
(2.049) (2.108) (2.127)
Ratio of Female to Male Population
3.454*** 3.536*** 3.508***
(0.693) (0.687) (0.708)
Fertility Rate
-15.658*** -15.462*** -15.345*** (3.560) (3.549) (3.521)
Starting a Business (DTF)
0.066* 0.067* 0.064* (0.039) (0.039) (0.039)
Inflation (%)
0.068 0.065 0.071 (0.064) (0.064) (0.065)
Year fixed effects Yes Yes Yes Yes Yes Yes Yes Yes Country-Industry fixed effects Yes Yes Yes Yes Yes Yes Yes Yes Constant 36.458*** -83.892* -84.872* -107.330** -102.805** 315.970* 319.540* 312.122*
(2.850) (44.257) (46.085) (46.025) (49.565) (174.209) (175.277) (179.319) Number of observations 44,539 44,539 43,616 41,444 36,944 36,944 36,944 36,944 R-squared 0.476 0.477 0.483 0.501 0.510 0.514 0.514 0.514
Standard errors in brackets. All standard errors are Huber-White robust and clustered on country-times-industry. Sample size varies due to missing data.

76
Table A11: Interaction term results for gender specific labor laws Dependent variable: Female Workers
(1) (2) (3) (4) (5) (6) (7) (8)
Exports (%, cell average)*Women can work in the same industries as men Y:1 N:0
0.166 (0.102)
0.198** (0.100)
0.195* (0.103)
0.206** (0.102)
0.254** (0.107)
0.272*** (0.100)
0.273*** (0.101)
0.280*** (0.098)
Exports (%, cell average) 0.091* (0.055)
0.089* (0.052)
0.076 (0.053)
0.074 (0.054)
0.072 (0.057)
0.030 (0.055)
-0.698 (0.487)
-0.723 (0.507)
Women can work in the same industries as men Y:1 N:0
-5.258** (2.278)
-4.799** (2.213)
-4.890** (2.220)
-3.761* (2.151)
-4.087* (2.405)
-4.652* (2.459)
-3.052 (3.170)
-3.746 (3.127)
Exports (%, cell average)*GDP per capita (logs)
0.080
(0.054) 0.096
(0.072)
Exports (%, cell average)*WBL Index
-0.165 (0.370)
No. of Workers (logs)*Women can work in the same industries as men Y:1 N:0
-0.394 (0.539)
-0.202 (0.529)
No. of Workers (logs)*WBL Index
-2.942* (1.712)
No. of Workers (logs)
0.543** 0.707*** 0.745*** 0.910*** 0.916*** 1.114*** 3.066** (0.242) (0.255) (0.278) (0.289) (0.290) (0.360) (1.225)
GDP per capita (logs)
15.421*** 15.569*** 17.722*** 18.160*** 7.974 6.209 6.291 (4.869) (5.019) (5.067) (5.441) (5.494) (5.559) (5.524)
Herfindahl-Hirschman Index
-7.033** -5.831* -9.966*** -7.021** -7.080** -6.775* (3.314) (3.329) (3.855) (3.446) (3.491) (3.482)
Age of Firm (logs)
-0.525 -0.912*** -0.688* -0.834** -0.846** -0.834** (0.356) (0.336) (0.358) (0.355) (0.356) (0.358)
Foreign Ownership (proportion)
-0.854 (0.842)
-0.085 (0.878)
0.117 (0.968)
0.183 (0.961)
0.169 (0.960)
0.218 (0.961)

77
Female Ownership Y:1 N:0
6.148*** 5.943*** 5.905*** 5.880*** 5.890*** (0.616) (0.652) (0.652) (0.653) (0.653)
Skills Obstacle (0-4)
0.600*** 0.662** 0.625** 0.620** 0.622** (0.227) (0.269) (0.270) (0.269) (0.269)
How Much Of An Obstacle: Transport?
-0.037 0.020 -0.010 -0.004 -0.012
(0.193) (0.209) (0.209) (0.209) (0.209)
Firm Purchased Fixed Assets Y:1 N:0
-0.940* -1.076* -1.042* -1.017* -0.999*
(0.525) (0.558) (0.557) (0.558) (0.558)
Power Outages (days)
-0.168** -0.151** -0.154** -0.152** (0.069) (0.067) (0.067) (0.068)
Courts Obstacle (cell average)
-0.075 -0.644 -0.531 -0.558
(0.765) (0.740) (0.737) (0.739)
Crime Losses Y:1 N:0
-0.633 -0.688 -0.693 -0.703 (0.670) (0.671) (0.671) (0.672)
Firm Inspected Y:1 N:0
-0.759 -0.811 -0.809 -0.780 (0.602) (0.603) (0.604) (0.604)
How Much Of An Obstacle: Tax Rates
-0.216 -0.257 -0.253 -0.269
(0.230) (0.229) (0.228) (0.228)
How Much Of An Obstacle: Labor Regulations?
0.018 0.034 0.053 0.057
(0.301) (0.301) (0.300) (0.300)
Population (logs)
-35.761*** -35.262*** -35.328*** (10.819) (10.743) (10.887)
Urbanization (%)
1.857*** 1.882*** 1.840*** (0.399) (0.401) (0.391)
WBL Index
17.226** 17.122** 28.064** (8.478) (8.398) (11.187)

78
Women can work the same night hours as men Y:1 N:0
3.258 3.327 3.246
(2.973) (2.950) (2.949)
Ratio of Female to Male Population
2.614*** 2.781*** 2.680***
(0.587) (0.592) (0.619)
Fertility Rate
-15.721*** -15.311*** -15.204*** (3.330) (3.311) (3.275)
Starting a Business (DTF)
0.062 0.063 0.061 (0.039) (0.039) (0.039)
Inflation (%)
0.059 0.056 0.059 (0.062) (0.062) (0.064)
Year fixed effects Yes Yes Yes Yes Yes Yes Yes Yes Country-Industry fixed effects Yes Yes Yes Yes Yes Yes Yes Yes Constant 30.577*** -102.522** -102.738** -126.646*** -129.034*** 336.227* 331.347* 331.879*
(2.066) (41.677) (43.065) (43.395) (46.667) (171.634) (170.693) (174.104) Number of observations 44,539 44,539 43,616 41,444 36,944 36,944 36,944 36,944 R-squared 0.476 0.477 0.483 0.501 0.510 0.514 0.514 0.515
Standard errors in brackets. All standard errors are Huber-White robust and clustered on country-times-industry. Sample size varies due to missing data.

79
Table A12: Interaction term results for gender specific labor laws Dependent variable: Female Workers
(1) (2) (3) (4) (5) (6) (7) (9)
Exports (%, cell average)*Women can work the same night hours as men Y:1 N:0
0.196** (0.088)
0.190** (0.085)
0.169** (0.085)
0.204** (0.092)
0.200** (0.091)
0.235*** (0.088)
0.212** (0.093)
0.218** (0.092)
Exports (%, cell average)*Women can work in the same industries as men Y:1 N:0
0.127 (0.104)
0.158 (0.102)
0.159 (0.104)
0.161 (0.104)
0.209* (0.109)
0.222** (0.102)
0.227** (0.102)
0.234** (0.099)
Exports (%, cell average) -0.069 -0.066 -0.062 -0.087 -0.084 -0.159* -0.726 -0.754 (0.080) (0.078) (0.078) (0.084) (0.083) (0.081) (0.487) (0.506)
Women can work the same night hours as men Y:1 N:0
-8.333*** (2.594)
-7.915*** (2.633)
-7.468*** (2.627)
-5.639** (2.768)
-5.771** (2.794)
1.469 (3.045)
0.831 (3.976)
-0.390 (4.011)
Women can work in the same industries as men Y:1 N:0
-3.485 (2.240)
-3.124 (2.156)
-3.290 (2.158)
-2.507 (2.105)
-2.610 (2.379)
-4.647* (2.417)
-2.901 (3.128)
-3.433 (3.094)
Exports (%, cell average)*GDP per capita (logs)
0.065
(0.056) 0.083
(0.072)
Exports (%, cell average)*WBL Index
-0.206 (0.367)
No. of Workers (logs)*WBL Index
-3.269* (1.737)
No. of Workers (logs)*Women can work the same night hours as men Y:1 N:0
0.256
(0.709) 0.577
(0.720)
No. of Workers (logs)*Women can work in the same industries as men Y:1 N:0
-0.464 (0.534)
-0.326 (0.524)

80
No. of Workers (logs)
0.534** 0.697*** 0.740*** 0.901*** 0.900*** 0.922 2.862** (0.242) (0.254) (0.278) (0.289) (0.289) (0.663) (1.267)
GDP per capita (logs)
15.040*** 15.198*** 17.308*** 17.645*** 7.628 6.274 6.446 (4.897) (5.046) (5.080) (5.455) (5.472) (5.550) (5.507)
Herfindahl-Hirschman Index
-6.789** -5.322 -9.395** -6.153* -6.288* -5.955* (3.348) (3.357) (3.891) (3.459) (3.528) (3.516)
Age of Firm (logs)
-0.521 -0.912*** -0.684* -0.828** -0.842** -0.832** (0.355) (0.336) (0.357) (0.354) (0.355) (0.356)
Foreign Ownership (proportion)
-0.842 -0.089 0.114 0.178 0.162 0.206 (0.842) (0.878) (0.968) (0.961) (0.960) (0.960)
Female Ownership Y:1 N:0
6.177*** 5.978*** 5.938*** 5.919*** 5.940*** (0.617) (0.653) (0.653) (0.654) (0.655)
Skills Obstacle (0-4)
0.581** 0.642** 0.616** 0.611** 0.612** (0.227) (0.269) (0.270) (0.269) (0.269)
How Much Of An Obstacle: Transport?
-0.038 (0.193)
0.017 (0.209)
-0.013 (0.209)
-0.007 (0.209)
-0.016 (0.209)
Firm Purchased Fixed Assets Y:1 N:0
-0.918* (0.524)
-1.053* (0.557)
-1.023* (0.556)
-1.002* (0.557)
-0.977* (0.558)
Power Outages (days)
-0.166** -0.150** -0.153** -0.153** (0.070) (0.067) (0.067) (0.068)
Courts Obstacle (cell average)
-0.134 -0.592 -0.510 -0.547
(0.767) (0.739) (0.736) (0.738)
Crime Losses Y:1 N:0
-0.603 -0.665 -0.677 -0.699 (0.669) (0.670) (0.673) (0.675)
Firm Inspected Y:1 N:0
-0.767 -0.800 -0.801 -0.772 (0.602) (0.602) (0.603) (0.603)
How Much Of An Obstacle: Tax Rates
-0.228 -0.257 -0.250 -0.265
(0.230) (0.229) (0.228) (0.228)

81
How Much Of An Obstacle: Labor Regulations?
0.029
(0.301) 0.037
(0.301) 0.054
(0.300) 0.060
(0.300) Population (logs)
-33.804*** -33.512*** -33.549***
(10.927) (10.895) (11.034) Urbanization (%)
1.818*** 1.838*** 1.784*** (0.399) (0.401) (0.391)
WBL Index
17.410** 17.254** 29.623*** (8.464) (8.391) (11.185)
Ratio of Female to Male Population
3.297*** 3.401*** 3.342***
(0.673) (0.671) (0.686) Fertility Rate
-15.450*** -15.138*** -15.024***
(3.310) (3.289) (3.240) Starting a Business (DTF)
0.056 0.056 0.053
(0.039) (0.039) (0.039) Inflation (%)
0.067 0.066 0.073
(0.062) (0.062) (0.063) Year fixed effects Yes Yes Yes Yes Yes Yes Yes Yes Country-Industry fixed effects Yes Yes Yes Yes Yes Yes Yes Yes Constant 36.532*** -93.580** -94.242** -118.901*** -120.447** 276.010 275.380 273.203
(2.923) (41.992) (43.394) (43.635) (46.979) (174.742) (175.621) (178.676) Number of observations 44,539 44,539 43,616 41,444 36,944 36,944 36,944 36,944 R-squared 0.477 0.478 0.484 0.502 0.511 0.514 0.515 0.515
Standard errors in brackets. All standard errors are Huber-White robust and clustered on country-times-industry. Sample size varies due to missing data.

82
Table A13: Including all interaction terms simultaneously Dependent variable: Female Workers
(1) (2) (3) (4) (5) (6) (7) (8)
Exports (%, cell average)*Herfindahl-Hirschman Index
0.768 (0.491)
0.887* (0.493)
1.037* (0.539)
1.160** (0.501)
1.073** (0.513)
0.685* (0.360)
0.656* (0.367)
0.629* (0.374)
Exports (%, cell average)*Courts Obstacle (cell average)
-0.076* (0.045)
-0.089** (0.044)
-0.074* (0.044)
-0.070* (0.042)
-0.096** (0.044)
-0.075* (0.045)
-0.077* (0.045)
-0.077* (0.045)
Exports (%, cell average)*Women can work the same night hours as men Y:1 N:0
0.163* (0.098)
0.156* (0.093)
0.146 (0.093)
0.149 (0.091)
0.136 (0.090)
0.186** (0.090)
0.191** (0.092)
0.192** (0.092)
Exports (%, cell average)*Women can work in the same industries as men Y:1 N:0
0.115 (0.101)
0.157 (0.098)
0.146 (0.098)
0.157 (0.097)
0.166* (0.100)
0.200** (0.099)
0.194* (0.100)
0.201** (0.096)
Exports (%, cell average) -0.548 -0.313 -0.425 -0.603 -0.707 -0.760 -0.735 -0.755 (0.625) (0.614) (0.631) (0.525) (0.532) (0.496) (0.491) (0.499)
Exports (%, cell average)*GDP per capita (logs)
0.059 (0.069)
0.034 (0.068)
0.044 (0.070)
0.061 (0.058)
0.078 (0.059)
0.075 (0.055)
0.072 (0.055)
0.079 (0.071)
Herfindahl-Hirschman Index -9.772** -11.543*** -12.715*** -13.130*** -15.763*** -10.768*** 7.869 8.584 (4.495) (4.053) (4.110) (3.871) (4.275) (3.803) (7.985) (7.882)
Courts Obstacle (cell average) 0.000 0.151 -0.049 0.456 0.589 0.120 0.043 -0.040
(0.932) (0.903) (0.843) (0.794) (0.833) (0.827) (1.426) (1.421) Women can work the same night hours as men Y:1 N:0
-8.005*** -7.419*** -7.169*** -5.233* -5.004* 2.012 0.334 -0.669
(2.570) (2.591) (2.572) (2.726) (2.785) (3.065) (3.966) (3.982)
Women can work in the same industries as men Y:1 N:0
-3.586 -3.368 -3.268 -2.308 -1.489 -3.658 -2.687 -3.203
(2.218) (2.074) (2.064) (2.051) (2.340) (2.412) (3.123) (3.067)

83
Exports (%, cell average)*WBL Index
-0.076
(0.374)
No. of Workers (logs)*WBL Index
-3.269*
(1.850)
No. of Workers (logs)*GDP per capita (logs)
-0.547* -0.344
(0.279) (0.290)
No. of workers (logs)*Herfindahl-Hirschman Index
-5.813*** -5.886***
(2.040) (2.029)
No. of Workers (logs)*Courts Obstacle (cell average)
0.012 0.028
(0.365) (0.361)
No. of Workers (logs)*Women can work the same night hours as men Y:1 N:0
0.454 0.739
(0.690) (0.698)
No. of Workers (logs)*Women can work in the same industries as men Y:1 N:0
-0.317 -0.177
(0.545) (0.540)
No. of Workers (logs)
0.561** 0.711*** 0.763*** 0.908*** 0.907*** 5.948** 6.143** (0.245) (0.258) (0.282) (0.289) (0.288) (2.594) (2.596)
GDP per capita (logs)
22.277*** 22.327*** 24.001*** 19.137*** 8.615 10.374* 9.511* (5.020) (5.085) (5.007) (5.240) (5.330) (5.426) (5.447)
Age of Firm (logs)
-0.433 -0.887*** -0.693* -0.824** -0.819** -0.804**

84
(0.367) (0.341) (0.357) (0.353) (0.353) (0.353)
Foreign Ownership (proportion)
-0.655 0.159 0.175 0.201 0.191 0.277
(0.866) (0.901) (0.967) (0.960) (0.954) (0.955)
Female Ownership Y:1 N:0
6.156*** 5.979*** 5.931*** 5.956*** 5.981*** (0.624) (0.654) (0.654) (0.653) (0.653)
Skills Obstacle (0-4)
0.582** 0.627** 0.615** 0.629** 0.630** (0.230) (0.267) (0.268) (0.267) (0.267)
How Much Of An Obstacle: Transport?
-0.005 0.010 -0.013 -0.018 -0.027
(0.196) (0.208) (0.208) (0.208) (0.209)
Firm Purchased Fixed Assets Y:1 N:0
-0.969* -0.995* -0.981* -0.917 -0.909
(0.523) (0.556) (0.556) (0.557) (0.558)
Power Outages (days)
-0.150** -0.143** -0.146** -0.144** (0.068) (0.067) (0.067) (0.067)
Crime Losses Y:1 N:0
-0.661 -0.701 -0.694 -0.711 (0.671) (0.671) (0.673) (0.673)
Firm Inspected Y:1 N:0
-0.767 -0.804 -0.774 -0.768 (0.604) (0.603) (0.598) (0.599)
How Much Of An Obstacle: Tax Rates
-0.220 -0.248 -0.254 -0.262
(0.229) (0.228) (0.227) (0.227)
How Much Of An Obstacle: Labor Regulations?
0.053 0.059 0.049 0.047
(0.300) (0.300) (0.299) (0.298)
Population (logs)
-33.168*** -31.558*** -31.448*** (10.906) (10.966) (11.101)
Urbanization (%)
1.805*** 1.735*** 1.709*** (0.390) (0.391) (0.386)
WBL Index
15.274* 15.788* 26.692**

85
(8.287) (8.297) (11.230)
Ratio of Female to Male Population
3.169*** 3.181*** 3.165***
(0.670) (0.670) (0.688)
Fertility Rate
-13.356*** -13.350*** -13.294*** (2.845) (2.856) (2.909)
Starting a Business (DTF)
0.059 0.055 0.053 (0.039) (0.040) (0.040)
Inflation (%)
0.048 0.053 0.057 (0.061) (0.061) (0.063)
Year fixed effects Yes Yes Yes Yes Yes Yes Yes Yes Country-Industry fixed effects Yes Yes Yes Yes Yes Yes Yes Yes
Constant 35.126*** -157.297*** -156.807*** -177.871*** -135.539*** 257.768 218.589 220.035 (3.049) (42.919) (43.453) (42.896) (45.089) (174.899) (177.039) (180.347)
Number of observations 43,198 43,198 42,299 40,237 36,944 36,944 36,944 36,944 R-squared 0.481 0.482 0.488 0.506 0.512 0.515 0.516 0.516
Standard errors in brackets. All standard errors are Huber-White robust and clustered on country-times-industry. Sample size varies due to missing data.

86
Table A14: Including all interaction terms simultaneously Dependent variable: Female Workers
(1) (2) (3) (4) (5) (6) (7) (8)
Exports (%, cell average)*Starting a Business (DTF)
-0.007*** (0.002)
-0.006*** (0.002)
-0.006*** (0.002)
-0.006*** (0.002)
-0.006*** (0.002)
-0.006*** (0.001)
-0.006*** (0.002)
-0.006*** (0.002)
Exports (%, cell average)*Courts Obstacle (cell average)
-0.105** (0.044)
-0.115*** (0.044)
-0.105** (0.044)
-0.100** (0.041)
-0.126*** (0.044)
-0.099** (0.043)
-0.101** (0.043)
-0.101** (0.044)
Exports (%, cell average)*Women can work the same night hours as men Y:1 N:0
0.150* (0.087)
0.153* (0.083)
0.132 (0.083)
0.153* (0.087)
0.136 (0.086)
0.173** (0.086)
0.176** (0.087)
0.174** (0.088)
Exports (%, cell average)*Women can work in the same industries as men Y:1 N:0
0.201** (0.101)
0.237** (0.101)
0.238** (0.104)
0.249** (0.102)
0.258** (0.103)
0.266*** (0.097)
0.261*** (0.097)
0.264*** (0.095)
Exports (%, cell average) -0.316 -0.072 -0.125 -0.121 -0.266 -0.460 -0.453 -0.460 (0.516) (0.511) (0.519) (0.497) (0.498) (0.489) (0.486) (0.510)
Starting a Business (DTF) 0.069* 0.059 0.075** 0.056 0.064 0.128*** 0.128** 0.113* (0.038) (0.036) (0.037) (0.036) (0.041) (0.043) (0.064) (0.065)
Courts Obstacle (cell average) 0.196 (0.923)
0.335 (0.899)
0.226 (0.843)
0.620 (0.816)
0.752 (0.851)
0.226 (0.824)
0.140 (1.418)
0.066 (1.413)
Women can work the same night hours as men Y:1 N:0
-7.745*** (2.599)
-7.342*** (2.631)
-6.951*** (2.588)
-5.394* (2.761)
-4.993* (2.827)
2.104 (3.024)
0.706 (3.956)
-0.363 (3.976)
Women can work in the same industries as men Y:1 N:0
-4.351** (2.210)
-4.157** (2.110)
-4.032* (2.117)
-3.281 (2.083)
-2.670 (2.359)
-4.272* (2.422)
-3.550 (3.153)
-3.929 (3.116)
Exports (%, cell average)*GDP per capita (logs)
0.091* (0.055)
0.060 (0.056)
0.067 (0.057)
0.062 (0.056)
0.086 (0.056)
0.092* (0.054)
0.092* (0.054)
0.090 (0.070)
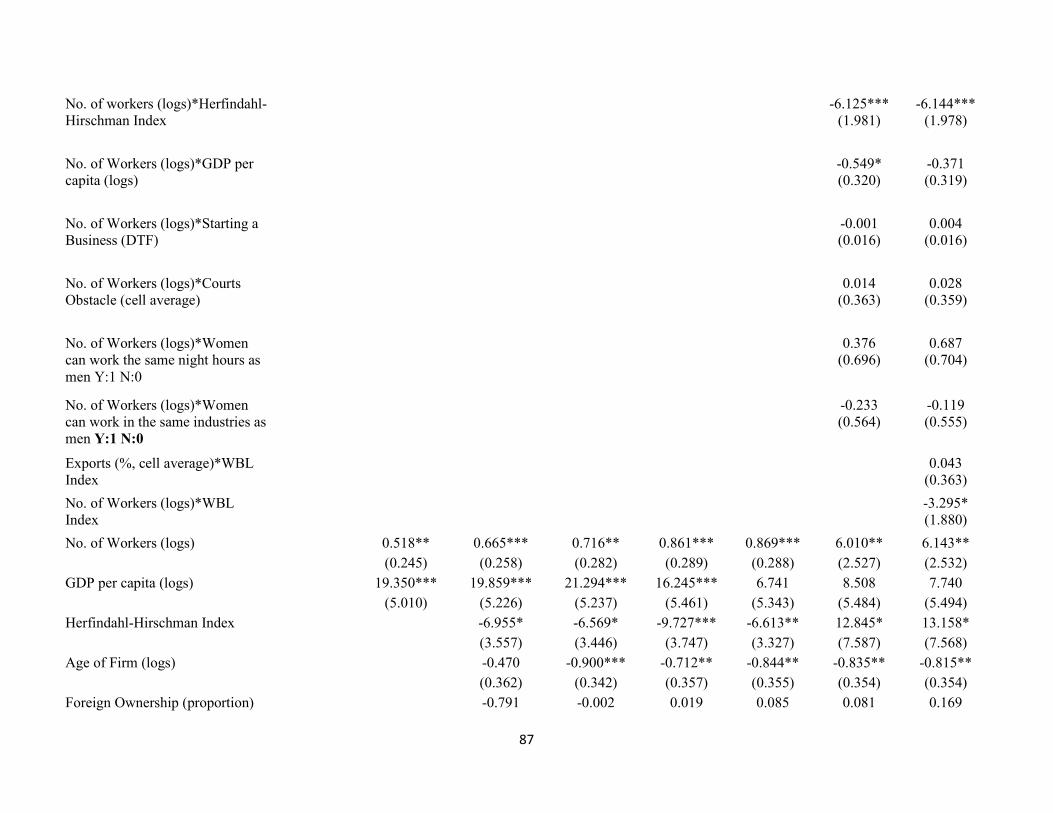
87
No. of workers (logs)*Herfindahl-Hirschman Index
-6.125***
(1.981) -6.144***
(1.978)
No. of Workers (logs)*GDP per capita (logs)
-0.549* (0.320)
-0.371 (0.319)
No. of Workers (logs)*Starting a Business (DTF)
-0.001 (0.016)
0.004 (0.016)
No. of Workers (logs)*Courts Obstacle (cell average)
0.014
(0.363) 0.028
(0.359)
No. of Workers (logs)*Women can work the same night hours as men Y:1 N:0
0.376
(0.696) 0.687
(0.704)
No. of Workers (logs)*Women can work in the same industries as men Y:1 N:0
-0.233 (0.564)
-0.119 (0.555)
Exports (%, cell average)*WBL Index
0.043
(0.363) No. of Workers (logs)*WBL Index
-3.295* (1.880)
No. of Workers (logs)
0.518** 0.665*** 0.716** 0.861*** 0.869*** 6.010** 6.143** (0.245) (0.258) (0.282) (0.289) (0.288) (2.527) (2.532)
GDP per capita (logs)
19.350*** 19.859*** 21.294*** 16.245*** 6.741 8.508 7.740 (5.010) (5.226) (5.237) (5.461) (5.343) (5.484) (5.494)
Herfindahl-Hirschman Index
-6.955* -6.569* -9.727*** -6.613** 12.845* 13.158* (3.557) (3.446) (3.747) (3.327) (7.587) (7.568)
Age of Firm (logs)
-0.470 -0.900*** -0.712** -0.844** -0.835** -0.815** (0.362) (0.342) (0.357) (0.355) (0.354) (0.354)
Foreign Ownership (proportion)
-0.791 -0.002 0.019 0.085 0.081 0.169

88
(0.868) (0.900) (0.969) (0.961) (0.954) (0.954)
Female Ownership Y:1 N:0
6.213*** 6.036*** 5.981*** 6.010*** 6.028*** (0.622) (0.652) (0.653) (0.652) (0.652)
Skills Obstacle (0-4)
0.576** 0.627** 0.608** 0.624** 0.626** (0.231) (0.268) (0.269) (0.267) (0.267)
How Much Of An Obstacle: Transport?
-0.015 (0.195)
0.009 (0.208)
-0.014 (0.208)
-0.019 (0.208)
-0.029 (0.209)
Firm Purchased Fixed Assets Y:1 N:0
-1.001* (0.526)
-1.016* (0.558)
-0.991* (0.557)
-0.924* (0.557)
-0.923* (0.557)
Power Outages (days)
-0.161** -0.146** -0.148** -0.146** (0.069) (0.067) (0.067) (0.067)
Crime Losses Y:1 N:0
-0.606 -0.659 -0.650 -0.665 (0.669) (0.671) (0.672) (0.673)
Firm Inspected Y:1 N:0
-0.753 -0.799 -0.770 -0.764 (0.601) (0.600) (0.595) (0.596)
How Much Of An Obstacle: Tax Rates
-0.245 (0.227)
-0.270 (0.227)
-0.276 (0.227)
-0.284 (0.227)
How Much Of An Obstacle: Labor Regulations?
0.041
(0.299) 0.053
(0.300) 0.040
(0.299) 0.039
(0.298) Population (logs)
-38.727*** -37.235*** -36.871***
(10.834) (10.889) (10.963) Urbanization (%)
1.787*** 1.711*** 1.704*** (0.382) (0.383) (0.378)
WBL Index
14.329* 14.724* 24.534** (8.108) (8.125) (11.212)
Ratio of Female to Male Population
3.289*** (0.682)
3.293*** (0.682)
3.301*** (0.705)
Fertility Rate
-14.080*** -14.013*** -13.892*** (2.943) (2.952) (2.966)
Inflation (%)
0.054 0.057 0.059 (0.060) (0.060) (0.062)

89
Year fixed effects Yes Yes Yes Yes Yes Yes Yes Yes Country-Industry fixed effects Yes Yes Yes Yes Yes Yes Yes Yes Constant 28.864*** -137.286*** -142.785*** -159.907*** -116.971** 356.014** 318.759* 314.341*
(5.496) (41.975) (43.934) (43.977) (45.647) (174.004) (176.062) (178.129) Number of observations 43,198 43,198 42,299 40,237 36,944 36,944 36,944 36,944 R-squared 0.481 0.483 0.488 0.506 0.512 0.515 0.516 0.517
Standard errors in brackets. All standard errors are Huber-White robust and clustered on country-times-industry. Sample size varies due to missing data.