EXPORT OF NITROGEN AND PHOSPHORUS FROM ARTIFICIALLY ...
12
Barkle, G.F., Stenger, R., Moorhead, B., and McKelvey, T., 2017. Export of Nitrogen and Phosphorus from artificially drained dairy pastures in the Hauraki Plains. In: Science and policy: nutrient management challenges for the next generation. (Eds L. D. Currie and M. J. Hedley). http://flrc.massey.ac.nz/publications.html. Occasional Report No. 30. Fertilizer and Lime Research Centre, Massey University, Palmerston North, New Zealand. 12 pages. 1 EXPORT OF NITROGEN AND PHOSPHORUS FROM ARTIFICIALLY DRAINED DAIRY PASTURES IN THE HAURAKI PLAINS 1 Greg Barkle, 2 Roland Stenger, 2 Brian Moorhead, 2 Tasman McKelvey 1 Aqualinc Research Ltd., PO Box 14041, Hamilton 3252 2 Lincoln Agritech Ltd., Private Bag 3062, Hamilton 3240 Email: [email protected] Abstract This work forms part of the MBIE-funded Transfer Pathways Programme, which targets quantification of the pathway-specific transfers of nitrogen (N) and phosphorus (P) from the land to receiving waters, taking lag times and attenuation potentials of the specific pathways into account. Artificial drainage is one of the shallowest and fastest transfer pathways from the paddock to surface waters. N and P lost from the root zone can reach surface waters essentially un-attenuated, as the P-adsorption and denitrification potentials for N removal existing in the subsurface are largely bypassed. We report here on the N and P exports via subsurface drainage measured during the first season of our monitoring programme at two Hauraki Plains field sites with relatively high land use intensities. Subsurface drains at both dairy farms are installed in approx. 0.7 m depth and both field sites have similar ‘catchment areas’ (Waharoa 3.9 ha and Tatuanui 4.3 ha). The field sites have only relatively small differences in soil profile properties, but more pronounced differences in the characteristics of the underlying deposits. As a result, the partitioning of the total water and nutrient flows between shallow lateral flows through the subsurface drains and vertical recharge into the underlying deeper groundwater system is distinctly different between the two sites. At the Waharoa site, the soil profile becomes saturated from the “top down” due to low permeability zones within the soil profile, with drainage discharge beginning eight weeks earlier (mid-May) than at the Tatuanui site (mid-July). A shallow groundwater table seasonally rising into a relatively permeable soil zone is suspected to cause the wetting up of the soil profile from the “bottom up” at Tatuanui. The initial nitrate-N concentrations in Tatuanui drainage water were low (< 1 mg/l NO 3 -N). However, two weeks later nitrate-N concentrations had increased to nearly 9 mg/l NO 3 -N coinciding with peak drainage flow rates of 10 l/s. The initially low nitrate-N concentrations are considered to be due to mixing occurring below the depth of the drainage pipes of the leachate draining from the soil zone with underlying reduced shallow groundwater. This reduced groundwater is due to decomposing peat material residing below the mineral soil in approx. 1 to 10.5 m depth. Once the groundwater table has risen to the depth of the subsurface drainage pipes, the water percolating through the soil zone in response to excess rain is directly intercepted by these drainage pipes. The strong increase in nitrate-N concentrations is thought to be a result of the soil zone leachate entering the drains before any significant mixing with the underlying reduced groundwater can occur. At Tatuanui nitrate-N
Transcript of EXPORT OF NITROGEN AND PHOSPHORUS FROM ARTIFICIALLY ...

Barkle, G.F., Stenger, R., Moorhead, B., and McKelvey, T., 2017. Export of Nitrogen and Phosphorus from artificially drained dairy pastures in the Hauraki Plains. In: Science and policy: nutrient management challenges for the next generation. (Eds L. D. Currie and M. J. Hedley). http://flrc.massey.ac.nz/publications.html. Occasional Report No. 30. Fertilizer and Lime Research Centre, Massey University, Palmerston North, New Zealand. 12 pages.
1
EXPORT OF NITROGEN AND PHOSPHORUS FROM ARTIFICIALLY
DRAINED DAIRY PASTURES IN THE HAURAKI PLAINS
1Greg Barkle,
2Roland Stenger,
2Brian Moorhead,
2Tasman McKelvey
1Aqualinc Research Ltd., PO Box 14041, Hamilton 3252
2Lincoln Agritech Ltd., Private Bag 3062, Hamilton 3240
Email: [email protected]
Abstract
This work forms part of the MBIE-funded Transfer Pathways Programme, which targets
quantification of the pathway-specific transfers of nitrogen (N) and phosphorus (P) from the
land to receiving waters, taking lag times and attenuation potentials of the specific pathways
into account. Artificial drainage is one of the shallowest and fastest transfer pathways from
the paddock to surface waters. N and P lost from the root zone can reach surface waters
essentially un-attenuated, as the P-adsorption and denitrification potentials for N removal
existing in the subsurface are largely bypassed.
We report here on the N and P exports via subsurface drainage measured during the first
season of our monitoring programme at two Hauraki Plains field sites with relatively high
land use intensities. Subsurface drains at both dairy farms are installed in approx. 0.7 m depth
and both field sites have similar ‘catchment areas’ (Waharoa 3.9 ha and Tatuanui 4.3 ha). The
field sites have only relatively small differences in soil profile properties, but more
pronounced differences in the characteristics of the underlying deposits. As a result, the
partitioning of the total water and nutrient flows between shallow lateral flows through the
subsurface drains and vertical recharge into the underlying deeper groundwater system is
distinctly different between the two sites.
At the Waharoa site, the soil profile becomes saturated from the “top down” due to low
permeability zones within the soil profile, with drainage discharge beginning eight weeks
earlier (mid-May) than at the Tatuanui site (mid-July). A shallow groundwater table
seasonally rising into a relatively permeable soil zone is suspected to cause the wetting up of
the soil profile from the “bottom up” at Tatuanui.
The initial nitrate-N concentrations in Tatuanui drainage water were low (< 1 mg/l NO3-N).
However, two weeks later nitrate-N concentrations had increased to nearly 9 mg/l NO3-N
coinciding with peak drainage flow rates of 10 l/s. The initially low nitrate-N concentrations
are considered to be due to mixing occurring below the depth of the drainage pipes of the
leachate draining from the soil zone with underlying reduced shallow groundwater. This
reduced groundwater is due to decomposing peat material residing below the mineral soil in
approx. 1 to 10.5 m depth. Once the groundwater table has risen to the depth of the
subsurface drainage pipes, the water percolating through the soil zone in response to excess
rain is directly intercepted by these drainage pipes. The strong increase in nitrate-N
concentrations is thought to be a result of the soil zone leachate entering the drains before any
significant mixing with the underlying reduced groundwater can occur. At Tatuanui nitrate-N
2
represented 76% of the total-N discharged in the drainage waters over the 2016 drainage
season, while NH4-N and organic N made up the remainder in nearly equal proportions. At
the Waharoa site, nitrate-N made up 86% of the total-N exported, however NH4-N only
contributed approx. 1%, with organic N contributing the remaining 13%. The highest total-P
concentrations at Tatuanui occurred in the early and mid-part of the drainage season at the
peak flows in the drainage hydrograph. Again, this is considered to be due to the influence of
the reduced groundwater residing in the peat layer underlying the mineral soil at the Tatuanui
site. Once the drainage was dominated by soil leachate, the total-P concentrations were
generally low (< 0.004 mg/l). At Tatuanui and Waharoa, dissolved-P represented approx.
58% of the total-P measured, and dissolved reactive P accounted for 27% of total-P.
As the subsurface system is considered to be effectively sealed at the Tatuanui site, with very
little groundwater flow occurring, the artificial drainage pathway is considered to be almost
exclusively the pathway for contaminant export from this site. In contrast, at the Waharoa
site it appears that the shallow groundwater is probably an important contaminant export
pathway additionally to the artificial drainage pathway.
Introduction
The implementation of the National Policy Statement for Freshwater Management (NPS-FM)
has resulted in land managers increasingly being faced with nutrient discharge limits, i.e.
“farming within limits”. Research in recent years has resulted in the identification of
agricultural ‘Best Management Practices’ that minimise nutrient losses from the soil zone.
However, some nutrient losses are still inevitable. This is particularly true for agricultural use
of poorly drained land, which accounts for approx. 40% of our dairying land. Artificial
drainage is installed in these landscapes to enable viable agricultural land use, but this action
can also provide a potential short-circuit for nutrients from the land to streams and rivers. As
the captured drainage bypasses the natural attenuation capacity of the underlying unsaturated
zone and groundwater system (P adsorption, N denitrification), installed subsurface drainage
can provide a direct pathway for surface water pollution with nitrogen (N) & phosphorus (P).
This work is aimed at understanding and quantifying the export pathways of nitrogen and
phosphorus from artificially drained lands into surface waterways on the Hauraki Plains. The
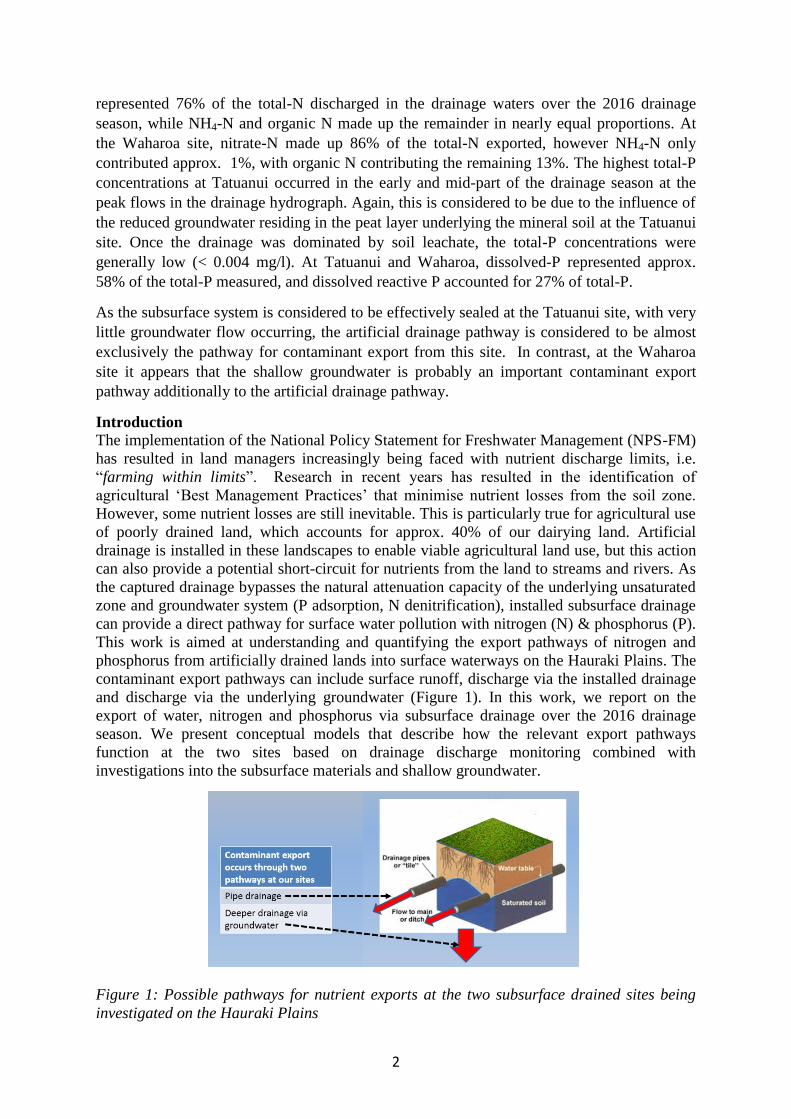
contaminant export pathways can include surface runoff, discharge via the installed drainage
and discharge via the underlying groundwater (Figure 1). In this work, we report on the
export of water, nitrogen and phosphorus via subsurface drainage over the 2016 drainage
season. We present conceptual models that describe how the relevant export pathways
function at the two sites based on drainage discharge monitoring combined with
investigations into the subsurface materials and shallow groundwater.
Figure 1: Possible pathways for nutrient exports at the two subsurface drained sites being
investigated on the Hauraki Plains

3
Field sites
Subsurface drainage flows and concentrations of various N and P species were monitored
over the drainage season in 2016 at two typical dairy farms on the Hauraki Plains.
The Tatuanui site is located close to Morrinsville and the Waharoa site is close to Matamata
(Fig. 2).
Figure 2: Location of the monitored drainage sites at Tatuanui and Waharoa on the Hauraki
Plains
The characteristics of the two farming systems and the drainage field sites is summarised in
Table 1.
Table 1: Characteristics of the farming and drainage system being monitored at the Tatuanui
and Waharoa field sites
Characteristics Tatuanui site Waharoa site
Size of farm 148 ha 59 ha
Drainage catchment
being monitored
4.3 ha installed over four
paddocks
3.9 ha installed over two
paddocks
Drainage system 110 mm Novaflow, spaced at
40 m, 220 m runs, approx. 0.7
m depth
110 mm Novaflow, spaced at 35
m, 330 m runs at approx. 0.7 m
depth
Stocking rate 3.3 Jersey cows/ha 4.4 Jersey cows/ha
S Map information
- family
Waitoaf Typic Acid Gley soil Eurekaf Acidic Orthic Gley soil
- texture Loam over sandy loam Loam
- drainage class Poorly drained Poorly drained
Fertiliser applied in
2016
215 kg N/ha, 65 kg P/ha 100 kg N/ha, 67 kg P/ha
predominately as permeate

4
Olsen P Approx. 34 Approx. 65
Soil moisture and
tension measurement
Volumetric water contents
monitored at 20 and 50 cm
depths at three sites and
continuous tensions measured
in 0.2, 0.5, 0.7, 1.0, and 1.6 m
depths
Volumetric water contents
monitored at 20 and 50 cm
depths at three sites and
continuous tensions measured in
0.2, 0.5, 0.7, 1.0, and 1.6 m
depths
Groundwater
dynamics
Measured manually in up to six
15 mm dia. PVC dip wells and
up to seven 50 mm dia. wells
and logged in 15 min
resolution in one 50 mm dia.
well
Measured manually in up to
nine 15 mm dia. PVC dip wells
and two 50 mm dia. wells and
logged in 15 min resolution in
one 50 mm dia. well
Groundwater quality Currently six shallow and one
deep 50 mm diameter fully
screened wells installed for
profile sampling of the
saturated zone
Currently two 50 mm diameter
fully screened wells installed for
profile sampling of the saturated
zone
Methods
The two drainage sites being investigated in this programme were originally set up by NIWA
as part of a research trial to investigate water table management to enhance nutrient removal
and details on the establishment of the flow monitoring equipment have been reported by
Sukias et al. (2014).
Briefly, at both sites purpose-built surface water measurement flumes have been installed into
which flow from the artificial drainage is routed. At the Tatuanui site, this required the
installation of additional 110 mm smooth bore Nexuscoil pipes (un-punched) from the end of
each drainage pipe to the flume, instead of the open channel delivery system previously used
by NIWA. The height of the water behind the flume is monitored at five-minute resolution,
and this is converted to a flow passing through the flume based on a calibration stage-
discharge relationship for the flume. Samples of the drainage water are collected by ISCO
auto-samplers, based on cumulative flow through the flumes. These are analysed for
concentrations of the various forms of N and P. Mercuric chloride preservative is used in the
samples collected to ensure the samples do not degrade prior to collection from the site and
subsequent analysis. The collection of the samples from the sites depends on rainfall; on
average it was approx. 10 days between site collections over the drainage season. Rainfall at
both sites was measured with a 0.2 mm tipping bucket rain gauge.
The collected samples were analysed for; Total-N (Tot-N), nitrate-N and nitrite-N which is
reported as nitrate-N (NO3-N), and ammonium-N (NH4-N), with organic-N (org-N)
determined by difference between the Tot-N and oxidised-N measurements. In terms of P
analysis, the drainage water samples were analysed for Total-P, Total Dissolved-P (TDP) and
Dissolved Reactive-P (DRP). The measurements were made using a Lachat QuikChem FIA+
8000 series Flow Injection Analyser by NIWA’s Water Analytical laboratory in Hamilton,
the relevant methods are provided in Table 2.
5
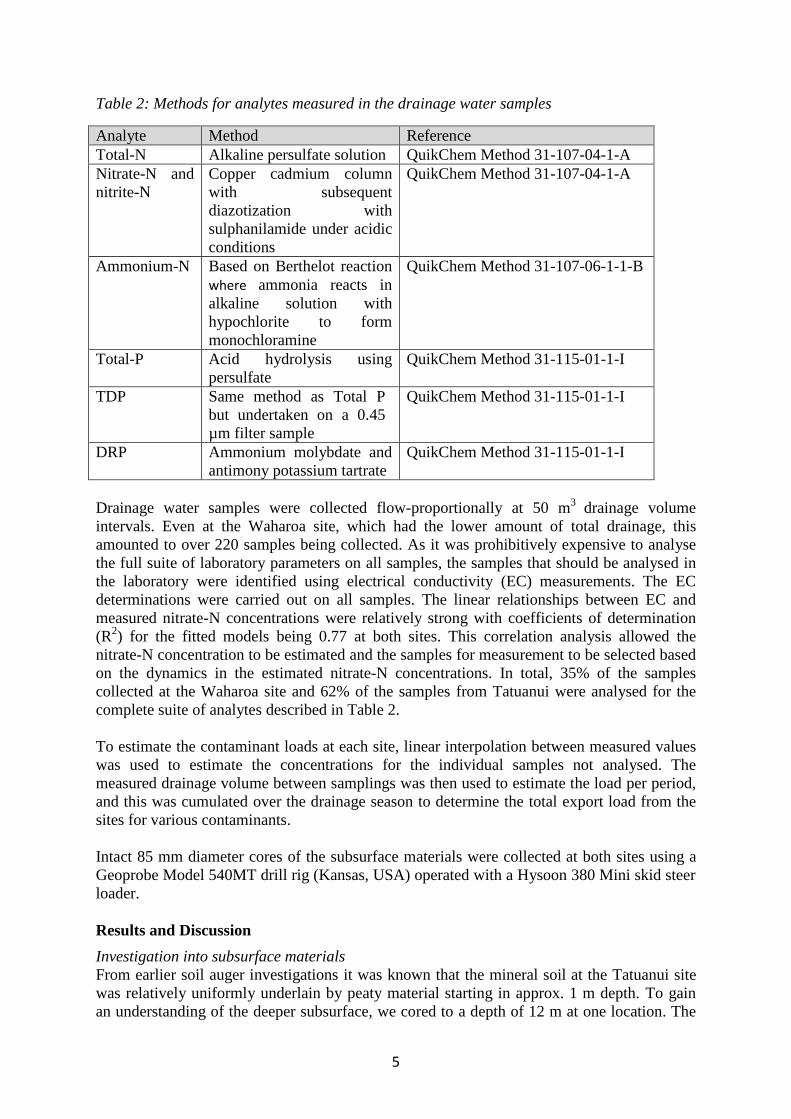
Table 2: Methods for analytes measured in the drainage water samples
Analyte Method Reference
Total-N Alkaline persulfate solution QuikChem Method 31-107-04-1-A
Nitrate-N and
nitrite-N
Copper cadmium column
with subsequent
diazotization with
sulphanilamide under acidic
conditions
QuikChem Method 31-107-04-1-A
Ammonium-N Based on Berthelot reaction
where ammonia reacts in
alkaline solution with
hypochlorite to form
monochloramine
QuikChem Method 31-107-06-1-1-B
Total-P Acid hydrolysis using
persulfate
QuikChem Method 31-115-01-1-I
TDP Same method as Total P
but undertaken on a 0.45
µm filter sample
QuikChem Method 31-115-01-1-I
DRP Ammonium molybdate and
antimony potassium tartrate
QuikChem Method 31-115-01-1-I
Drainage water samples were collected flow-proportionally at 50 m3
drainage volume
intervals. Even at the Waharoa site, which had the lower amount of total drainage, this
amounted to over 220 samples being collected. As it was prohibitively expensive to analyse
the full suite of laboratory parameters on all samples, the samples that should be analysed in
the laboratory were identified using electrical conductivity (EC) measurements. The EC
determinations were carried out on all samples. The linear relationships between EC and
measured nitrate-N concentrations were relatively strong with coefficients of determination
(R2) for the fitted models being 0.77 at both sites. This correlation analysis allowed the
nitrate-N concentration to be estimated and the samples for measurement to be selected based
on the dynamics in the estimated nitrate-N concentrations. In total, 35% of the samples
collected at the Waharoa site and 62% of the samples from Tatuanui were analysed for the
complete suite of analytes described in Table 2.
To estimate the contaminant loads at each site, linear interpolation between measured values
was used to estimate the concentrations for the individual samples not analysed. The
measured drainage volume between samplings was then used to estimate the load per period,
and this was cumulated over the drainage season to determine the total export load from the
sites for various contaminants.
Intact 85 mm diameter cores of the subsurface materials were collected at both sites using a
Geoprobe Model 540MT drill rig (Kansas, USA) operated with a Hysoon 380 Mini skid steer
loader.
Results and Discussion
Investigation into subsurface materials
From earlier soil auger investigations it was known that the mineral soil at the Tatuanui site
was relatively uniformly underlain by peaty material starting in approx. 1 m depth. To gain
an understanding of the deeper subsurface, we cored to a depth of 12 m at one location. The

6
intact cores retrieved from this borehole are shown in Figure 3. This Figure shows friable
dark brown topsoil material and a greyish silty clay material underneath. Due to the softness
of the soil, the upper 1 m of material was compacted into a 0.5 m long core, which made it
impossible to accurately document soil horizon thicknesses. From 1 to 1.5 m depth the
degraded peat material was of a very smooth almost fluid consistency, with no fibrous
organic material being present in the sample. This degraded peat material continued down to
approx. 10.5 m and firmed up slightly with depth. The peat material smelt strongly of
hydrogen sulphide (H2S), which indicates very strongly reduced conditions. Reducing
conditions are important when considering nitrate dynamics, as they are a prerequisite, along
with a source of available carbon, for the conversion of nitrate into nitrogen gases via
microbial denitrification. At a depth of approx. 10.5 m, a greyish/blue silty clay material
began and continued on to at least the bottom of the borehole at 12 m. This material got
slightly sandier with depth but appeared to have a low hydraulic conductivity and is
considered to be the low permeability layer that the peat material had formed upon. The
Childs test (Childs, 1981), which is a reagent used to identify when dissolved ferrous iron is
present in the field, confirmed the strongly reduced redox status of this silty clay material.
Figure 3: Intact cores of subsurface materials collected to 12 m at the Tatuanui field site

7
Based on earlier soil augering at the Waharoa field site, this site was found to be more
variable in the subsurface conditions as compared to Tatuanui and therefore more coring
down to approx. 2 m depth was carried out at this site. A set of representative cores is
presented in Figure 4. This Figure shows the A horizon overlying a loam B horizon to
approx. 0.45 m depth. A strongly redox segregated horizon follows to approx. 0.75 m
depth. This mottled soil material indicates the soil has undergone wetting and drying cycles,
probably due to perched shallow water table condition, causing the dissolved ferrous iron to
precipitate out as ferric iron mottles during the aerobic phases. The perching conditions are
likely to be caused by the slowly permeable clay layer evident at 0.75 to 0.80 m depth in
Figure 4. Beneath this clay lens, there are fine, coarse and very fine sand layers of varying
thickness down to a depth of 2.5 m. These variable sand layers reflect the alluvial nature of
the formation. As indicated by the red Childs test colour response on small sub-samples
shown in Figure 4, there is some evidence of reducing conditions at depth. However, at this
site it is not clear yet what subsurface materials or conditions may be responsible for the
reduced conditions observed.
Figure 4: Intact cores of subsurface material collected to 2.5 m depth at the Waharoa field
site

8
Conceptual Drainage models
Conceptual drainage models have been developed to understand the hydraulic functioning of
the artifical drainage systems and the flow paths partitioning at the two sites. The conceptual
drainage model for the Tatuanui site, shown in Figure 6, is based on the subsurface
effectively acting like a sealed bucket, with the blueish grey silty clay layer at
10.5 m depth as its base. The artificial drainge is installed at the base of the soil zone, which
does not appear to contain any horizon that would significantly restrict vertical water
percolation. In winter, when the groundwater table rises into this drained zone, the installed
artificial drainage will remove the excess water. This drainage model is referred to as
“wetting up from the bottom up”.
Figure 6: Conceptual hydraulic model for how the artificial drainage functions at the
Tatuanui drainage field site
Figure 7: Conceptual hydraulic model for how the artificial drainage functions at the
Waharoa drainage field site (schematic also showing the spatial variability of soil profiles)
9
In comparsion, at the Waharoa site, due to the limiting hydraulic conductivity in the soil zone
and the resulting perched water table, the drainage model is referred to as “wetting up from
the top down”. The artificial drainage is installed approx. at the base of the redox segregated
zone above the limiting clay layer and initially in autumn and early winter will function by
removing water that perches on this layer. When the general regional groundwater table rises
into the drained zone, the artifical drainage will also remove uprising groundwater (Figure 7).
Water flows and nutrient leaching
The drainage discharge at the Tatuanui site did not start until mid July 2016, as seen in Figure
8; this is when the regional groundwater table rose into the artificially drained soil zone. Once
drainage flow was initiated it was very responsive to rainfall events, resulting in a very flashy
flow hydrograph. Over the drainage season (mid July to mid October), the cumulative
drainage flow equated to 90% of the rainfall measured at the site. This indicates that the
subsurface system was hydraulically sealed and the artificial drainage was the only
significant pathway for water leaving the site. This result is consistent with groundwater level
data (not shown), which indicated a very flat groundwater piezometric surface. Combined
with the very low hydraulic conductivity the peat material is likely to have, this observation
further reinforces that contaminant export via the groundwater system is unlikely to be a
significant pathway at the Tatuanui site.
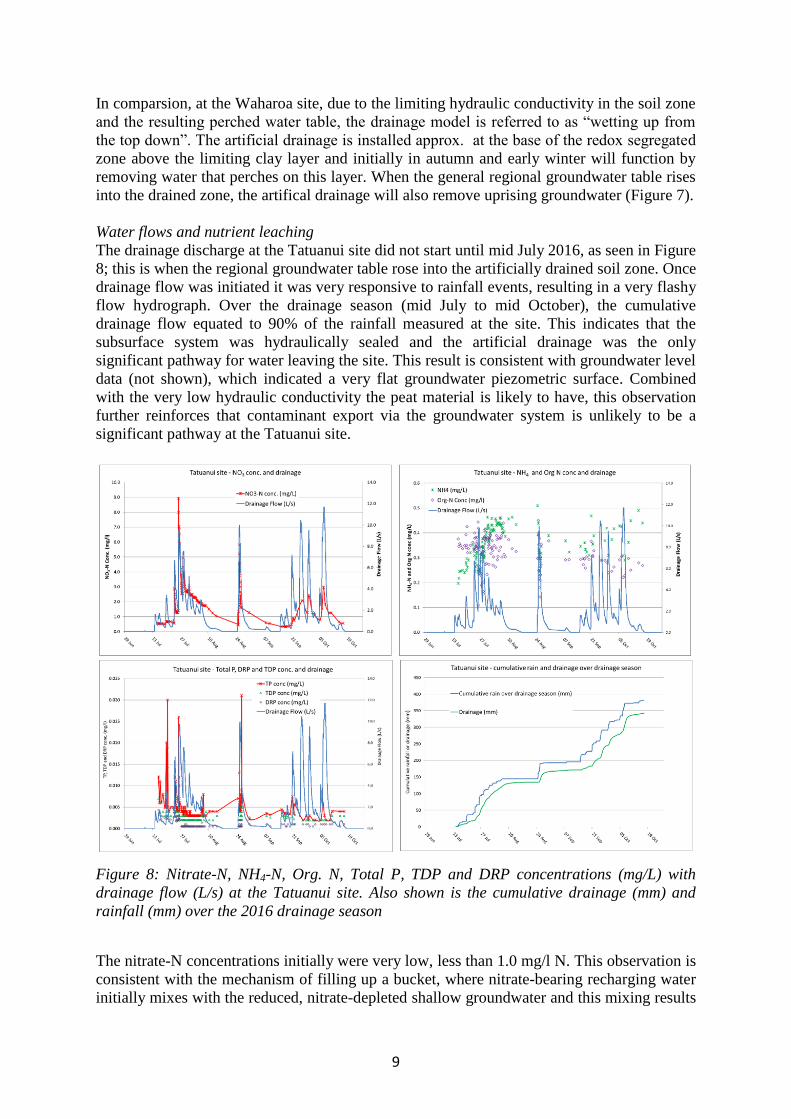
Figure 8: Nitrate-N, NH4-N, Org. N, Total P, TDP and DRP concentrations (mg/L) with
drainage flow (L/s) at the Tatuanui site. Also shown is the cumulative drainage (mm) and
rainfall (mm) over the 2016 drainage season
The nitrate-N concentrations initially were very low, less than 1.0 mg/l N. This observation is
consistent with the mechanism of filling up a bucket, where nitrate-bearing recharging water
initially mixes with the reduced, nitrate-depleted shallow groundwater and this mixing results
10
in a low nitrate concentration at the start of the drainage season when the groundwater table
has risen to the depth of the subsurface drains. Subsequently, the drainage discharge is
dominated by the water and nutrients percolating through the soil zone directly capture into
the drains without mixing with the underlying reduced shallow groundwater. This mechanism
also explains why the nitrate concentrations are elevated up to 9.0 mg/l of NO3-N in the peak
drainage events just two weeks after the initial very low levels. Nitrate concentrations tend to
decline with time over the drainage season as the soil zone is leached of the excess nitrate.
However, these concentrations still correlate well with drainage flow as can be seen in Figure
8. In comparsion to the NO3-N the NH4-N and Org-N values are relatively stable over the
drainage season, with a slight trend in the Org-N to decline with time. The average measured
NH4-N concentration at 0.35 mg/l is somewhat elevated for soil leachate and could reflect the
reduced subsurface conditions, where NH4-N concentrations are commonly elevated.
The Total P, TDP and DRP concentrations are all relatively low. The Total P concentration
demonstrates some response to flow, with concentrations tending to be less elevated with
flow later in the season, and the highest concentrations occurred in the early and mid seasons
peak flow events. The concentrations of the two dissolved P fractions remained relatively
constant over the drainage season and exhibited little relationship with flow as seen in Fig 8.
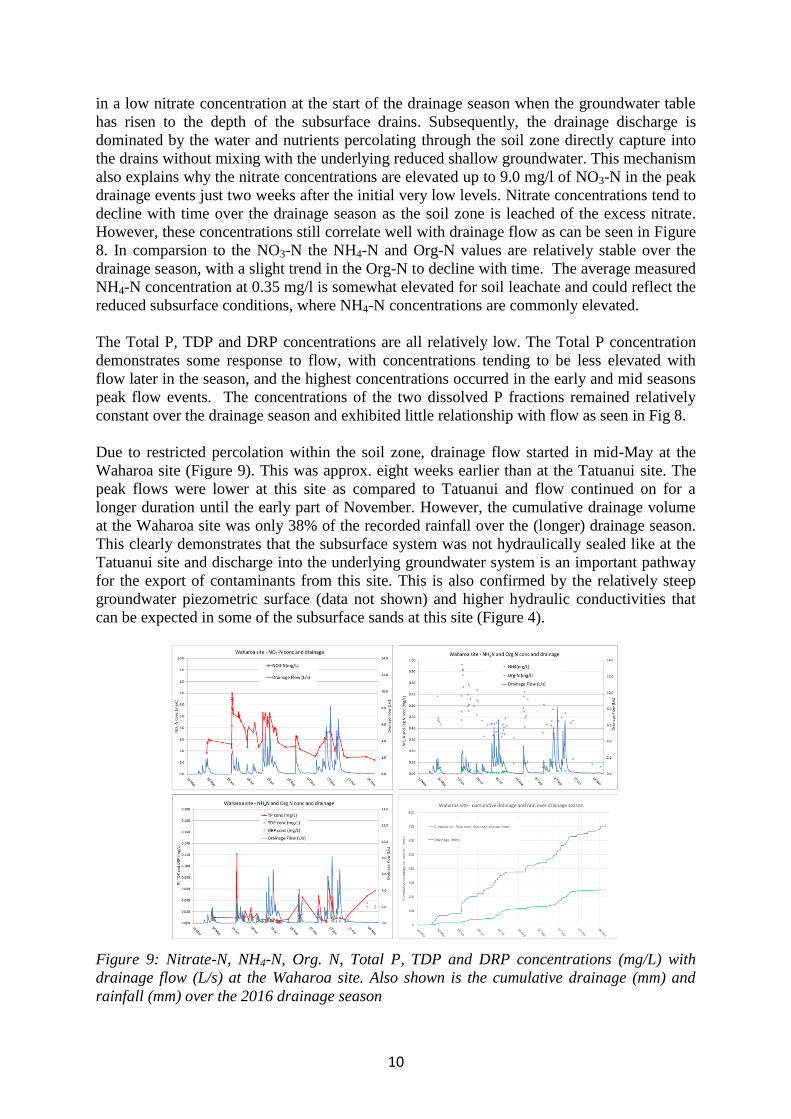
Due to restricted percolation within the soil zone, drainage flow started in mid-May at the
Waharoa site (Figure 9). This was approx. eight weeks earlier than at the Tatuanui site. The
peak flows were lower at this site as compared to Tatuanui and flow continued on for a
longer duration until the early part of November. However, the cumulative drainage volume
at the Waharoa site was only 38% of the recorded rainfall over the (longer) drainage season.
This clearly demonstrates that the subsurface system was not hydraulically sealed like at the
Tatuanui site and discharge into the underlying groundwater system is an important pathway
for the export of contaminants from this site. This is also confirmed by the relatively steep
groundwater piezometric surface (data not shown) and higher hydraulic conductivities that
can be expected in some of the subsurface sands at this site (Figure 4).
Figure 9: Nitrate-N, NH4-N, Org. N, Total P, TDP and DRP concentrations (mg/L) with
drainage flow (L/s) at the Waharoa site. Also shown is the cumulative drainage (mm) and
rainfall (mm) over the 2016 drainage season
11
There was no significant depression in the early season nitrate-N concentrations, which
remained relatively constant throughout the season and not demonstrating the same strong
correlation with flow as was apparent in the Tatuanui data (Figure 9). The NH4-N
concentrations were lower (< 0.10 mg/l) but the org-N concentrations slightly higher than at
Tatuanui.
The Total P concentrations, while still low, were higher at Waharoa than at Tatuanui. This
could reflect the higher Olsen P at this site and/or the fertiliser P being applied in a liquid
permeate form. All three P concentrations at Waharoa responded differently with flow at
different times of the drainage season, sometimes they became elevated when flow increased,
and at other times appear to increase without a significant flow event, or did not response to
an increase in flow.
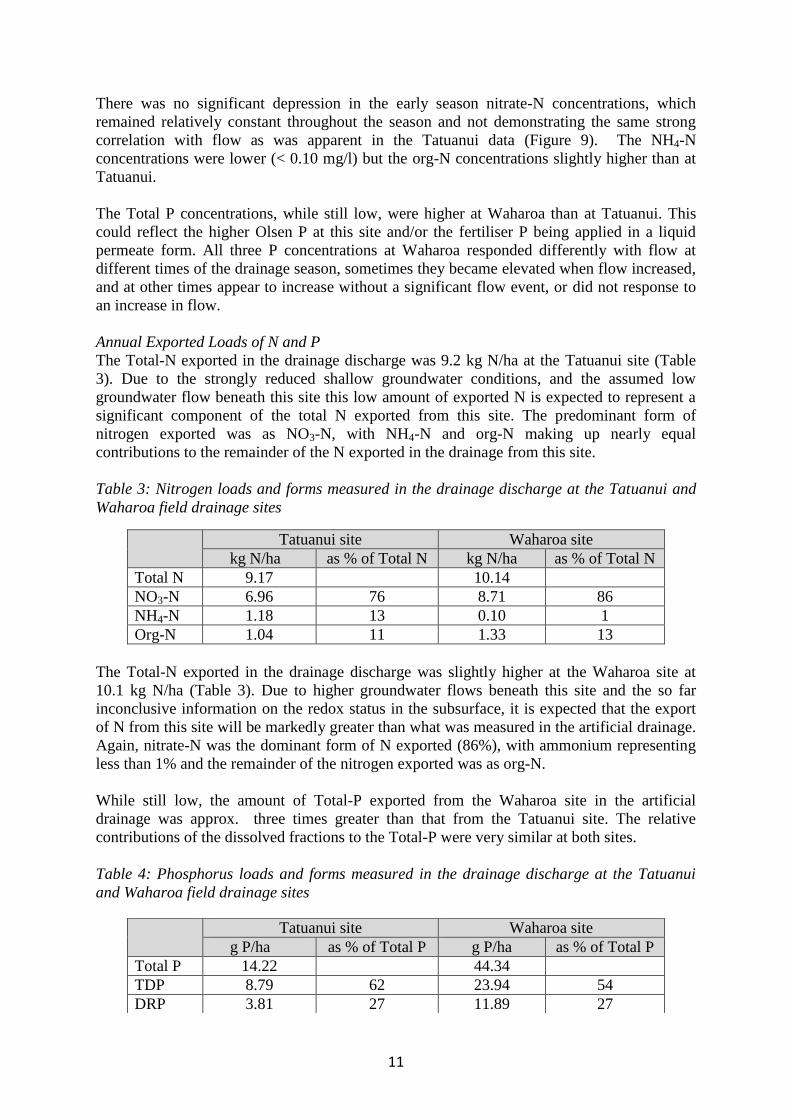
Annual Exported Loads of N and P
The Total-N exported in the drainage discharge was 9.2 kg N/ha at the Tatuanui site (Table
3). Due to the strongly reduced shallow groundwater conditions, and the assumed low
groundwater flow beneath this site this low amount of exported N is expected to represent a
significant component of the total N exported from this site. The predominant form of
nitrogen exported was as NO3-N, with NH4-N and org-N making up nearly equal
contributions to the remainder of the N exported in the drainage from this site.
Table 3: Nitrogen loads and forms measured in the drainage discharge at the Tatuanui and
Waharoa field drainage sites
Tatuanui site Waharoa site
kg N/ha as % of Total N kg N/ha as % of Total N
Total N 9.17 10.14
NO3-N 6.96 76 8.71 86
NH4-N 1.18 13 0.10 1
Org-N 1.04 11 1.33 13
The Total-N exported in the drainage discharge was slightly higher at the Waharoa site at
10.1 kg N/ha (Table 3). Due to higher groundwater flows beneath this site and the so far
inconclusive information on the redox status in the subsurface, it is expected that the export
of N from this site will be markedly greater than what was measured in the artificial drainage.
Again, nitrate-N was the dominant form of N exported (86%), with ammonium representing
less than 1% and the remainder of the nitrogen exported was as org-N.
While still low, the amount of Total-P exported from the Waharoa site in the artificial
drainage was approx. three times greater than that from the Tatuanui site. The relative
contributions of the dissolved fractions to the Total-P were very similar at both sites.
Table 4: Phosphorus loads and forms measured in the drainage discharge at the Tatuanui
and Waharoa field drainage sites
Tatuanui site Waharoa site
g P/ha as % of Total P g P/ha as % of Total P
Total P 14.22 44.34
TDP 8.79 62 23.94 54
DRP 3.81 27 11.89 27

12
Future work
As well as continued monitoring of the nutrient discharges through the installed subsurface
drainage system, future work is targeting at confirming the role of the groundwater pathways
in exporting nutrients from these two sites. This work will include determining the
groundwater flows and associated nutrient loads that are exported from these sites, as well as
understanding the dynamics of when these groundwater pathways are important. In addition,
feasible mitigation options will be identified to reduce the loss of nutrients via these
groundwater pathways.
Conclusions
Despite the S-map soil information, the installed drainage systems, and the land use intensity
at the two field sites being similar, the subsurface flow paths and their effect on actual N
delivery to surface waters are remarkably different. This clearly demonstrates the need to
understand the relevant export flow paths and the attenuation processes occurring along them
in order to fairly implement policies of “managing within limits” and achieve their desired
effects on the environment.
Acknowledgements
We would like to acknowledge and thank our collaborating farmers for their ongoing support
for this project, which would not be possible without their willingness to share data and allow
us access to their properties. This research is funded by MBIE through the Transfer Pathways
Programme (TPP). We gratefully acknowledge additional support provided by DairyNZ and
the Waikato Regional Council.
References
Childs, C.W. 1981. Field test for ferrous iron and ferric-organic complexes in soils. Aust. J.
Soil Res., 19: 175- 180.
QuikChem Method. 2104. Methods List for Automated Ion Analyzers: Flow Injection
Analysis. Lachat Instruments http://www.lachatinstruments.com/applications/methods.asp
Sukias, J., C. Tanner, A. Hughes and P. Pattinson. 2012. Controlled Drainage – assessing
relevance to NZ Pastoral situations. In: Nutrient management for the farm, catchment and
community. (Eds L.D. Currie and C L. Christensen). Occasional Report No. 27. Fertilizer
and Lime Research Centre, Massey University, Palmerston North, New Zealand. 11 pages.