EXPORT-LED GROWTH: LESSONS FROM AUSTRALIA'S … · EXPORT-LED GROWTH: LESSONS FROM AUSTRALIA'S WINE...
55
EXPORT-LED GROWTH: LESSONS FROM AUSTRALIA'S WINE INDUSTRY Kym Anderson School of Economics and Centre for International Economic Studies University of Adelaide Adelaide SA 5005 Phone (08) 8303 4712 Fax (08) 8223 1460 [email protected] June 2000 Publication No. 00/52, Rural Industries Research and Development Corporation. RIRDC’s financial assistance is greatly appreciated. Thanks are also due to Nicholas Berger, Robert Osmond and Glyn Wittwer for their research assistance and collaboration, and to the SA Centre for Economic Studies, the Grape and Wine Research and Development Corporation and the Australian Research Council for supplementary financial assistance.
Transcript of EXPORT-LED GROWTH: LESSONS FROM AUSTRALIA'S … · EXPORT-LED GROWTH: LESSONS FROM AUSTRALIA'S WINE...
EXPORT-LED GROWTH: LESSONS FROM AUSTRALIA'S WINE INDUSTRY
Kym Anderson
School of Economics and Centre for International Economic Studies
University of Adelaide Adelaide SA 5005
Phone (08) 8303 4712 Fax (08) 8223 1460
June 2000
Publication No. 00/52, Rural Industries Research and Development Corporation. RIRDC’s financial assistance is greatly appreciated. Thanks are also due to Nicholas Berger, Robert Osmond and Glyn Wittwer for their research assistance and collaboration, and to the SA Centre for Economic Studies, the Grape and Wine Research and Development Corporation and the Australian Research Council for supplementary financial assistance.

2
Table of contents
List of tables and figures Preface Executive summary 1. Introduction 2. Australia's latest wine boom in historical perspective 3. Australia's latest wine boom in international perspective 4. Is another 'bust' ahead for the wine industry? 5. Lessons for Australia's other small rural industries References

3
List of tables and figures

4
Preface

5
Executive summary

Chapter 1
Introduction The rural sector's share of Australia's exports has been declining for decades. Having been above 60 per cent prior to the 1960s it was around 40 per cent in the 1970s but has been barely above 20 per cent in the 1990s (the same share as services and only two-thirds that of mineral resources -- see ABARE 1997). Nonetheless, Australia's rural exports continue to expand in aggregate value and volume terms and, within that aggregate, some industries are doing better than others of course. This raises the question as to what can be learnt from the successful cases. There is no more spectacular success story than the wine industry during the past decade or so, hence the focus on it in this report.
Nor is there a better time than now to improve the rural sector's export performance, for a number of reasons. Firstly there is an increasing demand for a greater variety of products as incomes grow globally. That is manifesting itself in, among other things, growth in demand for a wider range of exotic foods from foreign countries. One consequence is a rise in the share of processed food in global agricultural and processed food exports: that share rose from one-third in the 1960s to one-half in the 1970s, and it is now around three-fifths (Anderson et al., forthcoming). Specialization in production and intra-industry trade between countries in processed food (including beverages) is likely to continue to grow with incomes and with consumer exposure to exotic foods through travel, providing expanding opportunities for value-added rural exports.
Secondly, the bringing of agriculture under GATT/WTO disciplines will gradually free up world markets for both raw and processed farm products and allow increased exploitation of Australia's agricultural comparative advantages. Agriculture has been the most glaring exception to the general global trend towards lowering trade barriers over the past half century, but thanks to the Uruguay Round the process of reducing agricultural protectionism has at least begun. A new round of WTO trade negotiations is expected to be launched in 2000, with agriculture mandated to be high on the agenda so as to continue that process of farm trade liberalization.
Thirdly, globalization of the world economy in general, even if it does not raise the rural industry's share of Australia's exports, can nonetheless continue to boost the absolute value of those exports, for example through the lowering of transport and communication costs.1 1 Globalization refers to the fact that the world is becoming ever-more integrated. During the 1980s and 1990s especially, domestic and trade policy reforms, the freeing up of financial and foreign exchange markets, and the digital revolution have all contributed to making the global economy even more open and interdependent than it was in the boom times of the late nineteenth century (Baldwin and Martin 1999; Bordo, Eichengreen and Irwin 1999). The resulting boost to economic growth and integration within and between countries in the past decade or two, particularly due to the fall in communication costs, shows no sign of abating. Indicators of the integration trend include increases in exports and imports as a percentage of GDP (doubled since the 1960s), in the tradability of an ever-wider range of services (which now account for more than one-sixth of the world's total goods and services trade), in the share of investment that is foreign (FDI has grown more than twice as fast as exports of goods and services since the mid-1980s), and in the proportion of firm mergers and acquisitions that are across national borders (almost 30 per cent, up from 5 per cent in the early 1980s -- World Bank (1999) and UNCTAD (1999, Figure III.4)). Furthermore, there are various other signs that countries are encouraging
2
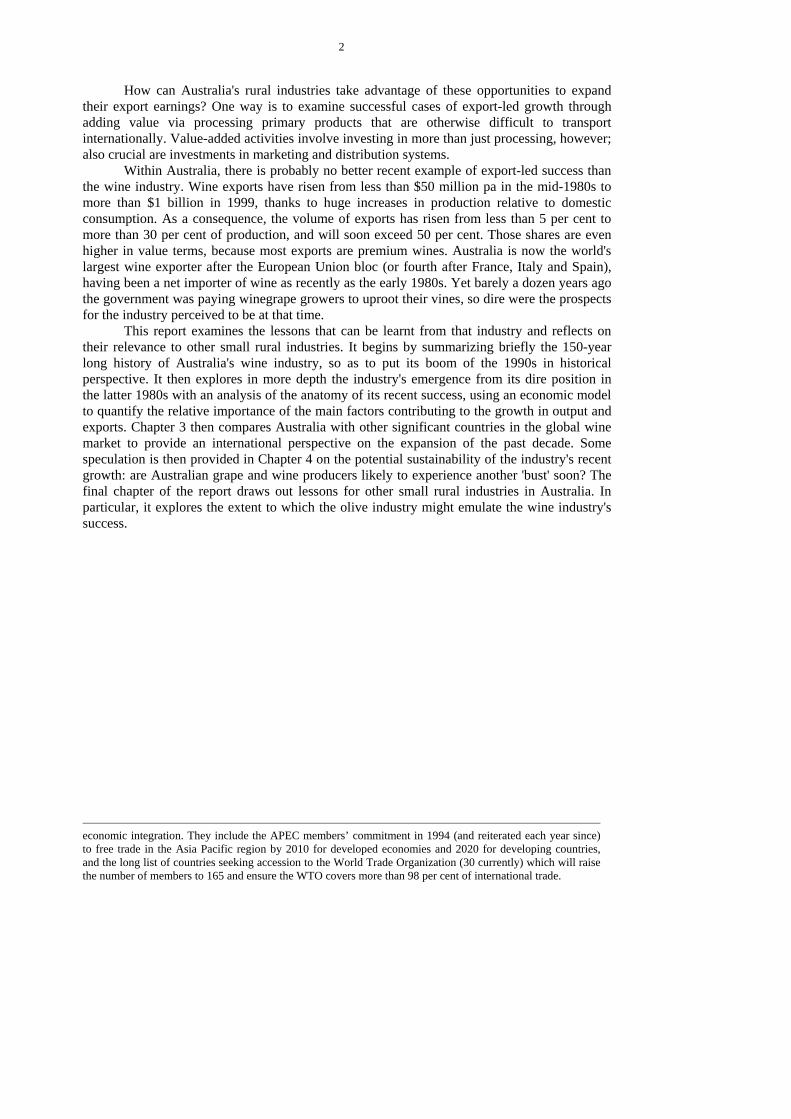
How can Australia's rural industries take advantage of these opportunities to expand their export earnings? One way is to examine successful cases of export-led growth through adding value via processing primary products that are otherwise difficult to transport internationally. Value-added activities involve investing in more than just processing, however; also crucial are investments in marketing and distribution systems.
Within Australia, there is probably no better recent example of export-led success than the wine industry. Wine exports have risen from less than $50 million pa in the mid-1980s to more than $1 billion in 1999, thanks to huge increases in production relative to domestic consumption. As a consequence, the volume of exports has risen from less than 5 per cent to more than 30 per cent of production, and will soon exceed 50 per cent. Those shares are even higher in value terms, because most exports are premium wines. Australia is now the world's largest wine exporter after the European Union bloc (or fourth after France, Italy and Spain), having been a net importer of wine as recently as the early 1980s. Yet barely a dozen years ago the government was paying winegrape growers to uproot their vines, so dire were the prospects for the industry perceived to be at that time. This report examines the lessons that can be learnt from that industry and reflects on their relevance to other small rural industries. It begins by summarizing briefly the 150-year long history of Australia's wine industry, so as to put its boom of the 1990s in historical perspective. It then explores in more depth the industry's emergence from its dire position in the latter 1980s with an analysis of the anatomy of its recent success, using an economic model to quantify the relative importance of the main factors contributing to the growth in output and exports. Chapter 3 then compares Australia with other significant countries in the global wine market to provide an international perspective on the expansion of the past decade. Some speculation is then provided in Chapter 4 on the potential sustainability of the industry's recent growth: are Australian grape and wine producers likely to experience another 'bust' soon? The final chapter of the report draws out lessons for other small rural industries in Australia. In particular, it explores the extent to which the olive industry might emulate the wine industry's success.
economic integration. They include the APEC members’ commitment in 1994 (and reiterated each year since) to free trade in the Asia Pacific region by 2010 for developed economies and 2020 for developing countries, and the long list of countries seeking accession to the World Trade Organization (30 currently) which will raise the number of members to 165 and ensure the WTO covers more than 98 per cent of international trade.

3
Chapter 2
Australia's latest wine boom in historical perspective2
More than 100 years ago it was claimed that “many of the leading wine merchants of London and other important commercial centres admit that Australia promises to become a powerful rival in the world’s markets with the old-established vineyards of Europe” (Irvine, 1892, p. 6). Clearly the Australian wine industry has had a long gestation period. Until the 1970s domestic consumption had grown only very slowly. And while exports have boomed several times in the past, in each case those booms have plateaued and the expanded acreage has meant grapegrowers went back to receiving low returns. Indeed in the latter 1970s/early 1980s exports were so low that Australia became a net importer of wine. And as recently as 1985 a Government-funded vine-pull compensation scheme encouraged grapegrowers to move to alternative crops, so dire were the wine industry’s prospects viewed at the time. Yet, like a phoenix, the industry has risen again and grown with renewed vigour during the past decade. The real value of both winegrape and wine production has grown at more than 10 per cent per annum over the past dozen years. For the first time more than 30 per cent of annual wine sales are now in export markets, up from just 2 or 3 per cent in the mid-1980s. The history of fluctuating fortunes raises the obvious question of whether the export-oriented wine boom of the 1990s is to be followed by yet another crash, at least in winegrape prices if not in wine production and exports. The wine industry is very bullish, having in 1995 set itself targets of doubling exports to $1 billion by the turn of the century (now achieved) and of trebling the real value of wine production within 30 years. Others, aware of the boom-bust cycles of the past, are sceptical or at least still need to be convinced that this time the expanded demand is here to stay long enough for growers to recoup a return from what looks set to be a doubling in Australia’s grapevine area during the 1990s. To help resolve this difference in views, what can we learn from the industry’s history? A report from the University of Adelaide recently examined the industry’s long-run trends and its four previous cycles around those trends since 1850 (Osmond and Anderson 1998).
On the one hand, it is difficult not to be sobered by the past. This is because, as is clear from Figure 1, each of the first four booms in the Australian wine industry finished with a plateau in vineyard area and winery output growth -- periods when returns to grapegrowers and often also winemakers were depressed for years because of the extent of new plantings during the boom. Nor is this phenomenon unique to Australia. On the contrary, it has periodically been the case in grape and wine markets elsewhere in the world for at least two millennia. Surely Australia’s current boom will have to plateau eventually or at least slow down soon? Yet, on the other hand, our past history also is encouraging, because it shows the current boom to have several positive features that contrast with those of earlier booms.
2 This chapter draws on the much more extensive discussion and statistical data reported in Osmond and Anderson (1998). The best available non-empirical histories are by Beeston (1994), Halliday (1994) and, for the pre-1950 period, Laffer (1949). A report of more contemporary times in Australia is also found in Rankine (1996). A delightful capsule history of the wine industry globally can be found in Unwin (1991).

4
Synopsis of the previous four wine booms The timing and magnitude of past booms are summarized in Table 1. The first boom,
from the mid-1850s, was almost exclusively driven by domestic demand growth following the gold-rush induced trebling in Australia’s white population in the 1850s. However, the wine produced from that excessive expansion was not able to be exported profitably, largely because of high duties on inter-colonial trade plus poor marketing and high transport costs in exporting the rather crude product of that time to the Old World. Hence returns slumped quite quickly in that first cycle.
The second boom, from the 1880s, was due to a mixture of domestic and export demand growth, the latter involving better marketing and lower transport costs for what were higher quality but still mostly generic bulk (rather than winery bottled and branded) dry red wines. The relatively open British market absorbed one-sixth of Australia’s production early this century, before the first world war intervened (Figure 2).
The acreage boom induced by soldier settlement after World War I provided the basis for the third export boom, from the mid-1920s. That third boom was helped by irrigation and land development subsidies for soldier settlers, a fortified wine export subsidy equivalent to around 100 per cent, and a 50 per cent imperial tariff preference in the British market for fortified wines. The decline in domestic consumption, induced by the export subsidy and the Depression, added to wine exports in the 1930s – which by then accounted for more than one-fifth of production. The subsequent removal of the export subsidy, and the huge hike in UK tariffs on fortified wine in the latter 1940s, caused a severe decline in export orientation. As well, the return to normal beer consumption after war-induced grain rationing kept down domestic wine sales growth.
The fourth boom, following two post-war decades of slow growth in the industry, was entirely domestic. It emerged as tastes became more European, as licencing and trade practice laws changed with income growth, as corporatization of wineries led to more-sophisticated domestic marketing and new innovations (including casks, or wine-in-a-box), and as Britain’s wine import barriers rose again with its accession to the EEC. Initially domestic demand grew for red wine. Then the cask attracted a new clientele of white wine drinkers, causing Australia's per capita wine consumption to more than treble during the fourth cycle (final column of Table 1). Differences between Australia's current and previous wine booms
How does the fifth and latest boom, which began in the late 1980s, differ from the earlier booms? In terms of duration, the current boom is already 12 years old and still on-going, compared with 17, 15, 10 and 7 years, respectively, for the previous four acreage spurts. Certainly it involves the biggest acreage expansion, but in proportional terms that expansion is not yet as big as some of the earlier ones (Figure 1 and Table 1). When expressed as wine and shown on a log-linear scale, as in Figure 3, the rate of growth of wine output over the past decade or so does not look very different from previous decades.
However, there are some other differences between the present and previous booms that are non-trivial.
One difference is that the current boom is overwhelmingly export-oriented, since per capita consumption has been static over the 1990s. This contrasts with the first and fourth booms at least, which were primarily domestic. It also differs from the inter-war boom which

5
took on exports more as a way of disposing of soldier-settlement induced surplus production than as a pre-planned growth strategy.
Secondly, the current boom is mainly market-driven, which is not unlike the first two booms but contrasts markedly with the third (inter-war) boom: that third boom evaporated once government assistance measures were withdrawn. In the present boom the only form of assistance offered and hence able to be withdrawn is the incentive to expand plantings via the tax-reducing accelerated depreciation allowance for some vineyard construction costs. A third feature distinguishing the current situation is the health factor. An ever-wider appreciation of the desirability of moderate over heavy drinking, and in particular of the possible health benefits of a regular moderate intake of red wine, is ensuring that the consumer trend towards spending on quality rather than quantity of wine (and on wine in preference to beer and spirits) will continue for the foreseeable future. Western European producers (who supply about 60 per cent of global production) have been slow to respond to that change in consumer preferences, because their price premia are blunted by EU support policies and their appellation controls restrict changes in winegrape varieties and production techniques. That has left an opening for other (including Australian) producers to expand their production and exports of quality wine.
In response to that opportunity, the average quality of Australia's grape and wine output has improved vastly during the past decade or so, with premium red production rising faster than premium white, and non-premium output actually declining slightly (Figure 4). Moreover, for the first time, the industry is in a strong position to build brand, regional, and varietal images abroad to capitalize on those quality improvements. That image building has been partly generic, with the help of the Australian Wine Bureau’s activities in Europe and elsewhere. It is coming also from the promotional activities of individual corporations and their local representatives abroad as those firms become ever-larger and more multinational via mergers and takeovers during the past dozen or so years. And finally, Australian wines are still exceptionally good value for money in Northern Hemisphere markets, despite the real price increases of the 1990s. The depreciation of the Australian dollar in 1985-87 helped kick-start the export boom, and the subsequent devaluation during 1997-99 has assisted again.
Accounting for the recent output growth3 During the decade to 1996, wine production increased by 45 per cent in Australia.
The composition of output also altered substantially, with premium output more than doubling (red more that white) while non-premium output declined slightly. This section seeks to quantify the relative importance of the various factors contributing to that growth, both to help project what might happen in the industry during the next few years (see below) and to help identify potential sources of growth that other industries might exploit.
For both the historical (1986 to 1996) and the prospective (to 2003) growth accounting exercises, an economy-wide computable general equilibrium (CGE) model for Australia is used. To keep the task manageable, attention is focused on the contributions of four factors in particular: export demand growth, domestic consumer taste changes, domestic consumer tax changes, and technological changes in the grape and wine industries. In doing so, macroeconomic changes such as in incomes and real exchange rates, as well as growth in other sectors of the economy, also are taken into account.
3 This section draws on Wittwer and Anderson (1999).

6
The modified computable general equilibrium (CGE) model of the Australian economy used here, FEDSA-WINE, is a disaggregated form of the national ORANI model, the latest version of which is fully documented in Horridge, Parmenter and Pearson et al. (1998). The FEDSA-WINE model thus has all the attributes and limitations of the ORANI comparative static CGE model, with the additional feature that three grape and three wine industries/product groups are disaggregated from other horticulture and other beverages, respectively (and South Australia is separated from the rest of Australia, although for brevity results are shown here only for Australia as a whole). A description of the model can be found in Wittwer and Anderson (1998, Appendix A). The data base in FEDSA-WINE has been set at 1995-96, from which a backcast to 1985-86 and a forecast to 2002-03 are made.
There are several reasons for analysing the grape and wine industries with a CGE model despite these industries currently accounting for less than 0.2 per cent of Australia's GDP. First, the model was available for use.4 Second, since the domestic market accounts for the majority of sales, it is important to project domestic consumption formally, taking into account changes in after-tax prices and income, in population, and in preferences. Thirdly, the CGE model provides an appropriate framework for estimating export demand effects when there are changes in the real exchange rate. And finally, by modeling growth in the rest of the economy, it is possible to distinguish between factors specific to the grape and wine industries and more general factors that contribute to ‘background’ economic growth.
The estimates of the impacts of different effects on the wine industry over the ten vintages to 1996 come from decomposing the effects of a historical simulation of the period. This is an alternative to comparative static analysis, in that it takes account of influences outside the wine industry, including technological change in other industries, changes in the real exchange rate, and observed changes in total real household consumption in the period. In addition, the method captures the direct influences on industry growth usually undertaken with comparative static analysis, including growth in export demand for wine and changes in taxes on wine consumption. Given the lack of econometric estimates for the ever-changing grape and wine industry, the need simply to assume certain parameter values cannot be avoided. Notwithstanding this limitation, the economy-wide modeling approach ensures that all the behavioural reactions to changes in variables are taken into account. In this sense, the model is more than a sophisticated adding-up machine, because it demands internal consistency and market clearing as the various actors in the economy adjust to imposed shocks.
The historical data Table 2 shows pertinent data for Australia in the two 3-year periods surrounding the
1986 and 1996 vintages, including total and annual average rates of growth in those variables over the decade between those two periods. At the macroeconomic level, income growth allowed Australia’s aggregate real consumption of goods and services to rise 38 per cent over that decade. But consumption of wine fell by 2 per cent, despite the income growth and an adult population increase of 19 per cent. This is not unlike the trend in Western Europe, where consumption of both beer and wine have fallen substantially, partly for health reasons (PVGD 1997; Berger, Anderson and Stringer 1998). However, within the wine category, there has been a marked switch in consumption from non-premium to (especially red)
4 It was developed for examining tax reform options in an earlier study, where it was necessary to consider the effect on the whole economy of the proposed move to a goods-and-services tax, as well as the feedback to wine production and consumption, rather than examine just grapes and wine in isolation (Wittwer and Anderson 1998).
Deleted: ndeed,
Deleted: GST
Deleted: tax reform
Deleted: on the whole economy
Deleted: an
Deleted: d
Deleted: model
Deleted: ,

7
premium wine, in Australia as elsewhere. Even more dramatic has been the boom in wine exports: Australia’s exports of premium wine have grown more than ten-fold since the mid-1980s, raising the share of production exported from less than 5 per cent to more than 30 per cent. To accommodate a rapid increase in export demand, producers responded with an almost 80 per cent increase in plantings of premium wine grapes in the decade to 1996 -- or 150 per cent when the period is extended to 1998. Together with increases in yields per hectare, that area expansion has allowed the quantity of premium wine production to more than double. Meanwhile, substantial increases in ad valorem taxes on domestic wine consumption have discouraged domestic sales and thereby encouraged a larger share of premium wine to be exported; and tariff reductions have contributed to increased imports of wine (especially non-premium, albeit from a very low base).
Modeling growth in reverse (backcasting)
The starting point for the historical simulation is the 1996 database. Due to the very large changes in prices, export volumes and output in the focus period, the decade was split for modeling convenience into three: 1986 to 1990, 1990 to 1993 and 1993 to 1996.5 The closure, that is, the combination of endogenous and exogenous variables within the model, was altered to allow an exogenous shock to some variables that are usually treated as endogenous. These variables include the wine consumption and export changes shown in Table 2. In addition, shocks on variables that are generally exogenous capture the impacts of consumer tax changes and increased grape plantings. Total factor productivity growth in the grape and wine industries was endogenised by ascribing observed changes to grape and wine industry employment, land usage and estimates of changes in industry capital stocks. Total factor productivity growth for remaining industries in the economy was extrapolated from Dixon and Rimmer (1998), assuming that it was greatest in mining, followed by agriculture and manufactures. Observed changes in Australia’s macroeconomic variables including real aggregate consumption, real investment and the value of exports were imposed after the closure swaps. Changes in public spending and in the trade balance also were shocked using variables that are typically exogenous.
Decomposing changes in the grape and wine industries
The decade divides neatly into three sub-periods, each with its own features. The first, from 1986 to 1990, started with such gloomy prospects within the grape and wine industries that the South Australian and Commonwealth governments introduced a vine-pull scheme for a short time. But with the real exchange rate falling 30 per cent over the five years to 1986, a few large firms in the industry realised there were expanding market opportunities overseas so they began increasing exports, albeit from a low base. Then between 1990 to 1993, a global recession occurred and export demand growth slowed, causing export and domestic wine prices to fall. Domestic red wine consumption also did not grow during that recessionary sub-period. Between 1993 and 1996, however, further rapid growth in demand at home and abroad, at least for premium red wine and to a lesser extent premium white wine, resulted in grape growers experiencing price hikes to record highs. This in turn induced rapid vineyard expansion. Therefore, none of these sub-periods during the decade could be thought of as being in equilibrium. Around 1986, domestic market signals encouraged an exodus of
5 Shocks were ascribed to the model to depict the observed changes in simulating back one decade in these three steps, based on three-year averages surrounding 1986, 1990, 1993 and 1996. Three year averages help to smooth short-term fluctuations due to weather.

8
resources from the industry, with only a few firms initially recognising the potential that a devaluation of the currency in the preceding four years offered for export growth. Then the recession of the early 1990s dampened the optimism that was building in the industry by the late 1980s, slowing the supply response to expanding export market opportunities. By 1996, vineyard plantings were still accelerating. Thus the decade commenced with the pulling of vines out of unprofitable vineyards, and ended with the high profits that were being made in established vineyards attracting funds to expand the existing area at an unprecedented rate.
The disequilibria were as follows. In the mid-1980s, grape growers would have been constrained from exiting the industry by the high costs of switching to another form of horticulture or agriculture, so an excess of capital prevailed in the industry, driving down rates of return. Due in part to the recession of the early 1990s, there was a considerable lag before grape growers and winemakers responded to a significant grape price recovery, driven substantially by the increase in premium wine export demand. For some years growers may have perceived the recovery as sufficient only to maintain profits in the industry at its then present size, because substantial price rises were observed only after the slump in the early 1990s (Wittwer and Anderson 1998, Figure 1). Since it takes up to five years for a vineyard to produce a commercially viable crop, by the mid-1990s the grape supply expansion was only starting to catch up with the growth in demand.
Bearing in mind that both the beginning and end of the historical period were characterised by disequilibria, what can our model results tell us about the relative importance of the various factors contributing to the wine boom over that decade? This requires a decomposition of the changes in the grape and wine industries, and changes in the rest of the economy, over the focus period. The shocked variables that are usually endogenous were swapped to become exogenous. That is, the endogenous changes of the swapped variables in the historical simulation are imposed as exogenous shocks in the decomposition simulation. Tables 3 and 4 summarise the contributions of different supply, demand and technology effects to the total change in the six segments of the grape and wine industries between 1986 and 1996. The aim of the decomposition is to explain as much of the industries’ growth as possible over that decade, while distinguishing effects specific to these industries from other economy-wide effects. Columns 1 to 4 of Tables 3 and 4 capture effects relatively specific to the grape and wine industries, and column 5 captures effects that impact on the economy at large. To help interpret the numbers, begin with domestic changes in beverage preferences and the growth in demand for Australia’s wine exports, before turning to wine consumer tax changes, technology changes and factors in other parts of the economy.
(i) Domestic taste changes and growth in wine export demand There were distinct differences in the market between premium red and premium
white winegrapes and wine during the decade. Premium white grapes and wine started the decade with higher average prices than those for premium red varieties. Indeed, Chardonnay grape prices reached record levels in Australia in 1989. But a slight domestic taste swing against premium white wine prevailed during the decade (column 1 of Tables 3 and 4).
For premium red output, a combination of a substantial positive domestic taste swing, growth in overseas export demand, and a depressed market at the start of the decade resulted in large overall increases in red prices during the decade. The recession of the early 1990s, by delaying the supply response, contributed to the price hike of the mid-1990s.
Changing domestic preferences towards premium wine and increased export demand (columns 1 and 2 of Table 3) account for around two-thirds of all observed growth in premium red output (82 out of 119 per cent total growth for red wine). Increased export demand accounted for two-fifths of the growth in the premium white grape and wine

9
industries, with little effect from domestic taste changes. These factors had a strong negative effect on non-premium output, however, reducing non-premium wine production by 27 per cent.6
Together with associated increases in red wine stocks, one would expect the two effects to account for all the increase in red wine prices not accounted for by the historical increase in wine taxes. Within the model, these two effects are responsible for raising the real consumer price of red wine by 35 per cent, or three-quarters of its overall 47 per cent hike (columns 1 and 2 of Table 3).
(ii) Increases in Commonwealth wine taxes and State franchise fees The Commonwealth Government introduced a 10 per cent wholesale sales tax on
wine in August 1984, which had increased to 31 per cent by August 1993, before settling at 26 per cent in July 1995 after several adjustments. In addition, there were modest increases in State Government franchise fees on retail alcohol sales. The impact of increased taxes on domestic consumption had a marked effect on exports of all three types of wine in terms of percentage changes from 1986 levels (column 3 of Table 3) but, when measured in terms of levels (column 3 of Table 4), the impact on exports is quite small. This is because output is reduced by the increase in consumption taxes. That is, while such an increase diverts some sales from the domestic market to exports, the net effect on exports is small. For premium red wine, for example, changes in taxes account for little more than one fiftieth of total export growth (29 per cent out of 1,332 per cent, Table 3).
The largest impact of taxes has been on consumer prices. For premium red wine, for example, taxes contributed 12 out of the 47 per cent real increase in price, equivalent to over $1 per litre.7
(iii) Primary factor-saving technological changes in the grape and wine industries During the decade, there was a marked increase in the proportion of winegrapes
harvested mechanically. This decreased the labour-intensity of winegrape production, so there was no increase in employment in the industry between 1986 and 1993. But between 1993 and 1996, employment in vineyards increased by 30 per cent. Since the land used for winegrapes in the decade to 1996 increased by 34 per cent, this might suggest little decrease over the decade in the labour intensity of winegrape production. But this would be a wrong interpretation, since much of the more recent employment growth has been associated with the construction of new vineyards -- and those new vineyards had still not yielded a commercial crop by 1996.
As for the wine industry, employment over the decade grew by 77 per cent according to ABS census data, while output grew by only 45 per cent. On the surface, this implies an increase in labour intensity in winemaking. However, within each winery premium wine production is substantially more labour-intensive than non-premium production. Even in wineries where the volume of non-premium wine is substantially greater than the premium
6 Growing export demand had both output-reducing and output-increasing effects on the non-premium segment of the market. While there was an observed increase in the volume of non-premium wine exports during the decade, the increasing profitability of the premium segment of the industry induced substitution from non-premium into premium production. Some grape growers did this in the most direct and rapid manner possible, by grafting premium varieties onto non-premium vinestocks. That effect of export demand growth for premium wine was therefore output-reducing for non-premium wine. But since export demand and the volume of non-premium wine exports also grew, a substantial increase in non-premium imports was needed to meet domestic demand. 7 Since the tax is ad valorem, the total real change is also endogenous to other factors affecting price. This explains why the percentage changes in consumer prices differ between wine types.
10
volume, winemakers pay most attention to premium produce. Therefore, employment growth per unit of wine output mainly reflects an increase in premium wine’s share of total production rather than a switch towards more labour-intensive methods of producing the two types of wine.
Detailed capital data are not readily available. Hence capital usage changes had to be inferred for grape growing, partly from the area of grapes harvested. For all the grape and wine industries, changes in the rate of return on capital are assumed to track changes in output prices. In this way changes in capital usage are made endogenous.
In addition to the lack of data on changes in capital usage and to details of labour employment by wine type, estimates used for total factor productivity changes in the grape and wine industries are approximate for a number of other reasons too. For premium red wine, growth in wine stocks at the end of the decade (not captured in the historical version of the model) would imply larger output changes than modelled, resulting in an underestimate of total factor productivity growth. The converse applies for the non-premium grape and wine industries. Furthermore, wine is a highly differentiated product. Within the three grape and wine types, it is highly probable that there have been significant quality improvements from 1986 to 1996. By not capturing those quality improvements, the impact of export demand growth and, for red wine, domestic taste changes on the industry may be overstated to some extent, and the role of changing technology understated. Even so, the results suggest total factor productivity growth within the decade had a substantially larger influence on the industry than taxation increases.
(iv) Other sources of growth Column 5 in Tables 3 and 4 captures the effects on the industries of influences in
other parts of the Australian economy in the decade to 1996. These include increases in the total labour force, population, and aggregate real domestic spending (both public and private), real exchange rate changes, and smaller effects including technological growth in industries other than grapes and wine and cuts in import tariffs. These effects, which in the absence of other information may approximate the “expected” growth of the industry, account for less than one-third of the total premium wine output increase in the period. General economic growth alleviated the effect on non-premium grape and wine output of the domestic taste switch away from non-premium wine to premium wines, and the overall decrease in per capita consumption associated with this switch. (v) Summary
The Australian wine industry's dramatic growth since the mid-1980s has come mostly from a significant move into export markets. That was initially stimulated by a 30 per cent decline in the Australian dollar’s real exchange rate in the first half of the 1980s. In the mid-1980s, virtually all segments of the industry were domestically focussed, whereas by 1998 exports accounted for almost 30 per cent of all wine production. As modelled using FEDSA-WINE, an increase in export demand explains much of the industry’s growth. This reflects an increasing emphasis on quality in the industry, sustained generic and brand marketing efforts that have greatly boosted Australia’s image as a producer of good value-for-money wines overseas, the development of more-effective distribution systems in key markets abroad, and an autonomous switch by consumers both in Australia and elsewhere towards premium wine (driven in part by health considerations, especially for reds).
Within the next five years, export sales could well account for the majority of Australian wine sold. So how long the current boom lasts will depend more on export demand for Australian wine than on domestic consumers. That export demand in turn

11
depends not only on the export marketing skills and efforts by the industry to improve their distribution networks (including through mergers with and acquisitions of or by overseas wine companies), but also on supply and demand developments elsewhere in the world wine market, to which attention now turns.

12
Chapter 3
Australia's latest wine boom in international perspective8 In exploring the key features of Australia’s evolving position relative to other players in the international wine trade, pertinent questions to address include the following: How is Australia ranking as a world wine producer and exporter? How does growth of Australia's wine production and exports compare with that of other New World wine producers? How well is Australia penetrating traditional and new wine markets abroad? To what extent is Australia upgrading the quality of its exports relative to other exporters? This chapter addresses these questions but, as a prelude, a brief overview of the world wine market is provided.
Background to the global wine market
Wine is still very much a European product. More than three-quarters of the volume of world wine production, consumption and trade involve Europe, and most of the rest involves just a handful of New World countries settled by Europeans (Table 5). In the late 1980s Europe accounted in value terms for all but 5 per cent of wine exports and three-quarters of wine imports globally. However, Europe’s dominance is beginning to weaken. In the ten years to 1997, the rest of the world’s share of wine export dollars rose ten percentage points, virtually all from California and six Southern Hemisphere countries (column 1 of Table 6). When intra-European Union trade is excluded, the decline in Europe’s share of global exports is even greater over that decade: a fall from 88 per cent to 70 per cent (column 3 of Table 6).
The rapid growth in wine exports from the New World over the past decade is ironic, in that it coincides with a decline in world wine consumption. Over the decade to 1997, global wine production and consumption fell at 0.8 per cent and 0.4 per cent per year, respectively, and yet global wine trade rose by 4.1 per cent per year in volume terms and 6.5 per cent in value terms -- or 9.7 per cent if intra-EU trade is excluded (final rows of Tables 5 and 6).
Traditionally the countries producing wine were also the countries consuming it, with only about one-tenth of global sales being across national borders, and most of that was with near neighbours. The proportion traded rose a little over the 1980s, but has since risen much more so that now about one-quarter of the volume of wine sales is international (Table 7). That is, despite a slight decrease in the per capita volume of consumption globally, wine is becoming much more of an internationally traded product. This is reflected in the final columns of Tables 7 and 8, which show production tending to outpace consumption in the wine-exporting countries and vice versa in the wine-importing countries. Trade is also becoming more inter-regional: in the late 1980s, 62 per cent of international wine trade was among the 15 members of the European Union, whereas by 1997 the intra-EU share was only 48 per cent.
8 This chapter draws on Anderson and Berger (1999) and the extensive data in Berger, Spahni and Anderson (1999).
13
How well is Australia doing relative to other producers?
In terms of global wine production, Australia has always been a small player. Prior to the 1970s it accounted for less than 1 per cent of world production, and as recently as 1987 its share had barely risen to 1.2 per cent. During the following ten years the share doubled, to 2.3 per cent, but on its own that statistic still makes Australia look rather insignificant.
In terms of exports, Australia was even less significant until the 1990s. As recently as the first half of the 1980s the country accounted, in volume terms, for only 0.2 per cent of global wine exports, the same as its share of global wine imports. The import share has changed little, but the export share has shot up to 3.0 per cent in volume terms (Table 5) and 4.8 per cent in value terms (Table 6). In fact Australia’s wine exports grew more than three times faster than the global average: at annual rates of 16 per cent in volume terms and 21 per cent in value terms over that period (Table 8). That was sufficient to ensure the industry reached its target of A$1 billion of wine exports in 1999.
Rapid though Australia's export growth has been, it is not as fast as that for other Southern Hemisphere wine exporters, who as a group enjoyed a growth rate about ten percentage points faster (27 per cent p.a. for volume and 30 per cent for value in the decade to 1997). Nor was it much faster than that for North America or Europe's transition economies (columns 1 and 2 of Table 8). It is simply faster than that for Western Europe, which is still the dominant exporter group.
What is striking from the right hand columns of Table 8 is the different reasons for these high rates of New World export growth. Australia's exports grew rapidly because its production growth was much faster than its consumption growth. By contrast, in North America much slower production growth accompanied no growth in the aggregate volume of consumption. Meanwhile, in the other New World countries production actually declined, but much less so than domestic consumption, allowing exports to boom. Volumes of consumption per capita have become somewhat more equal across regions as a result but, as column 2 of Table 7 shows, there is still a wide variance.
The world’s top ten wine exporting countries account for 90 per cent of the value of international wine trade, with Europe’s economies in transition from socialism accounting for most of the rest (left-hand column of Table 9). Of those top ten, half are in Western Europe and the other half are New World suppliers, led by Australia. Australia is the world's fourth largest exporter of wine in value terms, after France (alone accounting for more than 40 per cent), Italy (17 per cent) and Spain (9 per cent). The share of France has dropped ten percentage points since the late 1980s, which with smaller drops for Italy and Germany have ensured that Australia's and others' shares have risen substantially.
If the European Union is treated as a single trader and so intra-EU trade is excluded from the EU and world trade data, the EU’s share of world exports shows a much bigger fall, from 82 per cent to 59 per cent in the decade to 1997. With that adjustment, Australia moves to number two in the world. Its share of global exports rises from less than 5 per cent to more than 9 per cent. It is this fact, in spite of Australia's small share of global production, which has made Australia suddenly a much more significant player in the world wine market. Meanwhile, the share of the other main New World exporters in Table 9 (Argentina, Chile, New Zealand, South Africa, and the US) rises even faster, from 6 per cent to 19 per cent. That is, while Australia has done very well as an expanding wine exporter, it is not alone: the world wine market as a whole is becoming more internationalized, and most key New World
14
suppliers are expanding their export sales (albeit from a lower base) nearly as fast or even faster than Australia, as is clear from Figure 5. How well is Australia penetrating the various markets abroad?
Just as exports are highly concentrated, so too are imports. The ten top importing countries accounted for all but 15 per cent of the value of global imports in the late 1980s. That 15 per cent residual had risen to 20 per cent by 1997, due mainly to Germany's reduced import share, indicating some growth of new markets. But more than half the value of all imports continue to be bought by the three biggest importers: the UK (with 21 per cent), the US and Germany (each with about 14 per cent -- see Figure 6).9
Despite that concentration, the ten top exporters are quite different in their penetration of those and other import markets. This is evident from Table 9. In Australia's case, it has concentrated on four English-speaking rich countries: the United Kingdom, the United States, Canada and New Zealand. When depicted as shares of Australia's total wine exports, it appears Australia has not diversified its exports much over the past decade: since 1993 those four countries have accounted for between 75 per cent and 85 per cent of Australian sales abroad. Certainly Australia has gradually increased its dominance as an importer in all four of those markets, especially the UK and US; but it has done so at the expense of boosting its shares in continental Western Europe (most notably Germany, the world's biggest importer of red wine) and in the emerging markets of East Asia (Figure 7). How well is Australia doing in upgrading its export quality? A crude index of the quality of a country's wine exports is the average export price. To see how different exporting countries are faring relatively, Figure 8 shows each exporter's average price as a percentage of the global average, minus 100, at the beginning and end of the decade to 1997. While France's strong position has changed little, Australia and New Zealand have improved their positions hugely to rival the quality dominance of France’s exports. New Zealand’s average export price is well ahead of France’s now, and Australia is just a few cents per litre behind France. Meanwhile, the price of exports from other Southern Hemisphere suppliers is now only half the Australian average.
However, even though the Australian average unit export price rose 52 per cent over the decade to 1997 when the global average rose only 20 per cent, complacency is not called for. The rise for Australia was exceeded by Chile (55 per cent), Italy (59 per cent), New Zealand (61 per cent), and Argentina (63 per cent), and not far behind were the United States (44 per cent), South Africa (39 per cent) and even Europe's transition economies (31 per cent). Clearly, other new exporters are striving to raise the quality of their exports just as much as Australia, albeit from different bases. The global average increase was as low as 20 per cent mainly because the average price of exports from France and Spain rose little and, in Portugal's case, fell over the decade.
Conclusion 9 In volume terms, Germany is the largest importer of wine (19 per cent of the world total), followed by the United Kingdom (17 per cent), France (10 per cent) and the United States (8 per cent).

15
While the Australian wine industry has performed spectacularly over the past dozen years relative not only to other rural industries in Australia but also to Old World wine-producing countries, its performance is being matched by producers in other New World countries. Hence it will not be without strong competition in international markets. Moreover, the export growth of the New World producers is occurring in an environment where aggregate global wine consumption is declining. That raises the obvious question as to whether another wine glut is imminent, to which we now turn.

16
Chapter 4
Is another 'bust' ahead for the wine industry?
The absence of growth in demand for wine in aggregate, nationally and globally, need
not in itself be a cause for concern. This is because the demand for premium wine has been growing rapidly, at the expense of non-premium wine, and Australia's production is being increasingly oriented towards higher-quality products. However, other New World producers are also upgrading the quality of their product, as are previously low-quality regions of traditional supplying countries (the south of France, La Mancha in Spain, northern Italy, Southeastern Europe). The key challenge for Australian grape and wine producers is to remain internationally competitive in the wake of the taste changes and that supply response elsewhere. To that end, a number of strategies suggest themselves.
Strategies for maintaining profitability in the wine industry
One is to lobby to reduce and hopefully eliminate the Federal Government's so-called 'wine equalization tax' (WET) of 29 per cent, which is to come into force on 1 July 2000 with the GST. That WET, together with the 10 per cent GST on wine, is supposed to be tax-revenue neutral as a replacement of the current 41 per cent wholesale sales tax on wine. But in fact it will generate much more tax revenue from the industry than currently (Anderson and Wittwer 1999), and will make Australia one of the highest taxing of the wine-producing countries in the world (Berger and Anderson 1999). Reducing that WET would reduce its future discouragement to domestic wine consumption (especially of premium wine, since it raises the consumer price of wine by more dollars the higher the wine's price), and thereby lower the volume of premium wine that would need to be exported.
A second strategy is to continue to invest in the production and dissemination of new ideas in winegrape and wine production and in wine marketing and distribution. To date Australia has been a leader in wine R&D investments and in the rapid adoption of new technologies, which has given producers a significant competitive edge. The raising of the research levy on producers by more than one-third from this year will boost that tradition. However, Southern Hemisphere and Southern and Eastern European suppliers are catching up rapidly, including through international technology transfer. Australia is contributing to that in at least two ways. One is via Australian viticulturalists and winemakers exporting their services thorough spending time abroad as consultants (Smart 1999). Another is via direct foreign investment (DFI) by Australia's bigger wine companies in grape production, wine making, and/or wine marketing and distribution in other countries. These possibilities will help to keep profits of Australian-based multinational wine companies higher than they otherwise would be, but eventually will tend to put more downward pressure on the currently very high prices for winegrapes in Australia. Even so, those individuals and firms so engaged as consultants and investors abroad are continually bringing back new ideas to Australia too, some of which could lower grapegrowers' costs of production.
Such international technology transfers are not peculiar to the wine industry of course -- it is part of the general contribution by multi-national corporations (MNCs) to
17
globalization, aided by reforms to restrictions on DFI and by the fall in communication costs thanks to the digital revolution. The distinctive feature of this phenomenon is that successful MNCs have so-called 'knowledge capital' that is internationally mobile and hence tends to relocate to places where it can earn higher rewards (Carr, Markusen and Maskus 1999). This has important consequences for Australian winegrape growers. During recent years they have enjoyed an exceptionally high proportion of the benefits of the growth in demand for premium wine, in the form of high prices for their grapes. Were those high prices to continue, large wine firms may find it more profitable to expand their crushing capacity in lower-priced countries rather than in Australia in the years ahead (thereby causing winegrape prices to tend to equalize across countries, even though the grapes themselves are not traded internationally).10 Small winemakers also might be affected adversely in so far as the spreading abroad of Australian expertise in viticulture, winemaking and wine marketing eventually would reduce the distinctiveness of 'Australian' wine in the global marketplace.
A third strategy is to complete the definition of boundaries for the various regions and sub-regions ('geographical indications') so as to increase the payoff to producers in those regions from promoting their products on a regional basis. Australia was the first country to respond to pressure from the European Union to phase out the use of European names on wine labels. In return, Australia is able to register getting property rights recognised globally for its own geographical indications. Because of that opportunity, it needs to now capitalize on its head start over other New World producers before South Africa, the United Sates and others catch up in this respect (Kok 1999). Corporate brand advertising will still remain the dominant form of promotion, but regional branding will add to 'Brand Australia' as an additional and more-specific means of generic promotion of the nation's wines. A fourth strategy involves diversifying the destinations for Australia's exports as more exportable production comes on stream. The current narrowness of that distribution is clear from Figure 7, and from the fact that more than three-quarters of Australia's wine export earnings still come from just four English-speaking countries. Of course there are good reasons for low shares in some other markets. One is that the types and qualities of wine Australia exports may be not well matched with the types/qualities currently imported by some of the major importing countries. For example, France imports mainly very low quality wine (priced at one-quarter Australia's average export price), and the same is true for Europe's transition economies and, to a lesser extent, for the Netherlands and Sweden (Anderson and Berger 1999, Table 8). That is not the case in Japan though, yet Australia sells a very small proportion of its premium wine to Japan (while contributing a relatively high proportion of Japan's imports of other goods). This is probably due to Australia not being perceived by the Japanese as a super-premium supplier, having exported relatively low quality wine there in the early 1990s. Nor has Australia made much of an inroad into Germany, despite it being the world's biggest red wine importer. To date that has been because of insufficient premium red wine being available for export. As supplies expand over the next few years, the scope for high returns from further efforts in marketing and trade diplomacy in such countries will grow commensurately. At present Germany buys mostly from France and Italy. But since its red imports are twelve times Australia's current premium red wine export volume, there is ample scope for that market alone to absorb all of Australia's
10 Since the grapegrowers’ share of the pre-tax wholesale price of wine in Australia is currently at the top end of the usual 20-30 per cent range, the proportional decline in their returns could be perhaps two or three times as large as any percentage decline in wholesale wine prices.

18
expected output increase without reducing German imports from other EU countries very much or Australian producers' prices.11
Fifthly, attention needs to focus as well on the numerous barriers to wine imports abroad. Fortunately, a new round of agricultural trade negotiations is expected to be launched by the World Trade Organization (WTO) next year. That provides an opportunity to expand market access through the lowering of tariff and non-tariff import barriers, including through such trade facilitation measures as harmonization of standards. Import tariffs themselves are not very large except in East Asia (Berger and Anderson 1999). However, Old World fears of growing competition in the European and East Asian wine markets from New World suppliers could lead to the provision of more subsidies and protection via non-tariff measures by the European Commission. Already recent subsidies to producers in the EU to help upgrade their wine industry are reputed to be of the order of US$2.3 billion, over which negotiations could be targeted. There is also the possibility that the Uruguay Round agreements on Technical Barriers to Trade, on Sanitary and Phytosanitary Measures, and on Trade-Related Intellectual Property could be abused to provide hidden forms of protection to the EU industry.
New World wine exporters need to develop ways to make the most of the opportunity to become active participants, for the first time, in the next WTO round of multilateral trade negotiations. While each of those suppliers alone is not a very big player in the world wine market, their combined share of the value of global wine exports (excluding intra-EU trade) is 29 per cent, which is a sizeable counterweight to the EU's share of 55 per cent (column 3 of Table 6). It thus makes eminent sense for them to form a coalition for the purpose of dealing with the EU, including in multilateral negotiations. That was done recently, in the form of the New World Wine Producers' Forum that involves officials and wine industry representatives meeting twice a year (Battaglene 1999). Building up that new informal institution, by drawing on the huge success during the Uruguay Round of the Cairns Group of like-minded agricultural-exporting countries, is likely to have a high payoff during and beyond this next round of WTO trade talks.
Future prospects for wine
On balance, the wine industry’s future looks very bright for the next few years at least. Beyond that, grapegrowers’ returns will continue at high levels only if demand for Australian wines continues to grow more rapidly than supply. That each of the booms in vineyard area in the past has been followed by a long plateau and a large decline in grape prices is sobering. Yet the reasons as to why this present boom may be sustained for a longer than usual period are encouraging, and are continuing to stimulate new planting investments.
Of particular interest is the likely impact of future growth on returns to grapegrowers relative to winemakers. The former have enjoyed a rising share of the benefits of the current boom so far, but for how much longer? Should international prices of Australian wines fall, winemakers will inevitably pass the decline back to grapegrowers. Since the grapegrowers’ share of the pre-tax wholesale price of wine is currently at the top end of the usual 20-30 per cent range, the proportional decline in their returns could be considerable, perhaps two or three times as large as any percentage decline in wholesale wine prices. Potential investors in vineyards need to be aware of that risk.
11 Or at least not in foreign currency terms. If the expected appreciation of the Australian dollar during 2000 and beyond materializes (perhaps to 72-75 US cents, compared with about 63-65 US cents in 1999), that would mean a constant US dollar price would translate to a 15 per cent lower Australian dollar value.

19
To get some idea of that prospect, the FEDSA-WINE model of the Australian economy, discussed in Chapter 2 for accounting for past growth, can be used also to forecast the effects of the anticipated increase in the supply of winegrapes and wine into the future. This entails the use of macroeconomic projections plus projections of what is likely to happen in the grape and wine industries themselves. The latter is possible to 2003 at least because that can capture the grape supply effect of known actual and intended plantings in the late 1990s. Using FEDSA-WINE to project to 2003
The method used for projecting the effects of increased grape and wine supply is to impose exogenous increases in land and capital usage in the grape industries and exogenous increases in capital usage on the wine industry. These increases match the industry’s projected increase in winegrape area, shown in Table 12. In addition, total factor productivity gains are impose on all industries in the model, and export demand growth and domestic taste changes are assumed to continue as in the historical period 1986-96 but at a slower pace (Table 12).12 The assumed real exchange rate change between 1998 and 2003 is then varied to observe how sensitive the grape and wine industries will be to that important variable. Specifically, the base case with no change in the real exchange rate is compared with a 10 per cent real depreciation. Finally, the base case is compared to a scenario in which the domestic consumer tax on premium wine is lowered from the present rate of 48 per cent to 16 per cent (which is still double the OECD average rate).13
The base case projection from 1998 to 2003
The base projection has domestic premium red wine consumption increasing from 53 Ml (megalitres) in 1998 to 95 Ml in 2003 (Table 7). In the same period, premium white wine consumption is projected to increase from 65 Ml to 90 Ml, with non-premium wine consumption increasing only slightly from 249 Ml to 267 Ml. The producer and consumer prices are projected to fall as early as 2000. This assumes that in 1998, industry prices were well above equilibrium levels and that they will move closer to equilibrium by 2003 with the substantial supply increase. Premium red grape prices are projected to fall from $1,606 to $1,106 per tonne (-31 per cent) between 1998 and 2003 (Table 7). That projected 2003 price approximates the real prices recorded during the 1994 vintage (Figure 1). Over the same period, premium white grape prices are projected to fall from $985 to $825 per tonne (-16 per cent), still higher than the real price recorded during the 1994 vintage. These projected falls in grape prices are similar to those forecast by ABARE, who expect the real price of Riverland Chardonnay and Cabernet Sauvignon to fall by around one third between 1998 and 2003 (Shepherd 1998, Table 1). ABARE projects less growth in wine exports over those five years (an increase of about 200kt compared with our 300kt). A possible reason for the larger excess domestic supply in our modeling is that we assumed annual TFP growth is 1.0 per cent, approximating estimates from the historical simulations 12 The assumed export demand shifts between 1998 and 2003 are based on estimated shifts between 1990 and 1998. Since the volume of premium wine exports grew by around seven-fold in this period, we have scaled down the proportional shifts for forecasting, bearing in mind the massive recent expansion in premium winegrape vineyards abroad. A downwards adjustment also applies to assumed domestic taste changes. 13 The tax on non-premium wine is left unchanged since at 48 per cent it already approximates twice the OECD average of 26 per cent (Berger and Anderson 1999, Table 2).
20
(Table 8). Our forecast domestic consumption also differs from ABARE, since it is based on a demand function that depends on prices, income, population and taste changes. Had we used the taste changes estimated between 1986 and 1996, consumption would have been slightly lower than shown in Table 12. But between 1996 and 1998, there was a marked swing towards wine, with domestic consumers increasing per capita consumption of all wine types despite real prices increasing. Given this altered pattern, in forecasting to 2003 we have assumed that there is a slight taste swing towards premium white wine, and a weaker swing against non-premium wine, than in the decade to 1996. Price falls are projected for as early as 2000 for premium winegrapes, given the substantial increase in supply between 1998 and 2000. Consumer prices for premium wines correspondingly fall, but by smaller proportions than grape prices. It is possible that the price downturn for wine could be delayed for another season or two beyond 2000, if the stockholding ratio falls less quickly than modelled.14 The per litre price of premium red wine falls from $13.87 to $12.22 (-12 per cent) and premium white wine from $11.31 to $10.59 (-6 per cent) in the five years to 2003 (Table 7). Due to the rapid increase in premium red grape production between 1998 and 2003, the export supply of premium wine is projected to escalate in this period. Premium red wine exports increase from 77 Ml in 1998 to 328 Ml in 2003, while premium white wine exports increase from 74 Ml to 130 Ml, with little change in non-premium exports. But a different trend than projected in wine stocks could alter the outcome: for example, if premium red stocks accumulate at a more rapid rate than in our model, a smaller increase in their export volume would result. Another possibility is that more premium winegrapes are used in non-premium wine production than we assume in our base case. This may arise if the supply of premium grapes by 2003 exceeds the processing, storage and marketing capacity of the premium industry. We project an increase in premium red wine production of 120 per cent between 1998 and 2003, compared with an overall increase of only 50 per cent for all wine. A shortage of premium processing and storage capacity may be one of the reasons for premium red winegrapes being diverted into non-premium wine production. Such an adjustment would impact on future returns to grape producers, due to the lower price of premium grapes used in non-premium wine production. Winemakers will be reluctant to make such a switch, however, as the fall in premium wine prices from increased premium supply is likely to be considerably smaller than the fall in wine prices associated with downgrading to non-premium wine. Projecting from 1998 to 2003 with a real depreciation of 10 per cent. A real depreciation of the Australian dollar of 10 per cent between 1998 and 2003 reduces projected growth in the domestic consumption of premium wine (Table 7). Premium red consumption reaches 91 Ml by 2003 instead of 95 Ml as in the constant real exchange rate case, while premium white consumption is 90 instead of 86 Ml and non-premium wine consumption is 267 instead of 263 Ml. A real depreciation encourages the wine industry to be more export-oriented. For example, premium red wine exports in 2003 are 28 Ml higher in this than in the base case, the difference increase being equal to almost half the total premium red exports for 1998. The real depreciation also reduces the decline in Australian dollar grape 14 We project an increase in premium red wine stocks from 364 Ml in 1998 to 631 Ml in 2003, which represents a decline in stocks as a proportion of annual production from 1.60 to 1.23.
21
prices brought about by the massive increase in the supply of premium winegrapes. Premium red grapes are $44 per tonne higher in this than in the base case, premium white grapes are $35 per tonne higher, and non-premium grapes are $36 per tonne higher (Table 7). Consumer prices for wine also are higher than in the base case. Premium red wine is $12.87 per litre, $0.65 higher than the base case, removing two-fifths of the base case price fall between 1998 and 2003. While production is higher by around 4 per cent for each wine type with the devaluation, much of the increase in exports is brought about through a smaller than otherwise build-up of premium red wine stocks (Table 7).15 Reducing the consumer tax on premium wine Consumers of wine in Australia are taxed at a very high ad valorem rate of 48 per cent. This compares with an average consumer tax equivalent (CTE) rate for OECD countries of 8 per cent for premium wine and 26 per cent for non-premium wine, not counting VAT (Berger and Anderson 1999). The final scenario considered here is to project forward to 2003 as before except cutting the wine CTE to about double the OECD average. This involves a cut on premium wine tax to 16 per cent while not cutting the non-premium rate so that, in volumetric terms, the latter tax is about the same as for premium wine. With such a tax reform domestic consumption of premium wine increases from 95 Ml to 107 Ml for red wine, and from 90 Ml to 102 Ml for white wine.16 The impact on industry output is small, with the premium segment expanding by less than 0.5 per cent relative to the base case. This small change is due to our assumption that land in the winegrape industries and capital in all the winegrape and wine industries is the same in this as in the base scenario, leaving labour as the only variable factor within these industries. Importantly for producers, however, the volume of premium exports required to maintain the same total volume of sales as in the base case reduces significantly. Consumer prices drop significantly for premium wine, by over $1.50 per litre. A further concern is that the premium wine processing, storage and marketing capacity may not grow quickly enough to accommodate the increased premium winegrape supply projected for 2003. If this is so, the industry may not be able to process such grapes at an optimal time or in an optimal manner. A consequent diversion of premium red winegrapes into bulk wine production and sales would reduce the price paid for such grapes, and threaten the financial viability of individual growers. Recent entrants to the premium grapegrowing industry may be the most vulnerable, as established growers with long-term contracts are likely to receive priority in having their grapes processed into premium wine if the expected shortage of capacity in fact materializes. For Australian consumers, the increasing supply of premium wine is ostensibly good news, with average retail prices likely to fall. But consumers of ultra-premium wine may find that
15 The effects of a real appreciation essentially are equal and opposite those of a real depreciation. The wine industry would become less export-oriented, with an increase in domestic consumption and a decrease in exports. Grape prices would fall by more than in the base case, as would wine prices. 16 In per capita terms, in the 2003 base case, premium consumption is 4.8 litres for red wine and 4.5 litres for white wine. These levels increase to 5.4 litres and 5.2 litres, respectively, in the tax reform scenario.

22
the supply changes little or indeed that the prices of some products will rise to close the still-large gap between Australian producers’ prices and their competitors’ prices abroad. That is, relatively rare products may not decrease in price, even if continuing quality improvements ensure many lower and mid-range premium products become even better value for money than at present. Two obvious ways to alleviate falls in premium grape prices present themselves. The first is an expansion in investments in the winery processing and storage capacity, beyond those already planned. The second, which is supplementary rather than a substitute for the first, is an expansion in investments in promotion of Australian premium wines, especially overseas. The changes in labelling and the new regional boundaries being formed in response to the European Union-Australian Wine Agreement provide scope for adding more precision to the targeting of such marketing efforts.

23
References ABS (1998a), Sales of Australian Wine and Brandy by Winemakers, Catalogue no. 8504.0. Canberra: Australian Bureau of Statistics, September. ABS (1998b), Australian Wine and Grape Industry, Catalogue no. 1329.0. Canberra: Australian Bureau of Statistics, December. Berger, N. and K. Anderson (1999), ‘Consumer and Import Taxes in the World Wine Market: Australia in International Perspective’, CIES Policy Discussion Paper 99/03, University of Adelaide, February (Revision of a paper presented to the 43rd Annual Conference of the Australian Agricultural and Resource Economics Society, Christchurch, 20-22 January 1999). Harrison, J. and K. Pearson (1994a), “User’s Guide to TABLO, GEMSIM and TABLO-Generated Programs”, GEMPACK User Documentation GPD-2, Release 5.1, Volume 2, Clayton: Centre of Policy Studies and the IMPACT Project, Monash University. Harrison, J. and K. Pearson (1994b), “Computing Solutions for Large Scale General Equilibrium Models Using GEMPACK”, Preliminary Working Paper No. IP-64, Clayton: Centre of Policy Studies and the IMPACT Project, Monash University. Knopke, P., L. Strappazzon and J. Mullen (1995), ‘Productivity growth: Total factor productivity on Australian broadacre farms’, Australian Commodities 2(4): 486-97, December. Madden, J. (1990), FEDERAL: A Two-region Multisectoral Fiscal Model of the Australian Economy, unpublished Ph.D Thesis, University of Tasmania, Hobart. Meagher, G.A., B. Parmenter, R. Rimmer and K. Clements (1985), ‘ORANI-WINE: Tax Issues and the Australian Wine Industry’, Review of Marketing and Agricultural Economics 53(2): 47-62, August. Osmond, R. and K. Anderson (1998), Trends and Cycles in the Australian Wine Industry, 1850 to 2000, Adelaide: Centre for International Economic Studies, June. PISA (1997), South Australian Winegrape Utilisation and Pricing Surveys 1996, (Grape Advisory Committee, Phylloxera and Grape Industry Board of South Australia), Adelaide: Primary Industries South Australia. Clements, K. and Selvanathan, S. (1991), ‘The Economic Determinants of Alcohol Consumption’, Australian Journal of Agricultural Economics 35(2): 209-231, August. Dixon, P.B., B.R. Parmenter, J.Sutton and D.P. Vincent (1982), ORANI: A Multisectoral Model of the Australian Economy, Amsterdam: North-Holland. Stanford, L. (1998), ‘The Role of Grape Prices in Forward Planning: Are Supply Overshoots Inevitable?’ mimeo, Australian Wine and Brandy Corporation, Adelaide, November. Shepherd, A. (1999), ‘Winegrapes Outlook to 2003-04’, Australian Commodities 6: 84-90, March (published by ABARE). WFA (1998), 1998 Statistical Report, Adelaide: Winemakers’ Federation of Australia. Dixon, P.B., B.R. Parmenter, J.Sutton and D.P. Vincent (1982), ORANI: A Multisectoral Model of the Australian Economy, Amsterdam: North-Holland. Wittwer, G. and K. Anderson (1998), Tax Reform and the Australian Wine Industry, Adelaide: Centre for International Economic Studies, June.
24
References ABARE (1997), Australian Commodity Statistics, Canberra: ABARE. Anderson, K. (1999), PDP24 Anderson, K., T. Hertel …(forthcoming). Baldwin, R.E. and P. Martin (1999), 'Two Waves of Globalization: Superficial Similarities
and Fundamental Differences', NBER Working Paper 6904, Cambridge MA, January (http://www.papers.nber.org/papers/w6904).
Berger, N., K. Anderson and R. Stringer (1998), Trends in the World Wine Market, 1961 to 1996: A Statistical Compendium, Adelaide: Centre for International Economic Studies, June.
Bordo, M.D., B. Eichengreen and D.A. Irwin (1999), 'Is Globalization Today Really
Different Than Globalization a Hundred Years Ago?', NBER Working Paper 7195, Cambridge MA, June (http://www.papers.nber.org/papers/w7195).
Dixon, P.B., B.R. Parmenter, J.Sutton and D.P. Vincent (1982), ORANI: A Multisectoral
Model of the Australian Economy, Amsterdam: North-Holland. Dixon, P. and M. Rimmer (1998), Projecing and Policy Analysis with a Dynamic Model of
Australia, Centre of Policy Studies, Preliminary Working Paper No. OP-90, Monash University.
Horridge, J.M., B.R. Parmenter and K.R. Pearson (1998), ORANI-G: A General Equilibrium
Model of the Australian Economy, Melbourne: Centre of Policy Studies, Monash University, June.
Irvine, H.W.H. (1892), Report on the Australian Wine Trade, Melbourne: R.S. Bain. PVGD (1997), World Drink Trends 1997, Henley-on-Thames: NTC Publications for
Productschap Voor Gesdistilleerede Dranken (the Commodity Board for the Distilled Spirits Industry), Schiedam, Netherlands.
UNCTAD (1999), World Investment Report 1999, New York and Geneva: United Nations. Wittwer, G. and K. Anderson (1998), Tax Reform and the Australian Wine Industry,
Adelaide: Centre for International Economic Studies, June. Wittwer, G. and K. Anderson (1999), World Bank (1999), World Development Indicators 1999 (CD-ROM), Washington, D.C.:
World Bank.

25
Anderson, K. and N. Berger (1999), "Australia's Re-Emergence as a Wine Exporter: The First Decade in International Perspective", CIES Wine Policy Brief No. 5, October. (Forthcoming in Australian and New Zealand Wine Industry Journal 14 (6), November/December 1999.) Anderson, K. and G. Wittwer (1999), "More on Modeling the Impact of Tax Reform: How Unequal is the Proposed Wine 'Equalization' Tax?" Australian and New Zealand Wine Industry Journal 14 (3): 100-101, May/June. Battaglene, T. (1999), "Trade Liberalization in the New Millennium: The Prospects for Wine", paper presented at the 1999 Wine Outlook Conference, Adelaide, 10 November. Berger, N. and K. Anderson (1999), ‘Consumer and Import Taxes in the World Wine Market: Australia in International Perspective’, Australian Agribusiness Review 7, June. Berger, N., K. Anderson and R. Stringer (1998), Trends in the World Wine Market, 1961 to 1996: A Statistical Compendium, Adelaide: Centre for International Economic Studies. Berger, N., P. Spahni and K. Anderson (1999), Bilateral Trade Patterns in the World Wine Market, 1988 to 1997: A Statistical Compendium, Adelaide: Centre for International Economic Studies. Carr, D.L., J.R. Markusen and K. Maskus (1999), "Testing the Knowledge-Capital Model of the Multinational Enterprise", American Economic Review 89 (forthcoming). Kok, S. (1999), The Economics of Geographical Indications: A Case Study of the EU-Australia Wine Agreement, unpublished Honours thesis, School of Economics, University of Adelaide, November. Osmond, R. and K. Anderson (1998), Trends and Cycles in the Australian Wine Industry, 1850 to 2000, Adelaide: Centre for International Economic Studies. Smart, R. (1999), "Overseas Consulting: Selling the Family Silver, or Earning Export Income?" Australian and New Zealand Wine Industry Journal 14 (4): 64-67, July/August. Beeston, J. (1994), A Concise History of Australian Wine, Sydney: Allen and Unwin.
Halliday, J. (1994), A History of the Australian Wine Industry: 1949-1994, Adelaide: Winetitles for the Australian Wine and Brandy Corporation.
Laffer, H.E. (1949), The Wine Industry of Australia, Adelaide: Australian Wine Board.
Rankine, B. (1996), Evolution of the Modern Australian Wine Industry: A Personal Appraisal, Adelaide: Ryan Publications.
Unwin, T. (1991), Wine and the Vine: An Historical Geography of Viticulture and the Wine Trade, London and New York: Routledge.

26
Bell, G. (1993), ‘The South Australian Wine Industry, 1858-1876’, Journal of Wine Research 4(3): 147-63.
Bell, G. (1994), ‘The London Market for Australian Wine, 1851-1901: A South Australian Perspective’, Journal of Wine Research 5(1): 19-40.
Berger, N., K. Anderson and R. Stringer (1998), Trends in the World Wine Market, 1961 to 1996: A Statistical Compendium, Adelaide: Centre for International Economic Studies, June.
Briggs, A. (1985), Wine for Sale: Victoria Wine and the Liquor Trade, 1860-1984, London: B.T. Batsford.
Commonwealth of Australia (various issues), Yearbook of Australia, Canberra: AGPS.
Davidson, B.R. (1969), Australia Wet or Dry? Melbourne: Melbourne University Press.
Francis, A.D. (1972), The Wine Trade, London: Adam and Charles Black.
Hallier, P.C. (1997 and earlier years), Commercial Producer/Brand/ Distributor Directory, Adelaide: P.D. Consultancy to the Wine Industry, December.
Hoole, B.J. (1997), ‘Securing Supply Through Improved Grower and Processor Relationships: Orlando Wyndham Pty Ltd’, Ch. 8 in Competitive Performance: Case Studies on the Australian Agribusiness Experience, edited by D. Gifford, L. Hall and R. Collins, East Hawthorn: Morescope Publishing for DPIE.
Irvine, H.W.H. (1892), Report on the Australian Wine Trade, Melbourne: R.S. Brain, Government Printer for the Victorian Minister of Agriculture.
Kelly, A.C. (1867), Wine-growing in Australia, Adelaide: E.S. Wigg.
Spahni, P. (1988), The Common Wine Policy and Price Stabilization, Aldershot: Avebury.
Spahni, P. (1995), The International Wine Trade, Cambridge: Woodhead Publishing.
Tracy, M. (ed.) (1998), CAP Reform: The Southern Products, Genappe, Belgium: Agricultural Policy Studies.
WFA (1996), Statistical Report 1996, Adelaide: Winemakers’ Federation of Australia.
Williams, A. (1995), Flying Winemakers: The New World of Wine, Adelaide: Winetitles.
Wittwer, G. And K. Anderson (1998), ‘Tax Reform and the Australian Wine Industry’, Seminar Paper 98-xx, Centre for International Economic Studies, University of Adelaide, June.
Winetitles (1998), Australian and New Zealand Wine Industry Directory 1998, Adelaide: Winetitles.
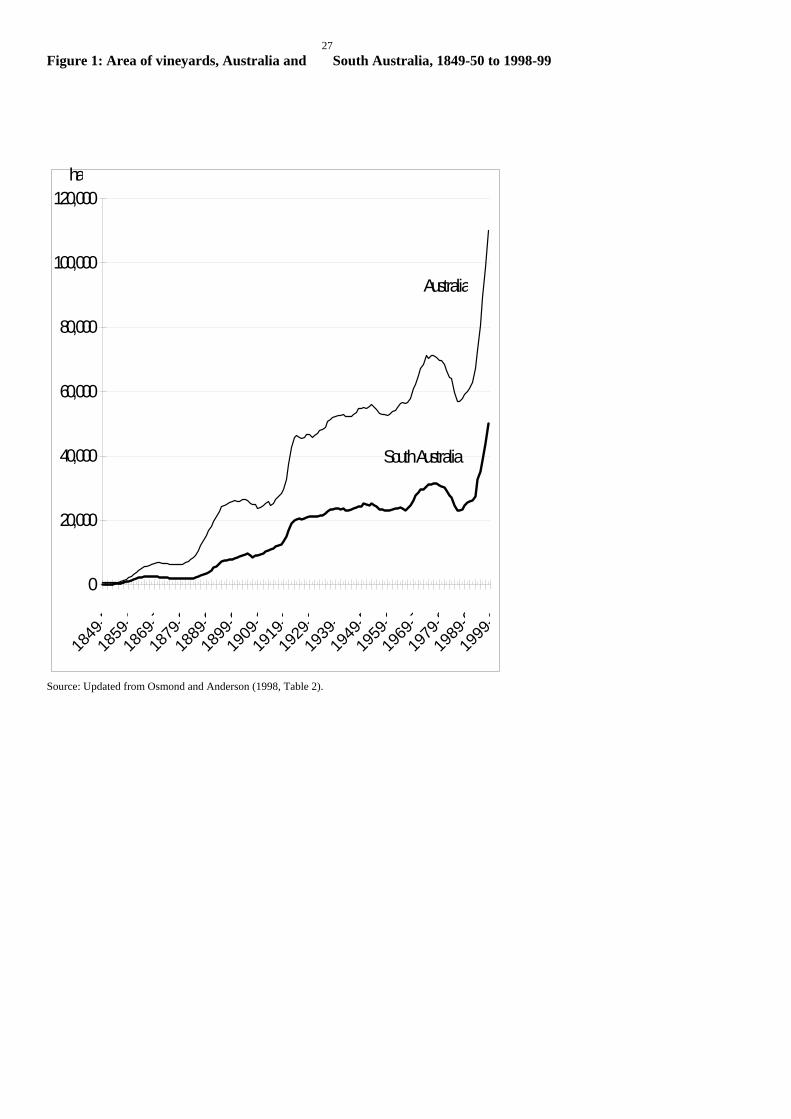
27Figure 1: Area of vineyards, Australia and South Australia, 1849-50 to 1998-99
Source: Updated from Osmond and Anderson (1998, Table 2).
0
20,000
40,000
60,000
80,000
100,000
120,000
1849
-5
1859
-6
1869
-7
1879
-8
1889
-9
1899
-0
1909
-1
1919
-2
1929
-3
1939
-4
1949
-5
1959
-6
1969
-7
1979
-8
1989
-9
1999
-0
ha
Australia
South Australia
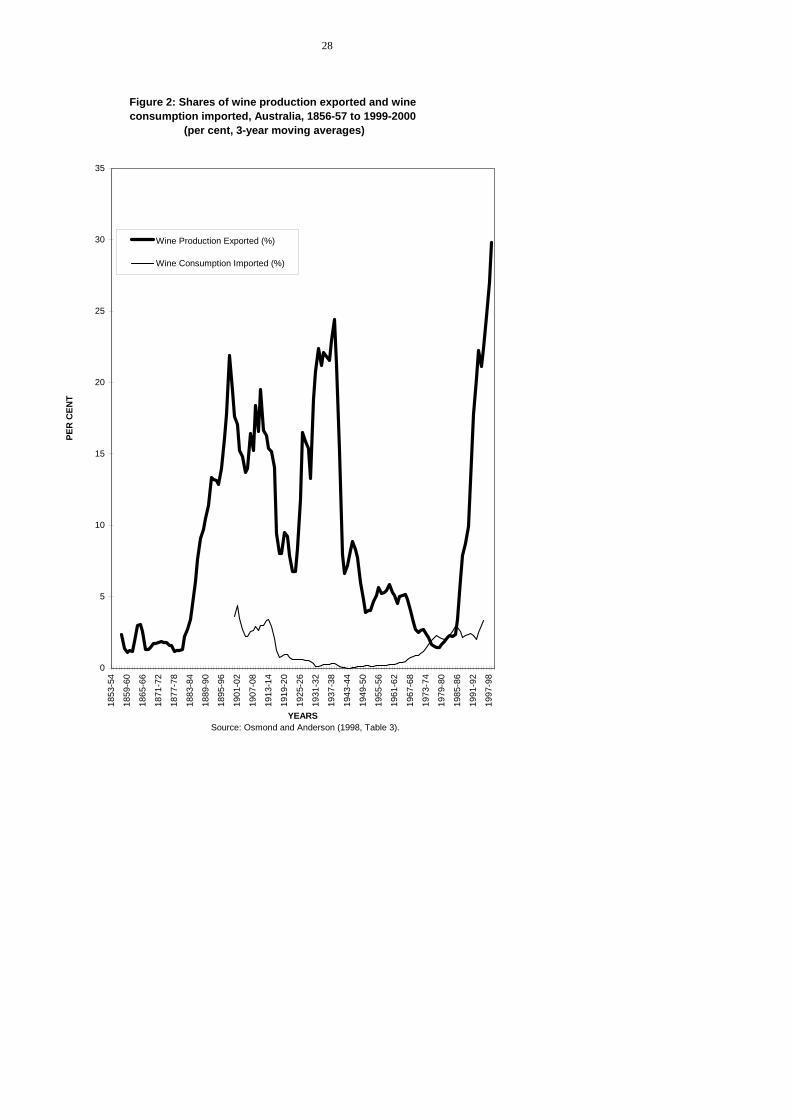
28
Figure 2: Shares of wine production exported and wine consumption imported, Australia, 1856-57 to 1999-2000
(per cent, 3-year moving averages)
0
5
10
15
20
25
30
35
1853
-54
1859
-60
1865
-66
1871
-72
1877
-78
1883
-84
1889
-90
1895
-96
1901
-02
1907
-08
1913
-14
1919
-20
1925
-26
1931
-32
1937
-38
1943
-44
1949
-50
1955
-56
1961
-62
1967
-68
1973
-74
1979
-80
1985
-86
1991
-92
1997
-98
YEARS Source: Osmond and Anderson (1998, Table 3).
PER
CEN
T
Wine Production Exported (%)
Wine Consumption Imported (%)

29
Figure 3: Wine Production (log-linear scale), Australia and South Australia, 1856-57 to 1999-2000
(3-year moving average)
4.00
5.00
6.00
30
Figure 4: Winegrape crush by variety group, Australia, 1955-56 to 1996-97 (3-year average around year shown except 1955-56 and 1965-66)
600
700
800
White premium
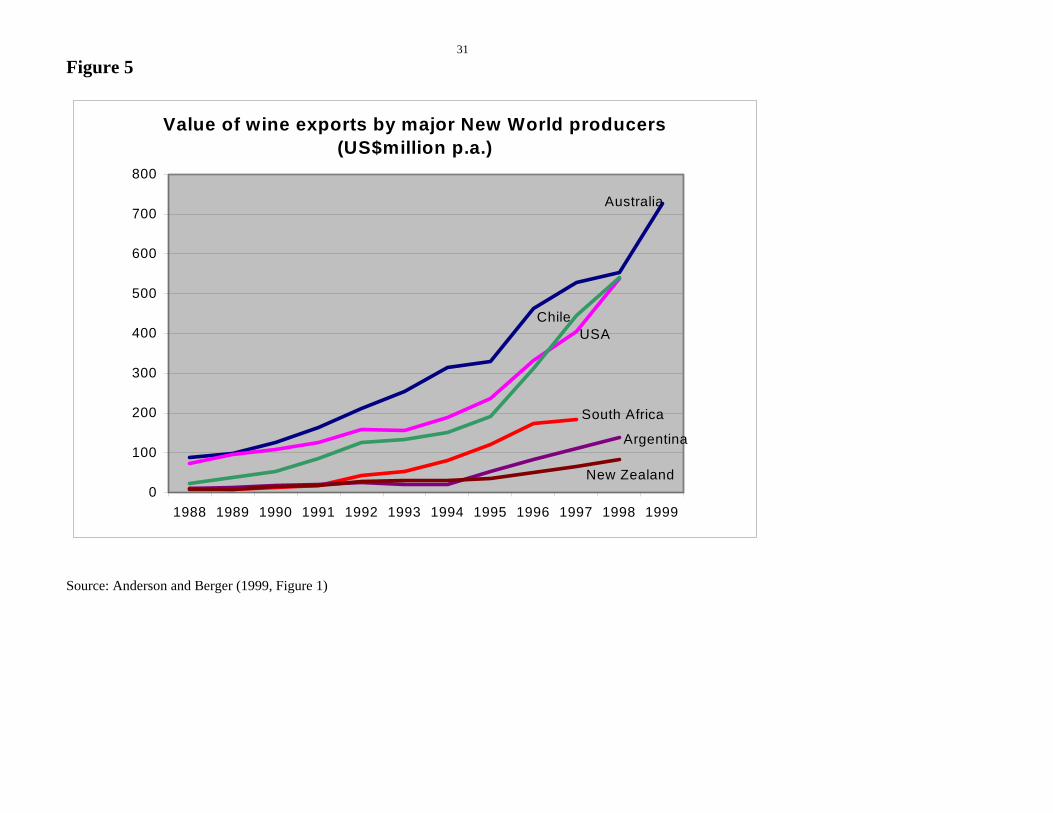
31
Figure 5
Source: Anderson and Berger (1999, Figure 1)
Value of wine exports by major New World producers (US$million p.a.)
USAChile
South Africa
New Zealand
Argentina
Australia
0
100
200
300
400
500
600
700
800
1988 1989 1990 1991 1992 1993 1994 1995 1996 1997 1998 1999

32
Figure 6
Source: Anderson and Berger (1999, Figure 2)
0 5 10 15 20 25
Canada
Denmark
France
Netherlands
Switzerland
Belgium-L
Japan
Germany
US
UK
Share of world wine import value(per cent)
1997 1988-90
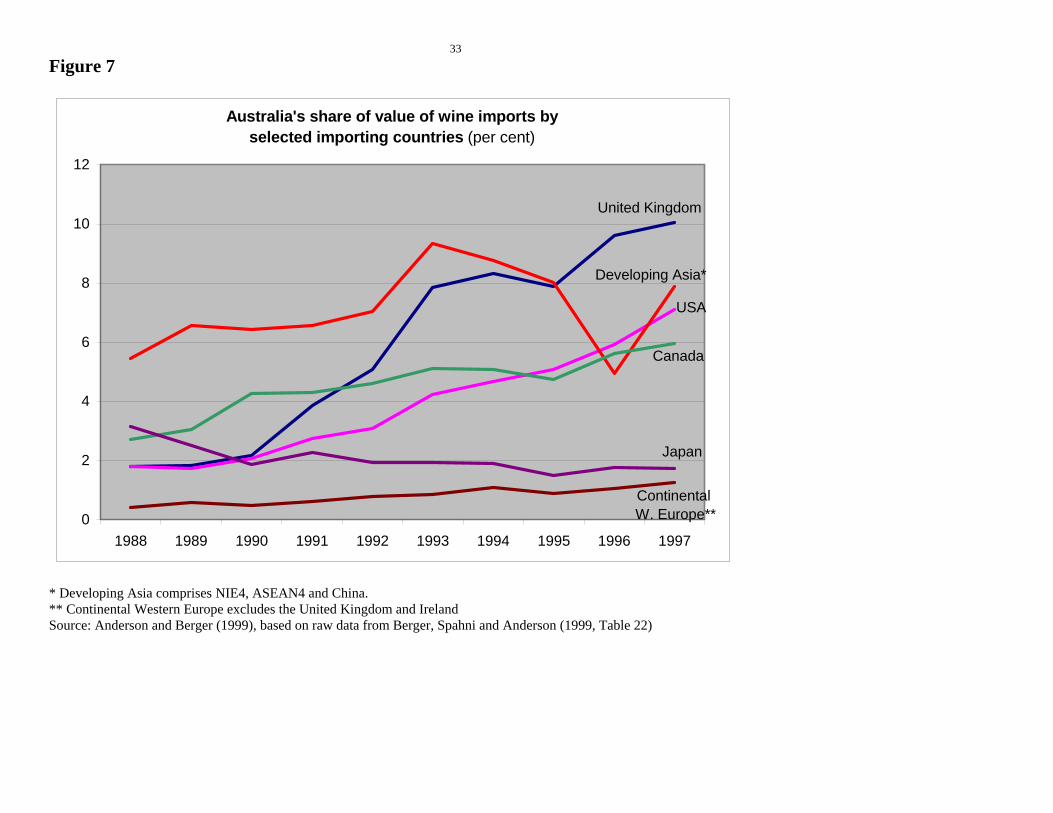
33
Figure 7
* Developing Asia comprises NIE4, ASEAN4 and China. ** Continental Western Europe excludes the United Kingdom and Ireland Source: Anderson and Berger (1999), based on raw data from Berger, Spahni and Anderson (1999, Table 22)
Australia's share of value of wine imports by selected importing countries (per cent)
United Kingdom
Developing Asia*
USA
Canada
Japan
Continental W. Europe**0
2
4
6
8
10
12
1988 1989 1990 1991 1992 1993 1994 1995 1996 1997

The relative quality index is defined as the unit value of a country's exports expressed as a percentage of the unit value of total world exports, minus 100. Note that the unit value of world exports rose by about 20 per cent over the ten years to 1997, so it is possible for a country's unit value to have risen while its relative quality index as measured here falls (eg France and Spain). Source: Anderson and Berger (1999, Figure 4).
-80 -60 -40 -20 0 20 40 60 80 100 120
Argentina
Bulgaria
Hungary
Spain
Italy
Chile
Sth. Africa
Germany
WORLD
Portugal
USA
Australia
France
New Zealand
Figure 8: Index of relative quality of exported wine
1997 1988-90
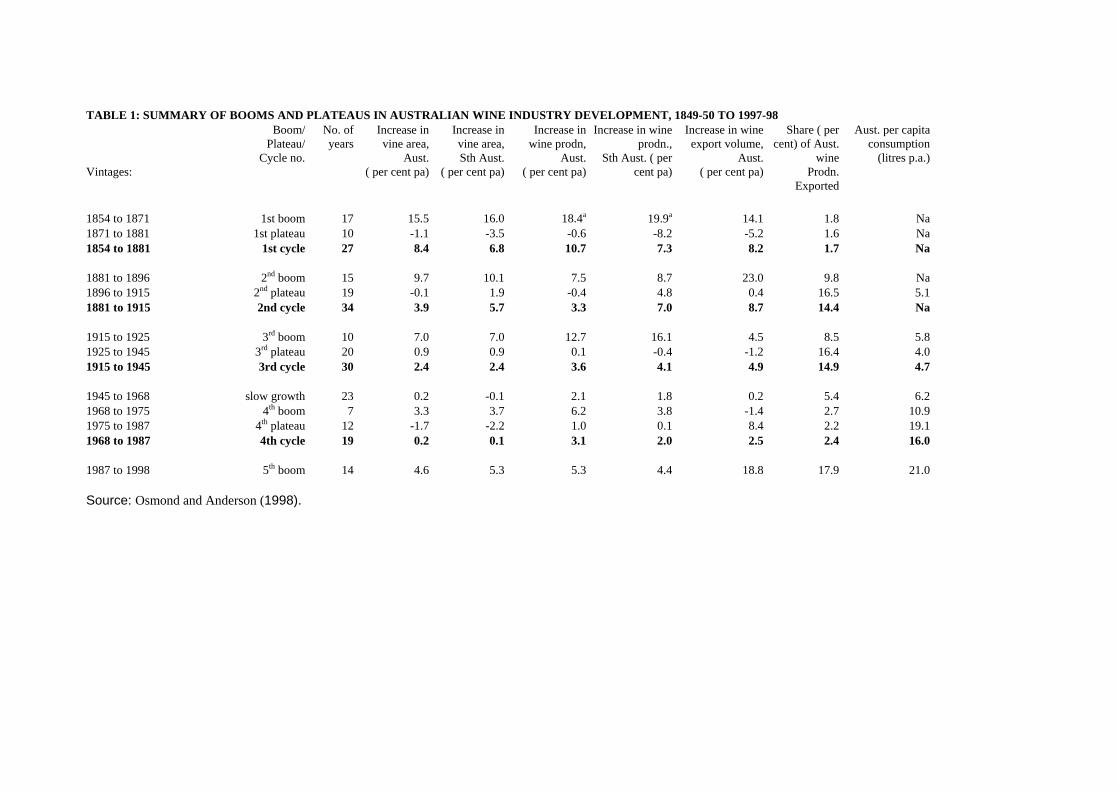
TABLE 1: SUMMARY OF BOOMS AND PLATEAUS IN AUSTRALIAN WINE INDUSTRY DEVELOPMENT, 1849-50 TO 1997-98 Vintages:
Boom/ Plateau/
Cycle no.
No. of years
Increase in vine area,
Aust. ( per cent pa)
Increase in vine area, Sth Aust.
( per cent pa)
Increase in wine prodn,
Aust. ( per cent pa)
Increase in wine prodn.,
Sth Aust. ( per cent pa)
Increase in wine export volume,
Aust. ( per cent pa)
Share ( per cent) of Aust.
wine Prodn.
Exported
Aust. per capita consumption
(litres p.a.)
1854 to 1871 1st boom 17 15.5 16.0 18.4a 19.9a 14.1 1.8 Na1871 to 1881 1st plateau 10 -1.1 -3.5 -0.6 -8.2 -5.2 1.6 Na1854 to 1881 1st cycle 27 8.4 6.8 10.7 7.3 8.2 1.7 Na 1881 to 1896 2nd boom 15 9.7 10.1 7.5 8.7 23.0 9.8 Na1896 to 1915 2nd plateau 19 -0.1 1.9 -0.4 4.8 0.4 16.5 5.11881 to 1915 2nd cycle 34 3.9 5.7 3.3 7.0 8.7 14.4 Na 1915 to 1925 3rd boom 10 7.0 7.0 12.7 16.1 4.5 8.5 5.81925 to 1945 3rd plateau 20 0.9 0.9 0.1 -0.4 -1.2 16.4 4.01915 to 1945 3rd cycle 30 2.4 2.4 3.6 4.1 4.9 14.9 4.7 1945 to 1968 slow growth 23 0.2 -0.1 2.1 1.8 0.2 5.4 6.21968 to 1975 4th boom 7 3.3 3.7 6.2 3.8 -1.4 2.7 10.91975 to 1987 4th plateau 12 -1.7 -2.2 1.0 0.1 8.4 2.2 19.11968 to 1987 4th cycle 19 0.2 0.1 3.1 2.0 2.5 2.4 16.0 1987 to 1998 5th boom 14 4.6 5.3 5.3 4.4 18.8 17.9 21.0 Source: Osmond and Anderson (1998).

Table 2: Growth in the Australian grape and wine industries, vintages 1986 to 1996 Cumulative
per cent change
Annual average per cent change
Variable 1985-87g 1995-97 g Over the decade
(compound growth)
Population (>18 yrs, millions) 11.5 13.6 19 1.7 Population (total, millions) 16.3 18.3 12 1.2 Real aggregate consumption ($bn)f 220.7 303.9 38 3.3 Domestic wine consumption (Ml)a,b
Premium red wine 22.1 38.5 74 5.7 Premium white wine 45.5 55.4 22 2.0 Non-premium wine 268.0 236.0 -12 -1.3
Wine, total 335.6 329.9 -2 -0.2 Wine production (Ml)a
Premium red wine 69.7 158.7 128 8.6 Premium white wine 97.7 197.6 102 7.3 Non-premium wine 240.4 236.8 -2 -0.2
Wine, total 407.9 593.1 45 3.8 Wine exports (Ml)a
Premium red wine 3.3 47.0 1324 30.4 Premium white wine 4.0 54.3 1258 29.8 Non-premium wine 8.8 31.3 256 13.5
Wine, total 16.1 132.6 724 23.5 Table grape exports (kt) 71.2 38.8 -46 -5.9 Wine imports (Ml)a 11.2 16.0 43 3.6 Producer prices($/tonne)c,f
Premium red winegrapes 645 1,394 116 8.0 Premium white winegrapes 874 899 3 0.3 Non-premium winegrapes 289 392 36 3.1
Consumer prices($/litre)c,f Premium red wine 8.98 12.85 43 3.6 Premium white wine 8.83 10.71 21 1.9 Non-premium wine 3.54 3.53 0 0.0
Wine, total 4.61 5.82 26 2.4 Land bearing winegrapes (‘000 ha)a
Premium red grapes 10.1 18.0 78 5.9 Premium white grapes 10.7 18.9 77 5.9 Non-premium grapes 18.4 15.7 -15 -1.6
Winegrapes, total 39.2 52.6 34 3.0 Commonwealth consumer taxes b,d
10 per
cent
26 per
cent
..
..
State wine consumer taxes d 9 per cent 15 per cent
.. ..
Import tariff e 22 per cent
5 per cent
.. ..
Employment Grape growing 5,760 7,420 29 2.6 Wine production 4,688 8,328 78 5.9
a Osmond and Anderson (1998, Table 10) b Unpublished data from the Winemakers’ Federation of Australia (WFA) c Authors’ calculations based on unpublished WFA data and PISA (1997) for grape prices d Estimated using Commonwealth Grants Commission data, expressed as an ad valorem wholesale equivalent. e unpublished data from the Industry Commission f All values are real, in 1995-96 dollars g Three-year annual averages around the 1986 and 1996 vintages
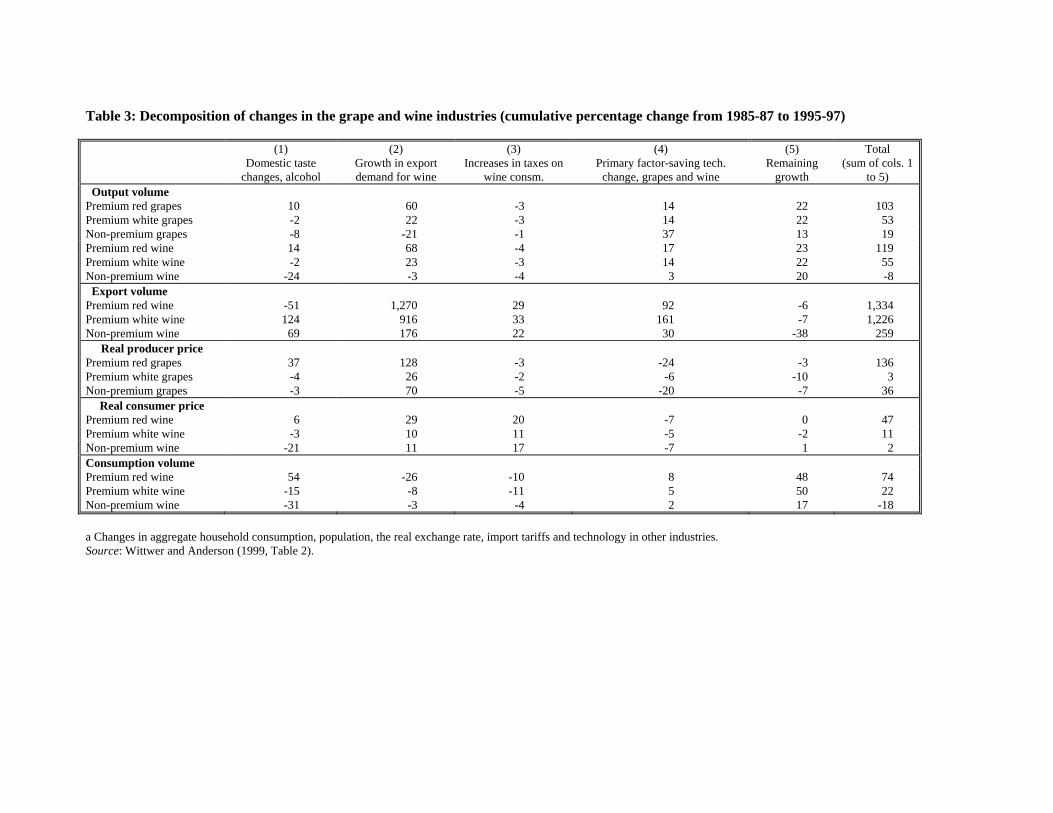
Table 3: Decomposition of changes in the grape and wine industries (cumulative percentage change from 1985-87 to 1995-97)
(1) Domestic taste
changes, alcohol
(2) Growth in export demand for wine
(3) Increases in taxes on
wine consm.
(4) Primary factor-saving tech.
change, grapes and wine
(5) Remaining
growth
Total (sum of cols. 1
to 5) Output volume Premium red grapes 10 60 -3 14 22 103 Premium white grapes -2 22 -3 14 22 53 Non-premium grapes -8 -21 -1 37 13 19 Premium red wine 14 68 -4 17 23 119 Premium white wine -2 23 -3 14 22 55 Non-premium wine -24 -3 -4 3 20 -8 Export volume Premium red wine -51 1,270 29 92 -6 1,334 Premium white wine 124 916 33 161 -7 1,226 Non-premium wine 69 176 22 30 -38 259
Real producer price Premium red grapes 37 128 -3 -24 -3 136 Premium white grapes -4 26 -2 -6 -10 3 Non-premium grapes -3 70 -5 -20 -7 36
Real consumer price Premium red wine 6 29 20 -7 0 47 Premium white wine -3 10 11 -5 -2 11 Non-premium wine -21 11 17 -7 1 2 Consumption volume Premium red wine 54 -26 -10 8 48 74 Premium white wine -15 -8 -11 5 50 22 Non-premium wine -31 -3 -4 2 17 -18 a Changes in aggregate household consumption, population, the real exchange rate, import tariffs and technology in other industries. Source: Wittwer and Anderson (1999, Table 2).

Table 4: Decomposition of changes in the grape and wine industries (unit change from 1985-87 to 1995-97)
Unit
(1) Domestic taste
changes, alcohol
(2) Growth in export demand for wine
(3) Increases in taxes on
wine consm.
(4) Primary factor-saving tech.
change, grapes and wine
(5) Remaining
growth
Total (sum of cols
to 5) Output volume Premium red grapes kt 9 55 -3 13 20 Premium white grapes kt -3 29 -4 18 29 Non-premium grapes kt -27 -69 -2 120 40 Premium red wine Ml 10 48 -3 12 16 Premium white wine Ml -2 22 -3 14 22 Non-premium wine Ml -58 -7 -9 8 48 - Export volume Premium red wine Ml -2 42 1 3 0 Premium white wine Ml 5 40 1 7 0 Non-premium wine Ml 6 15 2 3 -3
Real producer price Premium red grapes $/t 241 823 -16 -152 -17 8Premium white grapes $/t -37 224 -21 -53 -89 Non-premium grapes $/t -10 203 -13 -58 -19 1
Real consumer price Premium red wine $/l 0.54 2.61 1.75 -0.67 -0.02 4Premium white wine $/l -0.26 0.94 1.04 -0.51 -0.17 1Non-premium wine $/l -0.58 0.31 0.48 -0.19 0.04 0Consumption volume Premium red wine Ml 12 -6 -2 2 11 Premium white wine Ml -7 -4 -5 2 23 Non-premium wine Ml -82 -8 -12 6 47 - a Changes in aggregate household consumption, population, real exchange rate, import tariffs and technology in other industries. Source: Wittwer and Anderson (1999, Table 5).
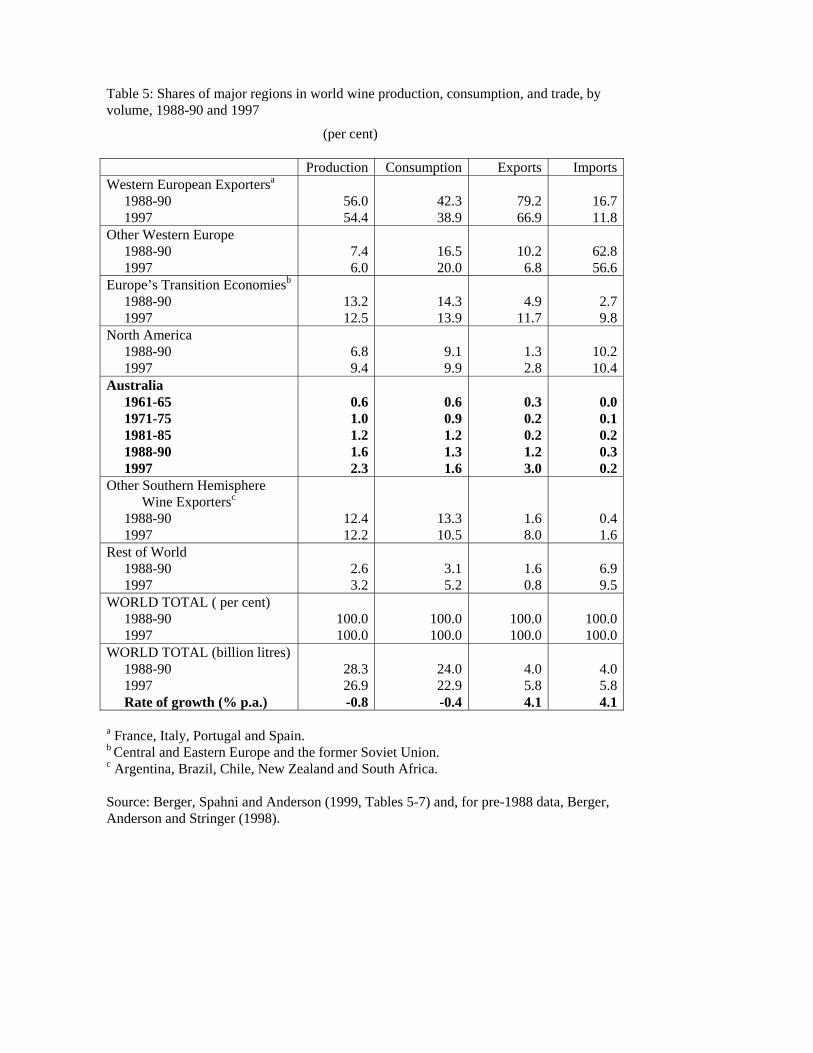
Table 5: Shares of major regions in world wine production, consumption, and trade, by volume, 1988-90 and 1997
(per cent) Production Consumption Exports Imports Western European Exportersa
1988-90 1997
56.054.4
42.338.9
79.266.9
16.7 11.8
Other Western Europe 1988-90 1997
7.46.0
16.520.0
10.26.8
62.8 56.6
Europe’s Transition Economiesb
1988-90 1997
13.212.5
14.313.9
4.911.7
2.7 9.8
North America 1988-90 1997
6.89.4
9.19.9
1.32.8
10.2 10.4
Australia 1961-65 1971-75 1981-85 1988-90 1997
0.61.01.21.62.3
0.60.91.21.31.6
0.30.20.21.23.0
0.0 0.1 0.2 0.3 0.2
Other Southern Hemisphere Wine Exportersc
1988-90 1997
12.412.2
13.310.5
1.68.0
0.4 1.6
Rest of World 1988-90 1997
2.63.2
3.15.2
1.60.8
6.9 9.5
WORLD TOTAL ( per cent) 1988-90 1997
100.0100.0
100.0100.0
100.0100.0
100.0 100.0
WORLD TOTAL (billion litres) 1988-90 1997 Rate of growth (% p.a.)
28.326.9-0.8
24.022.9-0.4
4.05.84.1
4.0 5.8 4.1
a France, Italy, Portugal and Spain. b Central and Eastern Europe and the former Soviet Union. c Argentina, Brazil, Chile, New Zealand and South Africa. Source: Berger, Spahni and Anderson (1999, Tables 5-7) and, for pre-1988 data, Berger, Anderson and Stringer (1998).
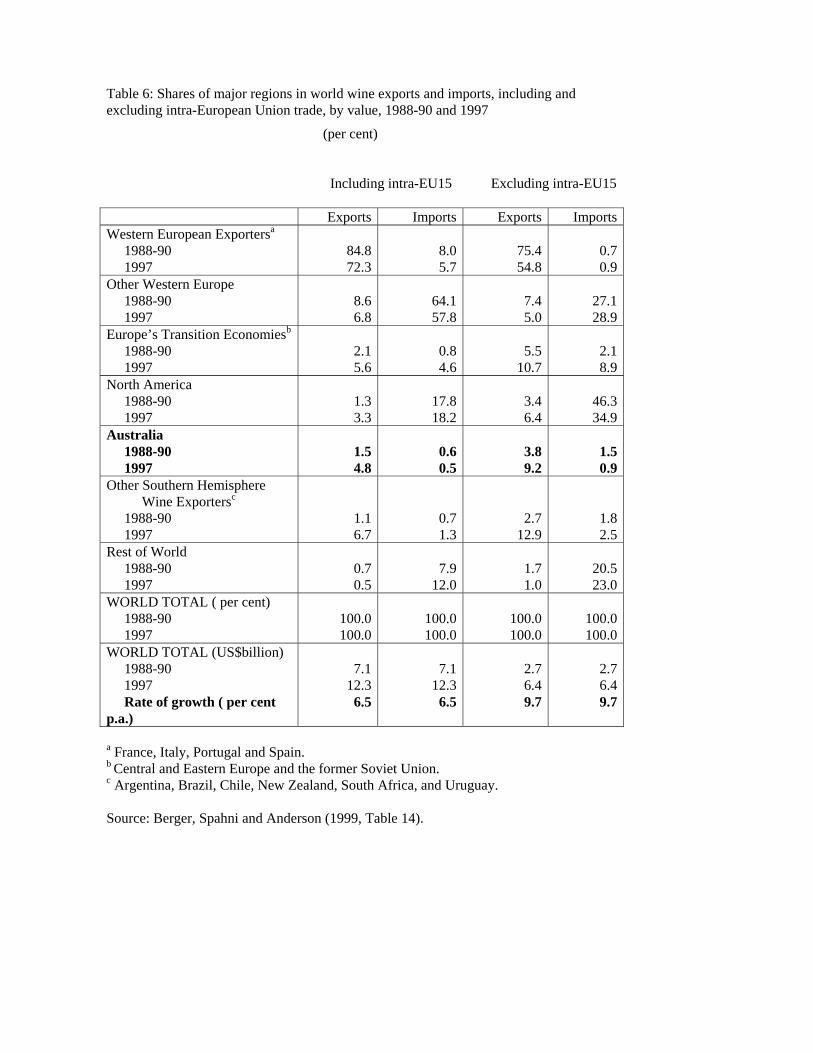
Table 6: Shares of major regions in world wine exports and imports, including and excluding intra-European Union trade, by value, 1988-90 and 1997
(per cent)
Including intra-EU15 Excluding intra-EU15
Exports Imports Exports Imports Western European Exportersa
1988-90 1997
84.872.3
8.05.7
75.454.8
0.7 0.9
Other Western Europe 1988-90 1997
8.66.8
64.157.8
7.45.0
27.1 28.9
Europe’s Transition Economiesb
1988-90 1997
2.15.6
0.84.6
5.510.7
2.1 8.9
North America 1988-90 1997
1.33.3
17.818.2
3.46.4
46.3 34.9
Australia 1988-90 1997
1.54.8
0.60.5
3.89.2
1.5 0.9
Other Southern Hemisphere Wine Exportersc
1988-90 1997
1.16.7
0.71.3
2.712.9
1.8 2.5
Rest of World 1988-90 1997
0.70.5
7.912.0
1.71.0
20.5 23.0
WORLD TOTAL ( per cent) 1988-90 1997
100.0100.0
100.0100.0
100.0100.0
100.0 100.0
WORLD TOTAL (US$billion) 1988-90 1997 Rate of growth ( per cent p.a.)
7.112.36.5
7.112.36.5
2.76.49.7
2.7 6.4 9.7
a France, Italy, Portugal and Spain. b Central and Eastern Europe and the former Soviet Union. c Argentina, Brazil, Chile, New Zealand, South Africa, and Uruguay. Source: Berger, Spahni and Anderson (1999, Table 14).


Table 7: Volume of wine production and consumption per capita and trade orientation, by region, 1988-90 and 1997
Volume
of prod’n per capita (litres pa)
Volume of cons’m per capita (litres pa)
Exports as a per cent of prod’n
Imports as a per cent of cons’m
Prod'n as a per cent of cons'm
Western European Exportersa
1988-90 1997
9888
6354
2027
7 8
156 164
Other Western Europe 1988-90 1997
107
1921
2025
64 72
53 35
Europe’s Transition Economiesb
1988-90 1997
98
88
520
3
18
108 106
North America 1988-90 1997
78
88
36
19 27
89
112 Australia 1988-90 1997
2734
2020
1129
3 4
137 168
Other Southern Hemisphere Wine Exportersc
1988-90 1997
1512
149
214
1 4
110 137
Rest of World 1988-90 1997
00
00
95
38 46
96 73
WORLD TOTAL 1988-90 1997
5.54.6
4.63.9
1422
17 25
118e
118e
Memo item: EU-15
1988-90 1997
3530
3121
5d
7d
2d
5d
129 123
a France, Italy, Portugal and Spain. b Central and Eastern Europe and the former Soviet Union. c Argentina, Brazil, Chile, New Zealand and South Africa. d Excluding intra-EU trade from national and global totals. e Production exceeds consumption globally because consumption is net of distillation and other industrial uses. Source: Berger, Spahni and Anderson (1999, Tables 5, 7 and 8).


Table 8: Growth in wine production, consumption and export volume and in export value, major regions, 1988 to 1997
(per cent per year, from log-linear regression equations)
Export
volumeExport
valueProduction
volumeConsumption
volume
Western European Exportersa
2.0 4.7 -0.7 -0.0
Other Western Europe
0.2 3.9 -3.5 1.1
Europe’s Transition Economiesb
14.9 18.2 -1.9 -1.1
North America
13.4 17.9 1.5 -0.0
Australia
16.1 21.1 4.6 1.0
Other Southern Hemisphere Wine Exportersc
26.5 29.9 -1.5 -3.2
Rest of World
-3.6 3.2 2.2 4.9
WORLD TOTAL
4.1 6.5 -0.8 -0.4
a France, Italy, Portugal and Spain. b Central and Eastern Europe and the former Soviet Union. c Argentina, Brazil, Chile, New Zealand, South Africa, and Uruguay. Source: Anderson and Berger (1999), based on raw data in Berger, Spahni and Anderson (1999).

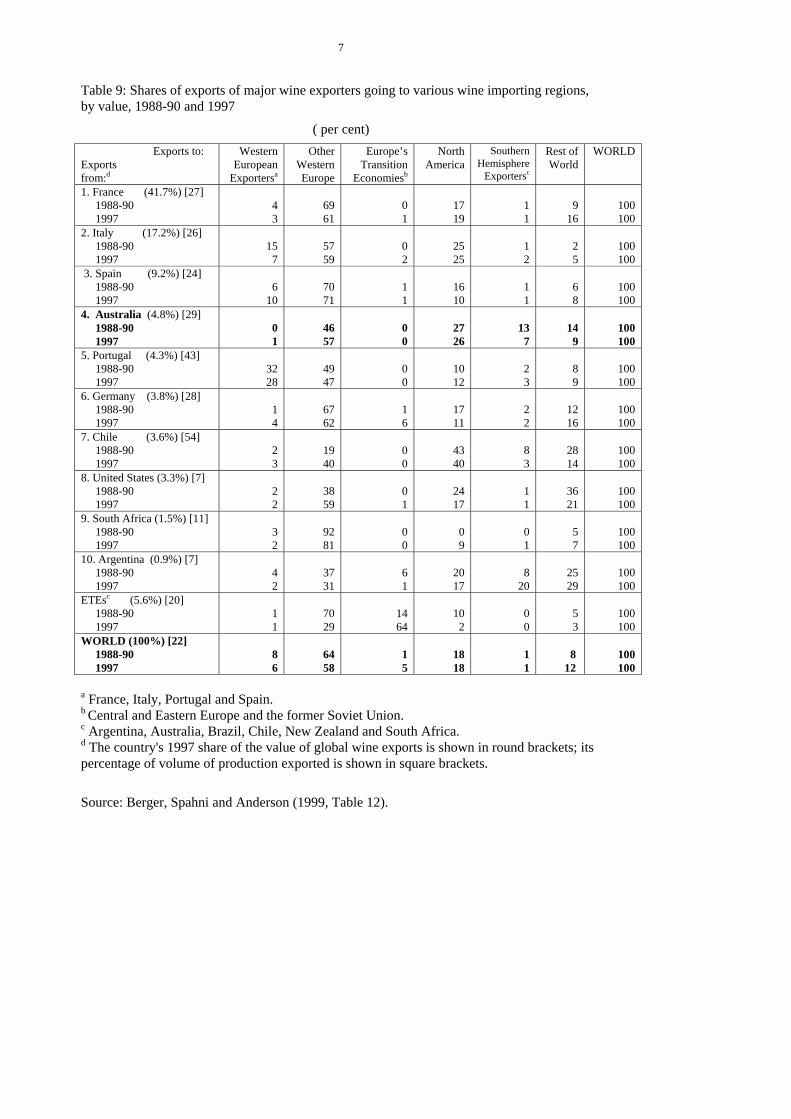
7
Table 9: Shares of exports of major wine exporters going to various wine importing regions, by value, 1988-90 and 1997
( per cent) Exports to: Exports from:d
Western European
Exportersa
Other Western Europe
Europe’s Transition
Economiesb
North America
Southern Hemisphere
Exportersc
Rest of World
WORLD
1. France (41.7%) [27] 1988-90 1997
4 3
69 61
0 1
17 19
1 1
9
16
100 100
2. Italy (17.2%) [26] 1988-90 1997
15
7
57 59
0 2
25 25
1 2
2 5
100 100
3. Spain (9.2%) [24]
1988-90 1997
6
10
70 71
1 1
16 10
1 1
6 8
100 100
4. Australia (4.8%) [29] 1988-90 1997
0 1
4657
00
2726
137
14 9
100 100
5. Portugal (4.3%) [43] 1988-90 1997
32 28
49 47
0 0
10 12
2 3
8 9
100 100
6. Germany (3.8%) [28] 1988-90 1997
1 4
67 62
1 6
17 11
2 2
12 16
100 100
7. Chile (3.6%) [54] 1988-90 1997
2 3
19 40
0 0
43 40
8 3
28 14
100 100
8. United States (3.3%) [7] 1988-90 1997
2 2
38 59
0 1
24 17
1 1
36 21
100 100
9. South Africa (1.5%) [11] 1988-90 1997
3 2
92 81
0 0
0 9
0 1
5 7
100 100
10. Argentina (0.9%) [7] 1988-90 1997
4 2
37 31
6 1
20 17
8
20
25 29
100 100
ETEsc (5.6%) [20] 1988-90 1997
1 1
70 29
14 64
10 2
0 0
5 3
100 100
WORLD (100%) [22] 1988-90 1997
8 6
6458
15
1818
11
8 12
100 100
a France, Italy, Portugal and Spain. b Central and Eastern Europe and the former Soviet Union. c Argentina, Australia, Brazil, Chile, New Zealand and South Africa. d The country's 1997 share of the value of global wine exports is shown in round brackets; its percentage of volume of production exported is shown in square brackets.
Source: Berger, Spahni and Anderson (1999, Table 12).

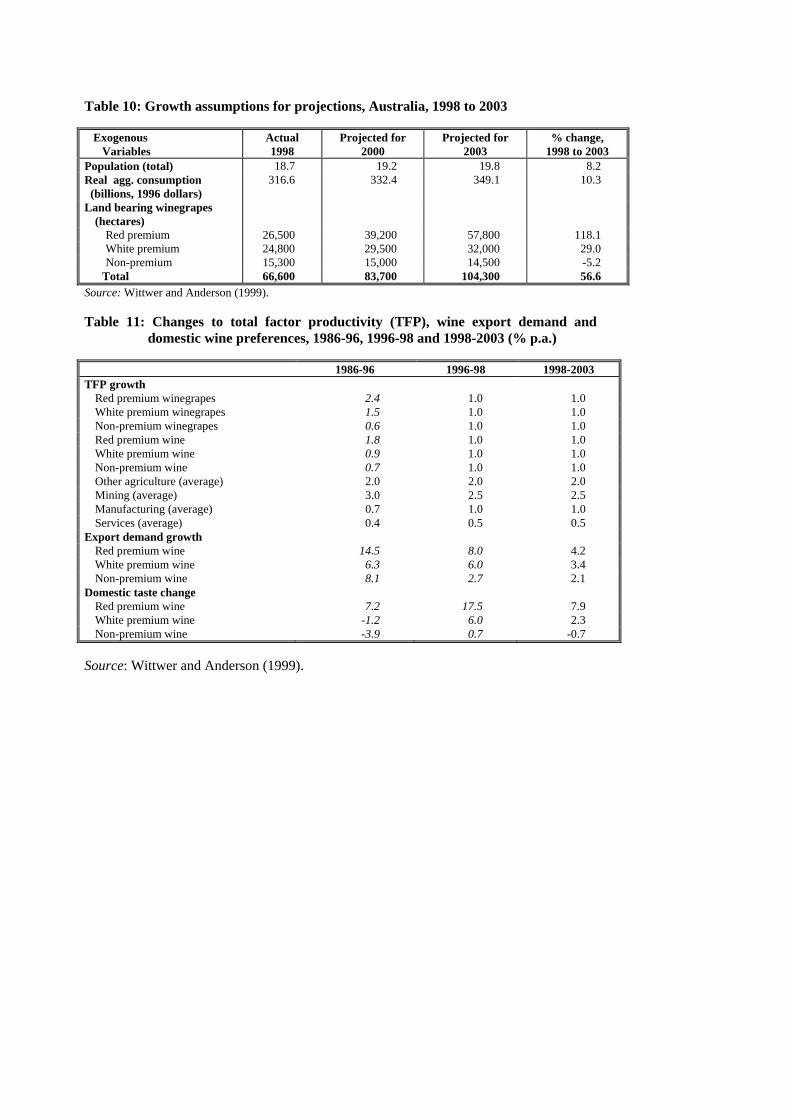
Table 10: Growth assumptions for projections, Australia, 1998 to 2003 Exogenous Actual Projected for Projected for % change, Variables 1998 2000 2003 1998 to 2003 Population (total) 18.7 19.2 19.8 8.2 Real agg. consumption (billions, 1996 dollars)
316.6 332.4 349.1 10.3
Land bearing winegrapes (hectares)
Red premium 26,500 39,200 57,800 118.1 White premium 24,800 29,500 32,000 29.0 Non-premium 15,300 15,000 14,500 -5.2
Total 66,600 83,700 104,300 56.6 Source: Wittwer and Anderson (1999). Table 11: Changes to total factor productivity (TFP), wine export demand and
domestic wine preferences, 1986-96, 1996-98 and 1998-2003 (% p.a.) 1986-96 1996-98 1998-2003 TFP growth
Red premium winegrapes 2.4 1.0 1.0 White premium winegrapes 1.5 1.0 1.0 Non-premium winegrapes 0.6 1.0 1.0 Red premium wine 1.8 1.0 1.0 White premium wine 0.9 1.0 1.0 Non-premium wine 0.7 1.0 1.0 Other agriculture (average) 2.0 2.0 2.0 Mining (average) 3.0 2.5 2.5 Manufacturing (average) 0.7 1.0 1.0 Services (average) 0.4 0.5 0.5
Export demand growth Red premium wine 14.5 8.0 4.2 White premium wine 6.3 6.0 3.4 Non-premium wine 8.1 2.7 2.1
Domestic taste change Red premium wine 7.2 17.5 7.9 White premium wine -1.2 6.0 2.3 Non-premium wine -3.9 0.7 -0.7
Source: Wittwer and Anderson (1999).

10
Table 12: Projected growth in the Australian grape and wine industries, vintages 1996 to 2003a
Endogenous Variables
1996 actual
1998 actual
% 1996-1998
Base 2000 % 1998-2000
Base 2003
% 2000-2003
Domestic consumption (Ml) Red premium wine 38.5 53.4 38.7 67.4 26.3 95.1 41.0 White premium wine 55.4 65.0 17.3 73.2 12.6 89.9 22.8 Non-premium wine 236.0 248.6 5.3 253.2 1.9 266.6 5.3
Wine, total 329.9 367.0 11.2 393.9 7.3 451.6 14.6 Production (Ml)
Red premium wine 158.7 227.0 43.0 331.3 46.0 512.5 54.7 White premium wine 197.6 240.0 21.5 295.5 23.1 336.0 13.7 Non-premium wine 236.8 210.0 -11.3 215.4 2.6 219.3 1.8
Wine, total 593.1 677.0 14.1 842.3 24.4 1067.8 26.8 Wine exports (Ml)
Red premium wine 47.0 77.4 64.7 171.2 121.2 328.2 91.7 White premium wine 54.3 74.1 36.5 108.9 47.0 130.3 19.6 Non-premium wine 31.3 40.9 30.7 47.6 16.5 40.8 -14.4
Wine, total 132.6 192.4 45.1 327.8 70.4 499.3 52.3 Table grape exports(kt) 38.8 39.5 1.8 46.3 17.2 54.2 17.2 Wine imports (Ml)
Red premium wine 8.1 9.1 12.3 10.8 18.7 12.9 19.2 White premium wine 3.1 4.7 51.6 5.1 8.6 6.0 16.7 Non-premium wine 4.5 11.2 148.9 11.7 4.4 12.7 8.3
Winegrape prices ($/tonne) Red premium grapes 1,394 1,606 15.2 1,359 -15.4 1,106 -18.6 White premium grapes 899 985 9.6 890 -9.7 825 -7.2 Non-premium grapes 392 381 -2.8 385 0.9 387 0.7
Wine consumer prices ($/litre)
Red premium wine 12.85 13.87 8.0 13.62 -1.8 12.22 -10.3 White premium wine 10.71 11.31 5.6 11.19 -1.0 10.59 -5.4 Non-premium wine 3.53 3.68 4.3 3.71 1.0 3.62 -2.6
Wine stocks (Ml) Red premium wine 266.0 364.0 36.8 457.1 25.6 604.8 32.3 White premium wine 365.0 386.0 5.8 393.2 1.9 391.8 -0.4 Non-premium wine 152.0 150.0 -1.3 135.5 -9.7 113.6 -16.2
a Assuming no change in the real exchange rate between 1998 and 2003. 1996 refers to the average of the three vintages, 1995 to 1997. Source: Wittwer and Anderson (1999).

11
Table 13: Projected scenarios for 2003 with differing exchange rate and tax
assumptions Endogenous Variables
1998 actual
Base 2003 (1)a
2003 (2)a
(2)-(1)
2003 (3)a
(3)-(1)
Domestic consumption Ml Red premium wine 53.4 95.1 91.1 -3.9 107.1 12.0 White premium wine 65.0 89.9 86.1 -3.8 102.1 12.2 Non-premium wine 248.6 266.6 262.6 -4.0 266.5 -0.1
Wine, total 367.0 451.6 439.9 -11.7 475.7 24.1 Production (Ml)
Red premium wine 227.0 512.5 531.4 18.8 514.6 2.1 White premium wine 240.0 336.0 348.7 12.7 337.0 1.0 Non-premium wine 210.0 219.3 222.9 3.6 219.2 -0.1
Wine, total 677.0 1067.8 1102.9 35.1 1070.9 3.1 Wine exports (Ml)
Red premium wine 77.4 328.2 356.6 28.4 310.7 -17.5 White premium wine 74.1 130.3 144.1 13.9 122.9 -7.4 Non-premium wine 40.9 40.8 54.8 14.0 40.8 0.0
Wine, total 192.4 499.3 555.5 56.3 474.3 -25.0 Table grape exports (kt) 39.5 54.2 65.8 11.6 54.3 0.1 Wine imports (Ml)
Red premium wine 9.1 12.9 12.2 -0.7 14.6 1.7 White premium wine 4.7 6.0 5.7 -0.3 6.8 0.8 Non-premium wine 11.2 12.7 11.9 -0.8 12.6 -0.1
Winegrape prices($/tonne) Red premium grapes 1,606 1,106 1,150 44 1114 8 White premium grapes 985 825 860 35 830 5 Non-premium grapes 381 387 423 36 388 1
Wine consumer prices($/l) Red premium wine 13.87 12.22 12.87 0.65 10.46 -1.76 White premium wine 11.31 10.59 11.19 0.60 9.03 -1.56 Non-premium wine 3.68 3.62 3.75 0.13 3.62 0.00
Wine stocks (Ml) Red premium wine 364.0 604.8 560.0 -40.8 601.1 -3.7 White premium wine 386.0 391.8 457.2 -34.6 388.0 -3.8 Non-premium wine 150.0 113.6 109.7 -3.9 116.4 2.8
a (1) Base case (including no change in the real exchange rate, 1998 to 2003), as in Table 12.
(2) Real depreciation of 10 per cent between 1998 and 2003. (3) The consumer tax rate for premium wine is reduced from the current 48% to 16% (the average for
OECD countries), while the non-premium wine remains unchanged at 48% (which also approximates the OECD average for non-premium wine, and is about the same tax rate in volumetric terms as is the 16% tax on premium wine).
Source: Wittwer and Anderson (1999).