Export innovation of SMEs through the extensive margin in ...
42
INTERNATIONAL TRADE ISSN 1680-869X SERIES Export innovation of SMEs through the extensive margin in Latin America Hyunju Park Nanno Mulder Yuri Park
Transcript of Export innovation of SMEs through the extensive margin in ...

INTERNATIONALTRADE
ISSN 1680-869X
SE
RI
ES
Export innovation of SMEs through the extensive margin in Latin America
Hyunju Park Nanno Mulder Yuri Park

Thank you for your interest in
this ECLAC publication
Please register if you would like to receive information on our editorial
products and activities. When you register, you may specify your particular
areas of interest and you will gain access to our products in other formats.
www.cepal.org/en/suscripciones
ECLACPublications
140
Export innovation of SMEs through the extensive margin in Latin America
Hyunju ParkNanno MulderYuri Park

This document has been prepared by Nanno Mulder, Chief of the International Trade Unit of the Division of
International Trade and Integration of the Economic Commission for Latin America and the Caribbean
(ECLAC), and Hyunju Park and Yuri Park, consultants of the same Unit. This document is an extended and
translated version of Hyunju Park and Nanno Mulder (2017), “Innovación exportadora de las pymes revelada
por el margen extensivo”, in Alicia Frohmann, Nanno Mulder and Ximena Olmos (editors), Promoción de la
innovación exportadora: Instrumentos de apoyo a las pymes, Economic Commission for Latin America and
the Caribbean, Santiago. This document is part of the activities of the cooperation agreement between the
Government of the Republic of Korea and ECLAC.
The views expressed in this document, which has been reproduced without formal editing, are those of the
authors and do not necessarily reflect the views of the Organization.
United Nations publication
ISSN 1680-869X
LC/TS.2018/72
Distribution: L
ORIGINAL: SPANISH
Copyright © United Nations, 2018
All rights reserved
Printed at United Nations, Santiago
S.18-00768
Applications for authorization to reproduce this work in whole or in part should be sent to the Economic Commission for Latin America and the Caribbean (ECLAC), Publications and Web Services Division, [email protected]. Member States and their governmental institutions may reproduce this work without prior authorization, but are requested to mention the source and to inform ECLAC of such reproduction.

ECLAC - International Trade Series No. 140 Export innovation of SMEs through the extensive margin in Latin America
3
Contents
Abstract ..................................................................................................................................................... 5
Introduction ............................................................................................................................................... 7
I. Short literature review ................................................................................................................. 11
II. Methodology and data ................................................................................................................. 15
III. Three dimensions of export innovation: firm, product and destination ................................. 21
A. Firm dimension ...................................................................................................................... 21
B. Product dimension .................................................................................................................. 24
C. Destination dimension ............................................................................................................ 26
IV. A holistic view of export innovation ........................................................................................... 29
V. Conclusions ................................................................................................................................... 35
Bibliography ............................................................................................................................................ 37
International Trade Series: issues published ........................................................................................ 39
Tables
Table 1 Latin America (selected countries): summary statistics of customs data,
2000-2015 ............................................................................................................................. 19 Table 2 Latin America (selected countries): numbers and shares of firms by size,
2000-2015 ............................................................................................................................. 20 Table 3 Latin America (selected countries): top three new export products by SMEs,
periods before and after 2009 ................................................................................................ 26 Table 4 Latin America (selected countries): top three new export destinations for SMEs,
periods before and after 2009 ................................................................................................ 28

ECLAC - International Trade Series No. 140 Export innovation of SMEs through the extensive margin in Latin America
4
Figures
Figure 1 Latin America (selected countries): share of SMEs in total number of firms
and export values, 2000-2015 ............................................................................................... 22
Figure 2 Latin America (selected countries): entry and exit rates of exporting SMEs
and large firms, 2000-2015 ................................................................................................... 23
Figure 3 Latin America (selected countries): survival rates of 2005 cohorts
of exporting SMEs ................................................................................................................ 24
Figure 4 Latin America (selected countries): average numbers of new and total
exported products by type of firm, periods before and after 2009 ........................................ 25
Figure 5 Latin America (selected countries): average numbers of new and total
destinations by type of firm, periods before and after 2009 .................................................. 27
Figure 6 Latin America (selected countries): contributions of the extensive and intensive
margins to annual average export growth by type of firm, before and after 2009................. 30
Figure 7 Latin America (selected countries): decomposition of the extensive margin: new,
disappearing and incumbent firms, periods before and after 2009 ........................................ 31
Figure 8 Latin America (selected countries): decomposition of the extensive margin
into extensive margin of entry (export innovation) and extensive margin of exit,
periods before and after 2009 ................................................................................................ 32
Figure 9 Latin America (selected countries): contribution of each component
of export innovation before and after 2009 ........................................................................... 33
Diagrams
Diagram 1 Components of the joint decomposition of the extensive and intensive margins .................. 16
Diagram 2 Intensive margin and extensive margins of entry and exit .................................................... 17
Diagram 3 Example of export dynamics of a Costa Rican firm .............................................................. 18
ECLAC - International Trade Series No. 140 Export innovation of SMEs through the extensive margin in Latin America
5
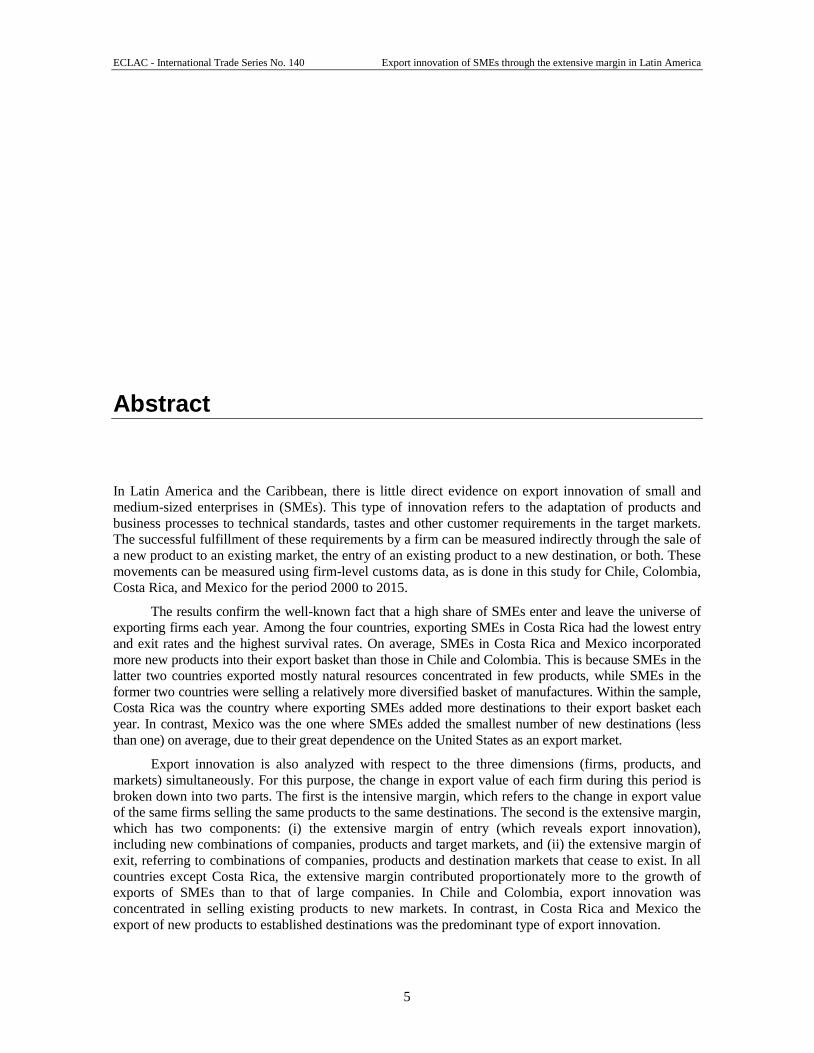
Abstract
In Latin America and the Caribbean, there is little direct evidence on export innovation of small and
medium-sized enterprises in (SMEs). This type of innovation refers to the adaptation of products and
business processes to technical standards, tastes and other customer requirements in the target markets.
The successful fulfillment of these requirements by a firm can be measured indirectly through the sale of
a new product to an existing market, the entry of an existing product to a new destination, or both. These
movements can be measured using firm-level customs data, as is done in this study for Chile, Colombia,
Costa Rica, and Mexico for the period 2000 to 2015.
The results confirm the well-known fact that a high share of SMEs enter and leave the universe of
exporting firms each year. Among the four countries, exporting SMEs in Costa Rica had the lowest entry
and exit rates and the highest survival rates. On average, SMEs in Costa Rica and Mexico incorporated
more new products into their export basket than those in Chile and Colombia. This is because SMEs in the
latter two countries exported mostly natural resources concentrated in few products, while SMEs in the
former two countries were selling a relatively more diversified basket of manufactures. Within the sample,
Costa Rica was the country where exporting SMEs added more destinations to their export basket each
year. In contrast, Mexico was the one where SMEs added the smallest number of new destinations (less
than one) on average, due to their great dependence on the United States as an export market.
Export innovation is also analyzed with respect to the three dimensions (firms, products, and
markets) simultaneously. For this purpose, the change in export value of each firm during this period is
broken down into two parts. The first is the intensive margin, which refers to the change in export value
of the same firms selling the same products to the same destinations. The second is the extensive margin,
which has two components: (i) the extensive margin of entry (which reveals export innovation),
including new combinations of companies, products and target markets, and (ii) the extensive margin of
exit, referring to combinations of companies, products and destination markets that cease to exist. In all
countries except Costa Rica, the extensive margin contributed proportionately more to the growth of
exports of SMEs than to that of large companies. In Chile and Colombia, export innovation was
concentrated in selling existing products to new markets. In contrast, in Costa Rica and Mexico the
export of new products to established destinations was the predominant type of export innovation.


ECLAC - International Trade Series No. 140 Export innovation of SMEs through the extensive margin in Latin America
7
Introduction
For SMEs in Latin America, few surveys exist on export innovation, which refers to changes of products
and business processes required by consumers in destination markets. These adaptations have three
dimensions: compliance with certification and norms, adaptation of products to the preferences of clients,
and identification of distribution channels. Indirect evidence can be collected by looking at the “revealed”
export innovation performance of a firm through its sale of a new product to an existing market, the entry
of an existing product to a new destination, or both. These new combinations of products and markets show
that a company was successful in complying with the customer and market requirements.
This paper analyzes this “revealed” export innovation performance using firm-level customs data
in the selected Latin American countries between 2000 and 2015. These data are used to study three
dimensions of export innovations in terms of new combinations of firms, products, and destinations.
These four countries have different types of export specializations: natural resources in the cases of
Chile and Colombia, manufacturing in the case of Mexico, and a mix of both in the case of Costa Rica.
In this sense, the extensive margin contributes to the diversification of exports.
The selected countries in Latin America show significant differences in their economies and
export patterns. Chile is a high-income country, whereas the other three are middle-income economies.
The size of their economies and populations strongly differs, which is also reflected in the value of their
exports: USD 9.8 billion in Costa Rica, USD 30.2 billion in Colombia, USD 58.5 billion in Chile, and
USD 373 billion in Mexico in 2016 (United Nations, 2017).
The composition of the export baskets also varies among the selected countries. Chile and
Colombia are highly specialized in exporting few natural resources. In Chile, the top exports were
copper ore, refined copper, sulfate chemical wood pulp, fish fillets, and wine. Copper and copper-related
products accounted for almost 50 percent of total exports in 2015 (MIT, 2017). In Colombia, top exports
of Colombia were crude petroleum, coal briquettes, coffee, refined petroleum and cut flowers, with
mineral products representing 53 percent of total exports in 2015 (MIT, 2017).
As the extraction and production of petroleum and minerals is highly capital intensive, exports in
Chile and Colombia are dominated by a few large companies. In Chile, the largest exporter (accounting for
15 percent of the total exports in 2015) is the state-owned company Codelco, which produces copper.
Large companies also dominate exports of other minerals such as iron, zinc, and coal. In other processed

ECLAC - International Trade Series No. 140 Export innovation of SMEs through the extensive margin in Latin America
8
natural resource sectors, exports are also dominated by few companies. For example, in the wood, pulp and
paper industry, exports are concentrated in two companies: Celulosa Arauco y Constitución and CMPC
Celulosa S.A. (Meersohn, 2016). In Colombia, the main export items are petroleum oil and its derivatives,
which are extracted and sold abroad also by few domestic and foreign multinational companies.
In contrast, the export baskets of Mexico and Costa Rica are much more diversified than those of
Chile and Colombia. Mexico's exports include many manufacturing products such as cars, trucks,
vehicle parts, computers, and telephones. Mexico’s top exporting companies are: Volkswagen de
México and Nemak (exporting motor vehicles, engines, and components and parts); América Móvil
(telecommunication products); Grupo México (metallic and non-metallic ores and multimodal freight
railroad); and Alfa (manufactured goods) (Alatorre, 2015). Costa Rica also had a diversified export
basket, including manufactured goods such as microchips until 2015 and other electronic and medical
devices produced mainly by subsidiaries of multinational companies, as well as agricultural products
such as bananas, coffee, and pineapples. The main exporters were St. Jude Medical Costa Rica Ltda.,
Agricultural Development Corporation of Monte SA, Coca Cola Industrias Ltda., Hospira of Costa Rica
Ltda., and Boston Scientific of Costa Rica SRL (Procomer, 2016).
The four countries also show different export trends between 2000 and 2015 (see figure). First,
Chile and Colombia showed much faster growth in the value of exports than Costa Rica or Mexico (see
Panel A). However, this mostly reflects the price increase of the main export commodities of the former
two countries particularly coal, copper and oil. The stagnation of Chile and Colombia’s export value
after 2011 can be mostly attributed to the price drops of these products. In contrast, the value of exports
of Costa Rica and Mexico grew more slowly but more steadily, as these are concentrated in
manufactures, which prices fluctuated little over time. Trends in export volumes are more synchronized
across all four countries, except for Chile after 2010 (see Panel B). This country’s export volume
suffered from the financial crisis in 2009, followed by a recovery in 2010 and stagnation afterwards.
Different trade specializations of the two groups of countries also explain why exports of SMEs and
large firms grew faster in Chile and Colombia compared to Costa Rica and Mexico (see Panel C and D). In
Chile and Colombia, large firms are more concentrated in commodities than SMEs, which explains the
high growth rate of their value of exports. In contrast, in Costa Rica and Mexico, exports by large firms
grew only slightly faster than those of SMEs.
The concentration of export markets shows the opposite between the two groups of countries:
Chile and Colombia have more diversified export markets than Mexico and to a lesser degree Costa
Rica, which mostly export to the United States (see table). This country is a significant partner for all
four countries, but it is clearly more so for Mexico, exporting approximately 80 percent to its northern
neighbor (United Nations 2017). This reflects its strong integration into US production networks
facilitated by the North American Free Trade Agreement (NAFTA). Costa Rican exports are moderately
concentrated across partners, selling about 40 percent of its total to the United States and over 70 percent
to North and Central America (United Nations, 2017). In contrast, Colombia’s and Chile’s exports to
United States represented only 34 and 14 percent, respectively, of total export in 2015. In the case of
Chile, its exports are more concentrated in China and the rest of East Asia, representing about than half
of the total (United Nations 2017).
The paper is organized as follows. After the introduction, section I presents a short review of the
literature on intensive and extensive trade margins and their use as a proxy of export innovation. Section II
presents the decomposition method of export growth into different components of the intensive and
extensive margins used in this study, together with the data used. Section III analyzes three separate
dimensions of export innovation by firm, product and destination. Section IV presents the joint
decomposition into all three dimensions simultaneously, followed by some conclusions and avenues for
future research in the final section.

Export innovation of SMEs through the extensive margin in Latin America.
9
ECECLALACC -- IInntteerrnnaattiioonnaall TrTraaddee SSeerriieess NNoo.. 140 Export innovation of SMEs through the extensive margin in Latin America.
Ta
ble
L
ati
n A
me
ric
a (
se
lec
ted
co
un
trie
s):
ch
ara
cte
ris
tic
s o
f g
oo
ds
exp
ort
s,
20
16
Chile
C
olo
mbia
C
osta
Ric
a
Me
xic
o
GD
P (
bill
ion U
SD
) 247
282
57.4
1046.9
2
Goods e
xport
s
(Bill
ion U
SD
) 58.5
30.2
9
.8
373
Rank a
mong e
xport
ing
countr
ies
35
45
67
13
Main
export
pro
ducts
C
opper
ore
, re
fin
ed c
opper,
sulfate
chem
ical w
ood p
ulp
, fish fill
ets
, and w
ine
Cru
de p
etr
ole
um
, coal
briq
uett
es, coffee,
refin
ed p
etr
ole
um
, and c
ut flo
wers
Medic
al in
str
um
ents
, bananas,
tropic
al fr
uits,
ort
hopedic
applia
nces,
and o
ther
edib
le
pre
para
tions
Cars
, vehic
le p
art
s, deliv
ery
tr
ucks, com
pute
rs,
and t
ele
phones
Main
export
mark
ets
(Bill
ion U
SD
)
Chin
a (
17.1
),
United S
tate
s (
8.4
),
Japan (
5.2
),
South
Kore
a (
4.1
),
Bra
zil
(3.0
)
United S
tate
s (
10.2
),
Panam
a (
1.9
1),
the N
eth
erla
nds (
1.2
),
Ecuador
(1.2
),
Spain
(1.1
6)
United S
tate
s (
4.1
),
the N
eth
erla
nds (
0.6
),
Panam
a (
0.
6),
Belg
ium
(0.5
),
Nic
ara
gua (
0.5
)
United S
tate
s (
30.2
),
Canada (
10.4
),
Chin
a (
5.4
),
Germ
any (
4.0
),
Japan (
3.8
)
Level of concentr
atio
n
of
export
pro
ducts
C
oncentr
ate
d
Concentr
ate
d
Div
ers
ifie
d
Div
ers
ifie
d
Level of concentr
atio
n
of
export
destin
atio
ns
Div
ers
ifie
d
Div
ers
ifie
d
Modera
tely
concentr
ate
d
Hig
hly
concentr
ate
d
Avera
ge a
nnual gro
wth
ra
te o
f export
valu
e
over
last 5 y
ears
(P
erc
enta
ge)
-5.0
-13.6
3.5
-1
.8
Larg
est
export
ing
com
panie
s
Codelc
o C
hile
, M
inera
Escondid
a,
Anglo
Am
erican S
ur,
Min
era
Los
Pela
mbre
s,
Com
. M
eta
lúrg
ico A
lto
Nort
e,
Min
era
Doña I
nés d
e
Colla
huasi, C
elu
losa A
rauco y
C
onstitu
ció
n,
Min
era
Centin
ela
, M
inera
Spence, C
MP
C C
elu
losa
Polip
ropile
no d
el C
arib
e, S
ocie
dad
de F
abricació
n d
e A
uto
mo
tore
s,
Me
xic
hem
Resin
as C
olo
mb
ia, B
ayer,
C
olo
mbia
na,
Dow
Agro
scie
nces d
e
Colo
mbia
, C
.I.
de A
zucare
s y
Mie
les,
Colo
mbia
na K
imb
erly C
olp
apel, C
.I.
Bio
costa
, C
.I. A
cepalm
a
St. J
ude M
edic
al C
osta
Ric
a,
Agricultura
l D
evelo
pm
ent C
orp
ora
tio
n
of
Monte
, C
oca C
ola
Industr
ias,
Hospira o
f C
osta
Ric
a, B
osto
n
Scie
ntific o
f C
osta
Ric
a
Cem
ex,
Volk
sw
agen d
e
Mé
xic
o,
Am
érica M
óvil,
G
rupo M
éxic
o,
Nem
ak, A
lfa,
Petr
óle
os M
exic
anos,
Industr
ias P
eñole
s, G
rum
a,
Me
xic
hem
Sourc
es:
Ela
bora
ted b
y t
he a
uth
ors
based o
n A
lato
rre,
Gera
rdo E
squiv
el
(2015),
“R
ankin
g:
las 1
00 e
xpo
rtadora
s m
ás i
mp
ort
ante
s d
e M
éxic
o [
Rankin
g:
top 1
00 e
xport
ers
of
Mexic
o]”
, M
undo E
jecutivo,
May,
dig
ital.virtu
alm
obile
technolo
gie
s.c
om
.mx/i/5
10193
-mayo-2
015/3
9 [
accessed o
n 6
Fe
bru
ary
2018];
Din
ero
(2016),
“R
ankin
g d
e l
as 2
00 m
ayore
s e
xpo
rtadora
s d
e
Colo
mbia
[R
ankin
g o
f to
p 2
00 e
xpo
rters
of
Colo
mbia
].”
Din
ero
, 13 O
cto
ber,
ww
w.d
inero
.com
/edic
ion
-im
pre
sa/info
rme
-especia
l/art
iculo
/rankin
g-d
e-la
s-2
00-m
ayore
s-e
xport
adora
s-d
e-
colo
mbia
/23
4942 [
accessed o
n 6
Fe
b 2
018];
MIT
(M
assachusetts I
nstitu
te o
f T
echnolo
gy)
(2017),
“T
he O
bserv
ato
ry o
f E
conom
ic C
om
ple
xity”
[onlin
e d
ata
base]
http://a
tla
s.m
edia
.mit.
edu/[
accessed o
n 2
3 M
ay 2
017];
Pro
com
er
(Pro
moto
ra d
el
Com
erc
io E
xte
rio
r de C
osta
Ric
a)(
2016).
“E
sta
dís
ticas d
e c
om
erc
io e
xte
rio
r de C
osta
Ric
a 2
016”
[onlin
e]
https://p
rocom
er.
com
/es/e
stu
dio
s/a
nuario
_esta
dis
tico_2017 [
accessed o
n 6
Fe
bru
ary
2018];
and U
nited N
atio
ns (
2017),
Sta
tistical D
ata
base o
n C
om
modity T
rade (
CO
MT
RA
DE
)” [
onlin
e]
[accessed o
n
23 M
ay 2
017].

ECLAC - International Trade Series No. 140 Export innovation of SMEs through the extensive margin in Latin America
10
Figure Latin America (selected countries): export value by all firms, exporting SMEs and large firms, 2000-2015
(Index 2004=100)
A. Total exports by value B. Total exports by volume
C. Value changes of exporting SMEs D. Value changes of large exporting firms
Sources: Elaborated by the authors based on transaction-level customs data of these four countries; and Economic Commission for Latin America and the Caribbean, “Databases and Statistical Publications,” http://estadisticas.cepal.org [accessed on 16 May 2017].
0
100
200
300
400
2000 2005 2010
Year
0
100
200
300
400
2000 2005 2010 2015
Year
0
100
200
300
400
2000 2005 2010 2015
0
100
200
300
400
2000 2005 2010
Year
Chile Colombia Costa Rica Mexico
ECLAC - International Trade Series No. 140 Export innovation of SMEs through the extensive margin in Latin America
11
I. Short literature review
From the late 1960s onwards, several theoretical and empirical studies have tried to explain the growth
of exports using the concepts of the intensive and extensive margins of exports. These studies adopted
multiple definitions of the intensive and extensive margins. In general, the intensive margin refers to the
growth of exports of permanent combinations of countries, firms, products and/or markets, while the
extensive margin refers to export growth related to new combinations of these variables.
Early trade models explained export growth by either the intensive or extensive margin.
Armington (1969) assumes that all countries produce and export a single product variety. Exports can
only grow by selling more of the same product, which is the intensive margin. In contrast, Krugman
(1981)’s model assumes that the number of product varieties for exports depends directly on the per
capita income of countries. He also assumes that all countries export the same quantity per variety.
Therefore, all export growth originates from the extensive margin. More recently, Melitz (2003)
developed the so-called the “new-new” trade theory incorporating firm heterogeneity and fixed costs of
exporting into existing trade theories such as Krugman (1980 and 1981). In his works, firms start to
export as they become more productive, as part of the extensive margin.
Since Melitz (2003), other studies have been developed to analyze which firms enter the export
market and how they grow using slightly different concepts of the intensive and extensive margins.
Hummels and Klenow (2005) define the extensive margin as the increase in the share of the export
basket of goods of a country in world trade. Brenton and Newfarmer (2007) define the extensive margin
as the sum of either a new product or destination and the intensive margin as the change in existing
products to current destination. Felbermayr and Kohler (2006) focuses these concepts on countries, with
the extensive margin being trade emerging from a newly established bilateral trade relationship, in
contrast to changes in trade within existing bilateral trade ties (the intensive margin). Chaney (2008)
focuses on firms and defines the extensive margin as firms that enter the export universe, whereas
change in the value of sales abroad by continuous exporters refers to the intensive margin. Helpman et
al. (2008) focus on number of exporters (the extensive margin) and trade value per exporter (the
intensive margin). Cadot et al. (2011) and Reis and Farole (2012) use similar concepts.
Based on the reviewed studies, the extensive margin is a more refined concept than
diversification. At the macro level, export diversification can be expressed by the Herfindahl, Gini or
ECLAC - International Trade Series No. 140 Export innovation of SMEs through the extensive margin in Latin America
12
Theil indices (Cadot et al., 2011; Reis and Farole, 2012). At the micro level, diversification refers to
decisions about the introduction of something new (firm, product, or destination) in exports (Cirera et
al., 2015). Diversification can be found at the intensive margin as well as in the extensive margin in each
dimension. For example, a firm can diversify the range of cars it produces. This kind of diversification
cannot be identified at the 6-digit level of the Harmonized System, but it is a diversification within the
intensive margin. In this context, the extensive margin is a sub-concept of diversification.
The contribution of each margin to export growth has been assessed by several studies:
• Evenett and Venables (2002) examined intensive and extensive margins related to export
destinations of 23 developing countries from 1970 to 1997. They found that the intensive
margin contributed about 60 percent to export growth.
• Brenton and Newfarmer (2007) did a similar analysis for 99 countries from 1995 to 2004.
They found that the intensive margin was the most important in all regions and income groups,
except in Africa. In Latin America and the Caribbean, the intensive margin contributed
75 percent and the extensive margin 25 percent to export growth.
• In general, the contribution of the extensive margin cannot be large, since trading values of
exports of new products and new destinations are mostly small (Cadot et al., 2011).
• Lederman et al. (2011) examine entry and exit patterns of export firms in Costa Rica from
1997 to 2007. They conclude that firms that enter have a very high probability to exit the
market after the first year. Once they survive, they stay in the market for a long time.
• Fernandes et al. (2013) examined the export margins of 11 Latin American countries (Brazil,
Chile, Colombia, Costa Rica, Dominican Republic, Ecuador, El Salvador, Guatemala, Mexico,
Nicaragua, and Peru) from 2005 to 2009. The study presents the rates of entry, exit, and
survival of firms in addition to the contribution to export growth made by entrants,
incumbents, and leavers in each dimension of firm, product, and destination. The results
resemble those of Lederman et al. (2011): entry and exit rates are about one third, while about
a half of entrants exit the market in the first year. They also find that the size of entrants was
smaller than that of the incumbents, especially in natural-resource abundant countries.
• Based on their analysis of Colombia exports from 1996 to 2005, Eaton et al. (2007) show that
many new firms start selling abroad each year but these firms represent only a small share of
total exports and show a high failure rate in the first year.
• These results coincide with those of Besedeš and Prusa (2006), using import data of the United
States, who confirm that a firm's survival in the first year reduces the probability of exit in
later years.
• Although its contribution to export growth is generally small, its importance should not be
underestimated. This is because a large part of the trade adjustment is concentrated in the
extensive margin (Helpman et al., 2008).
Several studies have analyzed the determinants of the extensive margin (Arkolakis et al., 2016;
Besedeš and Prusa, 2011; Chaney, 2008; Evenett and Venables, 2002; Helpman et al., 2008; Hummels
and Klenow, 2005; and Silva et al., 2014).1 Among these studies, Chaney (2008) finds that the extensive
margin is sensitive to trade barriers when products of new entrants are highly differentiated whereas the
extensive margin is not affected much by trade barriers when products of new firms could be easily
substituted. Other determinants of the extensive margin in bilateral trade flows are the distance between
trade partners, joint borders, geographic condition (island, landlocked), colonial tie, common currency,
common regional trade agreement, common language, WTO membership, and religion.
1 Although they do not use the terms “intensive” and “extensive margins”, Evenett and Venables (2002) decompose bilateral export
growth of 23 developing countries by products and destinations.

ECLAC - International Trade Series No. 140 Export innovation of SMEs through the extensive margin in Latin America
13
The extensive margin is indirect evidence of export innovation at the firm level. Export
innovation can be defined as changes introduced into products or production processes by firms in
response to demands of export markets. These demands refer to acquiring certification and norms,
adapting products to clients, and finding new distribution channels (Frohmann et al., 2016, 41). This
definition is based on the Oslo Manual, which states that “an innovation is the implementation of a new
or significantly improved product (good or service), or process, a new marketing method, or a new
organizational method in business practices, workplace organization or external relations” (OECD,
2005, 46). This definition of innovation broadens the traditional meaning of innovation, which only
referred to technological products and processes.
The introduction of new products and/or new destinations by firms provides indirect proof that
firms have been successful in introducing new innovations related to product standards, consumer tastes
and distribution networks. Products here are defined as tariff lines of the Harmonized System. This
meaning of export innovation is consistent with the definition of the extensive margin in Brenton and
Newfarmer (2007). Export innovation is a sub-concept of the extensive margin as it refers the extensive
margin of entry of new combinations of firms, products and destinations. Some authors refer to export
entrepreneurship (Cadot et al., 2011; Fernandes et al., 2013; Freund and Pierola, 2010; Lederman et al.,
2011).2 In addition to the extensive margin of entry, there is also the extensive margin of exit. The latter
refers to disappearing combinations of firms, products and destinations. The “total” extensive margin or
simply extensive margin is the net result of entry and exit.
2 Hausmann and Rodrik (2003) separate entrepreneurship from diversification.

ECLAC - International Trade Series No. 140 Export innovation of SMEs through the extensive margin in Latin America
15
II. Methodology and data
This study decomposes annual changes in the value of exports in terms of continuing, new or disappearing
combinations of firms (f), products (p), and destinations (d) using customs data of the selected Latin American
countries. Previous studies (Eaton et al., 2007; Fernandes et al., 2013; and Lederman et al., 2011) did similar
decomposition exercises but only regarding one dimension such as firms or destination markets. Here the unit of
analysis is (f,p,d). These are compared between t and t-1 to identify continuing, new or disappearing
combinations. Annual export innovation is shown by new combinations of firms, products or destinations. This
can be done for each variable separately or combined. For example, at the firm level, a firm that did not export in
year t-1, but exports in t, is part of the extensive margin of entry. In contrast, the intensive margin refers to the
annual change in export value of a firm that also exported any good in the previous year. The same logic applies
to products and destinations.
The change in export value between t and t-1 can be decomposed into three components:
• the intensive margin, which is the change in export value of the same combinations of firms,
products or destinations.
• the extensive margin, which consists of two parts:
o extensive margin of entry or export innovation, which refers to the exports of a new
combinations of firm, product or destination market;
o the extensive margin of exit, being exports of combinations of a firm, product and
destination that disappeared over time
The extensive and intensive margins can be analyzed combining the three dimensions, which
leads to a joint decomposition of changes in export values into eleven components (C1 to C11) as shown
in diagram 1. The upper left orange cells are the components of export innovation (i); the lower right
blue cells are those of the extensive margin of exit (ii); and the grey cell in the middle is the intensive
margin (iii). Components from C2 to C6 refer to the export innovation, representing new combinations
of firm, product, and/or destination in year t and compared to t-1 as follows:
• A firm starts to export (C2);
• An incumbent firm exports a new product to a new destination (C3);

ECLAC - International Trade Series No. 140 Export innovation of SMEs through the extensive margin in Latin America
16
• An incumbent firm sells a product it already exported in t-1 to a new destination (C4);
• An incumbent firm sells a new product to a destination it already exported to in t-1 (C5);
• An incumbent firm sells a new combination of product to a destination not present in t-1 (C6).
The difference between C2 and other components lies in the fact of whether export innovation
occurs at the firm dimension. In other words, C2 represents export innovation of new firms while C3 to
C6 refers to innovation by incumbent firms. The same logic applies to the extensive margin of exit
where C11 is the exit of firms, whereas C7 to C10 are disappearing combinations of incumbent firms.3
Diagram 2 summarizes export innovation, the intensive margin, and the extensive margin of entry
considering each dimension.
Diagram 1 Components of the joint decomposition of the extensive and intensive margins
DESTINATION
New Continuing Disappearing
PR
OD
UC
TS
New
New firm [C2]
New product and continuing
destination by incumbent firm
[C5]
New product and new
destination by incumbent firm
[C3]
Continuing
New destination and continuing
product by incumbent firm [C4]
New combination of
continuing product and
continuing destination by
incumbent firm [C6]
Previous destination and
continuing product by
incumbent firm [C9]
Continuing combination by
incumbent firm [C1]
Previous combination of
continuing product and
continuing destination by
incumbent firm [C7]
Disappearing
Previous product and
continuing destination by
incumbent firm [C8]
Previous product and
disappearing destination
by incumbent firms [C10]
Disappearing firms
[C11]
Source: Elaborated by the authors. Notes: C1 represents the intensive margin; cells from C2 to C6 represent each component of export innovation as a part of the extensive margin of entry, where C2 is export innovation by a new firm and the rest are export innovation by incumbent firms; cells from C7 to C11 represent each component of the extensive margin of exit where C11 is the extensive margin of exit by a disappearing firm and the rest are the extensive margin of exit by continuing firms. The orange and blue cells are mirror images. For example, C11 refers to the exit of same combination of firm, product and destination as the entry in C2.
3 The components of C7 to C10 are expressed as previous combinations instead of disappearing ones. This is because C7 to C10 are
not just losses for firms. Although the combinations in C7 to C10 do not exist in the export innovation, they are the base of the export
innovation appearing in C3 to C6.

ECLAC - International Trade Series No. 140 Export innovation of SMEs through the extensive margin in Latin America
17
Diagram 2 Intensive margin and extensive margins of entry and exit
Extensive margin of entry
(export innovation) Intensive Margin Extensive margin of exit
Margin related to firm-product-
destination
New combinations of product or destination
[C2+C3+C4+C5+C6]
Continuing combinations by incumbent firms [C1]
Previous combinations of product or destination [C7+C8+C9+C10+C11]
Margin related to products Combinations including new
products [C2+C3+C5]
Combinations including continuing product
[C1+C4+C6+C7+C9]
Combinations including disappearing product
[C8+C10+C11]
Margin related to destinations Combinations including new
destination [C2+C3+C4]
Combinations including continuing destination [C1+C5+C6+C7+C8]
Combinations including disappearing destination
[C9+C10+C11]
Margin related to firms New firms [C2]
Combinations by incumbent firm
[C1+C3+C4+C5+C6+C7+C8+C9+C10]
Disappearing firms [C11]
Source: Elaborated by the authors.
Every combination of firm, product and destination in year t can be allocated to one of the cells in
the abovementioned decomposition depending on its existence in year t-1. As such each combination is
grouped under either the extensive or intensive margins, and within the latter as export innovation or the
extensive margin of exit. Below the decomposition is presented formally. First, total export growth is
split between that of SMEs and large firms:
𝑋𝑡𝑛 − 𝑋𝑡−1
𝑛
(𝑋𝑡𝑛 + 𝑋𝑡−1
𝑛 )/2=
𝑋𝑡𝑛,𝑆 − 𝑋𝑡−1
𝑛,𝑆
(𝑋𝑡𝑛 + 𝑋𝑡−1
𝑛 )/2+
𝑋𝑡𝑛,𝐿 − 𝑋𝑡−1
𝑛,𝐿
(𝑋𝑡𝑛 + 𝑋𝑡−1
𝑛 )/2 (1)
where Xt and X(t-1) are export values in years t and t-1, respectively; superscripts S and L refer to
SMEs and large firms, respectively; and superscript n indicates the country. The left side shows total
export growth between years, while the right-hand side shows export growth of SMEs and large firms.
Equation (2) presents the decomposition into eleven components as explained above. The changes in
export values are decomposed using a joint decomposition method that considers three dimensions: firm,
product, and destination. This formula builds on that of Eaton et al. (2007), which decomposes the
extensive margin into two components. The joint decomposition is expressed as follows:
𝑋𝑡𝑛 − 𝑋𝑡−1
𝑛
(𝑋𝑡𝑛 + 𝑋𝑡−1
𝑛 )/2= ∑ ∑
[𝑥𝑖,𝑡𝑛 (𝑓, 𝑝, 𝑑) − 𝑥𝑖,𝑡−1
𝑛 (𝑓, 𝑝, 𝑑)]
(𝑋𝑡𝑛 + 𝑋𝑡−1
𝑛 )/2𝑖∈𝐶1𝑘𝑘∈𝑆,𝐿
+ ∑ ∑∑ 𝑥𝑖,𝑡
𝑛 (𝑓, 𝑝, 𝑑)𝑖∈𝐶𝑗𝑘
(𝑋𝑡𝑛 + 𝑋𝑡−1
𝑛 )/2
6
𝑗=2𝑘∈𝑆,𝐿
− ∑ ∑∑ 𝑥𝑖,𝑡−1
𝑛 (𝑓, 𝑝, 𝑑)𝑖∈𝐶𝑗𝑘
(𝑋𝑡𝑛 + 𝑋𝑡−1
𝑛 )/2
11
𝑗=7𝑘∈𝑆,𝐿
(2)
where Cjk stands for each decomposed element appearing in the decomposition matrix where
j∈{1,2,…,11} matches to the numbers of the components in figure 2, and the variable x(i,t)n (f,p,d) refers
to export value of firm f with product p to destination d at time t and where subscript i means an
observation. The first term on the right hand side is the intensive margin, which equals the growth of the

ECLAC - International Trade Series No. 140 Export innovation of SMEs through the extensive margin in Latin America
18
continuing combinations of firms, products and destinations between time t-1 and t. The second term is
the export innovation (intensive margin of entry) being new combinations that add to the value exports
in time t. The third term is the extensive margin of exit, which refers to disappearing combinations
between t-1 and t.
A hypothetical example can illustrate the above methodology. Consider a Costa Rican firm that
exported cacao powder for the first time in 2001 to Nicaragua. In 2002, it switched markets to Mexico
selling the same product. In 2003, the firm exported chocolate bars to Canada and Mexico. In 2004, it
exported the same product to Mexico, but changed to chocolate cookies to Canada. In 2005, it switched
the combinations of product and destination. Finally, in 2006 the firm stopped exporting (see diagram 3).
Diagram 3 Example of export dynamics of a Costa Rican firm
Source: Elaborated by the authors.
The example above can illustrate different types of export innovation. In 2001, the entry of the
firm to the export universe reveals an export innovation at the firm level. The switch from Nicaragua to
Mexico in 2002 and the inclusion of Canada in 2003 are export innovations at the destination market
level. The market entry shows that the firm managed to comply with the phytosanitary regulations,
adapted its product to the taste of consumers of these markets, and found new distribution channels. The
switches from chocolate powder to chocolate bar in Mexico in 2003 and from chocolate bar to chocolate
cookies in Canada in 2004 illustrate export innovation at the product level, as the firms succeeded in
complying with different regulations, tastes, and distribution channel may apply for these new products.
The continuing exports of cacao powder, chocolate bars, and chocolate cookies in all years except
for 2003 illustrate the intensive margin at the product level as these products continue to be exported.
Similarly, the continuing exports to Mexico from 2002 to 2005 and to Canada from 2003 to 2005
illustrate the intensive margin at the destination level as the countries continue being export markets.
Export innovation (as a part of the extensive margin) is measured using transaction-level customs
data from Latin America (selected countries). These four countries are selected based on data availability
covering at least a decade, and because they offer a representative mix of export specializations (natural
resources and manufactures) in the region. Table 1 summarizes the sample periods, total number of

ECLAC - International Trade Series No. 140 Export innovation of SMEs through the extensive margin in Latin America
19
exporting firms, products and destinations of the selected countries. Customs registers are restricted to
data on exports, and exclude other variables such as sales and employment. However, customs data
allow the measurement of the extensive and intensive margins (see Helpman et al., 2008).
The following variables of each transaction are used in this study: firm, year, product, destination
market, and export value. The unit of analysis is the combination (f,p,d)t, where f is firm, p is the 6-digit
product code of the Harmonized System (HS), d is destination, and t is year (see Cadot et al., 2013). The
codes for products and export markets were adapted to facilitate international comparisons. The product
codes from national classifications were converted to 6-digit codes of the HS. Although most national
classifications use the HS at least up to the 6-digit level, some differ. In these cases, the product
descriptions of the national custom authority are used to find the equivalent in the HS. Export markets
are classified according to the country classification of United Nations Conference of Trade and
Development (UNCTAD) (UNCTAD, 2017).4 Export values equal to zero are also eliminated
(Fernandes et al., 2013). In Chile and Colombia, domestic sales to free zones or customs warehouses are
excluded, while the data of Costa Rica exclude transactions below USD 12,000, which affects the results
as commented below.
Table 1 Latin America (selected countries): summary statistics of customs data, 2000-2015
(number)
Sample Period Firms Products Destinations
Chile 2000-15 34 584 5 367 209
Colombia 2000-14 58 308 5 328 216
Costa Rica 2000-12 6 459 4 789 203
Mexico 2004-14 128 704 5 566 227
Source: Elaborated by the authors based on transaction-level customs data of these four countries. Note: Destinations refer to countries and territories as defined by UNCTAD, which identifies 237 countries and territories.
This paper compares the export innovation behavior between SMEs and large firms, which
requires a threshold to separate both groups. No national definitions of export thresholds are available,
and those for total sales vary too much across countries to be used for international comparisons.
Therefore, a standard definition of a threshold is needed to compare nations. A fixed amount of exports
is not reasonable as countries with higher levels of productivity also have higher levels of exports per
head of population. The definition used here is that of Urmeneta (2016), which is an adjusted version of
Gibson and Van der Vaart (2008). They define SMEs as firms with sales below 1,000 times the per
capita income level at purchasing power parity, which is a proxy for labor productivity. As data in this
paper refer to exports, which is a fraction of sales, Urmeneta (2016) multiplies the previous definition by
the export to GDP ratio with the latter being a proxy of sales. This adjustment accounts for the fact that
firms in larger economies export a lower share of sales than firms in smaller ones, which should be
reflected by a lower threshold of exports. Data on GDP per capita and the ratio of export in GDP are
taken from the World Bank’s World Development Indicators (World Bank, 2017). The number and
share of SMEs and large firms are displayed in table 2.
4 Mainland China is separated in the analysis from Hong Kong and Macau. Liechtenstein was included in Switzerland. This study
considers seven geographic areas: Africa, Asia, Europe, LAC, North America, Oceania, and Others.

ECLAC - International Trade Series No. 140 Export innovation of SMEs through the extensive margin in Latin America
20
Table 2 Latin America (selected countries): numbers and shares of firms by size, 2000-2015
(Numbers and percentage points)
Chile Colombia Costa Rica Mexico
Total SMEs Large Total SMEs Large Nb. SMEs Large Total SMEs Large
(Share) (Share) (Share) (Share) (Share) (Share) (Share) (Share)
2000 5 666 5 131 535 7 472 6 090 1 382 1 618 1 387 231 - - -
(90. 6) (9.4) (81.5) (18.5) (85.7) (14.3) - - -
2001 6 009 5 513 496 8 592 7 016 1 576 1 674 1 440 234 - - -
(91.8) (8.3) (81.7) (18.3) (86.0) (14.0) - - -
2002 6 118 5 615 503 8 973 7 475 1 498 1 646 1 422 224 - - -
(91.8) (8.2) (83.3) (16.7) (86.4) (13.6) - - -
2003 6 436 5 948 488 10 008 8 522 1 486 1 741 1 523 218 - - -
(92.4) (7.6) (85.2) (14.9) (87.5) (12.5) - - -
2004 6 639 6 146 493 11 362 9 838 1 524 1 776 1 572 204 37 414 33 542 3 872
(92.6) (7.4) (86.6) (13.4) (88.5) (11.5) (89.7) (10.4)
2005 6 880 6 399 481 11 583 10 066 1 517 1 894 1 681 213 37 365 33 511 3 854
(93.0) (7.0) (86.9) (13.1) (88.8) (11.3) (89.7) (10.3)
2006 6 973 6 521 452 11 205 9 664 1 541 2 018 1 803 215 36 100 32 301 3 799
(93.5) (6.5) (86.3) (13.8) (89.4) (10.7) (89.5) (10.5)
2007 7 917 7 449 468 11 218 9 560 1 658 2 071 1 840 231 35 930 32 107 3 823
(94.1) (5.9) (85.2) (14.8) (88.9) (11.2) (89.4) (10.6)
2008 8 240 7 690 550 11 171 9 506 1 665 2 117 1 869 248 35 022 31 166 3 856
(93.3) (6.7) (85.1) (14.9) (88.3) (11.7) (89.0) (11.0)
2009 7 517 6 967 550 10 623 9 021 1 602 2 035 1 788 247 33 209 29 124 4 085
(92.7) (7.3) (84.9) (15.1) (87.9) (12.1) (87.7) (12.3)
2010 7 447 6 903 544 9 399 8 178 1 221 2 126 1 852 274 34 364 30 222 4 142
(92.7) (7.3) (87.0) (13.0) (87.1) (12.9) (88.0) (12.1)
2011 7 684 7 100 584 9 498 8 375 1 123 2 412 2 120 292 34 399 30 275 4 124
(92.4) (7.6) (88.2) (11.8) (87.9) (12.1) (88.0) (12.0)
2012 7 462 6 878 584 9 685 8 552 1 133 2 504 2 221 283 34 366 30 177 4 189
(92.2) (7.8) (88.3) (11.7) (88.7) (11.3) (87.8) (12.2)
2013 4 644 7 031 613 10 021 8 896 1 125 - - - 33 367 29 178 4 189
(92.0) (8.0) (88.8) (11.2) - - - (87.5) (12.6)
2014 8 195 7 605 590 10 052 8 930 1 122 - - - 34 206 29 956 4 250
(92.8) (7.2) (88.8) (11.2) - - - (87.6) (12.4)
2015 8 097 7 547 550 - - - - - - - - -
(93.2) (6.8) - - - - - - - - -
Total 34 584 33 892 692 58 308 55 851 2 457 6 459 6 173 286 128 704 123 326 8 813
(98.0) (2.0) (95.8) (4.2) (95.6) (4.4) (95.8) (4.2)
Source: Elaborated by the authors based on transaction-level customs data of these four countries. Note: Total numbers are unique number of firms during the sample period.
ECLAC - International Trade Series No. 140 Export innovation of SMEs through the extensive margin in Latin America
21
III. Three dimensions of export innovation: firm, product and destination
This section analyzes export innovation by looking at three dimensions separately: firms, products, and destinations.
For this purpose, transaction-level customs data are consolidated according to each of these dimensions.
A. Firm dimension
Export innovation at the firm dimension is said to take place when a firm enters the export universe for
the first time. In the four countries, SMEs accounted for the largest number of new and incumbent
exporting firms (Panels A and C of figure 1). Incumbent firms refer to those that also exported in the
previous year. However, SMEs accounted for low shares of total exports of total and incumbent firms
(Panel D and F of figure 1). This is because exports are concentrated in large firms. Among the four
countries, Chile had the highest share of SMEs in the total number of export firms and Costa Rica the
highest share of SMEs in exports. In Colombia, SMEs represented the lowest shares of the total number
of firms and export value.
SMEs play a relatively important role in export innovation at the firm dimension. This is shown
by the much higher shares of SMEs in the total number and export value of new firms (Panels B and E)
in comparison to similar shares in the total number and export value of incumbent firms. SME exports in
Costa Rica and Chile represented 48 and 42 percent, respectively, on average of the export value of new
firms between 2000 and 2015. SME exports in Colombia and Mexico accounted on average for 26 and
19 percent, respectively, of the total export values of new firms.

ECLAC - International Trade Series No. 140 Export innovation of SMEs through the extensive margin in Latin America
22
Figure 1 Latin America (selected countries): share of SMEs in total number
of firms and export values, 2000-2015
(Percentages)
Share of SMEs in total number of:
A. Total export firms B. New export firms C. Incumbent export firms
Share of SMEs in total value of exports by:
D. Total export firms E. New export firms F. Incumbent export firms
Source: Elaborated by the authors based on transaction-level customs data of these four countries.
In all four countries, exporting SMEs are characterized by high annual entry and exit rates (Panel
A and B of figure 2). This means that each year, many SMEs export for the first time while many other
SMEs stop exporting. A firm that exported in year t but not in the previous one is considered an entrant
firm. In contrast, if a firm exported in year t-1 but not in year t is an exit firm. Colombia showed the
highest entry and exit rates with about half of all SMEs entering and leaving the export universe every
year. In contrast, Costa Rica showed lowest entry and exit rates, between 20 and 30 percent. Chile and
Mexico had very similar rates between 30 and 40 percent. High entry and exit rates may reflect
difficulties of SMEs to continue exporting, but may also be due to other factors such as fluctuations in
60
65
70
75
80
85
90
95
100
2000 2005 2010
60
65
70
75
80
85
90
95
100
2000 2005 2010
60
65
70
75
80
85
90
95
100
2000 2005 2010 2015
0
5
10
15
20
25
2000 2005 2010
0
10
20
30
40
50
60
70
80
90
100
2000 2005 2010
0
5
10
15
20
25
2000 2005 2010
Chile Colombia Costa Rica Mexico

ECLAC - International Trade Series No. 140 Export innovation of SMEs through the extensive margin in Latin America
23
exchange rates and relative prices or demand shocks. Entry and exit rates of large firms were much
lower than those of SMEs (below 10 percent), as shown in Panel C and D of figure 2.5
Figure 2 Latin America (selected countries): entry and exit rates of exporting SMEs and large firms, 2000-2015
(Percentage points)
A. Entry rate of exporting SMEs B. Exit rate of exporting SME
C. Entry rate of large exporting firms D. Exit rate of large exporting firms
Source: Elaborated by the authors based on transaction-level customs data of these four countries.
In a context of high entry and exit rates, the question arises about for how long exporting SMEs
survive. Using the Kaplan-Meier estimator, survival rates are estimated for SMEs that started to export
in 2005 (see figure 3).6 This cohort is selected, because data was available only from 2004 onwards for
some countries. Costa Rica had the highest survival rate, followed by Chile and Mexico, and Colombia.
After one year, between 32 percent (Costa Rica) and 61 percent (Colombia) of exporting SMEs stopped
exporting (figure 3). The survival rates after the second and subsequent years improved strongly. Costa
Rica showed persistently higher survival rates from the first to the seventh year. Almost 20 percent the
2005 cohort survived throughout 2012. Trends for the 2006, 2007, and 2008 cohorts were very similar.
5 These results resemble those of Eaton et al. (2007), Fernandes et al. (2013) and Lederman et al. (2011), which refer to all firms
instead of SMEs. As SMEs account for almost all firms, entry and exit rates of total firms are very similar to those of SMEs. 6 For more information, see Kaplan and Meier (1958). For its application to international trade at the firm level, see Nicita et al. (2013).
0
10
20
30
40
50
60
2000 2005 2010
Rate
(perc
enta
ge)
Year
2000 2005 2010 2015
Year
0
5
10
15
20
2000 2005 2010 2015
0
5
10
15
20
2000 2005 2010
Chile Colombia Costa Rica Mexico

ECLAC - International Trade Series No. 140 Export innovation of SMEs through the extensive margin in Latin America
24
The country order in this figure is opposite that of entry and exit rates presented in figure 3. In other
words, survival rates are negatively associated with entry and exit rates.7
Figure 3 Latin America (selected countries): survival rates of 2005 cohorts of exporting SMEs
(Rates in numbers)
Source: Elaborated by the authors based on transaction-level customs data of these four countries.
In sum, SMEs represent a relatively high share of the export value of new entrants, but many of
those firms seize to export after one year. From the survival analysis, the exit rates drop sharply after the
first year. In Costa Rica, new exporting SMEs represented a higher percent of export values to other
countries and also showed the highest survival rates of exporting SMEs in the four countries.
B. Product dimension
Export innovation at the product level takes place when a firm adds a new product to its export basket
for the first time even though the same product may already be exported by other firms. The revealed
product innovation performance of exporting SMEs and large firms in Costa Rica and Mexico was
significantly better than that of Chile and Colombia. Also, differences between SMEs and large firms
were bigger in Costa Rica and Mexico compared to those in Chile and Colombia. This may because the
latter two countries mostly export natural resources that are concentrated in few products, whereas the
former two export a more diversified range of manufactures. Exporting SMEs in the four countries also
showed significant differences in the number of total and new products exported in the periods before
(P1) and since the beginning of the financial crisis in 2009 (P2) (Panel A in figure 4). These two country
groups also differed regarding the number of newly exported products by SMEs before and after the
financial crisis: in the former two countries it increased, whereas it fell in the latter two.
7 These results coincide with previous findings on the region which showed high entry and exit rates, as well as increasing survival
rates over time (Eaton et al., 2007; Fernandes et al., 2013; and Lederman et al., 2011).
0.0
0.1
0.2
0.3
0.4
0.5
0.6
0.7
0.8
0.9
1.0
0 1 2 3 4 5 6 7 8 9 10 11
Surv
ival ra
te
Survival year
Chile Colombia Costa Rica Mexico

ECLAC - International Trade Series No. 140 Export innovation of SMEs through the extensive margin in Latin America
25
New product Total product - New product
Figure 4 Latin America (selected countries): average numbers of new and total exported products
by type of firm, periods before and after 2009
(Numbers)
A. Exporting SMEs B. Large exporting firms
Source: Elaborated by the authors based on transaction-level customs data of these four countries. Note: P1 indicates the period before 2009, and P2 indicates the period from 2009 onwards.
New products played a relatively more significant role in the export basket of SMEs than of large
firms. Costa Rica was the country where SMEs exported the highest numbers of new and total products
and where the increase between the pre —and post— crisis was the largest. In the case of large exporting
firms, Mexico showed the largest increase in new and total products from the first to the second period.
Exporting SMEs in Costa Rica in P2 had the largest share (64 percent) of new products in the total
export basket, and exporting SMEs in Mexico in P1 the smallest share (50 percent). In the case of large
firms, the highest share of new products in total exports was 48 percent in Mexico in P1. Overall, the
results confirm an export innovation performance gap at the product level between Chile and Colombia
versus Costa Rica and Mexico.
The four countries also showed important differences regarding the three main newly exported
products before and after the financial crisis (see table 3). In Chile, Costa Rica, and Mexico, the main
new products were from agriculture or aquaculture. Most of them were primary goods, although the
number one new product of SMEs in Chile was agricultural services. In these three countries, the ranks
are the same in each period. New exports by Colombian SMEs included household items, furniture,
clothes, and some agricultural commodities.
0
10
20
30
40
P1 P2 P1 P2 P1 P2 P1 P2
Chile Colombia Costa Rica Mexico
Num
ber
of
avera
ge p
roduct
P1 P2 P1 P2 P1 P2 P1 P2
Chile Colombia Costa Rica Mexico

ECLAC - International Trade Series No. 140 Export innovation of SMEs through the extensive margin in Latin America
26
Table 3 Latin America (selected countries): top three new export products by SMEs,
periods before and after 2009
P1: Period to 2009 P2: Period from 2009 onwards
Rank Product description Value (million USD)
Export share (%)
Product description Value (million USD)
Export share (%)
Chile (2000-2008) Chile (2009-2015)
1 Services relevant to exports of sugars and sugar confectionery (chapter 17), or oil seed, fruits, grain, seeds
24.4 5.1 Services relevant to exports of sugars and sugar confectionery (chapter 17), or oil seed, fruits, grain, seeds (chapter 12)*
74.5 9.8
2 Grapes, fresh or dried 16.9 3.6 Grapes, fresh or dried 25.9 3.4
3 Fish fillets and other fish meat (whether or not minced), fresh, chilled or frozen
15.9 3.4 Fish fillets and other fish meat (whether or not minced), fresh, chilled or frozen
22.7 3.0
Colombia (2000-2008) Colombia (2009-2014)
1 Cut flowers and flower buds of a kind suitable for bouquets
14.4 6.9 Supplementary arrangement to pack or protect special household items**
6.3 2.2
2 Other furniture and parts thereof 5.1 2.5 Live bovine animals 5.9 2.1
3 Women's or girls' suits, ensembles, jackets, blazers, dresses, skirts, divided skirts, trousers, bib and brace overalls, breeches and shorts (other than swimwear)
4.3 2.1 Cut flowers and flower buds of a kind suitable for bouquets
5.9 2.1
Costa Rica (2000-2008) Costa Rica (2009-2012)
1 Bananas, including plantains, fresh or dried
9.9 7.6 Bananas, including plantains, fresh or dried
21.3 9.4
2 Dates, figs, pineapples, avocados and mangosteens, fresh or dried
7.9 6.0 Dates, figs, pineapples, avocados and mangosteens, fresh or dried
11.2 4.9
3 Melons (including watermelons) and papaws (papayas), fresh
4.0 3.1 Manioc, arrowroot, sweet potatoes and similar roots
11.3 4.8
Mexico (2004-2008) Mexico (2009-2014)
1 Live bovine animals 49.9 3.5 Live bovine animals 88.6 5.2
2 Other vegetables, fresh or chilled
30.8 2.2 Other vegetables, fresh or chilled 44.8 2.5
3 Crustaceans, whether in shell or not
28.1 2.0 Crustaceans, whether in shell or not 35.8 2.1
Source: Elaborated by the authors based on transaction-level customs data of these four countries. Notes: Descriptions are from Commodity List of HS at digit 4 level, United Nations Commodity Trade Statistics Database[accessed on 18 May 2017], https://comtrade.un.org/db/mr/rfCommoditiesList.aspx;* the description is found in Arancel Aduanero Vigente, Aduanas Chile [Chilean Customs][accessed on 23 May 2017], https://www.aduana.cl/arancel-aduanero-vigente/aduana/2016-12-30/090118.html;** the description is found in Consulta General de la Nomenclatura, Dirección de Impuestos y Aduanas Nacionales [Colombian Customs] [accessed on 23 May 2017], https://muisca.dian. gov.co/WebArancel/DefConsultaGeneralNomenclaturas.faces.
In sum, export innovation at the product dimension was particularly important for SMEs in all
four countries, as expressed by high shares of new products in the total number of exported products per
firm. Costa Rican SMEs were the most dynamic in terms of adding new products to their export baskets.
Moreover, the new products exported by SMEs were mainly concentrated in agriculture and aquaculture
goods, with some exceptions in Colombia. In addition, the ranks of those products did not change over
time except for Colombia.
C. Destination dimension
The export innovation performance can also be analyzed for market destinations. As expected, large
firms exported to more destination markets than SMEs, especially in Chile and Costa Rica. The increase
between the two periods is also greater for large exporting firms than exporting SMEs. Figure 5 shows
how many new market destinations exporting SMEs and large firms added each year on average in the
ECLAC - International Trade Series No. 140 Export innovation of SMEs through the extensive margin in Latin America
27
New destination Total destination - New destination
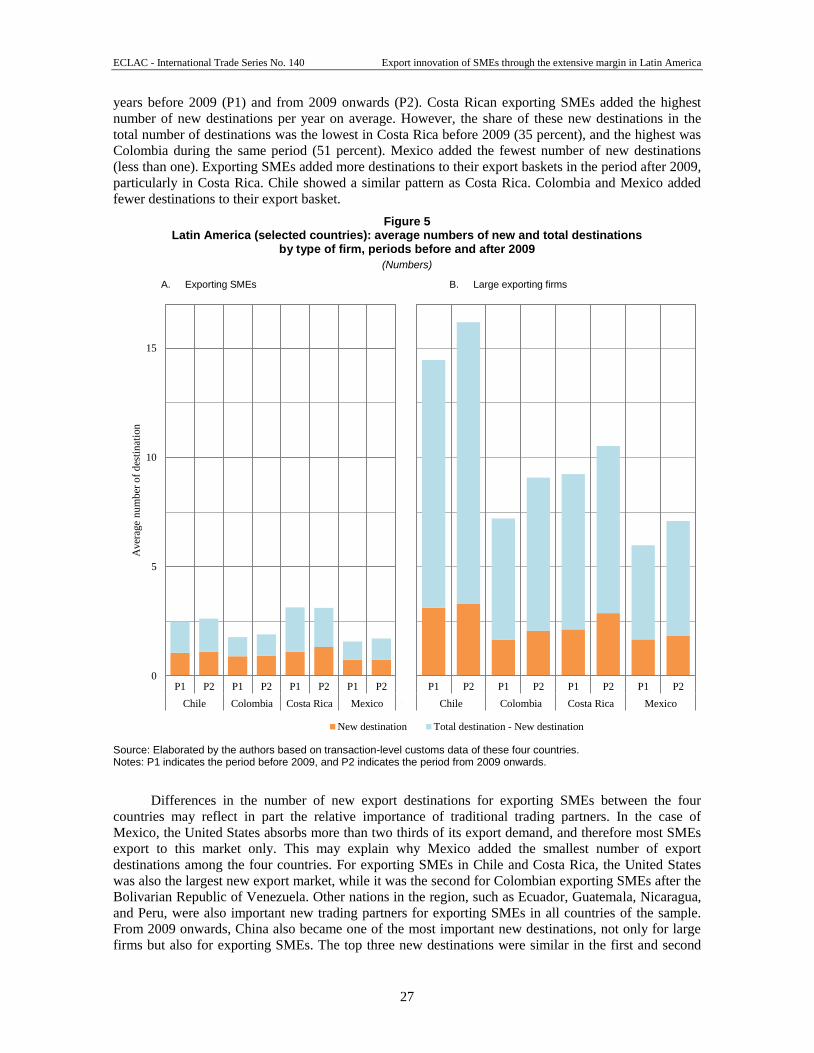
years before 2009 (P1) and from 2009 onwards (P2). Costa Rican exporting SMEs added the highest
number of new destinations per year on average. However, the share of these new destinations in the
total number of destinations was the lowest in Costa Rica before 2009 (35 percent), and the highest was
Colombia during the same period (51 percent). Mexico added the fewest number of new destinations
(less than one). Exporting SMEs added more destinations to their export baskets in the period after 2009,
particularly in Costa Rica. Chile showed a similar pattern as Costa Rica. Colombia and Mexico added
fewer destinations to their export basket.
Figure 5 Latin America (selected countries): average numbers of new and total destinations
by type of firm, periods before and after 2009
(Numbers)
A. Exporting SMEs B. Large exporting firms
Source: Elaborated by the authors based on transaction-level customs data of these four countries. Notes: P1 indicates the period before 2009, and P2 indicates the period from 2009 onwards.
Differences in the number of new export destinations for exporting SMEs between the four
countries may reflect in part the relative importance of traditional trading partners. In the case of
Mexico, the United States absorbs more than two thirds of its export demand, and therefore most SMEs
export to this market only. This may explain why Mexico added the smallest number of export
destinations among the four countries. For exporting SMEs in Chile and Costa Rica, the United States
was also the largest new export market, while it was the second for Colombian exporting SMEs after the
Bolivarian Republic of Venezuela. Other nations in the region, such as Ecuador, Guatemala, Nicaragua,
and Peru, were also important new trading partners for exporting SMEs in all countries of the sample. From 2009 onwards, China also became one of the most important new destinations, not only for large
firms but also for exporting SMEs. The top three new destinations were similar in the first and second
0
5
10
15
P1 P2 P1 P2 P1 P2 P1 P2
Chile Colombia Costa Rica Mexico
Aver
age
nu
mb
er o
f d
esti
nat
ion
P1 P2 P1 P2 P1 P2 P1 P2
Chile Colombia Costa Rica Mexico

ECLAC - International Trade Series No. 140 Export innovation of SMEs through the extensive margin in Latin America
28
period with only a few changes, suggesting that SMEs were seeking the same new markets in the first
and second period.
Table 4 Latin America (selected countries): top three new export destinations for SMEs,
periods before and after 2009
P1: Period before 2009 P2: Period from 2009 onwards
Rank Main destinations Value (million USD)
Export share (percentage)
Main destinations Value (million SD)
Export share (percentage)
Chile (2000-2008) Chile (2009-2015)
1 United States 61.5 12.2 United States 86.0 11.5
2 Peru 33.4 6.6 Peru 58.1 7.8
3 Mexico 26.5 5.2 China 51.0 6.8
Colombia (2000-2008) Colombia (2009-2014)
1 Venezuela (B.R. of) 51.2 27.2 Venezuela (B.R. of) 50.7 19.3
2 United States 34.0 18.1 United States 36.7 13.9
3 Ecuador 17.6 9.3 Ecuador 25.5 9.7
Costa Rica (2000-2008) Costa Rica (2009-2012)
1 United States 29.7 25.8 United States 37.5 20.3
2 Nicaragua 6.8 5.9 Panama 13.7 7.4
3 Netherlands 6.7 5.8 Netherlands 9.4 5.1
Mexico (2004-2008) Mexico (2009-2014)
1 United States 615.6 54.0 United States 651.4 48.9
2 Guatemala 34.9 3.1 China 44.9 3.4
3 Canada 31.7 2.8 Guatemala 41.2 3.1
Source: Elaborated by the authors based on transaction-level customs data of these four countries.
The comparison of the revealed export innovation at the product and destination market levels
show interesting differences. The export innovation at the market destination level is smaller than at the
product level, in part because there are simply far more products than destinations. Therefore, an average
exporting SME adds a smaller number of new destinations than the number of new products to its export
basket. Moreover, unlike the product dimension, new market destinations are not very different from
traditional export partners.

ECLAC - International Trade Series No. 140 Export innovation of SMEs through the extensive margin in Latin America
29
IV. A holistic view of export innovation
This section analyzes changes in export values by looking at all three dimensions (firm, products, and
destination markets) simultaneously. This joint decomposition shows how important the overall export
innovation is in export growth compared to the “business as usual” as expressed by the intensive margin.
Export innovation in this section refers to any new combination of firm, product, and destination appearing
in the export universe. This joint decomposition is presented in four parts. First, changes in export values
are decomposed into the extensive and intensive margins both in absolute and relative terms (see figure 6).
Second, the extensive margin is split into two parts: that of new and disappearing firms and that of
incumbent firms (see figure 7). Third, the extensive margin is divided into export innovation and the
extensive margin of exit (see figure 8). Fourth, export innovation of new combinations of firms, products,
and destination markets is decomposed into five components (see figure 9).
Figure 6 shows the contributions of the extensive and intensive margins to the average annual growth
rate of exports before and after 2009. The extensive margin is the net result of export innovation
(the extensive margin of entry) and disappearing combinations of firms, products, and destinations (the
extensive margin of exit). In all four countries, the extensive margin contributed more in absolute terms
(percentage points) to export growth of large firms than to that of SMEs in both periods (panels A and B).
However, in relative terms the opposite result is found: the extensive margin contributed proportionally more
to export growth of SMEs than to that of large firms in both periods except for Costa Rica (panels C and D).
In Chile, Colombia, and Mexico, the extensive margin contributed between 40 and 60 percent of average
annual export growth of SMEs. For large firms, this share was less than 30 percent. In Costa Rica, in contrast,
the extensive margin contributed on average 48 percent and 12 percent to average annual export growth of
SMEs in the periods before and after 2009, respectively, whereas the contribution for large firms was
94 percent and 78 percent, respectively.

ECLAC - International Trade Series No. 140 Export innovation of SMEs through the extensive margin in Latin America
30
Intensive margin Extensive margin Growth rate
Figure 6 Latin America (selected countries): contributions of the extensive and intensive margins to annual
average export growth by type of firm, before and after 2009
I. Absolute contribution to export growth
(Percentage points)
A. SMEs B. Large firms
II. Relative contribution to export growth
(Percentage points)
C. SMEs D. Large firms
Source: Elaborated by the authors based on transaction-level customs data of these four countries. Note: P1 indicates the period before 2009, and P2 indicates the period from 2009 onwards.
In figure 7, the extensive margin is split into two parts. The red part of the bar is the extensive
margin generated by the entry and exit of firms, which is the sum of the components of C2 and C11. The
pink part of the bar is the extensive margin generated by incumbent firms (which is the sum of the C3 to
-4
0
4
8
12
16
P1 P2 P1 P2 P1 P2 P1 P2
Chile Colombia Costa Rica Mexico
Ab
solu
te c
on
trib
uti
on (
per
cen
tage)
P1 P2 P1 P2 P1 P2 P1 P2
Chile Colombia Costa Rica Mexico
0
20
40
60
80
100
P1 P2 P1 P2 P1 P2 P1 P2
Chile Colombia Costa Rica Mexico
Rel
ativ
e co
ntr
ibu
tio
n (
per
cen
tage)
P1 P2 P1 P2 P1 P2 P1 P2
Chile Colombia Costa Rica Mexico

ECLAC - International Trade Series No. 140 Export innovation of SMEs through the extensive margin in Latin America
31
New and disappearing firms Incumbent firms Extensive margin
C6 and C7 to C10). In the case of SMEs, the extensive margin corresponding only to the entry and exit
of firms was relatively larger in Chile and Colombia than in Costa Rica and Mexico in general. This
pattern does not hold in the case of large firms.
Figure 7 Latin America (selected countries): decomposition of the extensive margin: new, disappearing
and incumbent firms, periods before and after 2009
(Percentage points)
A. Exporting SMEs B. Large exporting firms
Source: Elaborated by the authors based on transaction-level customs data of these four countries. Note: P1 indicates the years before 2009, and P2 indicates the years from 2009 onwards.
The extensive margin can be decomposed into four parts: export innovation (the extensive margin
of entry) of new and incumbent firms and disappearing combinations (the extensive margin of exit) of
disappearing and incumbent firms (see figure 8). In turn, each part can be split at the firm level. Note
that export innovation is always positive as it adds new combinations of firms, products and destinations
to exports. In contrast, the extensive margin of exit is always negative as it represents a loss these
combinations. This decomposition shows that most of the positive contribution made by new firms is
largely cancelled out by disappearing firms. Moreover, a large part of export innovation by incumbent
firms is also removed by the extensive margin of exit. Nevertheless, the contribution of export
innovation always exceeds that of the extensive margin of exit in SMEs and large firms. This result
confirms that of Cadot et al. (2011), who found that most failures mostly occur at the level of new firms.
The extensive margin of exit by incumbent firms could be interpreted as part of their export innovation
strategy rather than a failure of incumbent firms. Firms define optimal combinations of products and
markets, which is a dynamic process including the elimination of certain combinations of both. Also,
results show that the absolute contribution of export innovation was higher for large firms than SMEs in
all the four countries in both periods. In the case of SMEs, Costa Rica presented the largest contributions
of both export innovation and the extensive margin of exit within the sample of four countries.
-1
-0.5
0
0.5
1
1.5
2
2.5
3
3.5
P1 P2 P1 P2 P1 P2 P1 P2
Chile Colombia Costa Rica Mexico
Ab
solu
te c
on
trib
uti
on (
per
cen
tage)
P1 P2 P1 P2 P1 P2 P1 P2
Chile Colombia Costa Rica Mexico
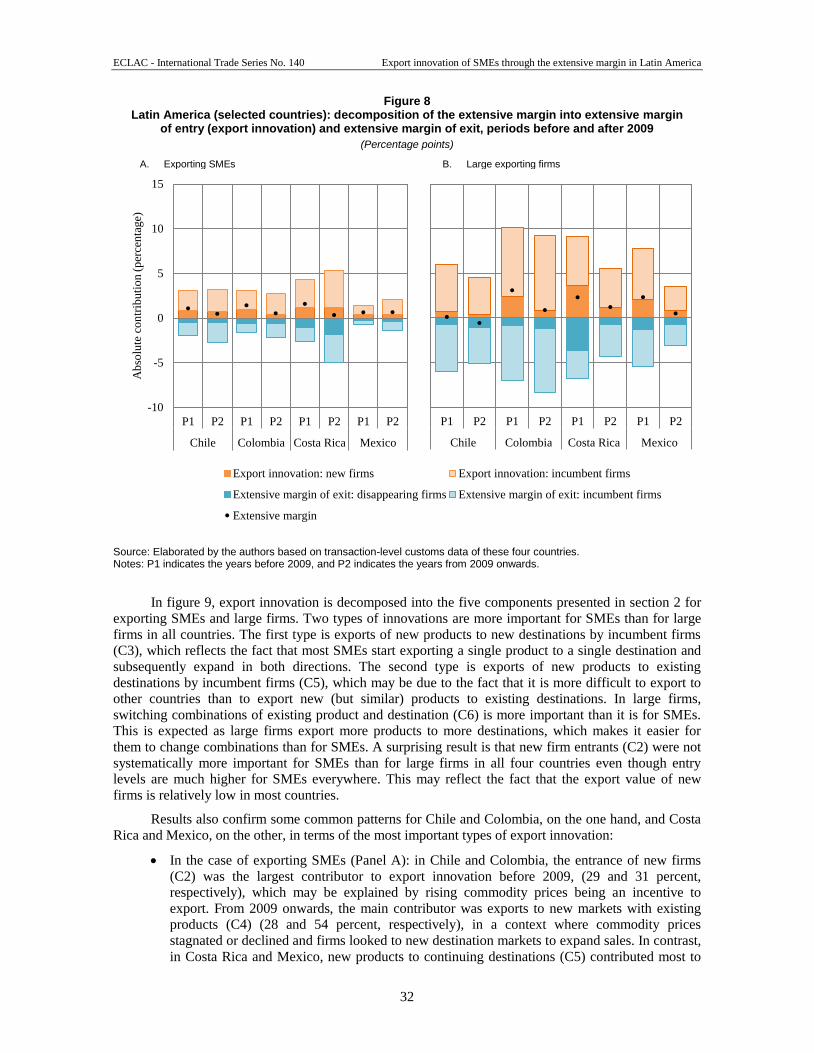
ECLAC - International Trade Series No. 140 Export innovation of SMEs through the extensive margin in Latin America
32
Export innovation: new firms Export innovation: incumbent firms
Extensive margin of exit: disappearing firms Extensive margin of exit: incumbent firms
Extensive margin
Figure 8 Latin America (selected countries): decomposition of the extensive margin into extensive margin
of entry (export innovation) and extensive margin of exit, periods before and after 2009
(Percentage points)
A. Exporting SMEs B. Large exporting firms
Source: Elaborated by the authors based on transaction-level customs data of these four countries. Notes: P1 indicates the years before 2009, and P2 indicates the years from 2009 onwards.
In figure 9, export innovation is decomposed into the five components presented in section 2 for
exporting SMEs and large firms. Two types of innovations are more important for SMEs than for large
firms in all countries. The first type is exports of new products to new destinations by incumbent firms
(C3), which reflects the fact that most SMEs start exporting a single product to a single destination and
subsequently expand in both directions. The second type is exports of new products to existing
destinations by incumbent firms (C5), which may be due to the fact that it is more difficult to export to
other countries than to export new (but similar) products to existing destinations. In large firms,
switching combinations of existing product and destination (C6) is more important than it is for SMEs.
This is expected as large firms export more products to more destinations, which makes it easier for
them to change combinations than for SMEs. A surprising result is that new firm entrants (C2) were not
systematically more important for SMEs than for large firms in all four countries even though entry
levels are much higher for SMEs everywhere. This may reflect the fact that the export value of new
firms is relatively low in most countries.
Results also confirm some common patterns for Chile and Colombia, on the one hand, and Costa
Rica and Mexico, on the other, in terms of the most important types of export innovation:
• In the case of exporting SMEs (Panel A): in Chile and Colombia, the entrance of new firms
(C2) was the largest contributor to export innovation before 2009, (29 and 31 percent,
respectively), which may be explained by rising commodity prices being an incentive to
export. From 2009 onwards, the main contributor was exports to new markets with existing products (C4) (28 and 54 percent, respectively), in a context where commodity prices
stagnated or declined and firms looked to new destination markets to expand sales. In contrast,
in Costa Rica and Mexico, new products to continuing destinations (C5) contributed most to
-10
-5
0
5
10
15
P1 P2 P1 P2 P1 P2 P1 P2
Chile Colombia Costa Rica Mexico
Ab
solu
te c
on
trib
uti
on (
per
cen
tage)
P1 P2 P1 P2 P1 P2 P1 P2
Chile Colombia Costa Rica Mexico

ECLAC - International Trade Series No. 140 Export innovation of SMEs through the extensive margin in Latin America
33
New combination of continuing product and continuing destination by incumbent firm (C6)
New product and continuing destination by incumbent firm (C5)
New destination and continuing product by incumbent firm (C4)
New product and new destination by incumbent firm (C3)
New firm (C2)
export innovation in both periods: in Costa Rica 31 and 34 percent before and after 2009,
respectively; and in Mexico 42 and 30 percent, respectively. This result may reflect the
dominant position of the United States for Mexico, and to a lesser extent Costa Rica, and the
fact that their manufacturing firms a larger potential to diversify exports in terms of products
than countries specialized in natural resources such as Chile and Colombia.
• In the case of large firms (panel B): in Chile and Colombia, selling existing products to new
destinations (C4) was the largest contributor to export innovation while in Costa Rica and
Mexico, selling new products to existing destinations (C5) was the most significant. Similar
reasons may explain these differences.
• In Chile and Colombia, export innovation in large firms was much more concentrated in two
categories than in SMEs: selling existing products to new destinations (C4), followed by
changing combinations of both existing product and destination (C6). In contrast, export
innovation in SMEs showed higher contributions from new products and new destinations by
incumbent firms (C3).
Figure 9 Latin America (selected countries): contribution of each component
of export innovation before and after 2009
(Percentage points)
A. Exporting SMEs B. Large exporting firms
Source: Elaborated by the authors based on transaction-level customs data of these four countries. Note: P1 indicates the years until 2009, and P2 indicates the years from 2009 onwards.
2924
31
17
2923
2925
18
12
19
6
11
7
11
5
27
28
19
54 21
2512
22
17
23
2618
3134 42
30
913
5 6 8 116
19
0
20
40
60
80
100
P1 P2 P1 P2 P1 P2 P1 P2
Chile Colombia Costa Rica Mexico
Share
of
com
ponent
(perc
enta
ge)
12 11
24
10
40
23
3325
43 39
36 64
14
2612 22
17 19
22
13
2534 41 30
26 25
15 1217 15 12
19
P1 P2 P1 P2 P1 P2 P1 P2
Chile Colombia Costa Rica Mexico

ECLAC - International Trade Series No. 140 Export innovation of SMEs through the extensive margin in Latin America
35
V. Conclusions
This paper analyzes the intensive and extensive margins of export growth at the firm level for four
countries from 2000 to 2015. Two of these are specialized in natural resources (Chile and Colombia),
one in manufactures (Mexico) and another in both (Costa Rica). Different export specializations explain
in part why the value of exports of large firms grew much faster in Chile and Colombia than in Mexico
and Costa Rica. In contrast, the exports by SMEs in the four countries grew much slower and at similar
rates. The intensive margin, which is business as usual, refers to exports of the same products to the
same destinations by the same firms. The extensive margin consists of two parts: (i) extensive margin of
entry or export innovation, which are new combinations of firms, products and market destinations, and
(ii) extensive margin of exit, which are combinations of firms, products, and market destinations that
disappear from the export universe.
The results confirm the well-known high entry and exit levels of SMEs in all four countries.
Colombia had the highest entry and exit rates with about half of the SMEs entering and leaving the
export universe every year. In contrast, Costa Rica showed lowest entry and exit rates (between 20 and
30 percent). Chile and Mexico had similar rates between 30 and 40 percent. In this context, the question
arises how long exporting SMEs survive. Results suggest that survival rates were highest in Costa Rica,
followed by Chile, Mexico and Colombia. At the product level, SMEs in Costa Rica and Mexico added
on average more products to their export basket every year than those in Chile and Colombia. This may
be because SMEs in the latter two countries mostly export natural resources that are concentrated in
fewer products, whereas the former two export a relatively more diversified basket of manufactures. At
the destination level, SMEs in Costa Rica added the highest number of new destinations per year on
average. Mexico added the fewest number of new destinations (below one). These differences reflect in
part the relative importance of trading partners. In Mexico, the United States absorbs more than two
thirds of its export demand, and therefore, most SMEs export to this market only.
In all countries except Costa Rica, the extensive margin contributed proportionally more to export
growth of SMEs than to that of large firms. In Chile, Colombia, and Mexico, the extensive margin
contributed between 40 and 60 percent of average annual export growth of SMEs between 2000 and 2015. For large firms, this share was less than 30 percent. In Costa Rica, in contrast, the extensive
margin contributed 48 and 12 percent to average annual export growth of SMEs in the periods before
and after 2009, respectively, whereas the contributions for large firms were 94 and 78 percent,

ECLAC - International Trade Series No. 140 Export innovation of SMEs through the extensive margin in Latin America
36
respectively. The decomposition of the extensive margin shows that a large part of the positive
contribution made by export innovation (the extensive margin of entry) is cancelled out by the extensive
margin of exit, but the extensive margin by incumbent firms always contributes positively to export
growth. The three predominant components of export innovation of SMEs in the four countries are new
firms, new destination and continuing products, and new product and continuing destination.
Among the four countries, Costa Rica showed the best export innovation performance. Costa Rican
SMEs presented the highest survival rates. Moreover, they added on average the highest numbers of new
products and new destinations to their export basket each year. In addition, the export growth rate of SMEs
was the highest among the four countries. The joint decomposition of export growth showed that the absolute
contribution of export innovation to export growth of SMEs was also the highest among the four countries.
The results presented here have some limitations. Although new combinations of firms, products,
and destinations are used as a proxy of export innovation, it remains unclear which types of innovations
were implemented by a firm to overcome different hurdles to enter new markets. Specific surveys are
required to obtain this type of information. Also, the thresholds of SMEs are somewhat arbitrary, and
more robustness tests are needed to check how sensitive results are to specific thresholds. Another
shortcoming is that the general results presented here may hide different patterns across sectors.
In future studies, the joint decomposition could be conducted at a more detailed level to find out
which sectors are most innovative. Finally, econometric analysis could be carried out to explain which
factors drive differences in export innovation behavior between countries, firm classes, and time periods.
Examples of variables include firm, sector, year, country, destination market and real exchange rate.

ECLAC - International Trade Series No. 140 Export innovation of SMEs through the extensive margin in Latin America
37
Bibliography
Arkolakis, Costas, Sharat Ganapati, and Marc-Andreas Muendler (2016), “The extensive margin of exporting
products: a firm-level analysis”, Cowles Foundation Discussion Paper, no. 2016. New Haven, Cowles
Foundation for Research in Economics, Yale University.
Armington, Paul S. (1969), “A theory of demand for products distinguished by place of production”, IMF
Staff papers‚ Vol. 16‚ pp.159-76.
Besedeš, Tibor, and Thomas J. Prusa (2006), “Ins, outs, and the duration of trade”, The Canadian Journal of
Economics, vol. 39, No. 1 (February).
_____ (2011), “The role of extensive and intensive margins and export growth”, Journal of Development
Economics, vol. 96, No. 2 (November).
Brenton, Paul, and Richard Newfarmer (2007), “Watching more than the discovery channel: export cycles and
diversification in development”, Policy Research Working Papers, No. 4302, World Bank.
Cadot, Olivier, Céline Carrère, and Vanessa Strauss-kahn (2011), “Trade diversification: drivers and
impacts”, Trade and Employment: From Myths to Facts, Marion Jansen, Ralf Peters, and José Manuel
Salazar-Xirinachs (eds.), International Labour Office.
Cadot, Olivier, Leonardo Iacovone, Martha Denisse Pierol and Ferdinand Rauch (2013), “Success and failure
of African exporters”, Journal of Development Economics, vol. 101 (March).
Chaney, Thomas (2008), “Distorted gravity: the intensive and extensive margins of international trade”, The
American Economic Review, vol. 98, No. 4 (September).
Cirera, Xavier, Anabel Marin, and Ricardo Markwald (2015), “Explaining export diversification through firm
innovation decisions: the case of Brazil”, Research Policy, vol. 44, No. 10 (December).
Eaton, Jonathan, Marcela Eslava, Maurice Kugler, and James R. Tybout (2007), “Export dynamics in Colombia:
firm-level evidence”, NBER Working Papers, No. 13531, National Bureau of Economic Research.
Evenett, Simon J, and Anthony J Venables (2002), “Export growth in developing countries: market entry and
bilateral trade flows”, Mimeo, London School of Economics.
Felbermayr, Gabriel J. and Wilhelm Kohler (2006), “Exploring the intensive and extensive margins of world
trade”, Review of World Economics, vol. 142, No. 4 (December).
Fernandes, Ana M., Daniel Lederman, and Mario Gutierrez-Rocha (2013), “Export entrepreneurship and trade
structure in Latin America during good and bad times”, Policy Research Working Paper, No. 6413,
World Bank.
Freund, Caroline, and Martha Denisse Pierola (2010), “Export entrepreneurs: evidence from Peru”, Policy
Research Working Paper, No. 5407, World Bank.
ECLAC - International Trade Series No. 140 Export innovation of SMEs through the extensive margin in Latin America
38
Frohmann, Alicia, Nanno Mulder, Ximena Olmos, and Roberto Urmeneta (2016), Internacionalización de las
pymes: Innavación para exportar [SMEs Internationalization: Export Innovation], United Nations,
Economic Commission for Latin America and the Caribbean, LC/W.719.
Gibson, Tom, and H. J. van der Vaart (2008), “Defining SMEs: a less imperfect way of defining small and
medium enterprises in developing countries”, Brookings Global Economy and Development.
Hausmann, Ricardo and Dani Rodrik (2003), “Economic development as self-discovery”, Journal of
Development Economics, vol. 72, No. 2 (December).
Helpman, Elhanan, Marc Melitz, and Yona Rubinstein (2008), “Estimating trade flows: trading partners and
trading volumes”, The Quarterly Journal of Economics, vol. 123, No. 2 (May).
Hummels, David, and Peter J Klenow (2005), “The variety and quality of a nation’s exports”, American
Economic Review, vol. 95, No. 3 (September).
Kaplan, E. L., and Paul Meier (1958). “Nonparametric estimation from incomplete Observations”, Journal of
the American Statistical Association, vol. 53, No. 282 (June).
Krugman, Paul (1980), “Scale economies, Product differentiation, and the pattern of trade”, American
Economic Review, vol. 70, No. 5 (December).
_____ (1981), “Intraindustry specialization and the gains from trade” Journal of Political Economy, vol. 89,
No. 5 (October).
Lederman, Daniel, Andrés Rodríguez-Clare, and Daniel Yi Xu (2011), “Entrepreneurship and the extensive
margin in export growth: a microeconomic accounting of Costa Rica’s export growth during 1997-
2007”, World Bank Economic Review, vol. 25, No. 3 (July).
Meersohn, Susana (2016), “Este es el ranking de las empresas que más exportaron el 2015 [This is the
ranking of the firms that exported the most in 2015]”, Areaminera Medios, 4 April,
www.aminera.com/2016/04/04/3025/ [accessed on 6 Feb 2018].
Melitz, Marc, J. (2003), “The impact of trade on intra-industry reallocations and aggregate industry
productivity”, Econometrica, vol. 71, no. 6 (November).
Nicita, Alessandro, Miho Shirotori, and Bolormaa Tumurchudur Klok (2013), “Survival analysis of the
exports of least developed countries: the role of comparative advantage”, Policy Issues in International
Trade and Commodities Study Series, No. 54. United Nations Conference on Trade and Development,
UNCTAD/ITCD/TAB/55.
OECD (Organisation for Economic Co-operation and Development) (2005), Oslo Manual, 3rd ed.
Organisation for Economic Co-operation and Development.
Reis, Jose Guilherme, and Thomas Farole (2012), Trade Competitiveness Diagnostic Toolkit. World Bank.
Silva, J.M.C. Santos, Silvana Tenreyro, and Kehai Wei (2014), “Estimating the extensive margin of trade”,
Journal of International Economics, vol. 93, no. 1 (May).
UNCTAD (United Nations Conference on Trade and Development) (2017), “Classiciations” [online]
http://unctadstat.unctad.org/EN/Classifications.html [accessed on 23 May 2017].
United Nations (2017), Statistical Database on Commodity Trade (COMTRADE)” [online].
Urmeneta, Roberto (2016), Metodología para comparar a las pymes exportadores en América Latina y el
Caribe [Methodology for comparing exporting SMEs in Latin America and the Caribbean]. Mimeo,
United Nations, Economic Commission for Latin America and the Caribbean.
World Bank (2017), “World Bank Open Data” [online] http://data.worldbank.org [accessed on 12 April 2017].

ECLAC - International Trade Series No. 140 Export innovation of SMEs through the extensive margin in Latin America
39
Series:
International Trade.
Issues published
A complete list as well as pdf files are available at
www.eclac.org/publicaciones
140. Export innovation of SMEs through the extensive margin in Latin America, Hyunju Park, Nanno Mulder, and
Yuri Park, (LC/TS.2018/72), 2018.
139. Beyond the copper sector: Chile’s engagement in international production networks, Dayna Zaclicever,
(LC/TS.2018/3), 2018.
138. La innovación exportadora en las pequeñas y medianas empresas. Programas de apoyo y financiamiento en
América Latina, Nanno Mulder y Andrea Pellandra, (LC/TS.2017/XX), 2017.
137. Trade integration and production sharing: A characterization of Latin American and Caribbean countries’
participation in regional and global value chains, Dayna Zaclicever, (LC/TS.2017/161), 2017
136. Use of knowledge-intensive services in the Chilean wine industry, Fulvia Farinelli, Karina Fernández-Stark, Javier
Meneses, Soledad Meneses, Nanno Mulder y Karim Reuse, (LC/TS.2017/147), 2017
135. Opciones para la convergencia entre la Alianza del Pacífico y el Mercado Común del Sur (MERCOSUR): la
regulación de la inversión extranjera directa, Sebastián Herreros y Tania García-Millán (LC/TS.2017/81), 2017.
134. Ajustes en producción y empleo ante choques de magnitud al comercio: evidencias al nivel de firmas en
Colombia, Lucas Navarro y Andrea Pellandra, (LC/TS.2017/79), 2017.
133. El impacto del comercio con China en los mercados laborales locales de Chile, Andrea Pellandra,
(LC/TS.2017/54), 2017.
132. Asia-Pacific and Latin America: dynamics of regional integration and international cooperation, Akio Hosono,
(LC/TS.2017/49), 2017.
131. La irrupción de China y su impacto sobre la estructura productiva y comercial en América Latina y el Caribe, José
Durán Lima y Andrea Pellandra, (LC/TS.2017/6), 2017.
130. El acuerdo de Asociación Transpacífico (TPP) y el agro, Daniela Alfaro, (LC/TS.2017/4), 2017.
129. Crisis y debates sobre globalización en Europa y Estados Unidos: implicancias para América Latina, Osvaldo
Rosales, (LC/L.4285), 2017.
128. The Pacific Alliance and its economic impact on regional trade and investment: evaluation and perspectives, José
Durán Lima and Daniel Cracau, (LC/L.4272), 2016.
127. Estimación de empleo directo e indirecto asociado a las exportaciones de Ecuador a la Unión Europea, José Durán
Lima y Sebastián Castresana, (LC/L.4264), 2016.
126. La participación de América Latina y el Caribe en el Mecanismo de Solución de Diferencias de la OMC,
Sebastián Herreros y Tania García-Millán, (LC/L.3967), 2015.

INTERNATIONAL TRADE
140
ECONOMIC COMMISSION FOR LATIN AMERICA AND THE CARIBBEAN
COMISIÓN ECONÓMICA PARA AMÉRICA LATINA Y EL CARIBE
www.eclac.org