Explosive Safety with Regards to Electrostatic Discharge
68
University of New Mexico UNM Digital Repository Electrical and Computer Engineering ETDs Engineering ETDs 7-12-2014 Explosive Safety with Regards to Electrostatic Discharge Francis Martinez Follow this and additional works at: hps://digitalrepository.unm.edu/ece_etds is esis is brought to you for free and open access by the Engineering ETDs at UNM Digital Repository. It has been accepted for inclusion in Electrical and Computer Engineering ETDs by an authorized administrator of UNM Digital Repository. For more information, please contact [email protected]. Recommended Citation Martinez, Francis. "Explosive Safety with Regards to Electrostatic Discharge." (2014). hps://digitalrepository.unm.edu/ece_etds/ 172
Transcript of Explosive Safety with Regards to Electrostatic Discharge
University of New MexicoUNM Digital Repository
Electrical and Computer Engineering ETDs Engineering ETDs
7-12-2014
Explosive Safety with Regards to ElectrostaticDischargeFrancis Martinez
Follow this and additional works at: https://digitalrepository.unm.edu/ece_etds
This Thesis is brought to you for free and open access by the Engineering ETDs at UNM Digital Repository. It has been accepted for inclusion inElectrical and Computer Engineering ETDs by an authorized administrator of UNM Digital Repository. For more information, please [email protected].
Recommended CitationMartinez, Francis. "Explosive Safety with Regards to Electrostatic Discharge." (2014). https://digitalrepository.unm.edu/ece_etds/172

i
Francis J. Martinez Candidate Electrical and Computer Engineering Department This thesis is approved, and it is acceptable in quality and form for publication: Approved by the Thesis Committee: Dr. Christos Christodoulou , Chairperson Dr. Mark Gilmore Dr. Youssef Tawk

ii
EXPLOSIVE SAFETY WITH REGARDS TO ELECTROSTATIC DISCHARGE
by
FRANCIS J. MARTINEZ
B.S. ELECTRICAL ENGINEERING NEW MEXICO INSTITUTE OF MINING AND TECHNOLOGY
2001
THESIS
Submitted in Partial Fulfillment of the Requirements for the Degree of
Master of Science
In Electrical Engineering
The University of New Mexico
Albuquerque, New Mexico
May 2014

iii
Dedication
To my beautiful and amazing wife, Alicia, and our perfect daughter, Isabella Alessandra and to our unborn child who we are excited to meet and the one that we never got to meet.
This was done out of love for all of you.

iv
Acknowledgements
Approximately 6 years ago, I met Dr. Christos Christodoulou on a collaborative project we were working on. He invited me to explore getting my Master’s in EE and he told me to call him whenever I decided to do it. A few years later, I called him and since then, he has helped guide and advise me through this journey. I would like to thank Dr. Christos Christodoulou for all the help he has provided me since the day he invited me to consider getting my MSEE. I would like to thank Dr. Mark Gilmore and Dr. Youssef Tawk for joining Dr. Christodoulou as my thesis committee members. I would like to thank Ms. Elymra Grelle for always graciously answering all my questions and helping me with just about everything related to my master’s studies. I would like to thank Mark Lieber, a coworker at LANL, who worked on homework with me for many long hours as I began my first college classes in over a decade. I would like to thank Dan Borovina, my previous group leader at LANL, for starting this process by asking me to consider getting my Master’s Degree and supporting me through the first half of this process. If it not for him, I would not be here today. I would like to thank my current group leader, David Montoya, for ensuring that my education was one of my top priorities and always ensuring that I had everything I needed to be successful. He, as well as Tom Stepan, Mike Butner, Arlan Swihart, and all my other coworkers in the W-10 group at LANL, have been more supportive than I could have imagined. I want to thank them all for their support, mentoring and patience. I especially would like to thank my Mom and Dad. My whole life, all they ever asked of me and my brother and sisters is that we always work as hard as we can. All my successes are because I have followed their advice. I want to thank my brother and sisters for always being supportive and loving in all of the things that I do and for always helping keep life fun and never too serious. I want to thank God for blessing me with all the people in my life who have supported me and for helping me with patience and strength throughout this journey. Lastly, but most importantly, I want to thank my amazing wife, Alicia, and perfect daughter, Isabella Alessandra for all their love, support, patience, and understanding these last two years. I would like to thank Isabella for sitting with me, drawing on paper, i.e., “doing her homework,” as I spent countless hours doing mine and by doing so, keeping me motivated to finish. Without the two of them, I would never have completed this journey. They are my inspiration.
v
EXPLOSIVE SAFETY WITH REGARDS TO ELECTROSTATIC DISCHARGE
LA-UR-14-21832
By
Francis J. Martinez, P.E.
B.S., Electrical Engineering, New Mexico Institute of Mining and Technology, 2001
M.S., Electrical Engineering, University of New Mexico, 2014
Abstract
Static charge is something that most individuals recognize as something that happens when
they walk across a carpet, touch their refrigerator and get shocked. Most people seldom
recognize that a shock due to static charge, or properly called, Electrostatic Discharge
(ESD) is a phenomenon that has significantly damaging effects. Most people who stay
informed of the current news, have heard stories of static charge causing a pump at a gas
station to start on fire. Some individuals may even recognize that when they change the
memory on a computer, they need to ensure that they are properly electrically grounded to
prevent damage to any of the sensitive electronic components within their computers.
However, it is unlikely that very many individuals would ever consider that an ESD event
may be significant enough to initiate an explosive material.
Explosives materials are materials that many people might recognize as susceptible to
initiation due to mechanical insults. Plastic and foam materials are often used to protect
explosives. Unfortunately, often many of these materials are dielectric materials which
are susceptible to triboelectric charge transfer, or build-up of static charge, and thus,
vi
become a potential hazardous electrical source that may cause the explosive to
inadvertently initiate.
To eliminate the generation of static electricity, it is important to understand the methods
in which static electricity is generated on these types of materials. If the method of
triboelectric charge transfer is understood, it is possible to minimize the effects to ensure
that the device that is designed to prevent mechanical insults to the explosive materials
does not become its greatest electrical insult. Once the method of charge transfer is
understood, a potential method of charge removal might be possible to ensure that
explosive devices are protected from both mechanical and electrical insults.

vii
TABLE OF CONTENTS
LIST OF FIGURES ......................................................................................................... ix
LIST OF TABLES ............................................................................................................ x
CHAPTER 1: INTRODUCTION .................................................................................... 1
1.1 Mechanical Safety of Explosives – Dielectric Materials .......................................... 1
1.2 Explosive Assemblies and Electrostatic Discharge .................................................. 5
1.3 Influence of Surface Resistivity ................................................................................ 8
1.4 Example of a Potentially ESD-initiated Explosive Incident [17] ........................... 10
1.5 Thesis Overview ...................................................................................................... 11
CHAPTER 2: Methods of addressing the problems ................................................... 12
2.1 Proposed Analysis Method...................................................................................... 12
2.2 Understanding Surface Resistivity .......................................................................... 20
2.2.1 Surface Resistivity Experiment ........................................................................ 21
2.3 Charge Generation and the Electric Field ............................................................... 24
2.3.1 Experiment 1: Triboelectric Charging .............................................................. 28
2.3.2 Experiment 2: Drill Experiment ....................................................................... 33
2.3.3 Experiment 3: Aggressive Charging................................................................. 37
CHAPTER 3: SURFACE CHARGE REMOVAL ...................................................... 40
3.1 Brush Experiment .................................................................................................... 40
CHAPTER 4: DISCUSSION OF RESULTS ............................................................... 47
4.1 Analysis Performed ................................................................................................. 47

viii
4.2 Surface Resistivity Versus Triboelectric Effect ...................................................... 47
4.3 Surface Charge Removal Tool ................................................................................ 50
CHAPTER 5: FUTURE WORK ................................................................................... 53
LIST OF REFERENCES ............................................................................................... 55

ix
LIST OF FIGURES
Figure 1 - Triboelectric Series [7] ....................................................................................... 4
Figure 2 - Teledyne, RISI, Incorporated, RP-1 EBW [9] ................................................... 6
Figure 3 -Calibration Curve – Surface Resistivity Meter ................................................. 22
Figure 4 - Calibration Curve - Electric Field Meter ......................................................... 25
Figure 5 - Electric Field Meter Configuration .................................................................. 26
Figure 6 - Experiment 1 Test Configuration ..................................................................... 27
Figure 7 - Experiment 1: Lexan Triboelectric Effects Plot ............................................... 30
Figure 8 -Experiment 1: Maximum Electric Field Change .............................................. 31
Figure 9 - Experiment 1: Maximum Percentage Electric Field Change ........................... 32
Figure 10 - Experiment 2: Maximum Electric Field Change ........................................... 35
Figure 11 - Experiment 2: Maximum Electric Field Percentage Change ......................... 36
Figure 12 - Experiment 3: Maximum Electric Field Change ........................................... 38
Figure 13 - Experiment 3: Maximum Electric Field Percentage Change ......................... 39
Figure 14 - Surface Charge Removal - Percentage Electric Field Reduction ................... 43
Figure 15 - Surface Charge Removal - Conductive Brush with Drain ............................. 45
Figure 16 - Maximum/Minimum E-field Reduction Versus Brush Configuration .......... 51

x
LIST OF TABLES
Table 1 – ESD Categorization Table .................................................................................. 9
Table 2 - Test Material Resistance Values ....................................................................... 23
Table 3 - Surface Charge Removal - Brush Configurations ............................................. 42
1
CHAPTER 1: INTRODUCTION
1.1 Mechanical Safety of Explosives – Dielectric Materials
For organizations who work with or process explosive materials, great attention is spent
ensuring that the explosives are protected in a manner to ensure that they do not
inadvertently initiate. Organizations that perform explosive experimental tests may be
protecting an experimental assembly that contains not only explosives but may also
contain a detonator on the experiment. When designing explosive materials, the main
explosive charge is designed to be the least likely explosive to initiate to ensure that it does
not unexpectedly initiate. However, when designing detonators, much more sensitive
explosives are utilized to ensure a reliable initiation of the main explosive [1].
Therefore, when explosive materials and explosive experimental assemblies are packaged
either for storage or transportation, protecting them against mechanical insults is very
important due to their sensitivity to mechanical insults. When explosive devices are
packaged or put in a configuration to protect them against mechanical insults, materials
with very good shock absorbing properties are utilized.
Consider the fact that when individuals purchase items that are to be shipped to their home,
StyrofoamTM is often used. StyrofoamTM is one of the most common materials used to
ensure that packaged materials are mechanically protected. Most individuals are familiar
with the StyrofoamTM “packing peanuts” that are used in packaging to protect their items
from drops or other mechanical insults.

2
Consider the material properties of typical packaging materials. Most often, materials that
are foams and/or plastics are utilized when things are packaged to be protected against
mechanical insults. If the material properties of these items are considered, it can be noted
that these materials are, when considering electrical properties, insulators. Not only are
these items insulators, but most of them are considered to be dielectrics.
Dielectric materials are materials that are a group of electrical insulators that are prone to
being polarized when an electric field is applied to them [2]. As dielectric materials are
insulators and insulators have a high surface resistivity, when an electric charge is
developed on the surface of a dielectric material, the charge is not uniformly distributed
across the surface as it is in a conductor. The electric charge can be localized to a specific
location upon the dielectric surface. Due to the high surface resistivity, the surface charge
is also unlikely to “drain” off of the surface. Therefore, it is difficult to calculate or analyze
the specific electric charge that may be generated on a dielectric surface.
Because of their high surface resistance and high permittivity, a dielectric material is also
prone to triboelectric effects. Webster’s dictionary defines triboelectricity as a charge of
electricity generated by friction [3]. When the two materials are placed in contact with one
another and then separated, negatively charged electrons are transferred from the surface of
one material to the surface of the other material [4]. Which material loses electrons and
which gains electrons will depend on the nature of the two materials. The material that
loses electrons becomes positively charged, while the material that gains electrons is

3
negatively charged.
The triboelectric effect is often referred to as triboelectric charging. However, charge is
actually transferred from one material to the other. The result is a positively or negatively
charged surface but the process will be referred to as triboelectric charge transfer
throughout this document as it is a more accurate description.
When a charged material is brought near another material that is of a different charge
potential, the effect can often be seen as a spark, or arc, jumping between the two materials.
The arc is the evidence that the voltage potential was great enough to breakdown the
dielectric strength, or ability to stand-off voltage, of the air [5].
The amount of charge transferred by the triboelectric effect is affected by a number of
items including the speed at which the items are rubbed against one another, the
temperature, the humidity and the surface area that was contacted [6]. Some of the primary
factors that affect the charge transfer are the material properties of the two materials and
where they are found in the triboelectric series.
The triboelectric series is a table that lists common materials that may undergo triboelectric
charge transfer and ranks them on a list [7]. This list is a relative ranking of how likely a
material is to be positively or negatively charged during a triboelectric charge transfer.
When two materials are rubbed together, the material that is closer to the top of the
triboelectric series will take on a positive charge while the second material will take on a

4
negative charge. The further apart the two materials are in the triboelectric series, the
greater the magnitude of the charge transfer due to the triboelectric effect can be. An
example of a triboelectric series table can be found in Figure 1. The charge generated by
the triboelectric effect can be extremely high as a carpet shock can often reach voltages of
up to 25,000 volts [8].
Figure 1 - Triboelectric Series [7]

5
The transfer of the surface charge energy from a triboelectrically charged surface to
another is most commonly known as static shock; appropriately defined as electrostatic
discharge (ESD). ESD can be simply defined as the transfer of electrons from two sources
that have differing electrical potentials [1]. ESD most often occurs when two items pass by
one another or brush up against one another and a transfer of electrons occurs. For
example, an individual shuffling his/her feet across the carpet causes the electrons from the
carpet to be transferred to the individual’s feet and thus, his/her electrical potential
changes. When the charged individual comes up to something that is grounded or at a
different voltage potential, the energy is transferred in the form of a static shock.
Consider the StyrofoamTM example once again. Although StyrofoamTM makes a good
material to protect mechanically sensitive items, it is also susceptible to the triboelectric
effect. One example of this phenomenon is to consider the StyrofoamTM packing
peanuts example again. Any individual who has received a package with something
fragile, is not only familiar with the StyrofoamTM packing peanuts, but also how likely
they are to stick to clothing. This is due to the high static field that is generated by the
packing peanuts rubbing against one another.
1.2 Explosive Assemblies and Electrostatic Discharge
Is it possible that when protecting explosives against mechanical insult, a potential
electrical insult may be introduced to the explosive assembly? An experimental
explosive assembly is comprised of a main explosive, which is typically considered to be
an insensitive explosive, which is initiated by some type of detonator. The explosive

6
material used in a detonator is considered to be a “sensitive explosive” and thus, is more
susceptible to unwanted initiations due to a variety of insults. Consider the following
commercially available detonator which is manufactured by Teledyne, RISI, Incorporated.
Figure 2 - Teledyne, RISI, Incorporated, RP-1 EBW [9]
This type of detonator is called an Exploding Bridgewire (EBW). The general method in
which an EBW works is a large amount of current is provided to the bridgewire in a short
period of time [10]. The rapid discharge of electrical energy will vaporize the bridgewire to
directly initiate a primary explosive, or PETN in the case of RP-1. A primary explosive is
an explosive that is considered to be a more sensitive explosive and thus, more likely to
inadvertently initiate due to unwanted insults. The initiating explosive then initiates the
high density explosive, or RDX in the case of the RP-1, which in turn initiates the
explosive assembly.
Consider the fact that the initiating explosive in the Teledyne RP-1 EBW detonator is
PETN. When the bridgewire vaporizes, it generates a shock wave which causes the

7
explosive within the detonator to initiate [10]. A secondary initiation method may exist.
Consider a situation, where an unexpected source of electrical energy, like ESD, could be
applied to the detonator and would allow current to flow through the bridgewire. The
amount of current may not be enough to vaporize the bridgewire to initiate the explosive.
However, as current flows through the bridgewire, its temperature rises. If the temperature
was to get high enough, could it cause the explosive material within the detonator to initiate
due to the thermal response of the bridgewire?
Every explosive has an autoignition temperature which is defined as the temperature above
which the self-heating of an explosive causes a runaway reaction [11]. Above that
temperature, the explosive generates its own energy and initiates. For the PETN used in
this EBW, the autoignition temperature is documented to be 190° C [12]. Based off the
mass of the bridgewire, the bridgewire material and knowing the autoignition temperature,
it is possible to calculate the amount of energy it will take to cause the detonator to initiate.
To ensure a safety margin, an analysis can be done by assuming 50% the autoignition
temperature. Thus, rather than evaluating against the 190 °C threshold, half of that, or
95°C would be the temperature to evaluate against. The reason for evaluating against a
50% autoignition temperature is to ensure a conservative and thus, safe, analysis.
For the RP-1 EBW, the manufacturer has not made the bridgewire information available as
it is proprietary. If the bridgewire information had been available for the RP-1 detonator,
8
that information would have allowed for a calculation of the energy threshold of the
detonator. However, further research identified a different EBW, which also uses PETN,
with a documented energy threshold of 32.6 milliJoules (mJ) [13]. Thus, the 32.6mJ
information will be used for the analysis which will be performed in Chapter 2.
The analysis will allow for an evaluation to determine if a theoretical dielectric surface
will cause the detonator to initiate, thus causing the secondary explosive to initiate as
well. However, it is also important to understand some of the materials properties of
dielectric materials that may influence the ability of a material to undergo the
triboelectric effect. If these properties are understood, it might be possible to use other
materials or influence the design of materials to limit how much the triboelectric effect
impacts them.
1.3 Influence of Surface Resistivity
The surface resistance of a material may affect the charge generation due to the
triboelectric effect. The surface resistance of a material is the resistance of the flow of
electrical current across the surface of the material. Volume resistance is the resistance
to flow of current through the three-dimensional volume of the material [14]. Static
electricity is considered to be primarily a phenomenon that happens on the surface of a
material. Therefore, only surface resistance will be considered for this thesis. Note that
the units of surface resistance are expressed as ohms/square (Ω/) to differentiate from
the volume resistivity of a material [14].

9
The surface resistance of a material is defined as the ratio of the DC voltage to the
current flowing between two electrodes which are in contact with the same side of a
material [14]. Note that this is different from the general concept of resistance which
measures through a material. Because of the high resistivity, the surface resistance is
measured across the surface rather than through the material.
As the intent of studying the surface resistance of a material is to determine its influence
on the triboelectric effect, it is important to recognize that the surface resistance is used
to evaluate a material’s static properties [15]. When considering tools or materials to be
used when static charge is to be considered, materials are defined as isolative, antistatic,
static dissipative, resistive and conductive relative to their surface resistance as can be
seen on Table 1[15].
ESD Categorization Surface Resistivity (ohms/square)
Antistatic 109-1012
Static Dissipative 106-109
Conductive 103-106
Table 1 – ESD Categorization Table
The surface resistance of a material affects the ability for a surface to distribute surface
charge and also drain the charge. Therefore, it seems reasonable to assume that the surface
resistance may influence the ability for a material to transfer charge. As documented in the
table above, the electrical resistance of a material is used to evaluate its electrostatic
10
properties. The question that arises is whether or not the surface resistivity is correlated
with the ability to undergo triboelectrification [16].
1.4 Example of a Potentially ESD-initiated Explosive Incident [17]
On October 9, 2008, a group of experimenters were setting up an experiment at Sandia
National Laboratories in Albuquerque, NM. The experimental assembly consisted of an
experimental package on a rocket sled. The rocket sled utilized rocket motors to propel the
experimental assembly along a sled track. The rocket motors utilized an accelerant that
would burn and push the rocket sled forward. The accelerant is designed to be relatively
insensitive and thus, utilized an initiating device, or initiator, to initiate the rocket motor.
The initiator that was utilized was equivalent to an EBW [17].
At some point in the process, a technician began to install a plug type device on a connector
that interfaces to the initiator. At that point, the rocket motor initiated and the rocket sled
was propelled forward. A number of the involved experimenters suffered burns, broken
bones, and damaged hearing. A variety of potential reasons for the inadvertent initiation
was investigated including the possibility that the initiator was inadvertently initiated due
to ESD.

11
1.5 Thesis Overview
This thesis will examine the potential issues that must be considered when using dielectric
materials to protect explosive materials against mechanical insults. A potential method for
a mathematical analysis will be evaluated. In addition, the relationship between the surface
resistivity of a material and its ability to transfer charge via the triboelectric effect will be
explored. Finally, a method for a reliable and consistent removal of surface charge will be
explored. The complete evaluation will allow for a better understanding of analysis,
material design for minimizing surface charge transfer and a method to remove any
subsequent surface charge to ensure safety between explosives and dielectric materials.
12
CHAPTER 2: Methods of addressing the problems
2.1 Proposed Analysis Method
If one was to consider an explosive material and mechanically protective barrier made out
of dielectric material, the protective barrier must be considered as a potential source of
electrical energy, ESD, to initiate the explosive. It is also important to consider that the
explosive is also a dielectric and thus, the potential for triboelectric charge transfer is great.
Because of the difficulty in knowing how much surface charge might develop, it is
important to take a conservative approach to analyze how much potential energy might be
stored on the dielectric material.
One method of analysis for this problem is to evaluate the ESD source and its energy level
to determine if the maximum potential ESD energy of the material is high enough to
initiate the explosive assembly.
Because the initiation threshold value of the explosives and detonators is well
characterized, it provides a level to evaluate against to determine if an ESD insult can
initiate the explosive assembly. For the purpose of this evaluation, the commercial
detonator threshold value is 32.6 mJ. Thus, it is possible to evaluate the maximum amount
of electrical energy that a theoretical dielectric can deliver to the explosive to evaluate if
that energy level is enough to cause the detonator and thus, the explosive assembly to
initiate.
To begin this analysis, it is important to determine what information is known about the
13
insulator. Consider the fact that the only information that is known and well-defined about
the dielectric material is its surface area. With this information alone, the analysis must be
performed.
The electric field on a material can increase to some maximum level. Once that level is
reached, if a single electron was to be imparted onto the charged material, one electron
would have to be “kicked-off.” The surface electric field cannot get any higher at that
point. Consider the fact that the universally accepted maximum electric field predicted on
an insulator is 30kV/cm due to the breakdown strength of air [18].
The surface electric field on a conductor can be assumed to be uniform on the entire surface
of the conductor because the relatively low resistivity allows the electrons to flow freely
and evenly distribute across the surface area of the conductor. However, the surface
electric field on a dielectric material is not uniform. Because of the relatively high
resistivity of the material, the electrons have a difficult time flowing across the surface.
This phenomenon creates varying pockets of charge across the surface of the dielectric
material. If an electric field meter was to be used to measure the electric field on a
dielectric material, two measurements that were taken at two locations that are physically
located near one another, might measure values that can be orders of magnitude different.
If the maximum surface electric field was known or could be assumed for the dielectric
material, it would be possible to use some first-principle electrical engineering equations to
work towards calculating the maximum energy that could be delivered to the explosive

14
assembly by the dielectric material. Once that energy is determined, it is possible to
evaluate it against the known initiation thresholds of the detonators and explosives.
However, without the ability to assume a realistic electric field on the dielectric material, it
seems difficult to perform an analysis.
Considering that the analysis must be conservative, it is possible to make some extremely
unusual assumptions that allow for the maximum energy of the dielectric material to be
calculated:
Assume that the dielectric material can have a uniform electric field; consider the dielectric
material behaves like a conductor.
This radical assumption implies that a 30kv/cm maximum surface electric field is
uniformly distributed on the entire surface of the dielectric material. This assumption of a
uniform 30kv/cm is enough information to begin to utilize mathematical analysis to
calculate the maximum energy that can be stored by the dielectric material.
Because the autoignition temperature and initiation threshold energy for the detonator is
known, if some lesser threshold energy level is evaluated against, for example, 50% of the
initiation energy, it is possible to try to protect the detonator against an energy level that is
high enough to cause it to initiate.
Also note that another level of conservatism exists with the assumption that the dielectric
15
material behaves like a conductor. When a charged dielectric material is brought near to a
second material and a triboelectric charge transfer takes place, the transfer of electrons is
limited to the surface area on the charged dielectric material that is exposed to the second
material. The discharge is usually in the form of a brush discharge which distributes much
less energy than a static discharge which is formed when a conductor discharges energy
[19].
When a conductor is brought up to a second material, all the charge on the surface will be
transferred. The assumption that the dielectric material behaves like a conductor also
means that all the surface charge that is collected on the surface of the dielectric material
will be transferred to the detonator for this analysis. Due to the high surface resistivity of
dielectric materials, this assumption is not very plausible but is highly conservative.
Therefore, this is the assumption that has been made for a worst case scenario.
For the purpose of this analysis, a surface area will be assumed to allow a theoretical
analysis to be performed. Assume the total surface area of the explosive protective cover is
1000 cm2, approximately 12” x 12” surface. In addition, assume that the electric field on
the entire dielectric surface is 30kV/cm. Utilizing those two pieces of information and
beginning with Gauss’s law, it is possible to begin the analysis.

16
If it is assumed that a dielectric material which is charged is approaching a second
conductive surface, the electric field can be calculated by dividing the surface charge
density by twice the free space permittivity, or 8.854x10⁻¹² F/m. Note the factor of two
accounts for electric field radiating from both surfaces of the dielectric. The equation can
be rearranged to solve for sigma:
Populating the equation with the values available gives:
The solution is the surface charge density, σ, on the dielectric material is 5.3 x 10⁻⁹
coulombs/cm2.
Utilizing this result for σ and the assumed surface area of 1000cm2, it is possible to utilize
the following equation which calculates charge, q:
The populated equation is:
The solution for charge, q, is 5.3x10⁻⁶ Coulombs.
Or
17
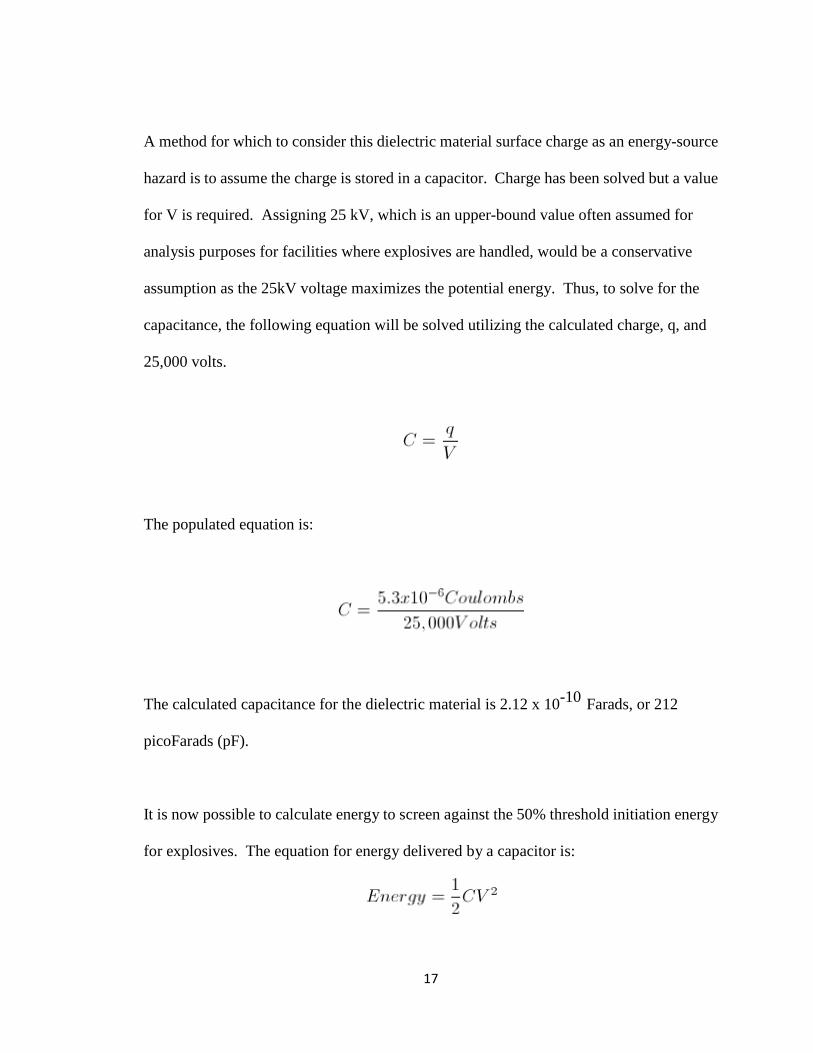
A method for which to consider this dielectric material surface charge as an energy-source
hazard is to assume the charge is stored in a capacitor. Charge has been solved but a value
for V is required. Assigning 25 kV, which is an upper-bound value often assumed for
analysis purposes for facilities where explosives are handled, would be a conservative
assumption as the 25kV voltage maximizes the potential energy. Thus, to solve for the
capacitance, the following equation will be solved utilizing the calculated charge, q, and
25,000 volts.
The populated equation is:
The calculated capacitance for the dielectric material is 2.12 x 10⁻¹⁰ Farads, or 212
picoFarads (pF).
It is now possible to calculate energy to screen against the 50% threshold initiation energy
for explosives. The equation for energy delivered by a capacitor is:

18
Explosive facilities within the Department of Energy (DOE) Weapons Complex have their
voltage distributions characterized to ensure a safe working environment within the
facility. These environments may range from an “uncontrolled voltage distribution”, a
theoretical 25,000 volts, to a voltage threshold as low as 100 volts in a facility that tries to
control ESD. Utilizing the highest voltage within the voltage distribution and the
capacitance that has been calculated, it is possible to calculate the energy that can be stored
by the dielectric material. Once that energy is calculated, it can be evaluated against the
threshold energy for the detonator.
A maximum voltage of 25,000 volts will be utilized for the purpose of this analysis to
evaluate against a worst case scenario. This allows for the maximum possible energy
stored by the dielectric material to be delivered to the explosive assembly.
Solving the equation for energy gives a conservative result because a lossless charge
transfer is assumed. The resulting 66.25 MilliJoules (mJ) of energy is the maximum
amount of energy that can be stored by the dielectric material and thus, the maximum
amount of energy that can be delivered from the dielectric material to the detonator.
As noted earlier, the initiation threshold energy for an EBW is 32.6mJ. Thus, based off the
assumptions that were discussed, the size of the dielectric material and the assumed
maximum electric field, the EBW would initiate, thus causing any attached explosive to

19
initiate. In addition, even if the conservative assumption of 50% was not considered, if the
32.6mJ was doubled, 65.2mJ, the conservative analysis would predict that the detonator
would still initiate.
One must recognize that, due to the limited information available on the dielectric material
in question and all the conservative assumptions made, the analysis determines that the
detonator could detonate. However, because the analysis is conservative, it would have a
high probability of ensuring the prevention of an inadvertent initiation of the explosive
assembly. Realistically, when considering the results of the theoretical analysis, assuming
utilizing a dielectric material less than 1000 cm2 (12” x 12”) is not very realistic as this is a
relatively small surface when attempting to protect large explosive charges. Knowing the
threshold energy of the detonator, one could calculate the maximum surface area instead.
However, the solution would, once again, be extremely conservative and would solve for a
surface area that is too small to be realistically implemented to protect against mechanical
insults.
Although these conservative analyses are often accepted by organizations like the DOE
Weapons Complex and other organizations who are working with explosives to ensure the
safety of workers, the conservative values prove costly and difficult to implement. For
example, if a room where explosives are processed had conductive floors, metal tools,
conductive wrist straps, etc., it is would help minimize voltage potentials but it would still
be difficult to guarantee that the potential for ESD is really being limited to a level below
the analytical initiation threshold level. In addition, these engineering controls could be

20
extremely costly. An understanding of the material properties that might affect the charge
transfer due to the triboelectric effect might allow for a design change of the materials to
help reduce the assumed electric field values used in the analysis.
2.2 Understanding Surface Resistivity
A literature review illustrates that there are questions on whether or not the surface
resistance influences the triboelectric effect. There are a variety of material properties that
must be considered when understanding the propensity of a material to undergo the
triboelectric effect. Some of these material properties include the smoothness or roughness
of the surface, how contaminated the surface is, the material’s ability to absorb water,
surface resistivity, etc. The intent of this experiment is to focus only on how the surface
resistivity may affect the triboelectric process.
The ability of the surface resistivity to affect the triboelectric process intuitively seems like
it may be an easy answer to determine. A series of experiments with a variety of materials
was performed for the Kennedy Space Center [20]. The experimenters concluded that the
surface resistivity and the triboelectric charge generation tendencies of materials are not
related to each other [20]. However, there have also been studies that have found the
ability to correlate the relationship to be difficult because of the number of variables that
affect the triboelectric charge transfer process [21].
To study the relationship between surface resistivity and triboelectrification, two important
measurements must be taken. The surface resistivity of the material must be measured. In

21
addition, because of the linear relationship between surface charge and the electric field,
the electric field of the dielectric material must be measured before and after a material
undergoes triboelectrification.
2.2.1 Surface Resistivity Experiment
An experiment was performed to determine the surface resistivity of a variety of materials.
Standard ESD-ADV53.1 was used to design the experiment. An EMIT 50557 surface
resistance test kit was used to measure the surface resistivity of the different materials. The
test kit is designed to take measurements for a variety of surface resistance standards as
documented in numerous ANSI standards. In addition, the test kit was also calibrated by a
National Institute of Standards and Technology (NIST) and American Association for
Laboratory Accreditation (A2LA) approved calibration laboratory and was within its
calibration date during the time that the experiments were performed.

22
Figure 3 -Calibration Curve – Surface Resistivity Meter
As per ESD-ADV53.1, the experiment utilized two 5 pound electrodes which were placed
10” apart [22]. The surface resistance test kit also provided the proper electrification
period of 15 seconds per ANSI/ESD 4.1. After numerous readings and calculations are
executed, the meter displays the surface resistance mantissa measurement rather than an
instantaneous measurement like many meters [22].
Each material type was tested 3 times minimum and then an average surface resistivity was
calculated. As per ANSI/ESD S4.1, the electrodes were cleaned with a minimum 70%
isopropanol/-water solution in between each measurement. In addition, each of the
1.00E+00
1.00E+02
1.00E+04
1.00E+06
1.00E+08
1.00E+10
1.00E+12
1.00E+00 1.00E+02 1.00E+04 1.00E+06 1.00E+08 1.00E+10 1.00E+12
Mea
sure
d R
esis
tanc
e (o
hms/s
quar
e)
Calibrated Resistance Source (ohms/square)
Calibration Curve (Surface Resistivity Meter)
23
materials tested was also cleaned with a minimum 70% isopropanol-water solution to
ensure that surface contaminants did not cause errors in the surface resistivity
measurements.
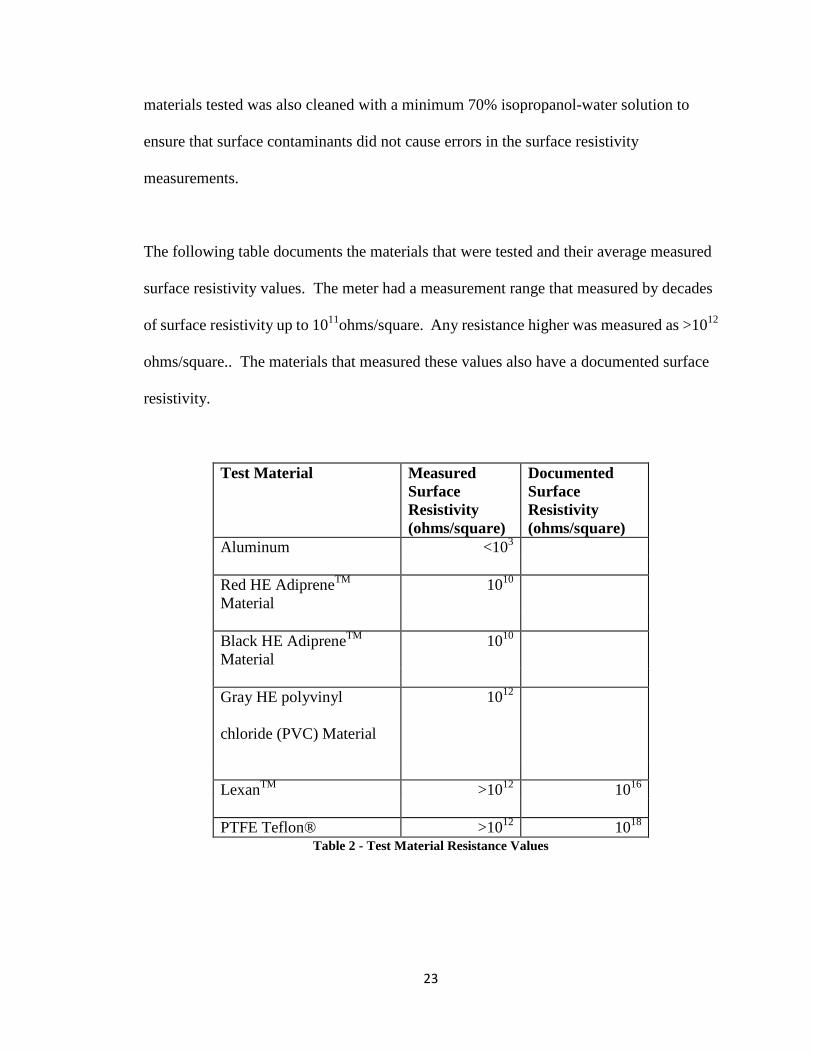
The following table documents the materials that were tested and their average measured
surface resistivity values. The meter had a measurement range that measured by decades
of surface resistivity up to 1011ohms/square. Any resistance higher was measured as >1012
ohms/square.. The materials that measured these values also have a documented surface
resistivity.
Test Material Measured Surface Resistivity (ohms/square)
Documented Surface Resistivity (ohms/square)
Aluminum <103
Red HE AdipreneTM Material
1010
Black HE AdipreneTM Material
1010
Gray HE polyvinyl
chloride (PVC) Material
1012
LexanTM >1012 1016
PTFE Teflon® >1012 1018
Table 2 - Test Material Resistance Values

24
The Red HE AdipreneTM, Black HE AdipreneTM and Gray HE PVC materials were chosen
as they are materials that are currently used within the DOE Weapons Complex for the
mechanical protection of explosive assemblies. The selection of LexanTM, Teflon® and
Aluminum allowed for additional materials to be tested with varying surface resistivity
values.
Once the surface resistivity values of the different materials were measured, a series of
experiments were performed to characterize the ability for each of the materials to undergo
the triboelectric effect. There are a variety of different variables that will affect the
triboelectric effect and thus, an effort was made to control as many variables as possible.
Primarily, the temperature, humidity, friction force between the two materials and speed at
which they were rubbed together were controlled.
The temperature and humidity were controlled to be 68.2-69.1 °F and 15.6-16.1% RH,
respectively. The friction force between the two materials and speed at which they were
rubbed together was controlled by the design of the experiment which is discussed later in
the document.
2.3 Charge Generation and the Electric Field
A Simco FMX-003 electric field meter was used to measure the surface electric field that
was generated on the different materials when manipulating them. The electric field meter
was calibrated by a NIST and A2LA approved calibration laboratory and was within its
calibration date during the time that the experiments were performed.

25
Figure 4 - Calibration Curve - Electric Field Meter
The manufacturer states that the electric field meter must maintain a distance of 1” from the
surface which is being measured. A clamp was utilized to maintain the 1” required
measurement distance. The clamp was installed on a track which allowed for a linear and
controlled movement of the electric field meter. This allowed for a series of measurements
to be made along an equally spaced linear section of the dielectric to be tested. The track
also allowed for a controlled electric field measurement to be made before and after the
dielectric was manipulated to undergo triboelectrification. A series of marks along a
straight line parallel to the track were made as reference points to ensure the controlled
placement of the electrostatic field measurements. The electric field meter, the clamp and
0.1
1
10
100
1000
10000
1 10 100 1000 10000
Mea
sure
d V
olta
ge (v
olts
)
Calibrated Voltage Source (volts)
Calibration curve - Electric Field Meter

26
the track can be seen in Figure 5.
Figure 5 - Electric Field Meter Configuration
A critical requirement to making accurate electric field measurements on charged
dielectric materials to ensure data integrity for a valid charge transfer comparison is to
maintain a consistent method for charge transfer. Relevant research details a variety of
“charging methods” some of which include manual manipulation of dielectric materials
with rabbit fur and others which use wheels that have rabbit fur which are spun against the
dielectric surface at a controlled rate for a specified length of time. A significant effort was
made to ensure that the method of triboelectric charging was consistent from one dielectric
material to another.
27
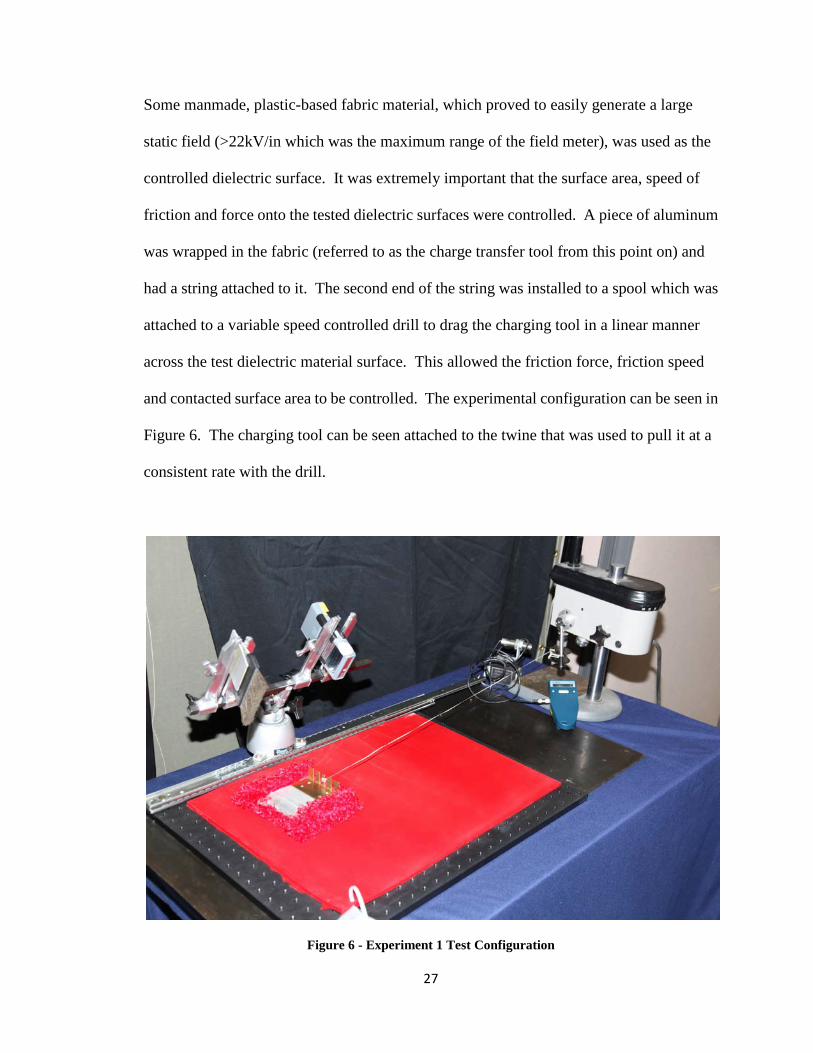
Some manmade, plastic-based fabric material, which proved to easily generate a large
static field (>22kV/in which was the maximum range of the field meter), was used as the
controlled dielectric surface. It was extremely important that the surface area, speed of
friction and force onto the tested dielectric surfaces were controlled. A piece of aluminum
was wrapped in the fabric (referred to as the charge transfer tool from this point on) and
had a string attached to it. The second end of the string was installed to a spool which was
attached to a variable speed controlled drill to drag the charging tool in a linear manner
across the test dielectric material surface. This allowed the friction force, friction speed
and contacted surface area to be controlled. The experimental configuration can be seen in
Figure 6. The charging tool can be seen attached to the twine that was used to pull it at a
consistent rate with the drill.
Figure 6 - Experiment 1 Test Configuration

28
Prior to each experiment on the test dielectric surface, an attempt was made to remove all
possible surface charge from the test dielectric surface. A conductive brush, which will be
described at a later section, was used to remove as much surface charge as possible. The
EMF meter was used to measure the electric field on the surface of the dielectric material at
points that were on a straight line at 2” spacing.
During the first set of experiments, it was determined that additional experiments might be
necessary to ensure there was enough data to develop conclusions. All three charge
transfer experimental series that were performed will be discussed.
2.3.1 Experiment 1: Triboelectric Charging
The first series of charge transfer experiments utilized the triboelectric charge transfer
method that was described above. Each material was tested with the charge transfer tool.
As noted, a conductive brush was utilized to remove all possible surface charge. A series
of 6 voltages separated by a linear distance of 2” each was measured. The charge transfer
tool was then dragged across the surface of the material. The 6 voltages were measured
again. This process was performed a total of 4 times for each test material, measuring the
voltages at 6 points each time. The conductive brush was only utilized prior to dragging
the charge generation tool across the surface the first time. It was not used again for each
material after the surface was charged as an incremental increase in the electric field was
expected. Thus, a series of increasing electric field measurements was recorded for each
test material.

29
To ensure this document was readable and ensure that the data was not overwhelming and
difficult to interpret, the data was displayed using charts and tables in this document to
draw conclusions. In addition, as total charge transfer was the focus of the study, all
electric field voltage values and percentages displayed are the absolute value of the values
measured as the sign of the charge is not of concern for this study. The voltages measured
were sometimes positive and sometimes negative but are always displayed as positive in all
the comparison charts and tables.
The starting electric field of all the materials must also be considered. Many of the
materials maintained a relatively significant electric field even after the charge was
removed using the conductive brush.
To ensure a convenient method to interpret the data, all plots and graphs will place the
lowest resistance material to the left increasing to the right. This will allow a direct
comparison from chart to chart to make the data easy to interpret.
Figure 7 is an example of the increasing electric field measurements that were measured at
the 6 locations on the dielectric materials. The test material in the plot below was Lexan®
and was chosen as the example because its effects of triboelectrification were significant.

30
Figure 7 - Experiment 1: Lexan Triboelectric Effects Plot
The following figure displays the maximum charge transfer in kilovolts and percentage
relative to the starting electric field that occurred after dragging the charge transfer device
across the materials for a total of 4 passes.
Lexan triboelectric effects
0
0.5
1
1.5
2
2.5
3
3.5
4
4.5
Starting Voltage First sweep Second sweep Third sweep Fourth sweep
Number of sweeps with charging tool
kilo
volts
/in
E-field Pt 1E-field Pt 2E-field Pt 3E-field Pt 4E-field Pt 5E-field Pt 6
31
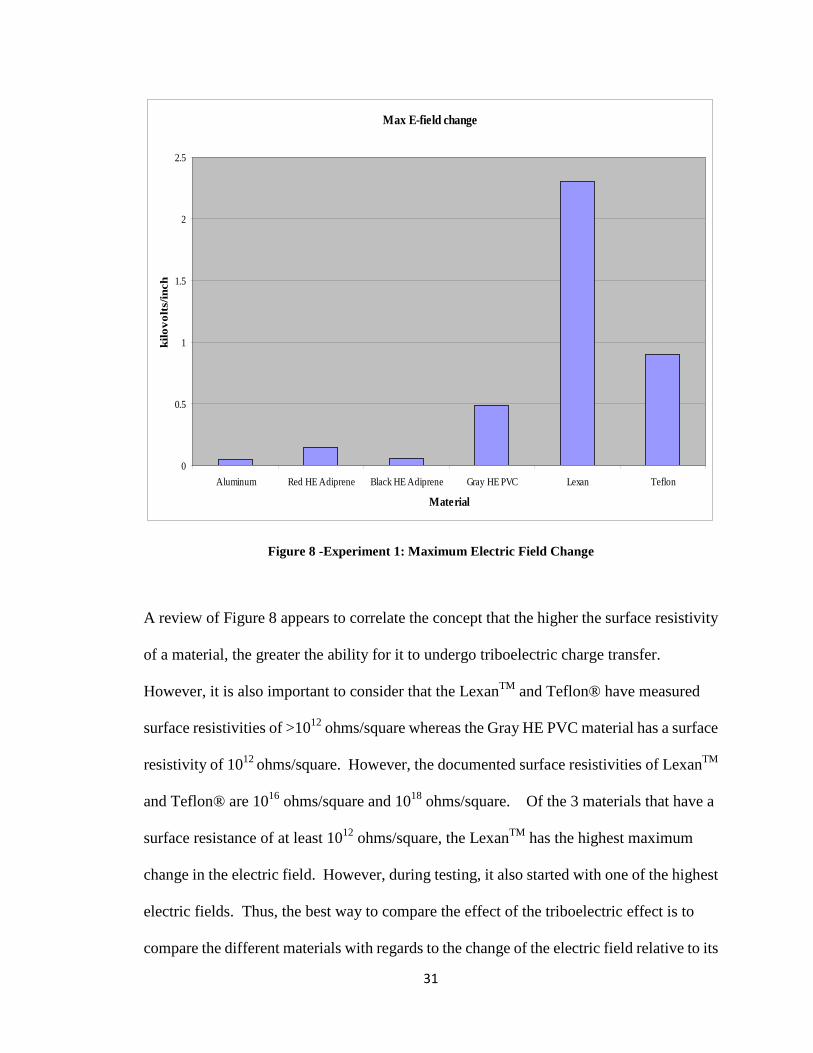
Figure 8 -Experiment 1: Maximum Electric Field Change
A review of Figure 8 appears to correlate the concept that the higher the surface resistivity
of a material, the greater the ability for it to undergo triboelectric charge transfer.
However, it is also important to consider that the LexanTM and Teflon® have measured
surface resistivities of >1012 ohms/square whereas the Gray HE PVC material has a surface
resistivity of 1012 ohms/square. However, the documented surface resistivities of LexanTM
and Teflon® are 1016 ohms/square and 1018 ohms/square. Of the 3 materials that have a
surface resistance of at least 1012 ohms/square, the LexanTM has the highest maximum
change in the electric field. However, during testing, it also started with one of the highest
electric fields. Thus, the best way to compare the effect of the triboelectric effect is to
compare the different materials with regards to the change of the electric field relative to its
Max E-field change
0
0.5
1
1.5
2
2.5
Aluminum Red HE Adiprene Black HE Adiprene Gray HE PVC Lexan Teflon
Material
kilo
volt
s/in
ch
32
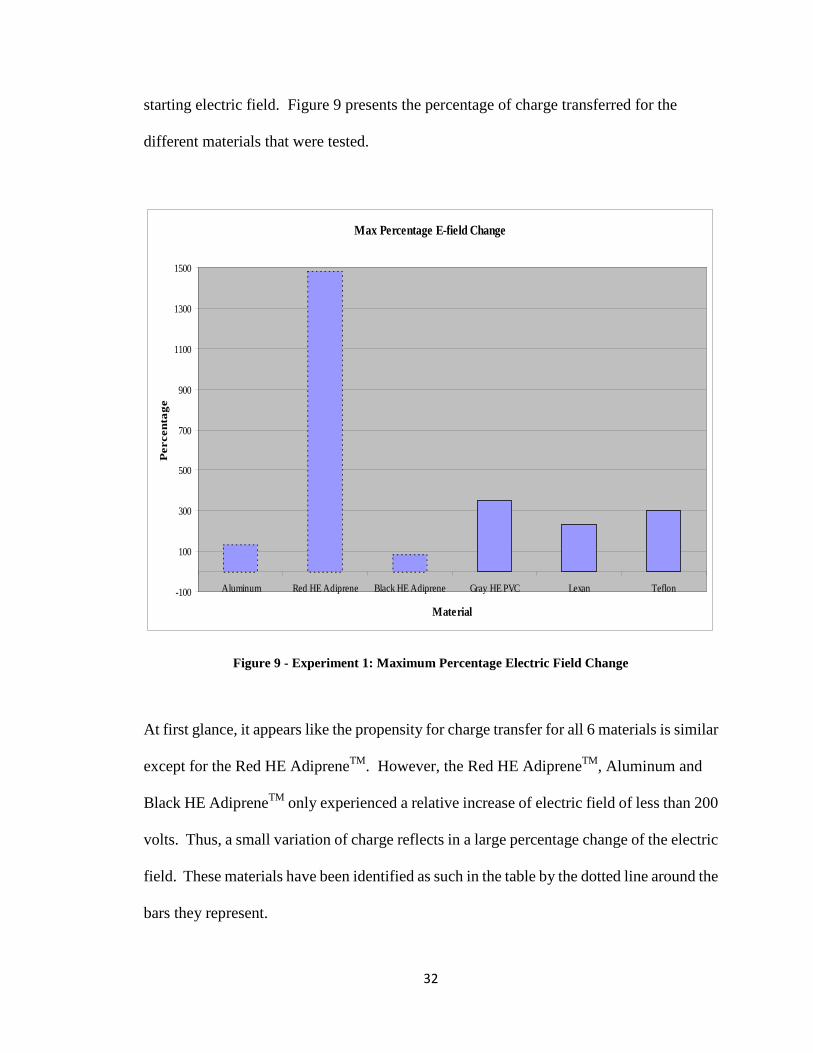
starting electric field. Figure 9 presents the percentage of charge transferred for the
different materials that were tested.
Figure 9 - Experiment 1: Maximum Percentage Electric Field Change
At first glance, it appears like the propensity for charge transfer for all 6 materials is similar
except for the Red HE AdipreneTM. However, the Red HE AdipreneTM, Aluminum and
Black HE AdipreneTM only experienced a relative increase of electric field of less than 200
volts. Thus, a small variation of charge reflects in a large percentage change of the electric
field. These materials have been identified as such in the table by the dotted line around the
bars they represent.
Max Percentage E-field Change
-100
100
300
500
700
900
1100
1300
1500
Aluminum Red HE Adiprene Black HE Adiprene Gray HE PVC Lexan Teflon
Material
Per
cent
age
33
The Gray HE PVC, LexanTM and Teflon® all experienced between approximately 225%
and 350% increase relative to the starting electric field. The largest change in electric field
of the 3 materials is the Gray HE PVC which underwent a 350% increase in the electric
field (or 500 volts). This material has the lowest surface resistivity of the materials that
have a surface resistivity of 1012 ohms/square or greater. The other materials with the
lower surface resistivities demonstrate a lower change in electric field. The Gray HE PVC
appears to be an anomaly if one was to assume a correlation that the greater the surface
resistance, the greater the intensity of the triboelectric effect.
Due to the relatively low electric field generation utilizing the method of dragging the
charge transfer tool across the surface of the test materials, another experiment was
performed to attempt to increase the charge transfer that occurred and as a result, a greater
delta between starting and ending electric field.
2.3.2 Experiment 2: Drill Experiment
A test was developed to try to integrate some controlled ESD generation methodologies
utilizing tools and materials that were available. The intent was to try to generate a greater
electric field but maintaining a controlled experiment.
The experiment that was developed allowed for a greater force on the material being tested
as well as a faster velocity between the charge generating tool and the test material. A test
object was built which entailed covering a spinning wheel with the fabric material which

34
was used on the first test series. The weight of the electric drill was utilized as the constant
force applied on the test material to ensure that the applied force was constant for all the
test materials. In addition, the electric drill allowed for a regulated speed by locking the
variable speed button at a constant position. The spinning fabric covered wheel was placed
against the test material for 5 seconds for all materials that were to be tested. The spinning
wheel was placed within a circle that was marked on the dielectric material by a tracing of
the spinning wheel. The center of the circle was marked. A measurement of the electric
field was made at the mark at the center of the circle before and after the rotating wheel was
applied within the circle on the test material.
As was done for the previous experiment, an attempt was made to remove all surface
charge from the test material prior to the experiment with the conductive brush. The data
that was yielded from this test scenario provided a much larger electric field and the ability
for a better understanding of the potential relationship between the surface resistivity and
the triboelectric effect.

35
Figure 10 - Experiment 2: Maximum Electric Field Change
As was the case with the prior experiment, the materials with the higher resistivity, as a
whole, proved to show the greatest change in Electric field and thus, the greatest charge
transfer. However, as was noted for the first experiment, the magnitude of the charge
transfer does not appear to be directly correlated to the surface resistivity of the materials.
E-field change using drill
0
0.5
1
1.5
2
2.5
3
3.5
4
4.5
Aluminum Red HE AdipreneTM Black HE Adiprene Gray HE PVC Lexan Teflon
Materials
E-f
ield
cha
nge
(kilo
volt
s/in
)

36
Figure 11 - Experiment 2: Maximum Electric Field Percentage Change
When considering the percentage electric field change before and after the materials were
rubbed with the spinning disk, the material that showed the greatest change was the Black
HE AdipreneTM. The scale for this chart had to be manipulated due to the 7400% electric
field change for the Black HE AdipreneTM. However, once again, although it experienced
a large percentage change in the electric field, the electric field measurement was only
approximately 750 volts.
% E-field increase using drill
7400
0
50
100
150
200
250
300
350
400
Aluminum Red HE AdipreneTM Black HE Adiprene Gray HE PVC Lexan Teflon
Materials
Per
cen
tag
e

37
2.3.3 Experiment 3: Aggressive Charging
A final experiment was performed to try to ensure that there was a thorough set of data to
draw conclusions about the relationship between the surface resistivity and triboelectric
effect. To try to generate a large electric field on the test materials, a manual manipulation
of the materials was performed. The materials were manually rubbed by hand,
aggressively, for 5 seconds with a subjectively uniform force. A foam block was wrapped
with the charging fabric material and it was rubbed against the test materials in a back and
forth manner. Electric field measurements of the test materials were taken before and after
the materials were rubbed. As in the previous experiments, an attempt was made to remove
as much surface charge from the materials as possible prior to performing any experiments.

38
Figure 12 - Experiment 3: Maximum Electric Field Change
The experiment proved to generate a greater surface charge as the greatest electric field
that was measured for this series of experiments was -14.2 kilovolts/in. The electric field
values across most of the materials were greater than for the previous experiments. Once
again, the materials with the higher surface resistivities underwent a greater change in the
measured electric field. However, the data demonstrates the fact that the order of the
magnitude of the surface resistivity does not directly correlate to the magnitude of the
change of the electric field.
E-field Change after manual rubbing
0
2
4
6
8
10
12
14
Aluminum Red HE Adiprene Black HE Adiprene Gray HE PVC Lexan Teflon
Materials
E-f
ield
ch
an
ge
(kil
ov
olt
s/in
)
39
Figure 13 - Experiment 3: Maximum Electric Field Percentage Change
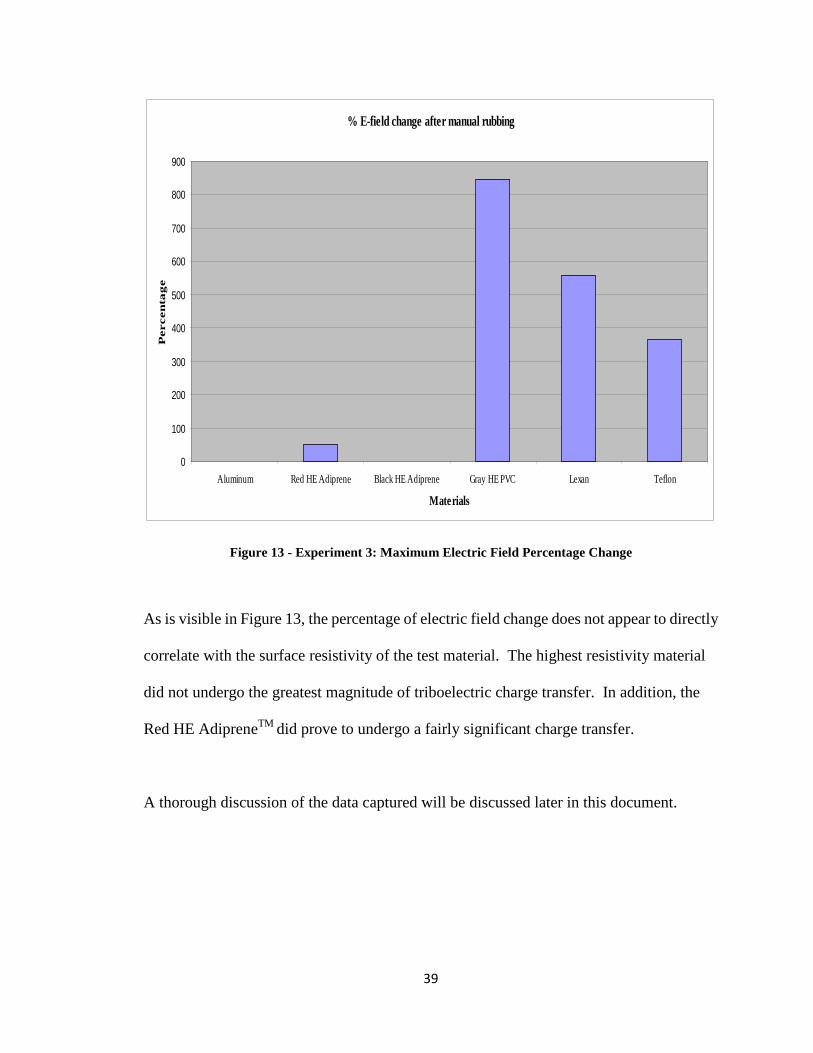
As is visible in Figure 13, the percentage of electric field change does not appear to directly
correlate with the surface resistivity of the test material. The highest resistivity material
did not undergo the greatest magnitude of triboelectric charge transfer. In addition, the
Red HE AdipreneTM did prove to undergo a fairly significant charge transfer.
A thorough discussion of the data captured will be discussed later in this document.
% E-field change after manual rubbing
0
100
200
300
400
500
600
700
800
900
Aluminum Red HE Adiprene Black HE Adiprene Gray HE PVC Lexan Teflon
Materials
Per
cen
tag
e
40
CHAPTER 3: SURFACE CHARGE REMOVAL
A consistent and reliable method to do this would prove to be extremely helpful when
working with explosive assemblies and dielectric materials. A series of experiments was
designed to determine the effectiveness of using a tool to remove surface charge.
3.1 Brush Experiment
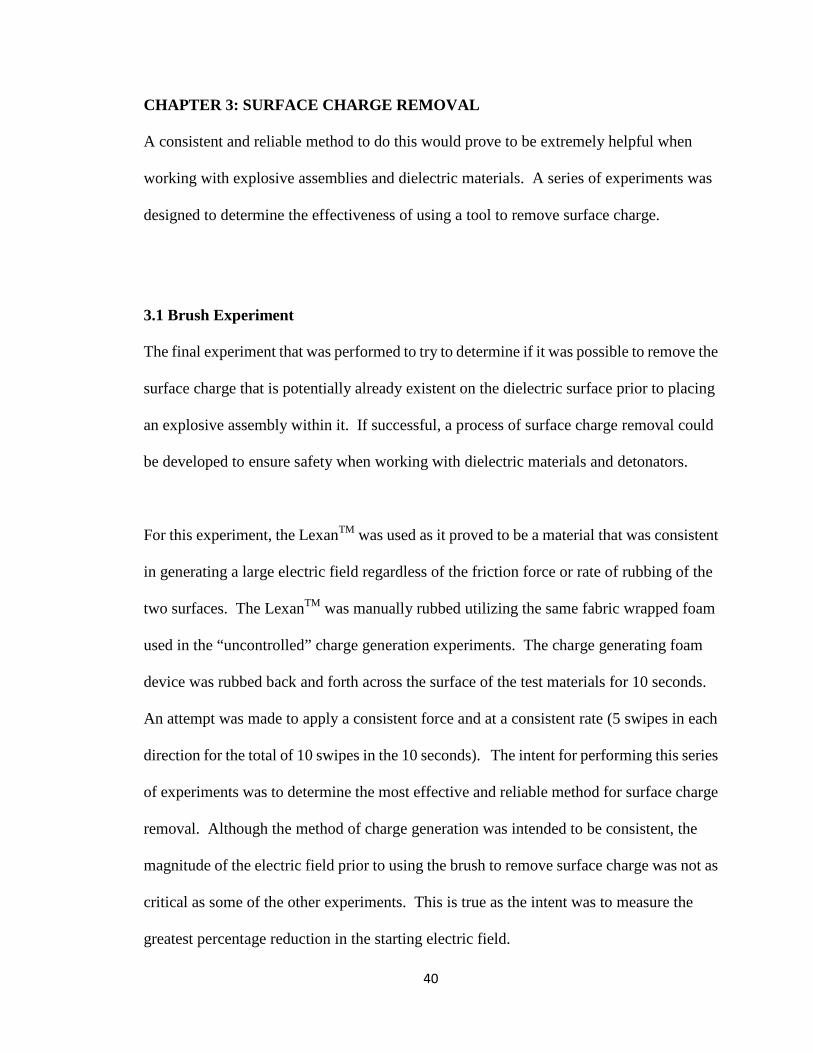
The final experiment that was performed to try to determine if it was possible to remove the
surface charge that is potentially already existent on the dielectric surface prior to placing
an explosive assembly within it. If successful, a process of surface charge removal could
be developed to ensure safety when working with dielectric materials and detonators.
For this experiment, the LexanTM was used as it proved to be a material that was consistent
in generating a large electric field regardless of the friction force or rate of rubbing of the
two surfaces. The LexanTM was manually rubbed utilizing the same fabric wrapped foam
used in the “uncontrolled” charge generation experiments. The charge generating foam
device was rubbed back and forth across the surface of the test materials for 10 seconds.
An attempt was made to apply a consistent force and at a consistent rate (5 swipes in each
direction for the total of 10 swipes in the 10 seconds). The intent for performing this series
of experiments was to determine the most effective and reliable method for surface charge
removal. Although the method of charge generation was intended to be consistent, the
magnitude of the electric field prior to using the brush to remove surface charge was not as
critical as some of the other experiments. This is true as the intent was to measure the
greatest percentage reduction in the starting electric field.

41
Two different commercially available brushes were used to attempt to remove the surface
charge. Both brushes were manufactured by Gordon Brush Mfg. Co., Inc. One brush,
designed to be a conductive brush, utilized a static dissipative handle (resistance of
105Ω/cm) with a bristle material, Thunderon, which had a resistivity of 10-2Ω/cm. The
second brush, designed to be a static dissipative brush, also utilized the same static
dissipative handle but utilized Nylon bristles which were also specified as static dissipative
and had a resistance of 103Ω/cm. An additional brush which was not available for testing
had Thunderon® bristles and an Aluminum handle.
For each experiment, the brush was mounted in the track system that was also utilized to
hold the surface field meter to ensure the brush maintained a constant friction between the
brush bristles and the test material. It also allowed the use of the speed control mechanism
used in the earlier experiments to ensure that the brush speed was maintained. As the brush
handles were static dissipative, each brush was able to drain the collected charge through
the brush handle, through the metal track to earth ground.
Because the Aluminum handled brush was not available for testing, it seemed important to
simulate the advantage of the conductive handle. Thus, a drain wire was clamped to the
conductive Thunderon bristled for one configuration to simulate a low resistance path
between the bristles and ground. The following test configurations were used for this test
series to allow a variety of serial resistance paths.

42
Test Reference Brush Material Configuration Conductive with Drain
Conductive Brush (Thunderon® bristles, Static dissipative handle)
Brush handle mounted in metal track; one end of drain wire clamped to conductive fibers, other end tied to ground
Conductive Conductive Brush (Thunderon® bristles, static dissipative handle)
Brush handle mounted in metal track
Static Dissipative Static Dissipative Brush (Nylon bristles, Static dissipative handle)
Brush handle mounted in metal track
Table 3 - Surface Charge Removal - Brush Configurations
It is important to recognize the variety of surface charge removal tools and techniques. If
these processes prove to be effective, their application may vary. The method of surface
charge removal may range from an individual who manually “brushes” the dielectric
surface to remove surface charge to passing the dielectric surface through a structure that
has conductive brush bristles that are interlapped to ensure a total surface charge removal.
Thus, the most effective method will be utilized for the development of a formal surface
charge removal method and tool which could be used by the DOE Weapons Complex for
its explosives work.
During the series of experiments, a relatively large electric field was generated. The
largest measured electric field was more than -17 kilovolts/in. As was done in the surface
charge generation experiments, the electric field was measured at 6 points along a straight
line on the test material surface. All 6 points were measured after charging the surface and
also every time the brush was dragged along the surface. The brush was swiped across the
surface a total of 3 times with the electric field being measured after each brush stroke.
43
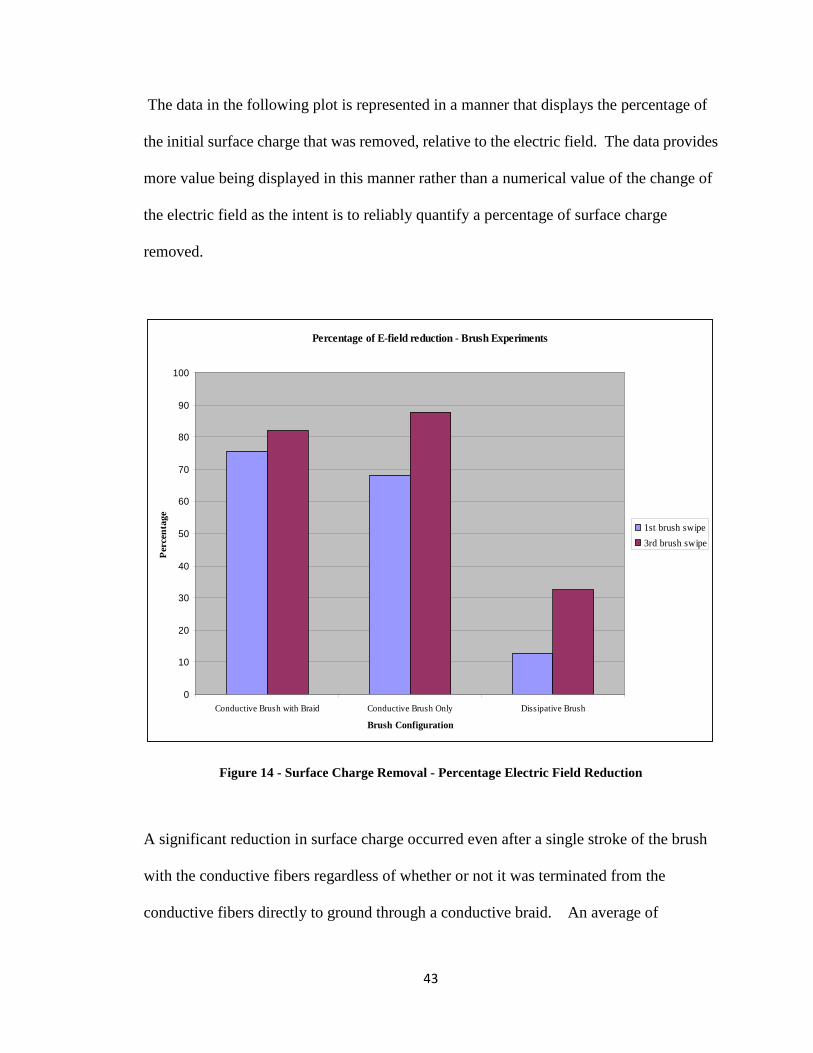
The data in the following plot is represented in a manner that displays the percentage of
the initial surface charge that was removed, relative to the electric field. The data provides
more value being displayed in this manner rather than a numerical value of the change of
the electric field as the intent is to reliably quantify a percentage of surface charge
removed.
Figure 14 - Surface Charge Removal - Percentage Electric Field Reduction
A significant reduction in surface charge occurred even after a single stroke of the brush
with the conductive fibers regardless of whether or not it was terminated from the
conductive fibers directly to ground through a conductive braid. An average of
Percentage of E-field reduction - Brush Experiments
0
10
20
30
40
50
60
70
80
90
100
Conductive Brush with Braid Conductive Brush Only Dissipative Brush
Brush Configuration
Per
cent
age
1st brush swipe3rd brush swipe

44
approximately 70% reduction of the electric field was measured with just a single stroke of
the brush on the dielectric surface. Considering that the electric field and surface charge
density are a 1:1 relationship, the 70% reduction in electric field equates to a 70%
reduction in surface charge. The dissipative brush was not nearly as effective as the
conductive brush. The higher resistivity of the fibers and handle result in a longer time
constant and thus, it would require a much slower stroke speed to remove the charge.
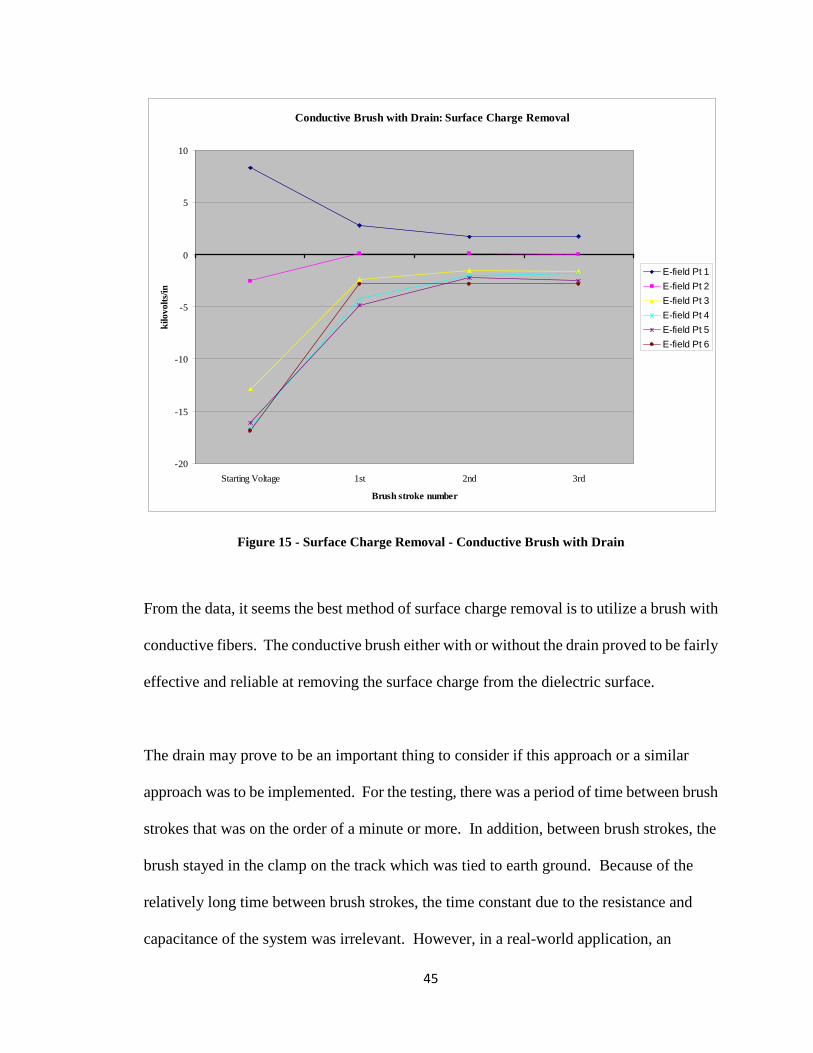
The conductive brush using the braided drain proved to be the most effective. Figure 15
displays the effectiveness of this configuration. As noted before, a significant portion of
the surface charge was removed with the first brush stroke. Also note that in some
instances, the starting voltage was positive and in others, it was negative. However, this
proved to have no effect on the effectiveness of the ability of the conductive brush with the
drain to remove surface charge as the electric field measurements quickly converge to zero.
45
Figure 15 - Surface Charge Removal - Conductive Brush with Drain
From the data, it seems the best method of surface charge removal is to utilize a brush with
conductive fibers. The conductive brush either with or without the drain proved to be fairly
effective and reliable at removing the surface charge from the dielectric surface.
The drain may prove to be an important thing to consider if this approach or a similar
approach was to be implemented. For the testing, there was a period of time between brush
strokes that was on the order of a minute or more. In addition, between brush strokes, the
brush stayed in the clamp on the track which was tied to earth ground. Because of the
relatively long time between brush strokes, the time constant due to the resistance and
capacitance of the system was irrelevant. However, in a real-world application, an
Conductive Brush with Drain: Surface Charge Removal
-20
-15
-10
-5
0
5
10
Starting Voltage 1st 2nd 3rd
Brush stroke number
kilo
volts
/in
E-field Pt 1E-field Pt 2E-field Pt 3E-field Pt 4E-field Pt 5E-field Pt 6

46
individual may be brushing a number of dielectric materials with very little time in
between brush strokes. Thus, the time constant in that situation may become more
important. If the charge gathered by the brush does not have enough time to drain off, the
second stroke to the next surface may actually transfer charge to the next surface rather
than pulling it off.
47
CHAPTER 4: DISCUSSION OF RESULTS
4.1 Analysis Performed
The method of analysis detailed above may be the only method currently available within
the DOE Weapons Complex to evaluate the hazard of ESD and explosives. As was visible
from the analysis performed, this analysis is extremely conservative and results in very
high energy values. The only way to drive those energy values down using the described
method of analysis is to control the voltage applied to the dielectric when it is evaluated as
a capacitor. Because the voltage is squared, a change in the voltage will have a dramatic
effect on the solution to the equation.
The only method to lower the value of the voltage is to try to control it. If a voltage control
process was implemented in an explosive handling facility, it may be possible to assume a
lower voltage. Utilizing controls like ESD conductive flooring, ESD conductive shoes,
ground straps, non-isolated tool, etc., it may be possible to re-evaluate the voltage
distribution within the facility to drive a lower maximum voltage. Once again, this proves
to be an extremely expensive solution, but the only viable one if controlling the dielectric
or removing the surface charge cannot be implemented.
4.2 Surface Resistivity versus Triboelectric Effect
Throughout the three separate triboelectric charge transfer experiments, one thing that
appears to be relatively consistent from the data is the fact that surface resistivity may have
some effect on the ability for a material to undergo triboelectric charge transfer. With the
data collected, it appears that materials that have a higher surface resistivity are generally

48
more likely to undergo triboelectric charging and the magnitude of the charge is greater
than for materials with lower surface resistivities. Conversely, most of the experiments
also had data that contradicted this concept. When the higher resistivity materials were
compared to one another, the surface resistivity appeared to have no effect on the
magnitude of triboelectric charge transfer that occurred.
However, much research on this subject has also concluded that the higher the surface
resistivity of a material, the longer it takes for a surface charge to drain off of a material. If
the surface resistance of the material is great enough, the surface charge cannot drain off
the surface. Conversely, if the surface resistance of the material is low enough, the surface
charge flows freely and thus, may bleed off extremely quickly. Therefore, it is possible
that the materials with the lower surface resistivity values actually experienced a greater
triboelectric charge transfer than higher resistivity materials, but the charge may have
drained off quickly. If it drained off before the electric field was measured, it would be
impossible to know how large the electric field might have been. For materials like the
Aluminum, this is a very realistic possibility.
More testing would need to be performed before any definitive conclusions regarding
surface resistivity and its relationship to the triboelectric effect could be determined.
Limitations with the ability to measure the electric field very quickly would need to be
resolved. In addition, further research on the properties of these different materials might
also provide a clue as to the inconclusiveness with the data.

49
Unfortunately, the Black HE AdipreneTM, Red HE AdipreneTM and Gray HE PVC
materials all manufactured using a proprietary formula and thus, much of the material
properties are unknown. It is difficult to determine if there are other properties in the
materials that may describe what phenomenon may cause the varying magnitude of
triboelectric charge transfer between the high resistivity materials.
As the goal of this research was to provide input toward the design of new materials that
will be effective in protecting explosive assemblies from mechanical shock, but minimize
the potential of insults due to ESD, it would seem that a variety of things would need to be
considered.
A material with a relatively low resistance seems like it should be cautiously considered.
Another thing that must be considered is that the insulative properties of dielectric foams
might need to be maintained. The insulative properties drive the ability of the material to
prevent outside electrical energy from getting to the explosive assemblies. If the surface
resistivity is lowered to the point that current easily flows through the material, it could
prove to be problematic. For example, if a frayed electrical cord touching the protective
housing passes the electrical energy through the housing to the explosive, an important
safety design feature of high resistance materials was negated.
An effective material with regards to protecting against both mechanical and electrical
insults may be to design a dielectric material which unaltered, would have a high
resistivity, but may be loaded with carbon or graphite to help lower its surface resistivity to

50
help ensure its ability to undergo triboelectric charge transfer is minimal. As some of these
materials, including the red and black HE AdipreneTM materials and the gray HE PVC
material, are poured and molded within the DOE complex, it may be possible to load these
materials with conductive materials to help lower their surface resistivity. This is
something that will be explored and implemented for future testing that will continue due
to the importance of solving this problem.
However, it cannot be ignored that the speed at which the materials were rubbed together
and the force at which they were rubbed also had an influence on the ability to undergo
triboelectric charge transfer. This would also need to be further tested to determine if these
two variables have more influence than the surface resistivity itself.
4.3 Surface Charge Removal Tool
The static dissipative brush proved to be fairly ineffective as it resulted in a reduction of the
electric field of a minimum of 5% and a maximum of 40%. However, the ability of the
conductive brush to remove surface charge proved to be fairly effective. A single stroke
across the surface of the material removed enough surface charge to equate to
approximately an average 70% electric field reduction. As noted earlier, this equates to a
70% reduction in total surface charge. The lowest reduction in electric field with a single
brush stroke was more than 65% minimum and almost 90% maximum when using the
conductive brush with a ground braid. This is a significant reduction and proved to be
fairly repeatable across the 3 tests performed with the conductive brush using the ground
braid.
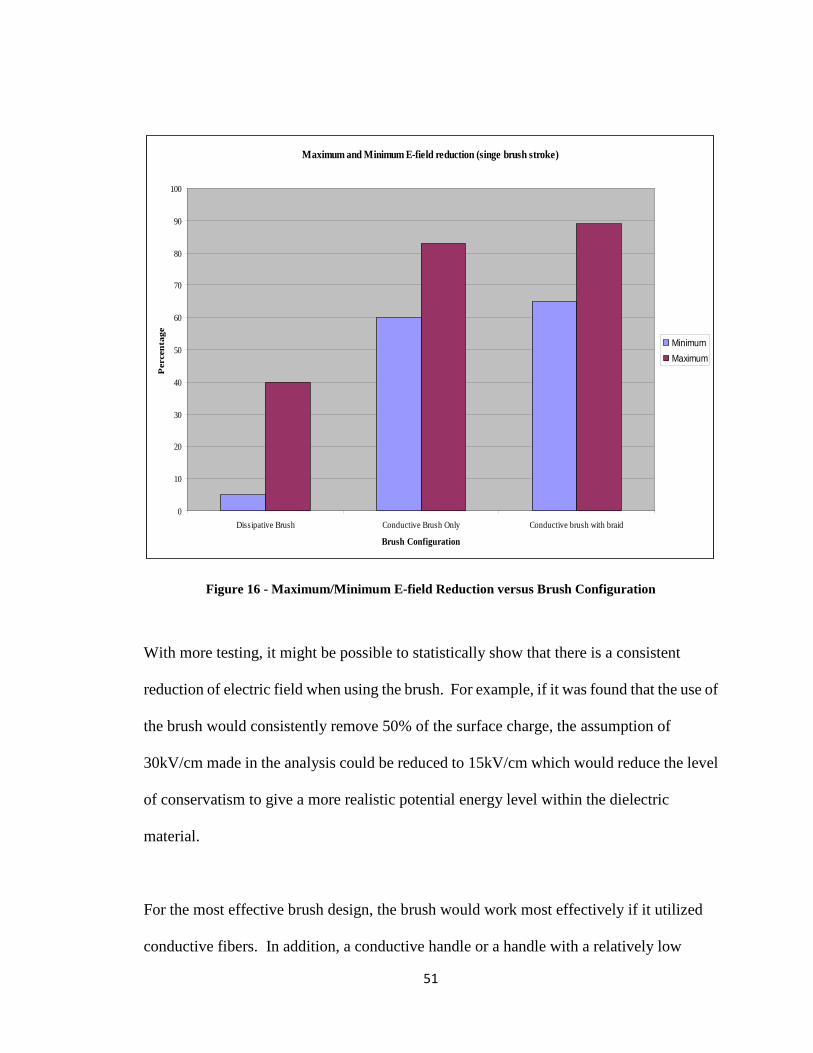
51
Figure 16 - Maximum/Minimum E-field Reduction versus Brush Configuration
With more testing, it might be possible to statistically show that there is a consistent
reduction of electric field when using the brush. For example, if it was found that the use of
the brush would consistently remove 50% of the surface charge, the assumption of
30kV/cm made in the analysis could be reduced to 15kV/cm which would reduce the level
of conservatism to give a more realistic potential energy level within the dielectric
material.
For the most effective brush design, the brush would work most effectively if it utilized
conductive fibers. In addition, a conductive handle or a handle with a relatively low
Maximum and Minimum E-field reduction (singe brush stroke)
0
10
20
30
40
50
60
70
80
90
100
Dissipative Brush Conductive Brush Only Conductive brush with braid
Brush Configuration
Per
cent
age
MinimumMaximum

52
resistance would be most effective. It is also important that the brush handle has a direct
current path to a grounding point. In a real world application, it is important to consider
that workers who are handling explosive materials and assemblies may or may not be
wearing equipment that will ensure that their maximum voltage potential is at a minimum.
Thus, a direct current path to ground would provide an engineering control to ensure an
effective method of draining the charge to grounding point.

53
CHAPTER 5: FUTURE WORK
The ability to mechanically isolate explosives without introducing an ESD insult is an
important goal for a number of organizations within the DOE weapons complex. The
Sandia Rocket Sled accident helped solidify the importance by proving that something that
had been predicted theoretically had a reasonable probability of occurring. The Rocket
Sled Accident was also more interesting in the fact that there was not a dielectric material
present to provide more energy for the ESD; only the human who was available to store
and deliver energy. The addition of a dielectric material adds to the total energy that can be
imparted to the explosive.
A team of individuals across the DOE Complex has been tasked with solving this problem.
More sophisticated mathematical models are being developed to help with the analysis of
the maximum “realistic” energy that can be delivered from the dielectric material to the
detonator. However, these mathematical models and their implementation in software
proves to be extremely difficult, time consuming and expensive. Experiments that help to
better understand the material properties of these dielectric materials will prove important
to control the ability for the materials to transfer charge. In addition, potential methods of
surface charge removal, like the brush removal experiments, will hopefully help drive a
method of surface charge removal that can be proven to be reliable and effective.
The research, data and conclusions drawn from this thesis will be utilized as a baseline to
begin understanding better methods to ensure explosive safety. A variety of limitations is
an extremely important problem to solve.

54
Many groups within a number of organizations within the DOE Weapons Complex are
looking at replacing some of the mechanical isolating materials they use with explosives.
This provides an opportunity for electrical engineers to provide input to mechanical
engineers to ensure materials are used that protect against both mechanical and electrical
insults.
The data that was gathered in these experiments will be a start in understanding material
properties and how future materials may be designed to help minimize the triboelectric
effect on explosive assemblies. This, coupled with a reliable method of charge removal,
will allow for a level of safety improvement for the DOE weapons complex when working
with explosive materials.

55
LIST OF REFERENCES
[1] Payne, Craige., Principles of Naval Weapons Systems, 2nd Edition, Naval Institute
Press, 2 edition, 2010
[2] Dorf, Richard (editor in chief), The Electrical Engineering Handbook, 2nd edition,
New York: CRC Press; 1997
[3] Merriam-Webster Online, Retrieved July 15, 2013 from the OLPC
http://www.meriam-webster.com
[4] Part One- An Introduction to ESD.pdf, Retrieved July 16, 2013 from the OLPC
ESD Journal: http://www.esda.org/fundamentalsP1.html
[5] Mosca, G., Tipler, P. A., Physics for Scientists and Engineers, Volume 2:
Electricity, Magnetism, Light, and Elementary Modern Physics, 5th Edition, New
York: W. H. Freeman Publishing, 2003
[6] Davies, D. K., November 1969, Charge Generation on Dielectric Surfaces,
Journal of Physics D: Applied Physics Volume 2
[7] Allen, R. C., December 2000, Triboelectric Generation: Getting Charged,
EE-Evaluation Engineering, Desco Industries Inc.
[8] McGinnis, M. D., 2002, An Electrostatic Discharge (ESD) Control Program for
Children with Cochlear Implants, Journal of Educational Audiology 10 (2002) (Pg.
57-64)
[9] Figure 2, Reproduced with permission from Jim Varosh, General Manager of Teledyne
RISI, Inc., RP-1 EBW Detonator, Retrieved December 15, 2013 from Teledyne
RISI, Inc., http://www.teledynerisi.com/products/0products_1ebw_page20.asp
56
[10] Exploding bridgewire concept, Retrieved January 8, 2014 from Teledyne RISI,
Inc. http://www.teledynerisi.com/products/0products_8td_page03.asp
[11] DOE-STD-1212-2012, 2012, Explosives Safety, Department of Energy, 2012
[12] Pentaerithritol tetranitrate, PETN, CAS No. 78-11-5 [online]: Omni Distribution
Inc., Marion, AR
http://www.aflglobal.com/productionFiles/resources/MSDS/MSDS-IMPACCT-D
etcord.aspx, accessed January 17, 2014
[13] Holmberg, R., Lee, J., Persson, A., Rock Blasting and Explosives Engineering,
Boca Raton: CRC Press LLC, 1993
[14] Liu, L., Electrostatic Generation And Control on Textiles, Ph.D. thesis, North
Carolina State University, 2010
[15] Antistatic properties of materials, Retrieved December 28, 2013 from Intertek
Worldwide, http://www.intertek.com/analysis/materials/anti-static-properties/
[16] Owen, M. J. (1990). Electrostatic discharge control. New York: McGraw-Hill
Publishing Company.
[17] Medina, A., Stofleth, J., Dinallo, M., Technical Advisory Team (TAT) Report On
the Rocket Sled Test Accident of October 9, 2008(SAND2009-0180), Sandia
National Laboratories, 2009
[18] ESD Materials Properties, Retrieved November 14, 2013 from Boedeker Plastics,
Inc,, http://www.boedeker.com/esdmatls.htm
[19] Eylon, S., Greenway, W., Henestroza, E., Waldwron, W., Yu, S., 2003,
ELECTRICAL BREAKDOWN STUDIES WITH MYCALEX INSULATORS*, USA
proceedings of the 2003 Particle Accelerator Conference, 2003

57
[20] Groop, E.E., Nowicki, A. W., Callei, C. I., Buhlers, C. R., Mantovani, J. G., 2000,
Comparison of Surface Resistivity and Triboelectric Charge Generation
Characteristics of Material, Florida, USA, 2000
[21] Niels, J., Electrostatics. New York: International Thomson Publishing, 1998
[22] ESD-ADV53.1, Electrostatic Discharge Association, 1995
[23] Lee, R., Thanxton, E., STANDARD TEST METHOD FOR EVALUATING
TRIBOELECTRIC CHARGE GENERATION AND DECAY, National
Aeronautics and Space Administration Kennedy Space Center , Date Unknown