
Exploring the Urban Digital Divide in Kigali: Spatial ... · policy-supported environment. Using...
92
Exploring the Urban Digital Divide in Kigali: Spatial Analysis and Institutional Adaptation OTIOMA CHUKS February, 2017 SUPERVISORS: Dr. M. Madureira Dr. J.A. Martinez
Transcript of Exploring the Urban Digital Divide in Kigali: Spatial ... · policy-supported environment. Using...

Exploring the Urban Digital Divide
in Kigali: Spatial Analysis and
Institutional Adaptation
OTIOMA CHUKS
February, 2017
SUPERVISORS:
Dr. M. Madureira
Dr. J.A. Martinez

Thesis submitted to the Faculty of Geo-Information Science and Earth
Observation of the University of Twente in partial fulfilment of the
requirements for the degree of Master of Science in Geo-Information
Science and Earth Observation.
Specialisation: Urban Planning and Management
SUPERVISORS:
Dr. M. Madureira
Dr. J.A. Martinez
THESIS ASSESSMENT BOARD:
Dr. R.V. Sliuzas (Chair)
Prof. Dr.-Ing. P. Gotsch (External Examiner)
Exploring the Urban Digital Divide
in Kigali: Spatial Analysis and
Institutional Adaptation
OTIOMA CHUKS
Enschede, The Netherlands, February, 2017


DISCLAIMER
This document describes work undertaken as part of a programme of study at the Faculty of Geo-Information Science and
Earth Observation of the University of Twente. All views and opinions expressed therein remain the sole responsibility of the
author, and do not necessarily represent those of the Faculty.


i
ABSTRACT The availability and use of the ICTs, which hold potentials for cities, are often uneven across geographies
and demographics; a condition which has been referred to as the digital divide. Given the invisibility of
digital access, certain geo-demographic groups could face the risk of digital exclusion. Bridging the digital
divide entails understanding at least the baseline ICT asset ownership and use in the focus cases, to ensure
that interventions are relevant to problem context and geography. However, most studies explore the
digital divide at macro-spatial levels (frequently, national and regional levels), which makes them less
relevant for knowledge generation and policies at intra-urban scales, the actual hubs of innovations.
From the foregoing, this study aims at exploring the state of ICT access in Kigali at administrative sector
levels and existing digital bridge (ICT gap-closing) policy initiatives. It employs a Quantitative-qualitative
(Quant-qual)/mixed method. It analyses official census data on ICT Key Performance Indicators (KPIs)
across dimensions and space, 35 administrative sectors. The study establishes the relative digital access
performance of the sectors based on the measurement of their ICT Location Quotients (ICTLQs) derived
from the KPIs and classifies them into ICT-Basic (concentration) and ICT-Non-Basic (sparsity) sectors. It
finds that Internet use by location does not match ICT asset ownerships. This indicates that Kigali City is
still at the rudimentary stage of ICT access. The digital KPIs, spatially grouped into four distinctive
clusters, show that all ICT-Basic sectors and clusters are centrally-located. The study establishes that the
digital divide does exist in Kigali City; spatial distribution of ICT access is significantly clustered, with
High-High co-types at the core and Low-Low co-types on the northeastern periphery of Kigali City. This
espouses spatiality-digitality relations. Using data reduction method on 19 variables, the study establishes
that existing urban inequality reflected in infrastructure access, sector urban agglomerative strength,
planning status or settlement formality and household socio-economic status are replicated as correlates of
the digital divide in Kigali City. However, youth employment exhibits an inverse relationship with sector
ICT access in this case; evidence of higher unemployment levels at the city cores than the peripheries. The
underlying socio-economic analysis confirms that there is still significant gendering of digital access.
Premised on the perspective that policy initiatives are critical to closing spatial divergence in digital access,
the study examines the existing ICT interventions in Kigali City, based on qualitative data from policy
documents and interview of multi-actors in key ICT projects. It finds, based on actors‘ accounts, that ICT
policy initiatives have been conceived to cut across geographies and demographics. The projects are
mostly nationally-conceived and each has a thematic focus which falls within community development,
skills/education development, private sector development, e-government or cross-cutting. The study
concludes that at the root of the positive outcomes of these digital bridge policy initiatives are innovation
networks, which are intricate linkages of actors working across geographies, ICT-projects and themes in a
policy-supported environment. Using SWOT analysis, it highlights the main constraints of the ICT policy
initiatives; poor electricity, paucity of funding, shortage of high profile local skillsets to domesticate
technology, service deficiency in local content, the challenge of managing multi-actor interests in
partnering agencies and self-exclusion tendencies among some of the target social groups.
It recommends, among other things, that the baseline spatial-statistical analysis should guide spatially
targeted ICT policy interventions to bridge ICT access gap and that the dimension of ICT be incorporated
in traditional urban planning and service provision to ensure its prioritisation as part of key urban services
and utilities.
Key words: Urban digital divide, ICT access, spatiality and digitality, spatial-statistical analysis, ICT
cluster, digital bridge policy initiatives, innovation networks, Kigali City

ii

iii
ACKNOWLEDGEMENTS
In the quest to learn and excel I have received encouragements from individuals and organisations. Some
of them have guided me while others have provided moral and material support. To this end I would like
to thank my supervisors, Dr. Mafalda Madureira and Dr. Javier Martinez. You provided the right
ambience for me to communicate my research ideas and guided me through every stage of the work,
taking pains to read every line and critique my output constructively. I appreciate Dr. Luc Boerboom for
his role in planning my fieldwork. You helped with relevant contacts in the agencies and ensured an
enabling environment; I had a smooth start as soon as I arrived Kigali, Rwanda. In the same vein, I am
grateful to the entire department, UPM; those who helped strengthen my research skills through teaching
and the non-academic staff. This is also extended to ITC staff members from other departments who
contributed in their official capacities. I deeply appreciate Nuffic/Netherlands Fellowship
Programme(NFP) for providing the full financial backing required to complete this MSc programme; by
extension, this is an expression of thanks to all Dutch citizens, whose fatherland has welcomed and
provided for me throughout my programme.
The moral, emotional and professional support from family, friends, advisors and associates count a great
deal. In this regard, I am grateful to my family for always being there as my source of inspiration. Some
friends can be as close as brothers. Here I would like to thank my friends: Benson Msafiri, Onyimbi Ragot
and Ebrima Manneh. It was a circle; it went beyond study to exchange of ideas for advancement and
leaderhip. In the same vein, I appreciate the inspirational presence of my friends: Nixxon Nduji, Jefferson
Okojie, Fatima Makama and Amdetsion Tedla. Thank you UPM MSc class of 2015-2017; we are a team.
Thank you my research partner, Novi Sulistyaningsih. We share similar topics in the same theme and
worked with the same supervisors. That was great. To my referees in my home country kindly accept my
appreciation for your professional support and references: Prof. Ohi M. Asikhia, Mr Toju Balogun and Mr
Amodu James.
But for the strong institutions and individuals in Kigali this piece of work would not have gained policy
and project insights. Therefore, I appreciate the support of Catherine Kalisa(UN-Habitat, Kigali, Rwanda).
You facilitated my field visit and activities. Thank you Theophile Mutaganda(MININFRA/RHA,
Rwanda). I thank all the actors interviewed, formally and informally, in Rwanda: MYICT, RURA,
RDB,RICTA/RINEX, RTN, OLPC, AIRTEL and Rwanda Online Platform.
I appreciate everyone whose name or agency has been mentioned or omitted but contributed to my quest
for knowledge and development.

iv

v
DEDICATION
Dedicated to that segment of the youth, who seek opportunities to explore their talents and make positive
contributions to society.

vi
vii
TABLE OF CONTENTS
Abstract ............................................................................................................................................................................ i
Acknowledgements ...................................................................................................................................................... iii
Dedication ....................................................................................................................................................................... v
Table of contents .........................................................................................................................................................vii
List of figures ................................................................................................................................................................ ix
List of tables ................................................................................................................................................................... x
List of acronyms ........................................................................................................................................................... xi
INTRODUCTION .............................................................................................................................................. 1 1.
Background and Justification .................................................................................................................. 1 1.1.
Research Problem ..................................................................................................................................... 2 1.2.
Research Objectives and Questions ....................................................................................................... 3 1.3.
1.3.1. Main Objective .......................................................................................................................................... 3
1.3.2. Sub-objectives and Questions ................................................................................................................. 3
Thesis Structure ......................................................................................................................................... 3 1.4.
CONCEPTUAL FRAMEWORK AND LITERATURE REVIEW ......................................................... 5 2.
The Digital Divide: Conceptual and Measurement Issues ................................................................. 5 2.1.
Spatiality and Digitality ............................................................................................................................. 8 2.2.
The Role Institutions in Bridging the Digital Divide .......................................................................... 9 2.3.
The Outlook: Information and Communication Technologies in Inclusive City Development2.4.
................................................................................................................................................................... 12
RESEARCH METHODOLOGY ................................................................................................................. 15 3.
Case Justification .................................................................................................................................... 15 3.1.
3.1.1. Socio-economic Condition of Kigali City .......................................................................................... 15
3.1.2. Urban Planning and Administration in Kigali City .......................................................................... 16
Spatial Level of Analysis ....................................................................................................................... 17 3.2.
Information and Communication Technologies within the Economic Development 3.3.
Framework of Kigali City ..................................................................................................................... 19
Data Collection and Analysis ............................................................................................................... 20 3.4.
3.4.1. Primary Data ........................................................................................................................................... 20
3.4.2. Secondary Data ....................................................................................................................................... 20
3.4.3. Data Analysis .......................................................................................................................................... 21
Ethical Issues .......................................................................................................................................... 22 3.5.
RESULTS AND DISCUSSION .................................................................................................................... 25 4.
Digital Key Performance Indicators across Sectors in Kigali ........................................................ 25 4.1.
4.1.1. Digital Access and Use: Physical Digital Asset Ownership and Use in Kigali City .................... 25
4.1.2. Information and Communication Technology Clusters of Kigali ................................................. 29

viii
4.1.3. Spatial Pattern of Digital Access .......................................................................................................... 33
Digital Performance and Spatial-economic Variables....................................................................... 37 4.2.
Digital Bridge Policy Efforts: Institutional Adaptation to Universal Access Provision in Kigali 4.3.
City ............................................................................................................................................................ 41
4.3.1. Universal Access Project Setting: Nature of Projects and Actors Involved ................................. 42
4.3.2. Project Outcomes and Challenges ....................................................................................................... 44
4.3.3. Possible Policy-Initiative Measures from the Current Analysis ...................................................... 51
CONCLUSIONS AND RECOMMENDATIONS .................................................................................... 53 5.
Conclusions ............................................................................................................................................. 53 5.1.
Contributions to Policy .......................................................................................................................... 55 5.2.
Limitations and Future Research Directions...................................................................................... 56 5.3.
LIST OF REFERENCES ......................................................................................................................................... 59
ANNEXES .................................................................................................................................................................. 65

ix
LIST OF FIGURES
Fig. 2.1 Conceptual Framework .................................................................................................................................. 7
Fig. 3.1 Map of Kigali City Showing Key Urban Features .................................................................................. 18
Fig. 3.2 Alignment of ICTs with Economic Development Vision and Strategy in Kigali City .................... 19
Fig. 3.3 Methodological Framework ........................................................................................................................ 23
Fig. 4.1 ICT Performance of Kigali across KPIs, 2012. ...................................................................................... 26
Fig. 4.2 Overall ICT Performance of across Sectors, Measured by Location Quotient of Combined KPIs,
Kigali 2012 ................................................................................................................................................................... 28
Fig. 4.3 ICT Clusters/Groupings of Kigali 2012, based on K-means Clusters of KPIs ................................ 30
Fig. 4:4 Distribution of Status of Sectors in ICT Clusters of Kigali 2012......................................................... 32
Fig. 4.5 The Observed Spatial Pattern of ICT/Digital Access in Kigali 2012, Measured by Global Moran's
I Statistics ..................................................................................................................................................................... 34
Fig. 4.6 Local Moran's I Cluster Map of Intra-Urban Pattern of ICT Access in Kigali 2012 ........................ 36
x
LIST OF TABLES
Table 4.1 Descriptive Statistics of ICT KPIs of Physical Access/Ownership and Use (%), Kigali 2012 .... 25
Table 4.2 Characteristics of ICT Clusters (%), Kigali 2012 .................................................................................. 29
Table 4.3 Analysis of Variance (ANOVA) Statistics Showing the Influence of ICT KPIs on K-Means
Cluster, Kigali 2012 ..................................................................................................................................................... 33
Table 4.4 Summary of Test for Spatial Pattern of ICT Performance of Kigali 2012, ..................................... 34
Table 4.5 Mutual Relationships between ICT KPIs, Kigali 2012 ........................................................................ 37
Table 4.6 Relationships between ICT KPIs and Spatial-economic variables, Kigali 2012, 2013* .................. 38
Table 4.7 Key Components in Factor Analysis of Spatial-economic Variables**, Kigali 2012, 2013* .......... 40
Table 4.8 Typical/Representative Variables of Spatial-economic Correlates of ICT Access in Kigali 201241
Table 4.9 Digital Access Project Matrix, Kigali (Rwanda) 2016 (Cont.) ............................................................ 48
Table 4.10 Digital Access Project Matrix, Kigali (Rwanda) 2016 (Cont.) .......................................................... 49
Table 4.11 Digital Access Key Actors in Kigali (Rwanda) 2016; Main Role and Mechanism ........................ 50
Table 4.12 SWOT Matrix for Digital Access Policy-Initiatives in Kigali (Rwanda) 2016 ............................... 52

xi
LIST OF ACRONYMS
AED Academy for Educational Development
ANOVA Analysis of Variance
AU African Union
CD Community Development
CoK City of Kigali
CRMDTA Cumulative-Recursive Model of Digital Technology Access
CSR Complete Spatial Randomness
DIDIX Digital Divide Index
DOI Digital Opportunities Index
e-gov e-government
eIIx e-inclusion Index
FIQ Field Interview Quote
GIS Geographic Information Systems
GITR Global Information Technology Report
GoR Government of Rwanda
ICT Information and Communications Technology
IDI ICT Development Index
INSEAD Institut Européen d‘Administration des Affaires/European Institute for Business
Administration
ITU International Telecommunication Union
KIST Kigali Institute of Science and Technology
KPI Key Performance Indicator
KTH Swedish Royal technical University
LDCs Less Developed Countries
MDAs Ministries, Departments and Agencies
MINEDU Ministry of Education, Rwanda
MININFRA Ministry of Infrastructure, Rwanda

xii
MYICT Ministry of Youth and ICT
NGO Non-Governmental Organisation
NICI National Information and Communications Infrastructure
NISR National Institute of Statistics, Rwanda
NRI Networked Readiness Index
NUR National University of Rwanda
OECD Organisation for Economic Cooperation and Development
PPP Public-Private Partnership
PSD Private Sector Development
QoS Quality of Service
RDB Rwanda Development Board
RICTA Rwanda Information and Communication Technologies Association
RINEX Rwanda Internet Exchange
RTN Rwanda Telecentre Network
RURA Rwanda Utilities Regulatory Authority
SD Skill Development
SIBIS Statistical Indicators Benchmarking the Information Society
SIDA Swedish International Development Cooperation Agency
SRMP Smart Rwanda Master Plan
SWOT Strength Weakness Opportunities and Threats
TIDM Technology and Innovation Diffusion Model
UAF/P Universal Access Fund/Provision
UNDP United Nations Development Programme
UNESCO United Nations Educational, Scientific and Cultural Organisation
UNICEF United Nations Children‘s Fund
USAID United States Agency for International Development
USP(F) Universal Service Provision (Fund)
WB World Bank
WEF World Economic Forum

xiii


EXPLORING THE URBAN DIGITAL DIVIDE IN KIGALI; SPATIAL ANALYSIS AND INSTITUTIONAL ADAPTATION
1
INTRODUCTION 1.
Background and Justification 1.1.
Innovations in Information and Communications Technologies (ICTs) have transformed the economic
and social formations of cities, and hold promise of enhanced opportunities for citizens(Graham &
Marvin, 2001). However, disparities exist in the potential digital opportunities in terms of availability, use
and quality of ICT services among the population. For example, it is estimated that only 34% of
households in developing countries have access to the internet(UNDP, 2015). This kind of disparity has
been termed ―the digital divide‖, which according to Organisation for Economic Cooperation and
Development (OECD)‘s (2001) definition (cited in Vicente & López, 2011) refers to ―the gap between
individuals, households, businesses and geographic areas at different socio-economic levels with regard to
both their opportunities to access ICTs and to use the Internet for a wide variety of activities‖. Hence,
emerging ICT services in urban areas present a mix of opportunities and threat of exclusion of certain
segments of the city. Such exclusion stands a chance of going unnoticed given the invisibilities of digital
infrastructures and the relatively less attention paid to this new topic in urban geography (Graham &
Marvin, 2001).
Following the growing relevance of the digital divide as an element of urban inequality, attempts have
been made to account for its factors, often treating socio-economic variables(Eynon & Helsper, 2014;
Várallyai, Herdon, & Botos, 2015). Socio-economic strata have been found to be related to the digital
divide (Eynon & Helsper, 2014): women in Britain have fewer activities online and higher level of
education positively correlates with Internet skills and access. However, other studies explore the role of
geography, especially distance, centrality and agglomeration, in digital connectivity status and
usage(Terlouw & Denkers, 2011; Tranos, Kourtit, & Nijkamp, 2014). In a study conducted in China,
Tranos et al. (2014) employed a logistic regression-based method and found an inverse relationship
between distance (between pair of locations) and the probability of being mutually connected. Terlouw
and Denkers (2011) found core-periphery differentials in web usage and competitiveness in The
Netherlands and Northwest Germany. This has relevance for geography, at least for one thing: urban
geographers and neighbouring researchers, as observed by Graham & Marvin ( 2001), fear that digitality
could signal the death of space, that is the irrelevance of spatial factors in cyber cities, hence the possible
death of their own disciplines. This is rooted in the recency and near invisibility of telecommunication
services and tendencies to be viewed as being outside the domain of traditional urban studies. However,
other studies in economic geography have lent credence to the continued significance of spatiality in
digital information access and enablement(Graham, 2015), innovation, business clustering and the
emerging knowledge economies(Arribas-Bel, Kourtit, Nijkamp, & Steenbruggen, 2015; Johansson,
Karlsson, & Stough, 2007).
The study of urban digital divide is relevant to African cities for several reasons. In the emergence of cities
as an information entity, the cyberspace is fast becoming the new public realm, where those who lack the
resources to be connected are excluded from the benefits of information technologies (Loader, 1998). In a
spatial context, in the emergent networked cities the most likely new geographies are such that the
premium spaces are connected while the inactive spaces are bypassed (Graham & Marvin, 2001). Some
corroboration for this proposition is already found in Britain (Riddlesden & Singleton, 2014) and South
Africa(Jaglin, 2008). Besides, African countries occupy the lowest rungs in ICT Development Index, IDI
(International Telecommunication Union, ITU, 2016). It seems the existing socio-economic inequality

EXPLORING THE URBAN DIGITAL DIVIDE IN KIGALI; SPATIAL ANALYSIS AND INSTITUTIONAL ADAPTATION
2
could be replicated in the digital divide. Within the low performing countries in Africa, in terms of IDI,
Rwanda appears somewhere midway, 26 out of 39 countries and 154 out of 156 on a global scale in the
ITU ranking.
Rwanda has made remarkable progress in public utilities provision and urbanisation policies(Rwanda
Utilities Regulatory Authority, RURA, 2016). However, it performs low in terms of digital indicators.
Integrating elements of digital access into its ongoing efforts at intensifying urbanisation and e-governance
has potential for improving its performance. Although available indicators (ITU, 2016; RURA, 2016) give
a country-level view of digital performance, they have less relevance for intra-urban analysis. Therefore,
this study proposes a finer spatial scale of analysis of digital access in Kigali in order to determine the
pattern of distribution based on selected digital Key Performance Indicators (KPIs) and their relations
with spatial-economic variables1. The digital or ICT KPIs are used in this study to represent physical
access (that is household ownership of ICT assets such as radio, television, mobile phones and computers)
and use by location ( for example at home, office/school, cyber café). The study also seeks to understand
digital bridge interventions in Kigali City 2. These are used in this context as policy-anchored initiatives
that are aimed at providing and/or improving ICT access, especially targeted at the geographic areas and
socio-economic groups who are not connected or who have poor connection and use of ICTs.
Elaboration on digital bridge policies and their links with ICT access is presented in subsection 2.3.
Research Problem 1.2.
Although most studies of the digital divide have contributed to general understanding the phenomenon,
certain research gaps are identifiable. Firstly, most of them are only preoccupied with the measurement of
digital divide or seek to account for the phenomenon. Secondly, these studies are often conducted at the
macro-spatial levels: sometimes at regional scales (Vicente & López, 2011), exploring rural-urban divides
(Noce & McKeown, 2008; Whitacre, 2008) and even at country levels, especially those related to Digital
Opportunities Index(DOI)/IDI computation (International Telecommunication Union, 2014). Pick,
Sarkar and Johnson (2015) posit that apart from the focus on non-spatial multivariate analysis of the
digital divide which dominates the literature, those which explore spatial aspects seem to have a paucity of
insights into the digital divides at the urban level and are therefore less useful for urban analysis.
Additionally, very few studies have considered the state and role of institutional processes in bridging the
digital divide in the developing countries(see Madon, Reinhard, Roode, & Walsham, 2009), particularly
focusing on Africa; and none is available exclusively for Kigali at present amidst vigorous urbanisation and
ICT policy efforts.
A deeper understanding of the phenomenon, the urban digital divide, and contribution to closing the
research and policy gap would require a synthetic approach aimed at benchmarking digital divide at finer
spatial scales. For example, more detailed studies could improve such spatially-targeted projects as
Universal Access Fund, UAF (see RURA, 2016 for projects). Integrating spatial-economic analysis in a
single study and assessing institutional adaptation to the emerging challenges of digital divide have
potential for deepening problem understanding. Urban broadband infrastructure and access are part of
public utilities and should be incorporated into urban studies and policy.
1 Where ‗spatial-economic‘ is used in this study (as frequently applied throughout this work) it comprises spatial and socio-economic factors; in other words, combined geographic, demographic and economic factors. These have been fused in this manner in order to avoid clumsiness in capturing the factors collectively and frequently. 2 ‗Kigali City‘ and ‗Kigali‘ have been used interchangeably throughout this report. However, there is a sector (spatial sub-unit) of Kigali/Kigali City which is also named ‗Kigali‘ to which no specific reference was made in the work.

EXPLORING THE URBAN DIGITAL DIVIDE IN KIGALI; SPATIAL ANALYSIS AND INSTITUTIONAL ADAPTATION
3
Research Objectives and Questions 1.3.
1.3.1. Main Objective
The main objective of this research is to explore the spatial distribution and spatial-economic
correlates of digital divide in Kigali in order to contribute to its knowledge for urban digital bridge
policies.
1.3.2. Sub-objectives and Questions
1 To assess the digital performance of Kigali in terms of physical digital access and use.
What is the level of physical digital access and use in Kigali?
What are the distinctive spatial clusters of Kigali based on digital access indicators?
What spatial pattern is identifiable in the distribution of digital access?
2 To analyse the relationship between spatial-economic factors and digital
access performance 3
How are spatial-economic variables related to indicators of digital performance in Kigali?
3 To understand the efforts at improving the current state of digital access performance in Kigali
What are the key existing ICT access projects and who are the actors involved?
What are the achievements, strengths, constraints and prospects of these projects?
Which policy measures should be applied to improve digital performance drawing on the
analysis of the spatial-economic and ICT interventions?
Thesis Structure 1.4.
This thesis is organised in five chapters. The first chapter contains the introduction and justification,
statement of research problem and objectives of the work. Chapter 2 has the conceptual framework and
literature review. It contains the proposed conceptual framework: the digital divide (conceptual and
measurement issues). The literature review will discuss the spatial-economic determinants of the digital
divide, integrating contributions from multivariate and spatial analysis. It will present contributions from
the geography of information and innovation in exploring the digital divide, including ongoing discourse
on digitality and spatiality. The role of institutions (plans, policies, projects and actors) in ICT access
(bridging the digital divide) will be examined, with Kigali-relevant case studies from Africa and the
promise of ICT access in inclusive city development. In the third chapter, the methodological framework
will be presented and described, with reference made to relevant literature for guidance and method
validation. In the fourth chapter the research findings and discussion of results will be presented. Chapter
5 will summarise the lessons learnt and make recommendations for policy and future research.
3 Digital performance or digital access performance has been used in this context to capture the level of access, especially in a relative sense, as regards variance/variability/distribution across indicators and space. Hence, digital/ICT access and digital/ICT performance have been used in this study interchangeably, albeit the later connotes elements of relative applications.

EXPLORING THE URBAN DIGITAL DIVIDE IN KIGALI; SPATIAL ANALYSIS AND INSTITUTIONAL ADAPTATION
4
EXPLORING THE URBAN DIGITAL DIVIDE IN KIGALI; SPATIAL ANALYSIS AND INSTITUTIONAL ADAPTATION
5
CONCEPTUAL FRAMEWORK AND LITERATURE 2.REVIEW
The conceptual and measurement issues of the digital divide are examined in the first section of this chapter. In the section
that follows it explores the relations between digitality and spatiality: connections which have received remarkable attention in
earlier studies in geography of infrmation and spatial econometrics. Geography of information often espouses the continued role
of spatial factors in ICT utilisation and evolution of technological clusters. Alongside socio-economic and spatial aspects, the
role of institutions in bridging the digital divide will be presented: the discourse on the role of digital bridge policies. The final
part presents an outlook for ICT in inclusive city development.
The Digital Divide: Conceptual and Measurement Issues 2.1.
In the literature, several approaches exist which seek to conceptualise, measure and often explain the
digital divide. They often form the conceptual bases for the computation of ICT indices by the various
research communities. Some of the most widely used frameworks are discussed in this section, and then
the current study is hinged on those considered most relevant to guide the research.
One of the most widely employed frameworks is the Networked Readiness Index (NRI), also called
Global Information Technology Report, GITR, which is a joint project by Institut Européen
d‘Administration des Affaires/European Institute for Business Administration (INSEAD) and World
Economic Forum (WEF). An example is World Economic Forum/INSEAD's (2014) NRI . The NRI
conceptualises the digital divide using three key dimensions; environment (the ICT market and support
services, favorability of regulations and political stability) and stakeholders‘ readiness to adopt ICT and the
actual usage of ICT. It is a comprehensive framework which presents more than 50 indicators, under these
dimensions, on which countries are ranked. However, NRI has been criticised for its cumbersomeness,
inconsistency; frequently varying indicators(Pick et al., 2015) and arbitrary assignment of weights to
dimensions, which may not reflect local perspectives(Barzilai-Nahon, 2006). Nevertheless, NRI remains
one of the most-readily available and global ICT performance references.
Another well-known framework is the ITU DOI guide, for example ITU Guide or Framework for
Measuring ICT Access 2014 (ITU, 2014). The ITU measures the digital divide using the DOI guide, which
comprises three dimensions; opportunities, infrastructure and utilisation. Each of these is divided into
specific indicators for profiling access and performance. It covers household access and use by location
(home, school, cyber café and work) and socio-economic correlates (for example employment and
gender), which makes it multi-dimensional. Access in terms of any of the indicators means physical
availability, use and socio-economic conditions, which may motivate use or serve as barrier. Where access
to/use of ICTs (also termed digital access) is unequal across demographic and/or spatial groupings, it is
generally referred to as the digital divide. Hence, digital access and the digital divide are two sides of the
same coin. The ITU guide or framework, updated regularly, is most widely adopted and used by countries
as the official digital access performance indexing framework, monitoring and evaluation guide, and often
replicated at the country level for Universal Access/Service Provision (UAP/USP). However, it has a long
tradition of application at the national level and often silent on performance at subnational levels, even if
its indicators could fit well into the regions and cities where they are drawn. This is understandable since
the ITU focuses primarily on countries. The application of the framework for further profiling of the ICT

EXPLORING THE URBAN DIGITAL DIVIDE IN KIGALI; SPATIAL ANALYSIS AND INSTITUTIONAL ADAPTATION
6
performance of cities and towns within each ITU country falls, primarily, within the domains of the
individual countries.
The Technology and Innovation Diffusion Model( TIDM), developed by Rogers (1995), plays key roles in
temporal modelling of mobile phone adoption and use. It is suitable where timelines and hierarchy of
adopters (also known as users, senders and receivers, or agents) is of essence in longitudinal studies. Since
the TIDM seeks to predict adoption trends among agents, including behavioural and human influences, it
becomes difficult to model the true situation as the quantification of complex human relations is near
impossible. Coupled with this is the assumption of a unidirectional information flow (from innovators
through adopters to laggards), which belies reality. Despite the complexities and shortcomings of adoption
models (there are variants but they work in the same way), they are handy in behavioural studies of
innovation and technology diffusion; for example (Sahin, 2006) presents a review of the TIDM and
studies built on it.
van Dijk (2005) proposes the Cumulative-Recursive Model of Digital Technology Access (CRMDTA),
which captures the cycle of technology access. The stages are motivation, material access, digital skills,
usage and anticipated innovation. This framework is rich in its composition of elements of attitudinal
barriers or drivers of digital use (that is motivation), skills and usage. However, it is purely aspatial in its
framing. It was conceived in its original form as a socio-digital divide model. Nevertheless, where the
model is adapted in a spatially-oriented analysis of the digital divide such an exercise could gain insights
from its rich indicators and relations between them.
The Statistical Indicators Benchmarking the Information Society, SIBIS (European Commission, 2003) is
also recognised , especially within the European Union . The SIBIS Digital Divide Index (SIBIS DIDIX),
also termed e-inclusion index(eIIx), measures material access and use, and considers groups at risk of
digital exclusion; women, citizens aged 50 and above, low-income and low-education groups. Similar to
NRI, it assigns weights to indicators, which may not reflect the priorities of the users at subnational levels
(Barzilai-Nahon, 2006).
The variance in the frameworks discussed so far attests to the difficulty in conceptualising and measuring
the digital divide. The divergent theoretical leanings do not make any proposed framework ineffective but
reflect the multidisciplinary character of the topic. Hence, efforts have been made to harmonise
perspectives by the development of a multidisciplinary framework. Key among these is Dewan and
Riggins(2005). Their framework takes into account topical issues (dimensions, indicators and order of
access), spatiality (specifically, spatial level of analysis), theoretical leanings of research and method of
analysis (see Fig. 2.1). Although the framework is highly adaptive, it failed to capture third-order access,
which is the offline outcome of digital access, in its original framing. The absence of the third-order access
in their framework is understandable when placed within the context of its time. It was developed during
the early years of Internet in the 2000s; hence basic access was covered. Elaborate conceptual and
measurement references are available for digital skills(van Deursen, Courtois, & van Dijk, 2014; Van
Deursen & Van Dijk, 2010) and third-order access (van Deursen & Helsper, 2015) which could augment
the framework. These comprehensive frameworks or system of indicators of digital skills and offline
outcomes of digital access can be adapted for research targeted at digital literacy and participation,
especially in mature information society or advanced digital economies.

EXPLORING THE URBAN DIGITAL DIVIDE IN KIGALI; SPATIAL ANALYSIS AND INSTITUTIONAL ADAPTATION
7
Fig. 2.1 Conceptual Framework Adapted from Dewan & Riggins (2005)
Within the adapted framework of Dewan & Riggins (2005), the present study takes a bearing. It applies
the ITU indicator-type, explores the digital divide at an intra-urban unit (level of analysis) and fuses
spatial-econometric with institutional analysis in order to understand the underlying correlates of digital
access and policy initiatives/efforts at digital access in Kigali.
The conceptual framing of this study is justifiable. First there are variants of digital access dimensions and
indicators, all of which cannot be covered in a single study, except in large scale research at the behest of
international development agencies. Additionally, the indicators or aspects considered depend on the
theoretical perspective of the research. Hence, Barzilai-Nahon (2006) posits that in the study of the digital
divide, dimensions and indicators considered should be situated within the context of the case being
considered in terms of purpose and topic of analysis, spatial unit of observation(level of analysis) and
approach to indicators, which include the existing socio-economic and policy environment. For example,
it may be needless to engage in connectivity of users in the capital city of a developed country, in the true
EXPLORING THE URBAN DIGITAL DIVIDE IN KIGALI; SPATIAL ANALYSIS AND INSTITUTIONAL ADAPTATION
8
sense of physical access, since access in such a case would typically be well-developed. It could be justified
if it is aimed at relating physical access to such other aspects as attitude (for instance, security perception
which may demotivate use), digital skills, immersion and participatory outcomes. Second, the ITU
indicators to be applied in this study are highly adaptive, albeit little has been done to apply them at sub-
national levels, hence the need for urban research and policy-relevant analysis. The focus on the basic
access-order (indicators of first-order and second-order) is aimed at fitting the study into the context of
the stage of ICT development of the study area, Kigali City and understand relations with existing spatial
and socio-economic factors. Hence, within the known continuum of the geographies of information; the
geography of digital access and enablement, the geography of digital participation and the geography of
representation(Graham, 2015), the current study proceeds with the exploration of unevenness in basic
access and enablement. Third, it adopts a spatial-econometric method; integrates spatial and socio-
economic analysis, in line with earlier studies (Ghezelayagh et al., 2014; Holloway, 2005; Nishida, Pick, &
Sarkar, 2014; Pick et al., 2015) and aligns with the thinking that institutions matter in the study of the
digital divide(Howard, Busch, & Sheets, 2010; Madon et al., 2009; Pick & Sarkar, 2015). The synthesis of
spatial thinking and institutional perspectives is rooted in the premise that spatial analysis guides or should
guide public policy, in this case digital bridge policies. This argument is given credence by the fact that
most of the digital bridge policies are typically spatially-targeted, especially at poorly-performing
neigbourhoods or public organisations (see Madon et al., 2009; National Communication Commission-
Nigeria, 2016; RURA, 2016).
A specification of the spatial level of analysis (SLA), topical indicators (that is, digital Key Performance
Indicators, KPIs), spatial and economic variables, and institutional elements considered in this study are
presented in the methodology section.
Spatiality and Digitality 2.2.
In this study spatiality is used to capture the inherent or obvious relation between the spatial distribution
of socio-economic factors and level of development or performance of technological clusters, as regards
household access to ICTs. Digitality, a term derived from Negroponte(1995), in his seminal work ―Being
Digital‖, refers to the pervasive use of mobile telephones, wireless access to information and services on
the world wide web platform and the intensified technologically-mediated interactions and cyber-culture
among people.
Within the domain of internet geography spatiality-digitality relations have been explored (Crang, Crosbie,
& Graham, 2006; Graham, 2011, 2015; Graham & Marvin, 2001) and in economic geography/spatial
econometrics (Baum, Gellecum, & Yigitcanlar, 2004; Nishida, Pick, & Sarkar, 2014; Pick & Nishida, 2015;
Tranos et al., 2014). What cuts across these studies is the position that the spatial-economic status of any
given location is a driver of its share of ICT usage. Where interconnectivity of locations within and
between cities are explored (for example, Tranos et al., 2014) the distance between any give points
determines their probability of being connected.
In a reverse relation digital activities equally influence urban physical- and socio-spatial activities. In a
survey of 310 land use and regional planners ,Talvitie (2004) found that Finish planners perceived digitality
to reduce the effect of distance on urban activities through such ways as new means of mobile
employment and reduced transaction distances. This corroborates Graham and Marvin's (2001) position
that that urban geographers and neighbouring scientists and practitioners fear that digitality may signal the
death of distance/space, and by extension their own discipline. However, other scholars (for example
those earlier mentioned in internet and economic geography, and spatial econometrics) have consistently

EXPLORING THE URBAN DIGITAL DIVIDE IN KIGALI; SPATIAL ANALYSIS AND INSTITUTIONAL ADAPTATION
9
and diligently espoused the argument that spatial determinants will remain strong in the evolution of
technological clusters, access and use.
The possibility of the urban fringe dwellers to be excluded in the emergent spatial structure of the ICT-
enabled society is evidence of the instrumentality of space in digital access. On availability and quality of
service, in a space-time analysis of 4.7 million results of Internet speed across the European Union
between 2010 and 2013, Riddlesden and Singleton (2014) found that areas of varying spatial densities
experienced fluctuating speed and therefore quality of service(QoS) over time. The areas of higher
densities which are the urban hubs are associated with higher speed in contrast to the low-speed-
associated peripheries. Though the cases were drawn from the developed countries, these have relevance
for cities in developing countries, such as Kigali City, where peripheries are comparatively disadvantaged,
especially as regards innovation and infrastructure (see City of Kigali, 2013). On this ground, location is
seen to play a vital role in not only physical access but QoS. In congruence with this finding, urban peak
and off peak hours or alternatively daily mobility behaviour was found to drive the daily trends of mobile
usage and digital signature of the city; spatial footprint and trends of peak and off peak mobile phone data
usage (Reades, Calabrese, Sevtsuk, & Ratti, 2007; Steenbruggen, Borzacchiello, Nijkamp, & Scholten,
2013; Tranos et al., 2013). This is given credence by (Kelley, 2014) who posits that geo-social information
tends to be concentrated in the areas of high population density and commercial intensity, albeit with
pockets of relatively intense activities in sub-urban zones.
Using the 2007 census data of the United States of America in a multivariate regression analysis of 2
million farms in 3,070 counties, Basu and Chakraborty (2011) found that the existing geo-demographic
differentials, which accounted for unevenness in infrastructure access, were replicated in internet access
and speed among farmers selected from metropolitan and regional fringes. Specifically, non-metropolitan
service areas (nMSAs) in the southern part of the country were found to be dominated by farms with less
than 30% access to high speed internet.
Unequal access, rooted in stronger dividing geographic and demographic factors mean that the peripheries
would remain weak, less active in ICTs. Checking the strong forces of geography and demographics
entails employing policy intervention and collaborative instruments. This is examined in the next
subsection.
The Role Institutions in Bridging the Digital Divide 2.3.
In the context of this study institution connotes an aggregation of policies, projects, people (actors) and
practices/mechanisms involved in the quest to provide ubiquitous and better quality ICT service/access to
citizens in the focus area. Hence it captures the ICT ecosystem which comprises operators, regulators,
users and such intervening actors as development partners and NGOs who seek to reduce ICT access gap
at household, community and corporate levels.
In this study digital bridge policies refer to officially documented plans which are targeted at providing
and/or promoting ICT asset ownership, use and/or content across geographies and socio-economic
groups. These policies affect the provision and use of ICT asset directly while taking into cognizance the
expansion of infrastructure, enhancement of skills and other socio-economic correlates of digital access.
Digital bridge policies are used in this context in a sense similar to technology policies(Chary & Aikins,
2009) , ICTs policies (Graham, Ojanperä, & Friederici, 2017) and digital inclusion policies (Madon et al.,
2009), which have the ultimate goal of providing and improving ICT access, especially targeted at the
poor. These visions, plans and practices of bringing connectivity to the disconnected frequently involve
governments, private sector and NGOs (Andreasson, 2012; Graham et al., 2017). Digital bridge policies

EXPLORING THE URBAN DIGITAL DIVIDE IN KIGALI; SPATIAL ANALYSIS AND INSTITUTIONAL ADAPTATION
10
have one commonality; documented visions which are hinged on projects/initiatives aimed at connecting
the disconnected. In Kigali City (Rwanda), these policies are translated into action through ICT
projects/initiatives which cut across such themes as education, business, governance and community
development (Ministry of Youth & ICT Rwanda, 2015a)
Madon et al. ( 2009) applied the term ―digital inclusion‖ for digital bridge(ICT gap-closing activities of
actors through policies and projects) and ―institutionalization‖, which is defined as the process whereby
digital inclusion projects can become institutionalised through the establishment of structures of
symbolically accepted goals linked to relevant social activities and supported by appropriate material
resources‖(p. 97). In the present study, since the process of bridging the gap (institutionalisation) is
dynamic, the term ―institutional adaptation‖ is employed to capture the changing policy and multi-actor
efforts aimed at meeting these emerging ICT services and needs in a budding city, Kigali.
There are basically two-sided policies; demand-side digital access policies or supply-side digital access
policies. The demand-side focuses on ICT use. Hence it covers issues related to enhancement of or
restriction on uses through such policy instruments as incentives (for example subsidy and broad content)
or restrictions (for example censorships) respectively. However, the political environment determines
regulatory strictness, terms of information access and digital content. World Bank Group (2016)
recognises that in exercising use control the regulator often faces the dilemma of liberal or restrictive
access. Where unfiltered content access is allowed, even in cases where use is in mainstream service; e-
urban governance, economic and social-political (civic) participation, the government may be a little
insecure about the volume of information available to its citizens. Where, on the other hand, content
access is heavily restricted, the government risks resistance from the citizens and non-state actors,
especially freedom of information and transparency advocacy groups.
The supply-side focuses on the overall ICT provision such as Universal Access Provison(UAP) or physical
coverage (as regards served and underserved areas), QoS, competitive pricing (comparative billing),
operator market dominance, spectrum allocation, technology deployment, tax and levies, cost issues and
interoperability (operators information and infrastructure sharing). On the all-important issue of pricing
and affordability the approach is quite indirect; since service provision is unbundled the government
cannot fix price. The strategy is often targeted at ensuring wider and mass coverage, favourable tax
regimes and reduced transaction cost (for example through access to land and fast tracked permit
processing) and investment security. These have long term user-base growth, cost lowering effect and
robust competition and consequently reduced consumer price.
On the melting point of use (that is, demand) and provision (supply) especially as regards availability,
volume consumption and quality of service, World Bank Group (2016) broaches the question on
commodity status of ICT; whether ICT (Internet access, for instance) should be considered a public or
private good. This is complicated on grounds that a generic consideration could lead to some conclusions
that Internet access, essential in nature, by an individual may not necessarily reduce its availability to
another, in which case it could easily pass for a public good. However, use of ICT infrastructure and
service such as base stations or digital content by an individual may reduce service availability and quality
to another user, for example, through traffic channel congestion and delayed or distorted content. Given
the large scale investment in human capital and technology, and complex processes required to maintain
an acceptable service level, which often the public sector cannot or does not provide, the ICT service
sector is typically unbundled and hence the commodity easily passes for a private good. This presents
another dilemma which is explored here in the context of Kigali (Rwanda).

EXPLORING THE URBAN DIGITAL DIVIDE IN KIGALI; SPATIAL ANALYSIS AND INSTITUTIONAL ADAPTATION
11
In Rwanda, the National Government strives alongside the districts to ensure wider telecommunication
service coverage, quality and affordability through regulatory instruments. In 2003, the Universal Service
Provision(USP) was established to pursue this goal, in line with World Forum for Information Society
(See RURA, 2016). However, the government does not provide the service directly to citizens. The
operators prioritise locational efficiency, network optimisation and revenue maximisation. The cities and
villages stand the risk of splintered networks; service concentration on premium locations and systematic
exclusion of less economically viable areas as a result of telecommunication sector unbundling(see
Graham & Marvin, 2001).
Basically two scenarios could unfold. There could be a completely deregulated, unbundled tele-service
provision. An alternative could be an unbundled sector with positive interventions, incentivisation and
compliance to reach inactive spaces, even as government seeks to run state service provision. Each of
these has spatial-economic and social significance for the players. Whatever the case or choice, private
investments must not be jeopardised; investors and development partners must not be demotivated. The
poor must not be excluded from the cyberspace. Digital inclusion typically requires convergence of
interests, rescaled priorities, objectives setting and collaboration. Other players have critical roles to play as
well. Institutional interventions (that is policy initiatives) therefore become critical for ICT service gap
closing. This involves collaborative problem-solving and tradeoffs in this multi-actor system.
The essence of policy initiatives is illustrated by Villasenor et al ( 2015) in a study conducted to assess
digital service uptake for commercial transactions in selected developing countries, where they found
geography mattered less than policy in digital service performance. This is rooted in the fact that policy, in
particular, and overall strength of institutions (including commercial operators, intermediaries and users)
played roles in reducing the spatial and socio-economic gaps in ICT access. The report presented by
Villasenor et al., (2015) revealed that farmers were very much involved in mobile money adoption and
usage, with embedded local content, even if these, as often is the case, are not in the formally highly
educated segments of society. Where service provision and regulatory environment are favourable for
operators and user-inclusive, geographic and demographic divides are heavily reduced. Hence sound
policy choices in an environment which has committed and collaborative actors can always break spatial
and demographic barriers.
Evidence of success of digital bridge policies and enablement is available for Rwanda (ITU/UNESCO,
2015; Luca, Sahy, Joshi, & Cortes, 2013). Although Odufuwa, (2012) reported a relatively less impressive
performance rating in mobile telephone ownership for Rwanda(24.4%) in an Africa-wide study (12
countries) exploring the demand- and supply-sides of broad band penetration, Rwanda was rated best in
perceived policy and regulatory effectiveness. In terms of ownership it came next to the least-performing
of the countries surveyed at that time, Ethiopia (18.3%) while South Africa topped the chart at 84.2%. In
mobile money service penetration, Rwanda‘s performance lied mid-way at 3.3% with Kenya topping the
chart (60.3%) and Ethiopia at the bottom (0%). With continued policy efforts mobile phone penetration
in Rwanda currently stands at 77.8% (Lancaster, 2016; RURA, 2016a). However the figures are lumped for
the entire country, thereby obfuscating distinction between such local ICT and innovation clusters as
Kigali City and other cities on the one hand, and within the cities on the other. In mobile transaction
services, it was reported that policy initiatives in Rwanda raised financial inclusion target to 90% by 2020
to redress the current state where 52% of adults are financially excluded((Villasenor et al., 2015). This
could be linked to the SRMP; the recent rigorous pursuit of the Smart Africa Initiative (piloted and driven
by Rwanda) designed with the vision to connect, innovate and transform communities in terms of ICT
adoption, usage and immersion. SRMP covers areas of broadband access, economic policy, political and
technological environments of Rwanda.

EXPLORING THE URBAN DIGITAL DIVIDE IN KIGALI; SPATIAL ANALYSIS AND INSTITUTIONAL ADAPTATION
12
These efforts hold promise for movement towards knowledge-based economy, driven by cities which
typically serve as the ICT hubs. Some contributions to the literature on the state and outlook for ICT in
inclusive, knowledge-based development are presented in the next section. These are expected to deepen
understanding of the promise of ICT for the city.
The Outlook: Information and Communication Technologies in Inclusive City Development 2.4.
As urban economies become increasingly information technology-driven it is expected to transform the
transactional experience of and create a range of unprecedented opportunities for users across geographic
and socioeconomic strata. Even where the gains of the emergent digital economy are certain, inclusiveness
in digital dividends is not a given. As a corollary of this argument, Butcher (1998) reported that ICTs were
gaining traction in development process through community ICT service centres in South Africa. The
study examined the use of ICTs in education and training through policy initiatives. He found, based on
qualitative analysis, that the socioeconomic character of access depicted a continuing gap between the
well-off and the deprived segments. He emphasised the disequilibrium in ICT education and affordability
and recommended that gap closing mechanisms should incorporate issues of ICT-embedded education
and cost-effectiveness to spread the gains of emerging technologies. Butcher‘s observation becomes more
relevant when viewed against the background of the continuing exclusion of the marginal areas, which
often are also the socioeconomically least resourced.
A recent study by Villasenor, West and Robin (2015) corroborates the position. In an assessment of the
digital inclusion projects in 21 selected developing countries they used key elements such as country
commitment, e-financial transactions and participation criteria and found that access to financial services
provided opportunities for individual prosperity and economic enhancement. Besides, it was found that
improvement in affordability and coverage of the hitherto underserved areas encouraged marginal groups,
especially women, to embrace digital financial services, particularly mobile money.
Beyond the generic mention of the role of ICTs in city fast-tracked urban service access, citizen
transactions and participation in development activities, concrete cases of success exist. ITU/UNESCO
(2015) in the State of Broadband Report presents an account of ICT use in Argentina and Rwanda, the most
relevant cases for this discourse. In the case of Argentina it was reported that a joint smart education
project with UNICEF enabled school attendance rate monitoring system. With the availability of mobile
phones, which were integrated with Education Information System, the school principals were informed
about the attendance rates and tendencies of students. This enabled the authority to take prompt
disciplinary measures. In the case of Rwanda, as reported in the study, water quality was being monitored
with the aid of sensors and information disseminated via mobile short message services. This is one of the
features of Smart Africa Project which is being piloted in Rwanda, with ICT-enabled urban service
integration, green economy and enhanced citizen information service transactions.
In concrete econometric terms, WEF/INSEAD (2015) in Global Information Technology Report(GITR)
built on existing literature to establish that once a critical threshold of 20-24% digital penetration is
reached, a Gross Domestic Product(GDP) growth of 3% could be achieved with a 10% increase in
investment in telecommunication infrastructure. This is of especial importance to Kigali where ICTs have
continued to receive strong policy and investment commitment through consistent multi-year strategies
and Smart Rwanda Master Plan(SRMP), with the latest being SRMP 2015-2020 (Ministry of Youth & ICT
Rwanda, 2015b).
On the promise ICT for urban resilience, recent mainstream studies recognise its role, particularly in
climate change governance and e-resilience in Costa Rica (Ospina & Heeks, 2015) and the proposed

EXPLORING THE URBAN DIGITAL DIVIDE IN KIGALI; SPATIAL ANALYSIS AND INSTITUTIONAL ADAPTATION
13
Sustainable Development Goals, SDGs(UN-Habitat, 2015). The Costa Rica case study is based on the
Resilience Assessment Benchmarking and Impact Toolkit (RABIT) which measures ICT impact on
livelihood and coping capabilities across selected resilience components such as learning, flexibility and
diversity. It was found that mobile ICT usage had positive impact on recovery from shocks and stressors.
Where ICT plays a key role in the ability to recover, adapt and transform amidst stressors, it is considered
e-resilience (Ospina & Heeks, 2010). If this holds, then the rebounding Kigali is a relevant case in point,
given its recent experience of civil unrest and fast-paced recovery hinged on ICT-driven urbanisation
policies, for instance, SRMP.
Elsewhere, the UN-Habitat officially recognises the role of ICTs in the New Urban Agenda,
incorporated in the proposed post-2015 Sustainable Development Goals (SDGs). With special
reference to the proposed goal 11: Making cities and human settlements inclusive, safe, resilient and
sustainable, ‗ICTs are increasingly recognised as an integral of the SDG process. Modern
technology is widely accepted as a way of enabling and measuring the SDGs and is linked with
the Open Working Group‘s Outcome Document in Goal 17 on enhancing the use of enabling
technologies and in the report by the Expert Group on Digital Revolution: Means of
Transformation; Harnessing Broadband for Post-2015 Development Agenda’(UN-Habitat, 2015, p. 2). This
justifies the role of ICTs as urban innovation and inclusive development enablers.
Placing Kigali within the context of urban socio-economic resilience, ICT (especially household-user
access) could enhance value chain in terms of income diversity and redundancy (multiple sources
and surplus from safety nets), employment generation (also relates to diversity, redundancy and
flexibility), information and education, transactional flexibility and rapidity, and multi-actor
participation and inclusiveness.

EXPLORING THE URBAN DIGITAL DIVIDE IN KIGALI; SPATIAL ANALYSIS AND INSTITUTIONAL ADAPTATION
14

EXPLORING THE URBAN DIGITAL DIVIDE IN KIGALI; SPATIAL ANALYSIS AND INSTITUTIONAL ADAPTATION
15
RESEARCH METHODOLOGY 3.
In this chapter background information on Kigali City is presented to give insights to the context of the problem being
examined, and the analysis and discussion that follow later in the work.
Case Justification 3.1.
Kigali, a population of 1, 132, 686, is selected as a case study given its well-articulated urban development
plans, in which ICT has been identified as a cross-cutting and major component, in line with ITU
Universal Service Provision/Fund (RURA, 2013; 2016). This entails ICT integration with urban planning,
health, through tele-medicine, business and education. Besides, it has a forward-looking plan, Kigali 2040
(City of Kigali, CoK, 2013). However, Kigali (Rwanda) is relatively behind in ICT ranking, and internally
some of the areas are poor in terms of access and usage, compared to neighbouring countries (ITU, 2016;
RURA, 2013). Apart from general descriptive data and public opinion, no scientific spatial analysis of the
problem under investigation is available for Kigali, even if ICT is recognised as a major focus of the
Universal Access Fund, being the economic and technology hub of the country. This section presents
brief background information on the existing socio-economic condition, especially within the context of
youth and ICT, and planning/governance of Kigali City.
3.1.1. Socio-economic Condition of Kigali City
Kigali justifies its urban hub status in Rwanda as it generates up to 50% of the country‘s GDP, through
activities spread mainly across agriculture, industry and services, which contribute 5.5%, 32.6% and 61.9%
respectively(National Institute of Statistics of Rwanda, NISR, 2012 cited in Rwanda Environmental
Management Authority, 2013). The service sector comprises wholesale and retails, transport, ICT, finance,
real estate and technology consulting, which are concentrated in the Central Business District. Kigali City
has areas with specialised functions: Gasabo District is the administrative hub, Nyarugenge(financial hub)
and Kicukiro(knowledge/ICT hub). This is indicative of the service-inclination of the city, which contrasts
the rest of the country: composed of manly rural farm-activities.
The pursuit of knowledge-based economy hinged on the education and services sectors underscores the
relevance of youth education and enrolment. In Kigali City, youth educational attainment is 33% and 11%
for secondary and university education respectively(NISR, 2014). It therefore poses a challenge for driving
the services sector, which typically demands intensive knowledge and skills. The situation becomes more
challenging when viewed against the background that Kigali City represents a paradox in terms of the
relation between education and youth employment. For instance, (NISR, 2014) reported that the youngest
(of the youth), 14-19, have the highest Labour Force Participation Rates (LFPRs) if they are uneducated.
The young population within age 20-24 maintain up to 80% LFPRs if they have primary school education,
as the situation worsens through secondary education to the university graduate cohort, who experience
further delays in labour market entry. This worst-hit segment has an employment rate of 17%.
The case of the unemployed cohort becomes even more complicated considering the fact that they live in
a city which has been reported to have a fairly lower level of poverty. As at 2012, Kigali City had a poverty
rate of 15%, with 92%, 90% and 74% living above the poverty line in Kicukiro, Nyarugenge and Gasabo
Districts respectively(NISR, 2012). However, poverty, as used in the report has a local context, being a
situation in which an adult cannot afford non-food items because of insufficient money. Being educated

EXPLORING THE URBAN DIGITAL DIVIDE IN KIGALI; SPATIAL ANALYSIS AND INSTITUTIONAL ADAPTATION
16
without economic empowerment poses a challenge for individual well-being, creativity and piloting the
technology-driven and emerging service economy. This calls for efforts at linking skill development with
local economic strategy, especially targeted at self-empowerment, since labour supply by those who have
attained the higher cadre of education outstrips demand. The situation has led to social protection
programmes targeted primarily at the unemployed youth and women, in which ICTs have been recognised
to help improve existing urban economic situation and create new opportunities through innovation-
based start-ups and scale-ups (Ministry of Youth & ICT Rwanda, 2015b).
3.1.2. Urban Planning and Administration in Kigali City
Kigali City accounts for 50% of the urban population of Rwanda, a country which is composed of 16.5%
urban population. This makes Kigali City a relevant hub of innovation and development in the country;
moreso where a city is officially defined, in Rwanda, as a settlement with at lesast 200, 000 inhabitants.
Others are municipalities, between 30,000 and 200, 000 and agglomerations, between 10, 0000 and
30, 000 (Ministry of Infrastructure Rwanda, MININFRA, 2015).
Kigali City is divided into three Districts: Gasabo, Kicukiro, and Nyarugenge. These Districts are further
divided into 35 sectors and 161 cells, and the cells are sub-divided into 1,061 villages. The 2006 Organic
Law No. 10 established the City of Kigali as a local government with administrative, legal and financial
autonomy(City of Kigali, 2013a). The city development is guided by its multi-term spatial development
plan, City of Kigali Development Plan (CKDP): the current one is CKDP 2013-2018. While the city has
autonomy, such is always exercised in congruence with national spatial development culture and plans.
This is because Rwanda operates a top-down but well-coordinated planning framework, in which the Law
Governing Planning and Building in Rwanda 2012 is the overarching legal reference for urbanisation in
the country (MININFRA, 2015). The Law Governing Planning and Building sets procedures of urban
development management and technical implementation aimed at supporting coordinated, sustainable and
inclusive development. Although many Ministries and Agencies (MDAs) participate in the pursuit of
urban development in Kigali City, including Ministry of Local Government, which is the parent ministry
of City of Kigali Council, the MINIFRA takes the lead and therefore coordinates the activities related to
urban development.
While spatial development strategies conceived at the national level, implemented at the city levels,
provide broad guidelines for such planning themes as land use management, urbanisation and
infrastructure, they do not capture the condition effectively at the district ands sector levels. This gap is
filled by One Stop Centres at the district level, who are the facilitators of urban planning: permits,
approvals, certificates and land registration; they work under the supervision of the district
governments(City of Kigali, 2013a). The districts in turn use the sectors as the immediate spatial unit of
implementation, which makes the latter critical for both spatial and socio-economic development. They
serve as a link between the cells and the mainstream city. The significance of the 35 administrative sectors of
Kigali City is also rooted in the fact that they meet the country‘s minimum standard for classification as
agglomerations (at least 10, 000 people) and form the foundation intra-urban units for strategic spatial-
econmic developement. However, these are based on a single-indicator classification, population. These
administrative units, applied in this study as the Spatial Level of Analysis(SLA), are frequently used as
‗sector(s)‘ throughout.
Kigali City has a clearly defined structure for its daily urban administrative activities. It is governed by a
City Council (City of Kigali Council/Kigali City Council, KCC) which comprises 31 Councilors who are
elected for a five-year term. This council formulates its local regulations and laws, drawing on the
reference frameworks of the parent ministry, MINALOC. The actual functioning of the City of Kigali
EXPLORING THE URBAN DIGITAL DIVIDE IN KIGALI; SPATIAL ANALYSIS AND INSTITUTIONAL ADAPTATION
17
Council is anchored on a Bureau which comprises a Chairperson, Deputy and Secretary. The political head
of the council is the Major, who alongside two Deputies form the Executive Committee, to oversee the
day-to-day government business of KCC (City of Kigali, 2013a, 2017).
While Kigali City has clear plans and well-established structures for spatial development, its ICT sector
(activtity) depends heavily on the national ICT policies, projects and MDAs. The Ministry of Youth and
ICT (policy formulation), Rwanda Development Board (project implementation) and RURA (ICT sector
regulation) are the key government agents in issues related to ICTs in the country. Although decentralised
ICT policy formulation and project implementation could facilitate innovation transfer, domestication and
use in local contexts, Kigali City cannot be considered to be one of the most adversely affected by the
current centralised system: it doubles as a provincial-city and the seat of national government. It is
frequently being positioned as the country‘s competitive regional hub. This is evidenced by its record of
innovation in public sector operations and service delivery. For example, City of Kigali (2013a) reported
that the city had installed an internal document tracking system for real time sharing among employees,
thereby facilitating decision-making; upgraded corporate websites, connected to fibre-optic-enabled
Internet across agencies and had an initiative to provide every employee with a laptop. In addition,
Management Information System has been installed for urban planning to facilitate construction licence
application. The aspect of laptop for employees and broadband access in the local authorities is of especial
significance for ICT access in Kigali City and this study since household access to Internet in offices is one
of the indicators adopted for measuring digital access. In addition, fast-tracked planning transactions could
also have positive implications (time and money cost reduction) for telecommunication service providers,
who are involved in multi-location activities and frequently request permits for physical construction,
especially underground cables and base transceiver stations.
Spatial Level of Analysis 3.2.
In the study of the digital divide, the spatial level of analysis is important since it determines the degree of
aggregation or otherwise of data and influence resolution of results (Pick, Sarkar, & Johnson, 2015;
Dewan & Riggins, 2005). In this study the 35 sectors of Kigali City (Fig 3.1) are selected as intra-urban
units of observation. Such intra-urban units of observation and analysis have added value since the
proposed study has primary relevance for urban research and policy applications, in contrast to national
and regional domains, where regional- and city-level of observations and analyses are more relevant(Pick
& Sarkar, 2015)

EXPLORING THE URBAN DIGITAL DIVIDE IN KIGALI; SPATIAL ANALYSIS AND INSTITUTIONAL ADAPTATION
18
Fig. 3.1 Map of Kigali City Showing Key Urban Features
Input Data from Ministry of Infrastructure Rwanda (2016)

EXPLORING THE URBAN DIGITAL DIVIDE IN KIGALI; SPATIAL ANALYSIS AND INSTITUTIONAL ADAPTATION
19
Information and Communication Technologies within the Economic Development 3.3. Framework of Kigali City
The pursuit of innovation and technology has been at the core of policy in Kigali City, evidenced by the
multi-term ICT policy, Smart Rwanda Master Plan(SRMP), which envisions the country as a regional
innovation hub by 2020. This is anchored most importantly on Kigali City. It seeks to jumpstart the
country‘s development status from a low income, poverty rate at 30% from 60% in 2000, to middle
income economy in 2020 (Ministry of Youth & ICT Rwanda, 2015b).
The formulation of innovation-targeted and innonvation-driven master plans such as the SRMP is rooted
in the understanding that what actually makes for a thriving agglomeration is diverse, beyond population.
In the emergent technology-mediated economy, typically driven by cities, this entails, among other things,
a strong urban foundation in terms of infrastructure, competitive human capital, ICT-enabled
communities, multi-actor participation and shared/inclusive prosperity. This becomes critical when
viewed agianst the background that ICT for Development(ICT4D) is enschrined in the SRMP, which
specifically identifies cities as one of its seven pillars; others are smart agriculture, health, education,
business and industry, finance and government, all of which have significance for the urban population.
These are seemlessly-embedded in the SRMP, a component of the official multi-term Economic
Development and Poverty Reduction Strategy(EDPRS); see Fig 3.2. The relevant ICT policy initiatives are
discussed in Chapter 4 of this study.
Fig. 3.2 Alignment of ICTs with Economic Development Vision and Strategy in Kigali City 4
Adapted from Ministry of Youth & ICT Rwanda (2015b)
4 This is adapted from a country-wide strategy. It is relevant for Kigali City, which is the key driver of innovation and seat of national policies such as National Information and Communications Infrastructure Plans (NICI I-IV).

EXPLORING THE URBAN DIGITAL DIVIDE IN KIGALI; SPATIAL ANALYSIS AND INSTITUTIONAL ADAPTATION
20
The strive for innovation in Kigali City has been reported to have set the city on the part to improved ICT
use and economic performance. Rwanda, anchored on Kiglia City, has been reported to earn a Networked
Readiness Index(NRI) of 83 out 143 (World Economic Forum/INSEAD, 2015). However, the city is not
a physical and socio-economic monlith; differentials exist in terms of geographic constraints, lifestyles,
education and infrastructure distribution, especailly electricity (City of Kigali, 2013); also see Fig. 3.1.
Understanding internal variations in the setting where all critical pillars of development are anchored on
ICTs mainly forms the motivation to conduct this study of the digital divide at the intra-urban level.
Therefore, it further lends credence to the use of its minimum strategic agglomerative base (sectors as
SLAs) to unveil spatial differences in digital asset and use linked to the underlying socio-economic
conditions and ICT policy initiatives. Being technologically-ready to reap the gains of e-urban governance
and kowledge-based economy would depend on the level of equipment and performance of the city and
citizens at micro-spatial levels; only then can there be an inlusive ICT-enabled city.
Data Collection and Analysis 3.4.
3.4.1. Primary Data
Qualitative data was collected through semi-structured interviews administered to the telecommunication regulator (RURA), MYICT, one private operator in the telecommunication sector(Airtel), three NGOs; Rwanda Telecentre Network(RTN), One Laptop Per Child(OLPC) and Rwanda Information and Communication Technology Association/Rwanda Internet Exchange (RICTA/RINEX) working on officially-recognised digital bridge projects in Kigali. The selected NGOs were not nominated by any government agency but only verification was sought from official sources and through community projects they had implemented. Interview helped to enrich background knowledge and dynamics of telecommunications service, policies and projects from multi-actors in Kigali City ICT ecosystem. They helped to understand policy papers and other documents which were analysed.
Semi-structured interviews were in form of questionnaires and captured in audio recording to ensure no
response was missed. The only exception was one case in which the respondent chose to provide written
responses, owing to corporate preference and security concerns. Semi-structured interviews are flexible,
and allows for a deep and rich communication(Edwards & Holland, 2013; see also Bryman, 2012). Unlike
structured interviews, the outcome of these semi-structured interviews was not intended for quantitative
statistical analysis. The audio recording was manually transcribed for textual citation and extraction of the
underlying meaning of responses. Textual data played two key roles in the discussion. First, it helped to
understand the general ICT policy environment rooted in insider accounts; as ground truthing of policy
documents and claims. Second, it helped to place the discussion in context, where strong statements were
made or findings were presented; for example in accounting for the constraints of policy initiatives it
could otherwise have been generic or bland. Institutional analysis enables the understanding of the nature
of projects, stability and dynamics of digital bridge institutions, their linkages to social activities, and
material and resources committed to such projects(Madon et al., 2009). Hence the structure of the
interviews was such that it reflected three components which relate to the third research sub-objective and
its corresponding questions; project setting and governance(relates to nature of institutions), outcomes
and challenges and prospects of UAP( relates to achievements, prospects and constraints).
3.4.2. Secondary Data
The digital access data collected for this study is based on ITU ICT access guide (ITU, 2014). Key ICT
indicators were used in this case. The indicators on which data were collected (for the sector) are
households who own a mobile phone(%), households with fixed land lines(%), households with
computer(%), households with Internet at home (%), households with Internet at work/school(%),

EXPLORING THE URBAN DIGITAL DIVIDE IN KIGALI; SPATIAL ANALYSIS AND INSTITUTIONAL ADAPTATION
21
Households who use Internet at the cyber café (%) and Household Internet use from other sources, not
specified (%). The source of the digital KPIs is the National Institute of Statistics Rwanda (NISR), census
released in 2015. Therefore, the indicators for which data was collected is relevant for the case study. The
topic, that is access indicators selected and used for digital divide exploration, should fit the stage of ICT
development and ICT access-order of the case study being researched(Barzilai-Nahon, 2006; Dewan &
Riggins, 2005). Since Kigali City is expected to be at the rudimentary stage of digital access the basic
indicators of physical access and Internet use are sufficient to explore the pattern of ownership and usage
at this stage.
Socio-economic (SE) data was collected for confirmatory analysis (to ascertain the relation between ICT
performance and SE and spatial variables). The SE data that was used includes youth population(%),
elderly population(%), employment by status (%), employment by type(%), gender(%), education by
level(%), female household headship(%), house ownership (%), improved water source(%) and electricity
access (%). Spatial variables are share of total population, urban population, number of innovation centres
(schools, at least secondary), natural constraints (% of sector constrained geographically), planning/design
status (%). Socio-economic (SE) and establishment data (innovation centres/post primary schools) was
sourced from NISR, data on geographic constraint was collected from The City of Kigali Master Plan
(City of Kigali, 2013b). Age and education components could give insights into the mutual association
between cognitive and social activities (especially education and learning) and ICT access, especially as
regards the digital natives (millennials), who are regarded as strong agents of digitality (Prensky, 2001).
Gender could help reveal the possible inequality in access to ICTs. Access to physical facilities such as
water and electricity could also have some relation with ICT indicators, as equally expected of economic
geographic/spatial factors.
3.4.3. Data Analysis
ICT Location Quotient (ICTLQ) was used to determine the performance of the sectors in digital access. It
was computed as the share of ICT for each sector relative to city performance (see Annex, A2). This is
indicative of ICT-orientation and specialisation of each sector. The overall ICT score for each sector, ICT
LQ Aggregate (LQICTagg), helped to determine ICT-basic (concentration) and ICT-non-basic (sparsity)
sectors. LQ is widely recognised and used in economic geographic analysis of variables to determine the
relative regional performances and concentrations of such variables as employment shares and
technological determinants(Burger, van Oort, & van der Knaap, 2010; Martin, 2012; Smit, Abreu, & de
Groot, 2013; US Bureau of Labour Statistics, 2011). There are specific applications in Internet geographies
in the frame of ICT Location Quotients (Song, 2008) and Internet Consumption Quotients (Zook, 2001),
especially using domain names inventory at macro-spatial levels.
Spatial analysis was conducted using digital access based on output of cluster analysis. In relation to sub-
objective one (research question 2 and 3) the spatial-statistical methods used were Cluster Analyses(CA);
spatial grouping of sectors based on the digital KPIs and test of the significance of Complete Spatial
Randomness (CSR) of distribution pattern of digital KPIs; which helped to establish the extent to which
the observed spatial pattern is clustered. K-means clustering is widely used in spatial analysis to group
observations into similar clusters such that within-group difference is minimised and between-group
difference is maximised (Rogerson, 2015). Not only did the CA help in spatially defining the ICT clusters,
it also became handy as a tool for determining the influence of the individual indicators the ICT spatial
classification using the ANOVA F-statistics and determining cluster centres. The cluster centres give
insights into heterogeneity with groups; showing which sectors are typical representatives of each ICT
cluster. GIS software was used to visualise spatial distinctive clusters based on the attributes exported
from CA output.

EXPLORING THE URBAN DIGITAL DIVIDE IN KIGALI; SPATIAL ANALYSIS AND INSTITUTIONAL ADAPTATION
22
Moran‘s I enables the test of the extent of clustering; confirms or invalidates the assumption that
distribution of ICT utilisation is completely spatially random (see Pick et al., 2015). In the case of Kigali
City, the LQICTagg was subjected to test in order to determine the extent of clustering and then to
establish the existence (or non-existence) of the digital divide in the city. This is based on the assumption
that if the digital divide were non-existent in Kigali City the spatial distribution would be random.
However, the Global Moran‘s I assumed Kigali City to be a single unit as it captured the global
distribution of ICT access across the city; the exact spatial units or existence of co-types was not reflected
at the intra-urban level. Hence, the Anselin Local Indicator of Spatial Association, LISA (Anselin, 1995)
was employed to show the significance of clustering of ICT co-types within the city.
Correlation coefficients of digital KPIs and spatial-economic variables were computed to generate matrix
of correlates of the digital divide. This helped to confirm the variables which are associated with digital
access in the case study and aid the understanding of the underlying socio-economic and spatial contexts
in which digital performance could be high or low. This does not however seek to investigate and ascribe
cause-effect relationships. Given the multiple socio-economic and spatial indicators explored as correlates
of the digital divide, Factor Analysis (FA) was applied to reduce the data in order to determine key factors
of the distribution. The eigenvalue was set at 1 as cut-off for Principal Components (PCs) selection; the
most representative of the dimensions was determined based on Rotated Component Matrix.
Policies and project analyses were conducted qualitatively based on policy documents and actors‘
interviews, in order to address objective 3: organised efforts at improving digital access in Kigali City.
Policy initiative matrix was developed showing projects profiled using 10, mainly qualitative, attributes;
Spatial Level of Conception, Theme/Focus, Geographic Target, Demographic Target, Goal, Project
Typology, Primary Actor(s), Secondary Actor(s), Reported Outcomes and Challenges/Constraints. SWOT
analysis was conducted covering relevant policies and projects for which data was available at the city
level, otherwise national policies and projects were placed in the city context.
Ethical Issues 3.5.
Interviews with regulators, operators and NGOs could be considered sensitive as they sought information
on aspects of policies and projects, and actors‘ roles and relations. However, specific questions on cost or
budgeting were not treated in this work, which made it less sensitive. In addition, sensitive questions, such
as actor relations, were carefully presented and responses were not forced from the respondents. Actors
interviewed only obliged to grant such interviews acting in official capacities and directives; as such their
accounts were agreed to be treated as those of the group(s) which they represented. Besides, policy
documents required for learning about Universal Access Provision (UAP) and plans treated were
authorised and used with due acknowledgement and referencing. In both cases of interview and document
use, individual anonymity was guaranteed and data considered open to the public was analysed and
reported. Since disaggregated income data was considered sensitive, official indicators of well-being such
as household access to electricity, tenancy and planning status of the sectors were used as proxies.

EXPLORING THE URBAN DIGITAL DIVIDE IN KIGALI; SPATIAL ANALYSIS AND INSTITUTIONAL ADAPTATION
23
Fig. 3.3 Methodological Framework Adapted from (Pick et al., 2015)

EXPLORING THE URBAN DIGITAL DIVIDE IN KIGALI; SPATIAL ANALYSIS AND INSTITUTIONAL ADAPTATION
24

EXPLORING THE URBAN DIGITAL DIVIDE IN KIGALI; SPATIAL ANALYSIS AND INSTITUTIONAL ADAPTATION
25
RESULTS AND DISCUSSION 4.
In this chapter the results are presented and discussed to answer the questions on ICT performance, groupings and spatial
patterns, correlates of access and policy initiatives (institutional efforts) targeted at improving digital access in Kigali City.
These first two objectives of the research are addressed in the first section. The second section addresses the policy initiatives.
Digital Key Performance Indicators across Sectors in Kigali 4.1.
The first subsection (4.1.1) unveils the state of ICT access in Kigali at the administrative sector level,
based the analysis of selected ICT key performance indicators (KPIs) across dimensions and space. This is
followed by analysis of the spatial grouping of the digital KPIs in order to describe the existing ICT
clusters in Kigali City. In the later part of the section (subsections 4.1.3) the spatial distribution of ICT
access in Kigali City is tested to confirm the existence of the digital divide.
4.1.1. Digital Access and Use: Physical Digital Asset Ownership and Use in Kigali City
In this section the performance of Kigali across ICT KPIs and space is presented and discussed. In its
individual indicators the sectors of Kigali City maintained collectively an excellent performance in terms of
mobile phone ownership as shown by 84.8% mean access score (Table 4.1). Computer ownership was
comparatively low at 13.2%. This pattern of ICT asset ownership seen in the more recent communication
devices is a replica of the observation found in the traditional communication assets (radio and TV). While
mean percentage access in radio stood at 73.6%, there was a mismatch with TV access score, which stood
at relatively low level, 37.7%. Inherently, the issue of cost and socio-economic class could be associated
with such a mismatch since these assets of relatively low ownership are, by general market observation,
more costly than the others.
Table 4.1 Descriptive Statistics of ICT KPIs of Physical Access/Ownership and Use (%), Kigali 2012
KPI Mean Std. Deviation
Radio 73.62 3.52
TV 37.71 21.68
Fixed telephone 1.11 0.68
Mobile phone 84.80 12.11
Computer 13.25 10.23
Internet (home) 45.09 12.21
Internet (office/school) 50.61 9.52
Internet (cyber café) 58.09 8.73
Internet (others) 16.86 4.53
Number of sectors (N) =35 Data on ICT Asset and Use Derived from NISR (2015)
On the indicators of connectivity and use by location, offices/schools and cyber cafés were found to be of
greater access opportunities than homes at 50.6%, 58% and 45% respectively. Hence, the largest
proportion of the population still relies on cyber café for Internet; indicative of a rudimentary stage of ICT
access.

EXPLORING THE URBAN DIGITAL DIVIDE IN KIGALI; SPATIAL ANALYSIS AND INSTITUTIONAL ADAPTATION
26
Access and use at the cyber café could have implications for users‘ convenience, privacy and cyber
security. Generally, access at home and office/school should naturally be preferred. If in the collective
access statistics such ideal pattern was found it could be indicative of a well-off performance and state of
ICT access where convenience, privacy and personal security are guaranteed, to a greater extent. This
point is rooted in the rising concerns for cyber insecurity which comes in form of malicious software,
hacking/personal data theft and accidental exposure to obnoxious contents (European Commission,
2015). Expectedly, the ownership of fixed telephones maintained the least performance of all indicators.
This early modern digital asset was costly and originally owned by the top socio-economic strata of society
at the time they represented the latest technologies.
However, the mean digital performance statistics only show collective physical access and use. In order to
spot variations within the digital KPIs, ICT performance was distributed using box plot (Fig. 4.1). This
enables the summary of performance in terms of distribution around the median scores (50th percentile).
The descriptive analysis is applied to spot any possible outliers in performance based on categories of
indicators. Sector best performance in terms of any indicator is found in mobile ownership, though most
of these lie below the 50th percentile. Although Internet access records a lower general performance than
the ownership indicators of TV and mobile phones, they (Internet use indicators) maintain closer
distributions around the median scores. This makes Internet use by location more homogenous than
ownership of ICT assets. Hence, performance of sectors is unevenly distributed in terms of dimensions
(asset ownership and use).
Fig. 4.1 ICT Performance of Kigali across KPIs, 2012.
Data on ICT Asset Ownership and Use Derived from NISR (2015)
The box plot becomes handy for at least two things. First, the distribution is not symmetric. The mean
access score is not typical of the performance distribution of ICT indicators. Hence the median ICT KPIs
scores are a better descriptive summary of performance in this case. Second, the box plot is a preliminary
tool for exploring possible disproportionately performing sectors, which could be outliers (since every
observation is a sector score for the focus indicator). Since there is neither a score below the 25th
percentile nor above 75th percentile of any KPI this descriptive exploration by box plot detects no outliers.
However, certain top performing sectors in modern ICT assets do exist. Some of the distinguished sectors
are Niboye, Rwezamenyo, Kicukiro, Gikondo, Kimironko, Kacyiru, Nyabugongo and Nyakabanda (see
Annex A1 for all indicators). All falls within the geographic core of Kigali City, with observable physical

EXPLORING THE URBAN DIGITAL DIVIDE IN KIGALI; SPATIAL ANALYSIS AND INSTITUTIONAL ADAPTATION
27
accessibility to ancillary city services and opportunities such as roads, schools and shopping centres (see
Fig 3.1 for Key Urban Services in Kigali). These high profile sectors maintain the lead across the digital
indicators, as the relatively low performing sectors such as Gikomero, Bumbogo(north-eastern,
constrained region), Kanyinya (western fringe),Mageragere and Gahanga(southern, less active axis)
maintain relatively low status across KPIs.
The overall pattern of distribution across ICT KPIs and space is captured in the ICT Location Quotient
(LQICTagg) stastics based on aggregation of sector scores in all KPIs relative to Kigali City aggregate
across all KPIs. The top-performing sectors still remain in the lead in LQICTagg. Beyond single indicator
analysis, ICT Location Quotient enables the understanding of the relative concentration of overall digital
performance and by extension possible ICT base of the given sectors. LQs are dimensionless (no unit
attached, derived from original percentages of ICT indicators) and indicative of ICT-orientation and
specialisation of each sector. If the city performance was 1, a score above this value by a sector would
obviously set the top scoring sector apart from the crowd; then such a sector is designated ICT-Basic
(with a strong ICT base and concentration above reference region, Kigali City). Hence, such sectors could
be designated as achievers (Song, 2008) which means in this case they have a strong ICT base and seen as
relative premium spaces(Graham & Marvin, 2001) in terms of digital access (Fig. 4.2).
In Kigali City, 48.6% of the 35 sectors are ICT-Basic (see Annex A3 for status designation of all sectors).
The distinctive ICT standing of these sectors is such that the emergent digital culture and economy could
be spread from these hubs to the relatively less active spaces or catch up areas, which in this study are
referred to as ICT-Non-Basic, with LQICTagg less than or equal to 1. They are Non-Basic because they
lack the perquisite urban ICT foundation to be regarded as hubs, where innovation could spread to other
sectors. These represent the areas where spread efforts (policy interventions) should be channelled
accordingly, to equilibrate any observed spatial divergence in digital access.
Further discussion on ICT hubs based on multiple KPIs and the distinctive spatial clusters of Basic and
Non-Basic sectors is available in the next section.

EXPLORING THE URBAN DIGITAL DIVIDE IN KIGALI; SPATIAL ANALYSIS AND INSTITUTIONAL ADAPTATION
28
Fig. 4.2 Overall ICT Performance of across Sectors, Measured by Location Quotient of Combined KPIs,
Kigali 2012
Input Data Derived from NISR (2015)

EXPLORING THE URBAN DIGITAL DIVIDE IN KIGALI; SPATIAL ANALYSIS AND INSTITUTIONAL ADAPTATION
29
4.1.2. Information and Communication Technology Clusters of Kigali
The distinctive ICT clusters of Kigali were mapped using K-means cluster analysis. This helped to group
the city into a spatial set of ICT cases with shared characteristics of all the KPIs. Table 4.2 and Fig. 4.3
summarise the characteristics of the clusters.
Table 4.2 Characteristics of ICT Clusters (%), Kigali 2012
KPI Cluster
1 2 3 4
Radio 71.57 74.11 68.97 76.52
TV 12.37 47.87 11.00 56.64
Fixed telephone .40 1.20 .33 1.78
Mobile 72.60 91.39 68.53 94.32
Computer 2.99 12.89 1.67 24.36
Internet (home) 39.89 44.03 29.57 55.78
Internet (office/school) 50.47 47.10 40.13 57.94
Internet (cyber café) 51.77 61.98 68.43 54.03
Internet (others) 18.37 14.98 16.95 17.30
Data on ICT Asset and Use Derived from NISR (2015)

EXPLORING THE URBAN DIGITAL DIVIDE IN KIGALI; SPATIAL ANALYSIS AND INSTITUTIONAL ADAPTATION
30
Fig. 4.3 ICT Clusters/Groupings of Kigali 2012, based on K-means Clusters of KPIs Input Data Derived from NISR (2015) 1(Medium-Low ICT Cluster), 2(Medium-High ICT Cluster), 3(Low ICT Cluster), 4(High ICT Cluster)

EXPLORING THE URBAN DIGITAL DIVIDE IN KIGALI; SPATIAL ANALYSIS AND INSTITUTIONAL ADAPTATION
31
Cluster 1. This cluster is mainly non-core Kigali City sectors located mostly in the northern region. This
cluster fares in the ownership of the traditional communication asset, radio at 71.5% in congruence with
mobile phone ownership. However computer ownership which is indicative of a more recent ICT
asset/resource is low at 2.9%. Households in the cluster rely more on outside (non-personal) Internet
connection (offices/schools and cyber cafés) than home Internet connection. It is made up of the sectors
where such other access points as mobile internet buses have a relatively marked presence on the suburbs.
Cluster 2. This is an intermediate and well-performing core-cluster of ICT asset ownership and usage. This
centre-bordering cluster is typified by such sectors as Gatanga and Nyamirambo which are the closest to
the central characteristics of this cluster. A shorter distance to the cluster centre (a dimensionless measure)
means a stronger exhibition or embodiment of the characteristics of the focus cluster (see Annex A3, for
distance to cluster centre). It maintains a relatively high performance in terms of household ownership of
ICT assets (physical access), except fixed telephone which is low across all clusters. From Table 4.2, 91.3%
of the households in the sectors in this cluster owns mobile phones, the peak-performing indicator of the
cluster. However, mobile phone ownership is not matched with that of computer, which is equally an
indicator of modern ICT asset. This is also in contrast to its performance in the traditional
communication asset, radio (74.1%). In cluster 2, offices and schools remain the main sources of Internet
connection and use. This does not, however, detract from the value of mobile telephone ownership
observed for the cluster, since the available connection such as Wi-Fi and /or modems depend on mobile
phones and computers to run.
Cluster 3. It is another suburban cluster which shares much with Cluster 1 in geography (outer zones).
This cluster is made up of mainly the farthest southern and western Kigali City with two more sectors on
the northeastern fringe; the Gikomero-Rusororo axis. This cluster is typified by Kanyinya and Rusororo
sectors. Though Rusororo shares geographic boundary with Gikomero in the cluster, the former
embodies the cluster‘s typical centrality, in terms of ICT characteristics of this cluster, with Gahanga
which lies south of Kigali City (Annex A3, distance to cluster centre). Collectively, it is the cluster of least
ICT access in Kigali City. Similar to the medium-low performing cluster 1, all sectors in the cluster are
ICT-Non-Basic (Table 4.2 and Fig. 4.4). It has the least ownership of all physical access and
connection/use indicators. Expectedly, it is the most-reliant on Internet café, while it performs least in
home connection and use at 68.4% and 29.6% respectively.

EXPLORING THE URBAN DIGITAL DIVIDE IN KIGALI; SPATIAL ANALYSIS AND INSTITUTIONAL ADAPTATION
32
Fig. 4:4 Distribution of Status of Sectors in ICT Clusters of Kigali 2012. Input Data Derived from NISR (2015)
Cluster 4. The core of kigali City maintains the highest level of performance across all indicators of
traditional ICT assets and modern connection (from radio to home and office/school usage). Reliance on
cyber café and other connection locations is relatively less than either contribution from home or
office/school locations. This quality clearly distinguishes it from the other clusters where Internet
connection and use in cyber café is still relatively higher than home sources. Cluster 4 equally maintains a
distinctive character in terms of computer ownership at 24.3%. This cluster is typified by Kacyiru and
Nyarugenge in terms of shared characteristics. Similar to Cluster 2, the high ownership of mobile
telephone also corresponds to high level connection and use in homes, offices and schools. Although
Cluster 2 shares similarities with Cluster 4, the latter is distinguished as 100% of sectors in this cluster (all
13 sectors) are ICT-basic compared to 44.4%(4 in nine ICT-basic sectors) in Cluster 2.
Cluster analysis, presented here, is a preliminary pointer to the role of geography in ICT access. The high-
performing clusters (4 and 2) are geographic cores and economic agglomerations of Kigali City in contrast
to the peripheral and largely rural regions; low-performing clusters (1 and 3). However, the distance to
cluster centre (the dimensionless measure and evidence of a sector‘s typicality of its host cluster) enables
the distinction within clusters. This shows sectors which exhibit more of the distinguishing multiple ICT
indicators and characteristics of the focus cluster than others within the same ICT-spatial grouping.
The F-statistics in the Analysis of Variance (ANOVA) results (Table 4.3) show the relative influence of
each ICT indicator on clustering. The traditional asset, TV contributes most to differentiating the sectors.
A strong variation is also contributed by mobile phone and computer ownership at 55.1% and 79.3%
respectively. This does not imply bias in the consideration of indicators and their influence but shows the
indicators in which distinction among clusters is stronger. As expected ―Internet others‖ contributes the
least, which means that the classification is robust. A strong influence of ―others‘‘, a vague aggregation of
irregular and less significant sources of Internet connection and use would mean less representativeness of
the indicators used in the classification.

EXPLORING THE URBAN DIGITAL DIVIDE IN KIGALI; SPATIAL ANALYSIS AND INSTITUTIONAL ADAPTATION
33
Table 4.3 Analysis of Variance (ANOVA) Statistics Showing the Influence of ICT KPIs on K-Means
Cluster, Kigali 2012
*The F tests should be used only for descriptive purposes because the clusters have been chosen to maximize the differences
among cases in different clusters. The observed significance levels are not corrected for this and thus cannot be interpreted as
tests of the hypothesis that the cluster means are equal.
Data for ICT Asset Ownership and Use from NISR (2015)
Beyond categorisation of sectors by ICT indicators, cluster analysis is not an inferential statistical test to
confirm the true spatial distribution of the ICT performance levels. The test of possible spatial unevenness
of overall ICT performance (physical access and usage) is investigated in this study using Moran statistics.
This is presented in the next subsection.
4.1.3. Spatial Pattern of Digital Access
In this sub-section the extent of clustering or randomness of distribution is analysed to test whether there
is a systematic distribution of digital access based on aggregate performance (LQICTagg) using Moran I
spatial autocorrelation statistics. The analysis of intra-urban distribution of concentration or otherwise of
performances among neighbouring sectors( Anselin Local Moran I; Local Indicator of Spatial Association,
LISA) further disaggregates the spatial pattern to explore the existence of co-types of ICT spaces.
The spatial pattern of overall digital performance in Kigali has a tendency towards clustering, measured by
Moran‘s I (Table 4.4 and Fig. 4.5). The Moran‘s I statistic shows that the sectors with the highest
performance in terms of physical ICT access and use tend to be co-located; as the lowest performing
sectors exhibit similar tendency towards co-location. With a Moran‘s I of 0.44 (positive spatial
autocorrelation), the distribution of digital access in Kigali City is spatially clustered. The clustering is
significant at 0.01. The index is indicative of the fact that certain areas (groups of sectors) form a
concentration of ICT asset ownership and use, in contrast to other areas characterised by sparsity of ICT
asset ownership and use.
ICT KPI Cluster Error F* Sig.
Mean Square df Mean Square df
Radio 90.34 3 4.87 31 18.54 .000
TV 4787.00 3 52.16 31 91.78 .000
Fixed telephone 4.33 3 .101 31 42.84 .000
Mobile 1399.09 3 25.37 31 55.15 .000
Computer 1049.59 3 13.23 31 79.34 .000
Internet (home) 1044.11 3 62.58 31 16.68 .000
Internet(office/school) 489.25 3 51.98 31 9.413 .000
Internet (cyber café) 423.87 3 42.59 31 9.953 .000
Internet (others) 16.81 3 20.84 31 .807 .500

EXPLORING THE URBAN DIGITAL DIVIDE IN KIGALI; SPATIAL ANALYSIS AND INSTITUTIONAL ADAPTATION
34
Table 4.4 Summary of Test for Spatial Pattern of ICT Performance of Kigali 2012,
Measured by Global Moran's I Statistics
Moran's Index: 0.44 Expected Index: -0.03 Variance: 0.01 z-score: 4.65 p-value: 0.00
Input Data Derived from NISR (2015)
Fig. 4.5 The Observed Spatial Pattern of ICT/Digital Access in Kigali 2012, Measured by Global Moran's
I Statistics
Input Data Derived from NISR (2015)
Given the z-score of 4.65(on the far right side of the tendency to clustering), there is less than 1% likelihood that this clustered
pattern could be the result of random chance. The observed value is higher than the expected value. Therefore, the observed
general spatial distribution of digital/ICT access is clustered.
However, Global Moran‘s I assumes Kigali City to be uniform as it captured the global distribution of
ICT access; the exact spatial units or existence of co-types was not reflected at the intra-urban level.
Hence, LISA was employed to show the intra-urban pattern of ICT co-types in Kigali City. The ICT co-
types are sectors of similar performance which are also geographically contiguous. With LISA (Fig. 4.6) a
pattern of ICT performance emerges within the city such that the inherent digital divide between core and
peripheral sectors becomes visible.

EXPLORING THE URBAN DIGITAL DIVIDE IN KIGALI; SPATIAL ANALYSIS AND INSTITUTIONAL ADAPTATION
35
At the centre of Kigali City three sectors: Gikondo,Kicukiro and Niboye formed a High-High(HH) ICT
cluster(premium space). On the northeastern periphery of Kigali City Bumbogo,Nduba,Rutunga and
Gikomero formed a Low-Low(LL) ICT cluster ( less active space). The spatial clustering of ICT co-types
reveals that all sectors in the HH cluster were found in Kicukiro district. This district is the next to the
most populated and densest district, Nyarugenge. It is characterised by predominantly young populations;
58.1% under 25 years old while the other extreme, 60 years and above account for only 2.3% of the
district (National Institute of Statistics of Rwanda, NISR 2015). The district has a relatively well-educated
population; 51% with at least secondary education and has the highest proportion of population who live
above poverty line, alongside Nyarugenge (see subsection 3.1.1), . The specific HH system of sectors
(Gikondo,Kicukiro and Niboye) is a relatively upwardly mobile area which hosts a high percentage of
foreigners. This system of sectors hosts up to 28% of all foreigners in Kicukiro district (NISR, 2015).
The basic socio-economic characteristics and centrality of the district tends to position it as an ICT hub in
Kigali City. In contrast to the high profile Kicukiro ICT cluster is the co-type LL ICT cluster on the
periphery of Gasabo district. This district has an age structure with a predominantly young population,
57.6%, similar to Kicukiro. However, it contrasts with Kicukiro in terms of the relative education level of
the population as 27.4% of its population attained at least secondary education, that is secondary and
tertiary education(NISR, 2015) compared to 51% in Kicukiro District, where the HH ICT cluster was
found. The young and educated population segment is partly inductive of a trendy population. This
segment has significance for trendiness of lifestyle, digital culture and awareness.
Further exploration shows that the LL ICT cluster of Kigali City lies in the geographically remote areas.
This is a system of sectors with a low percentage of foreigners (jointly 0.1%) of the Gasabo district,
compared to 28% for the HH ICT cluster in Kicukiro (NISR, 2015). The presence or absence of
foreigners is partly indicative of the spatial attractiveness city centres. The upwardly mobile population
would naturally seek to live and do business in areas with high profile economic opportunities, find
residents with trendy lifestyles and language versatility, and other elements of the global culture. Modern
urban hubs, especially in capital cities, are typically sponges of global exchanges and technology-mediated
spaces, in contrast to remote and local spaces.
The observed spatial pattern as shown in HH/LL co-type mapping is relevant for at least two reasons.
First, the significant clustering LL co-types could form the direct and immediate targets of digital policy
initiatives; especially those which combine ICT provision with improvements in accompanying urban
service access. The HH clusters stand out as spatially-attractive innovation centres, which could serve as
hubs for innovation and technology expansion, especially targeted at business concerns and deliberate ICT
cluster consolidation as part of development strategy. Further discussions on these possibilities are
presented in the next section, incorporating the findings from analysis of spatial-economic correlates.

EXPLORING THE URBAN DIGITAL DIVIDE IN KIGALI; SPATIAL ANALYSIS AND INSTITUTIONAL ADAPTATION
36
Fig. 4.6 Local Moran's I Cluster Map of Intra-Urban Pattern of ICT Access in Kigali 2012 Input Data Derived from NISR (2015)
ICT Cluster Co-types

EXPLORING THE URBAN DIGITAL DIVIDE IN KIGALI; SPATIAL ANALYSIS AND INSTITUTIONAL ADAPTATION
37
Digital Performance and Spatial-economic Variables 4.2.
In this section the relationship between sectors‘ performance in ICT is explored using correlation matrix
of confirmatory spatial and socio-economic variables. This is rooted in the premise that digital KPIs have
spatial and socio-economic correlates. The discussion on this section draws on results from spatial
divergence in ICT access found earlier to buttress the point for and introduces policy intervention in its
concluding part.
ICT assets were treated as a surrogate for socioeconomic material ownership for the purpose of
preliminary exploration of the mutual statistical association between any pair of ICT KPIs. The two
traditional communication assets (radio and TV) were found to be strongly correlated at 0.8 while each
showed a statistically strong association with the modern ICT assets, mobile phone and computer
ownership. This relationship is stronger between TV and the ownership of these modern ICT assets at
0.9(Table 4.5). The observation is understandable as TV symbolises a more recent development (of two
traditional assets), expensive and higher social status. In the acquisition of ICT resources the sectors
already atop the existing technologies would possess the newest ICT devices. This is consistent with
cumulative causation process (Myrdal, 1957) whereby regions with initial socioeconomic advantage
continue to dominate in the share of positive development indicators, provided the existing distribution
mechanism persists. Where existing market mechanisms (driven by ICT service providers) target hotspots,
which are better economically-equipped, digital inequality would persist.
Table 4.5 Mutual Relationships between ICT KPIs, Kigali 2012
Rad TV Fixd Mobi Comp Inthome Intofsc Intcafé Intoth LQICTagg
Rad 1
TV .813** 1
Fixd .699** .888** 1
Mobi .753** .944** .819** 1
Comp .832** .914** .857** .842** 1
Inthome .580** .681** .671** .633** .777** 1
Intofsc .455** .364 .347 .401* .611** .674** 1
Intcafé -.248 -.091 -.207 -.143 -.257 -.519** -.641** 1
Intoth .081 -.099 -.056 .024 .009 -.001 .147 -.292 1
LQICTagg .831** .957** .855** .929** .965** .796** .575** -.209 .033 1
**Correlation is significant at 0.01(2-tailed).
Data for ICT Asset Ownership and Use from NISR (2015)
Ownership of mobile phone and computer was found to be associated with Internet use in homes and
schools/offices. This connotes that while not all sector households who own ICT devices could be
connected to and use Internet, it is also clear that where such connectivity is available in offices and
schools, for instance through Wi-Fi, it requires these devices to connect and use it. Therefore physical
access or ICT material ownership, and Internet connection and use are mutually re-enforcing.
Where ownership of ICT assets is high and correlates strongly with Internet connection in home and
corporate locations, the relevance of paid cyber café becomes less as seen in the inverse relationship
between the other digital indicators and cyber café usage.
The household status and socioeconomic activity of sectors are associated with ICT indicators, with some
interesting relations observed. Table 4.6 shows that household headship is inversely associated with ICT

EXPLORING THE URBAN DIGITAL DIVIDE IN KIGALI; SPATIAL ANALYSIS AND INSTITUTIONAL ADAPTATION
38
asset ownership and use. Sectors with higher percentage of households headed by females were found to
perform less in ICT ownership and use. Such an inverse association between ICT performance and
female status also holds for the population of females in sector and is statistically strong in terms of
overall ICT performance (LQICTagg). This is indicative of a gendered structure of ICT access. Although
gender skewness in resource access would ordinary be taken as usual especially in cities in developing
countries, this is worth highlighting as recent studies in more developed countries posit that gender is
becoming a less relevant correlate of the digital divide (Li & Ranieri, 2013). Hence, it would be logical to
state that at the rudimentary stages of development gender gap in ICT is stronger; this correlate of the
digital divide tends to weaken as general ICT access improves with narrowing socio-economic inequalities.
However, Li and Ranieri's (2013) case was based on a direct survey; since users‘ responses sometimes
confirm official data or exhibits dissonance, varied narratives could be found if the data used in Kigali was
subjected to user (perception) survey. Such objective-subjective variances have been found in a study on
urban service/infrastructure and quality of life in Ethiopia (Berhe, Martinez, & Verplanke, 2014)
Table 4.6 Relationships between ICT KPIs and Spatial-economic variables, Kigali 2012, 2013*
Variable Rad TV Fxd Mobi Comp Inthome Intofsc Intcafé Intoth LQICTagg
Percfemale -.413 -.742** -.775** -.737** -.678** -.594** -.320 .112 .139 -.719** Urbanpop .659** .918** .816** .928** .804** .654** .428* -.081 -.126 .900**
Electricity .672** .961** .826** .953** .828** .658** .318 -.032 -.120 .915**
Owner -.528** -.889** -.777** -.912** -.716** -.551** -.177 -.086 .158 -.821**
Elderpop -.450** -.753** -.591** -.811** -.567** -.491** -.227 -.034 .174 -.706**
Elderemployed -.445* -.734** -.554** -.751** -.619** -.580** -.178 -.150 .011 -.734**
Youthpop .678** .954** .857** .933** .852** .685** .369 -.097 -.081 .920**
Youthsec .766** .954** .889** .925** .834** .625** .294 -.087 -.101 .897**
Youthuniv .808** .912** .827** .853** .987** .773** .630** -.236 -.037 .965**
Youthemployed -.205 -.459** -.450** -.468** -.406 -.479** -.087 .020 -.062 -.463**
Youthemployee .592** .864** .767** .876** .831** .806** .492** -.201 -.056 .897**
Youthemployer .252 .560** .460** .546** .517** .477** .253 -.108 -.032 .550**
Youthselfemployed -.505** -.798** -.725** -.807** -.768** -.723** -.344 .073 .076 -.817**
Hholdheadfemale -.255 -.494** -.347* -.533** -.406* -.466** -.348* .038 .194 -.517**
Planned .458** .375 .369 .392 .606** .519** .645** -.317 .130 .534**
Improvedwatersource .583** .767** .683** .782** .712** .457** .357* -.041 -.025 .752**
Geoconstraint -.550** -.715** -.671** -.672** -.783** -.634** -.549** .287 .128 -.746**
Postprycentre .005 .133 .209 .150 .211 .261 .238 -.006 -.013 .211
Sharetotalpop .132 .320 .090 .370* .117 .112 -.131 .359* -.225 .264
**Correlation is significant at 0.01(2-tailed).
Data for Spatial-economic Variables from NISR (2015); *Geographic constraint data was based on CoK (2013)
Factors of youth population and education are positively and strongly correlated with ICT performance.
The association between youth population and ICT performance is statistically strong across all digital
indicators, culminating in a correlation coefficient of 0.92 with overall performance based on LQICTagg.
A similar pattern was observed in youth education, exemplified by youth possession of university
education, which is statically strong at 0.96. These results are in congruence with earlier studies (Haight et
al., 2014; Li & Ranieri, 2013; Várallyai et al., 2015; Whitacre, 2008). Higher percentages of the youth
population and education mean a larger share of the digital natives; the millennials who were born into the
digital age. The aspect in which the results in this study differ from Li and Ranieri's (2013) observation,
which is also in line with OECD (2011), is that while gendering of ICT access matters in this study, they
EXPLORING THE URBAN DIGITAL DIVIDE IN KIGALI; SPATIAL ANALYSIS AND INSTITUTIONAL ADAPTATION
39
found that it was becoming less relevant in explaining the digital divide. Hence the behaviour and
relevance of factors are geographical case- and development stage-sensitive.
The inverse association between ICT performance and youth employment, age group 16-35, is of especial
interest. This relation connotes that the sector of higher ICT performance were found to be of lower
percentage of youth employment. If conducted at individual levels such relationship could call for
concern. However, the relation found in this study means that the sectors with better Internet access
coincide with higher unemployment levels. The reason for this relation is not far-fetched. In the context
of African cities, in this case Kigali, the suburban and rural areas typically engage in menial peri-urban
farming and other easy-to-start-up informal livelihood support activities which count as employment (see
subsection 3.1.1). Where this is the case the highly urbanised areas with more advanced jobs, though have
more employed residents, would account for less percentage of the population employed per sector or
area. The phenomenon of higher unemployment levels at the city centres is could be intensified by the
tendency of the continued attraction of centripetal population flows in quest of economic opportunities
which are thought to be in abundance at the urban growth centres, thereby further mounting pressure on
available opportunities. The problem becomes complicated as most of the new migrants into Sub-Saharan
African cities, especially school leavers, who target city centres are low-skilled and remain unemployed for
years (Hove, Ngwerume, & Muchemwa, 2013). The core of such cities are characterised by a small enclave
of people in high profile jobs, while others are unemployed or unemployable, in an urban labour market
being integrated into the fast-paced and technology-based global economy where the education system is
not able to meet skills demand(Grant, 2012). This is capable of worsening the ratio of the employed to the
aggregate population of the core city centres, without stripping them of their relative agglomerative and
socio-economic advantages, including education, lifestyle, innovation and ICT hubs. In an independent
metropolitan analysis conducted on behalf of The Metropolitan Policy Program(me) at Brookings
Institution, Kneebone and Garr (2009) found that core/metropolitan unemployment levels were actually
0.9 % higher than those of the suburbs. The metropolitan areas maintained higher unemployment levels
for the period in focus, 2001-2009. These corroborate the higher unemployment level at Kigali City core,
even in well-developed urban economies (also see Statistics New Zealand, 2004).
Although housing indicator, planning status, has a strong positive association with ICT performance
across digital indicators, housing ownership exhibits another interesting pattern. The highly urbanised
sectors which recorded higher levels of ICT performance across indicators used were characterised by
higher percentages of tenants. In other words, the less urbanised periphery of Kigali were characterised by
a higher percentage of home ownership than the core urban areas. Again, caution is needed here. A
thatched dwelling in the suburban zone, irrespective of quality (formality or otherwise of housing) is
counted as house ownership. Hence, while a high percentage of the comparatively poorer households in
peripheral areas of Kigali City such as Gikomero, Rutunga and Nduba may own low quality and informal
houses, a high percentage of the better educated, higher income and ICT-equipped households at such
Peak Land Value (PLV) areas as Niboye, Gikondo and Kicukiro would be tenants in well-planned houses.
Similar to the unemployed-total population ratio, tenant-ownership ratio is higher at the city core of Kigali
where ICT access is higher. This pattern is coherent with NISR (2015) where it was reported that the
percentage of house owners are 28.2% and 60.2% in urban and rural areas respectively, with equivalent
tenancy shares of 67%(urban) and 32.9%(rural).
In the aspect of urban agglomeration and infrastructure correlates of ICT access, sectors‘ urban
population share, share of total population, number of post primary schools (surrogates for innovation
centres), improved water supply and electricity exhibit positive associations. Electricity (percentage of
households with electricity connection in the sectors) has significantly strong correlation with sectors‘ ICT
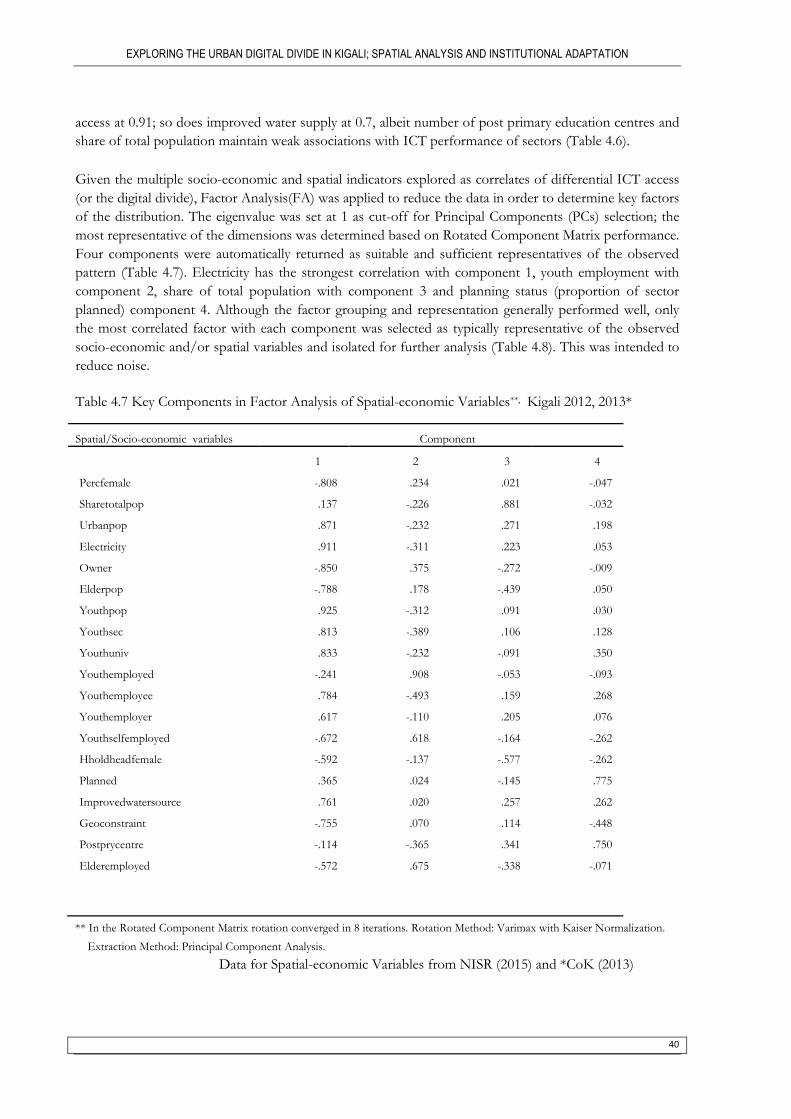
EXPLORING THE URBAN DIGITAL DIVIDE IN KIGALI; SPATIAL ANALYSIS AND INSTITUTIONAL ADAPTATION
40
access at 0.91; so does improved water supply at 0.7, albeit number of post primary education centres and
share of total population maintain weak associations with ICT performance of sectors (Table 4.6).
Given the multiple socio-economic and spatial indicators explored as correlates of differential ICT access
(or the digital divide), Factor Analysis(FA) was applied to reduce the data in order to determine key factors
of the distribution. The eigenvalue was set at 1 as cut-off for Principal Components (PCs) selection; the
most representative of the dimensions was determined based on Rotated Component Matrix performance.
Four components were automatically returned as suitable and sufficient representatives of the observed
pattern (Table 4.7). Electricity has the strongest correlation with component 1, youth employment with
component 2, share of total population with component 3 and planning status (proportion of sector
planned) component 4. Although the factor grouping and representation generally performed well, only
the most correlated factor with each component was selected as typically representative of the observed
socio-economic and/or spatial variables and isolated for further analysis (Table 4.8). This was intended to
reduce noise.
Table 4.7 Key Components in Factor Analysis of Spatial-economic Variables**, Kigali 2012, 2013*
Spatial/Socio-economic variables Component
1 2 3 4
Percfemale -.808 .234 .021 -.047
Sharetotalpop .137 -.226 .881 -.032
Urbanpop .871 -.232 .271 .198
Electricity .911 -.311 .223 .053
Owner -.850 .375 -.272 -.009
Elderpop -.788 .178 -.439 .050
Youthpop .925 -.312 .091 .030
Youthsec .813 -.389 .106 .128
Youthuniv .833 -.232 -.091 .350
Youthemployed -.241 .908 -.053 -.093
Youthemployee .784 -.493 .159 .268
Youthemployer .617 -.110 .205 .076
Youthselfemployed -.672 .618 -.164 -.262
Hholdheadfemale -.592 -.137 -.577 -.262
Planned .365 .024 -.145 .775
Improvedwatersource .761 .020 .257 .262
Geoconstraint -.755 .070 .114 -.448
Postprycentre -.114 -.365 .341 .750
Elderemployed -.572 .675 -.338 -.071
** In the Rotated Component Matrix rotation converged in 8 iterations. Rotation Method: Varimax with Kaiser Normalization.
Extraction Method: Principal Component Analysis.
Data for Spatial-economic Variables from NISR (2015) and *CoK (2013)

EXPLORING THE URBAN DIGITAL DIVIDE IN KIGALI; SPATIAL ANALYSIS AND INSTITUTIONAL ADAPTATION
41
Table 4.8 Typical/Representative Variables of Spatial-economic Correlates of ICT Access in Kigali 2012
Rad TV Fxd Mobi Comp Inthome Intofsc Intcafé Intoth LQICTagg
Electricity .672** .961** .826** .953** .828** .658** .318 -.032 -.120 .915**
Youthemployed -.205 -.459** -.450** -.468** -.406* -.479** -.087 .020 -.062 -.463**
Planned .458** .375* .369* .392* .606** .519** .645** -.317 .130 .534**
Sharetotalpop .132 .320 .090 .370* .117 .112 -.131 .359* -.225 .264
**Correlation is significant at 0.01(2-tailed).
Data for Spatial-economic Variables from NISR (2015)
Given this pattern of representative correlation, the socio-economic and spatial variables of ICT access
represented were interpretatively inferred to be the following categories; infrastructure(represented by
electricity),household structure/socio-economic activity(represented by youth employment),urban
agglomerative strength (share of total population) and planning status/settlement/housing formality
(proportion of sector planned).These key factors; electricity, employment, population and planning status
were primarily used in interpretative context to unveil and confer names to the otherwise statistically
anonymous PCs (Table 4.8). Observation of correlations with other variables in FA analysis validates the
nomenclature. See also Pacione (2001) for this type of application in urban socio-economic grouping.
The general performance of sectors in Kigali city as shown in ICT Location Quotients, distinctive spatial
grouping of sectors based on ICT performance and correlation exhibit an ICT development pattern in
congruence with the classical cumulative causation model (Myrdal, 1957). This pattern of re-enforcement
of existing socio-economic and spatial development in ICT performance is corroborated by Zook ( 2001),
also echoed in Song (2008). Their unifying position is that ICT concentration or Internet users and
domain names are a reflection of a city‘s development towards the digital economy. In this process
positive indicators of digitality will be concentrated in developed regions or urban cores which already
possess exceptional socio-economic and spatial development leverage.
The forgoing is instructive for the observed pattern in Kigali City at least for two reasons. First, stronger
dividing factors mean that only the centres will develop into mainstream knowledge based, ICT hubs
while the peripheries remain weak, less active in ICT. Second, ICT spread means that the periphery will
develop, thereby reaching convergence and well-knit integration of the digital economy. However, a
completely unbundled ICT ecosystem, where providers target only ICT hubs or digital-premium spaces,
lacks the perquisite to reduce the digital divide, with all its corollaries of socio-economic and spatial
inequalities. Hence, policy intervention becomes critical for stemming divergent factors from turning
cumulative effects. Checking the strong forces of geography and demographics, (recall Villasenor et al.,
2015) in section 2.3 of this report, entails employing policy intervention and collaborative instruments. In
this case, the gap-closing digital interventions relevant to Kigali City are examined given their roles,
spatially-and demographically-targeted strategies, their potentials for stemming spatial-economic
divergence in ICT performance and engendering inclusive ICT-based city development. This is examined
in the next section.
Digital Bridge Policy Efforts: Institutional Adaptation to Universal Access Provision in Kigali 4.3.City
The third sub-objective of this study is to understand the nature of policy initiatives or projects targeted at
bridging the gap in ICT access in Kigali (Rwanda). It is based on the primary data collected from seven

EXPLORING THE URBAN DIGITAL DIVIDE IN KIGALI; SPATIAL ANALYSIS AND INSTITUTIONAL ADAPTATION
42
corporate actors in ICT policy and service provision (ICT policy-making organisation, regulator,
operators/service providers and NGOs) and important policy documents.
National ICT Infrastructure NICI I-IV, 2000-2020 is the policy anchor of all ICT development projects in
Rwanda. It is targeted at transforming Rwanda from an agrarian economy in the lower income category
into an information-based economy in the middle income category in world bank ranking (Ministry of
Youth & ICT Rwanda, 2015a). The NICI is a multi-year rolling ICT plan which is reviewed every 5 years.
This plan has evolved through periods; 2000-2005, 2006-2010, 2010-2015 and 2015-2020(NICI IV/NICI-
2020). The short-term goals have also evolved from creating the enabling policy environment to
consolidation, using the Smart Rwanda Master Plan 2015-2020 as the framework (also see section 3.3; Fig
3.2 for the trajectories and integration of policies). Ministry of Youth & ICT Rwanda (2015a) succinctly
summarises the efforts of Government of Rwanda (GoR) towards digital economy in NICI-2015:
― GoR has established institutions and mechanisms to create an enabling environment for ICT
development, deployed critical world-class infrastructure and is continuously developing skilled
human resource base in its quest to become a knowledge-based economy and regional hub‖(p. 6).
The statement has key words which connote concrete interventions. These key terms are institutions (in the
context of this study policy initiatives or observable projects with actual goals and participating actors),
mechanisms ( activities or means of translating goals into outcomes), infrastructure (actual equipping of these
projects, sometimes invisible, for example wireless broadband), skilled human resource base (especially
digitally-inclined workforce and education/potential talent pool who form the foundation for transferring
skills and implementing ICT policies/projects) and knowledge-based regional hub (indicative of the place of the
innovative cities; complex geographies or network of premium/ICT-Basic Clusters).
The following subsections will help find evidence for this ICT policy initiatives and efforts targeted at
promoting ICT access in Kigali City. First, the characteristics of the ICT policy initiatives are considered
in order to reveal certain key elements. The main points are the projects, spatial level of the project
conceptualisation and actors involved. Second, drawing on the same Project Matrix presented in this
work, the next subsection is a discussion on the outcomes or achievements and constraints of the projects.
Finally, building on the understanding of the ICT access and project environment of Kigali City, a SWOT
Matrix is presented as a synthesis of the current condition and what is possible if all observed elements are
combined in strategy.
4.3.1. Universal Access Project Setting: Nature of Projects and Actors Involved
Understanding the ICT intervention ecosystem of Kigali means finding evidence for these efforts through
relevant projects aimed at achieving the overall goal of universal access and transformation into a
knowledge-based regional hub, represented in this case by Kigali City. However, transformation into a
regional hub means checking divergence in access in terms of geographies and demographics since a hub
would naturally entail a network of spatially attractive or premium clusters. From the available
data(through policy documents and field accounts account, see Table 4.9), the ICT projects in Kigali were
found to be deliberately oriented towards factors which are associated with the digital divide in Kigali City;
geography and demography/socio-economic characteristics. The initiatives were both spatially- and
demographically-targeted to ensure the seamless integration of the peripheral areas (mainly the ICT-Non-
Basic Clusters) into the mainstream ICT-based urban services and economy. This therefore links the ICT
policy-intervention/project context to the observable pattern of access distribution and critical variables of
ICT access considered earlier in this study (see subsections 4.1 and 4.2). Evidence for the geographical
targeting was reflected in the accounts by the actors interviewed (see Field Interview Quote, FIQ 1 and
Annex, Digital Bridge Buses).

EXPLORING THE URBAN DIGITAL DIVIDE IN KIGALI; SPATIAL ANALYSIS AND INSTITUTIONAL ADAPTATION
43
“We have normal trainings we target rural people. Actually ICT buses do not go to the key urban areas they are intended to
go where there are no infrastructures like electricity; we intend to boost skills where access to electricity is difficult somehow.
We do it in two ways as per the request of the community also as per our plan. We target different groups of people like
students, doctors and even the persons who are not educated. What we do is to show them how ICT can facilitate their needs
by training them. We use the key people educated as trainers for others in the communities.” (FIQ1, RDB)
Given the role played by geo-demographics in the ICT project strategies and orientation towards regions
lagging behind the relevant projects can be described as being socially-progressive. This applies since the
key projects ideally target backward areas specifically (for example RTN and Mobile Buses and RTN
operation) and/or incorporates them in the overall access strategies (Access Network and SchoolNet).
Besides geographies and demographics which address distribution pattern and targeting strategy, the ICT
projects surveyed could be classified into four main thematic categories; community development,
education/skills, business promotion/urban economic competiveness and e-government. These
thematic foci equally have relevance for the access channels examined earlier. Community development
has relevance for Business Service Development Centres (BSDCs) and provision of public cyber café as
an accompanying service (Ministry of Youth & ICT Rwanda, 2015a). PSD and e-government projects
influence access through office channels as skills/education-focused projects have potentials for improved
access through school channels while addressing digital literacy concerns.
Madon et al. (2009) recognise institutionalisation of digital inclusion projects, phrased in this study as
digital bridge policies/projects, to be one in which established structures are linked to shared symbols, supported by
material resources through which social activities are promoted (section 2.3) These elements were found to be
characteristic of the Kigali UAP projects. For instance, Irembo is emblematic as it symbolises gateway or
open access in Kiyanruwanda (Rwanda Online Platform, 2017). By this symbol the project has become
representative of the vision and strategy of GoR to transform the country in general and Kigali City in
particular into an ICT hub through digitilisation of citizen services in collaborating Ministries,
Departments and Agencies (MDAs), the established structures of government which in turn have partner
actors. It has become a symbol recognised and adopted across MDAs and shared by the citizens as a
medium of modernised service develivery. Infact the number of government services on Irembo Platform,
that is e-government , is one of the KPIs for benchmarking Smart Rwanda Master Plan 2020 (Ministry of
Youth & ICT Rwanda, 2015b). Projects such as telecentres , OLPC computer distribution across schools
and multiple streams of funding(internal and external) are some of the material resources through which
digital bridge (access-gap closing), or digital inclusion is physically supported. These are carried out
through social activities which are centred on digital natives/mainly millennial students (see OLPC projects
in Table 4.9) and areas of relative geographic and demographic disadvantage (see RTN and Mobile Bus,
for instance).
The projects involve collaboration among governmental and non-state actors with complementary roles
(see Table 4.9 and 4.10). The actors in the projects recognised the existence of a collaborative ICT policy-
intervention environment in Kigali City (see interview-generated accounts FIQ3-5, RURA,
RICTA/RINEX, and RDB)
This project analysis gives credence to the assertion of the efforts in the policy paper (NICI) of GoR cited
above on the critical components of institutions, mechanisms, infrastructure and skills as the policy
interventions/projects in actual reality take these into consideration. Some of the projects are built around
skills development with infrastructure provided for positive movement towards ICT-based services, albeit

EXPLORING THE URBAN DIGITAL DIVIDE IN KIGALI; SPATIAL ANALYSIS AND INSTITUTIONAL ADAPTATION
44
with challenges observed. The outcomes and challenges of the projects are presented in the following
subsection of this report.
4.3.2. Project Outcomes and Challenges
One of the research questions under sub-objective two is ascertain the achievements, strengths,
constraints and prospects of the ICT access intervention projects in Kigali City. The rationale behind this
formulation is that the strength of the projects could provide basis for achieving the goals or at least
progress(towards the goals) while worsening of constraining aspects could limit achievements and dim the
prospects of reducing the digital divide across geographies and demographics.
The ICT Project Matrix (Table 4.9) summarises the main outcomes of the interventions surveyed. The
outcomes/achievements reported (policy papers and field interviews) were in line with the themes of ICT
projects; mainly in the domains of Community Development (CD), education and skills, Private Sector
Development and e-government. Reaching ICT-Non-Basic Communities is a strong policy focus. Since,
in this study, the recognised main access channels (apart from homes) are offices/schools and cyber cafés
the linking of the gains of intervention in CD projects with those of education and business
improvements has relevance for the communities. All activities take place in space (communities).
Activities targeted at improving access in schools and offices typically translate to improved ICT access in
communities and households since these are also recognised household access channels. On the inter-
theme linkages, for instance, it was found that the major outcome of RDB Mobile Bus/Digital Bridge
Project was in awareness campaigns across remote communities while transferring digital skills through
agents. In this context, CD meets digital skills, since there is a linkage between awareness campaign for
behaviour change and digital literacy (education and skills) across communities through provision of
mobile access points for transactions. Such activities are semi-formal and informal digital skills acquisition
channels are driven by the RDB Mobile Bus Initiative and RTN. While the former achieves results
through itinerant digital service provision across remote communities the latter achieves outcomes
through acting as a stationed and multi-location government-citizen access intermediary mainly in ICT-
Non-Basic Communities.
Inter-theme linkages were also found in the collaboration between RTN and BDSCs as access points
including provision of cyber café services. Partnering with the BDSCs helps reduce cost while expanding
spatial coverage since RTN does not have to build every telecentre to reach the remotest communities.
This also enables it to tap the digital skills and embedded local experience of such partners, especially in
communicating with and training the communities. This aspect is critical to the sustainability and outcome
of RTN. It is not driven by profit, hence cost reduction is important. RTN relies on a network of
stationed access centres and channels across communities. These are vital for driving the digital culture
and providing diverse e-services. The services range from e-government (also working with Rwanda
Online on Irembo) to e-commerce (especially Mobile Money in conjunction with telecommunications
operations or their authorised trade and technical partners, see Table 4.9 and Table 4.10). Hence
innovation networks are at the root of the positive outcomes of ICT initiatives in Kigali City (see also
Gloor, 2006, for collaborative innovation networks). In the context of Kigali City, innovation networks
are intricate linkages of actors across geographies, ICT-projects and themes in a policy-supported ICT
environment (Kigali), which form the foundation for positive outcomes of ICT interventions (see Table
4.9). These kinds of linkages are vital to bridging the digital divide in terms of geography and social strata.
The continued improvement of the outcomes of such innovation networks could be a strong factor for
checking the divergent and cumulative forces, ( recall Myrdal, 1957), which favour access in premium
spaces only and worsen the already existing digital inequality and social exclusion (see other evidence of
these divergent tendencies and consequent spatial patterns in the literature section on ICT for Inclusive
City Development and, Digitality and Spatiality). Also refer to section 2.3 for evidence of the
EXPLORING THE URBAN DIGITAL DIVIDE IN KIGALI; SPATIAL ANALYSIS AND INSTITUTIONAL ADAPTATION
45
instrumentality of policy-environment in improving digital access and bridging the digital divide; for
example (Odufuwa, 2012; Villasenor et al., 2015; World Bank Group, 2016). This becomes clearer when
placed within the context of the influence (possible or actual) of their activities on the socio-economic and
spatial correlates of ICT access channels/points of households. These projects can be linked to the spatial-
statistical analysis of state of ICT access presented earlier (see sections 4.1 and 4.2) considering their
themes and geographic and demographic targets (relevant for the socio-economic correlates of digital
access), channels (schools, firms/offices, café/BDSCs) and goals (increased ICT asset ownership and use).
Also recall that the conceptual framework of this study (see section 2.1; Fig 2.1) proposes an intra-spatial
unravelling of the digital divide and the underlying correlates in an environment where policy intervention
could help modulate the current pattern of ICT access and these spatial-economic correlates.
Similar policy-initiative and collaborative strengths of the ICT interventions which account for the
reported outcomes are shown in Table 4.9 (Primary and Secondary Actors) and Table 4.11(Strength
component of SWOT Matrix). GoR through the Access Network project has provided fibre, across the
country for easy access, especially targeted at public buildings and businesses. This has implication for
strengthening the system. First, it ensures that individual operators do not have to start from the scratch in
deploying broadband infrastructure which reduces times and cost required for connectivity and expansion.
Given that GoR cannot deliberately force down prices (except such prices are deemed extortionate), this
mechanism (ready fibre optic network) makes for easy universal coverage and reduced broadband user
charges. When asked if they had influence on the rates (prices) charged by the private operators, MYICT,
the parent ministry of the telecommunication regulators gave this response:
“I would say we may but we do not regulate the prices. What we do is to promote the access to Internet and it will help to
increase the traffic and more revenues which is going to affect the prices, we are also encouraging the investors to invest in ICT
and if there are many investors, then the price will be reduced”. (FIQ2, MYICT).
Provision of material resource support was also acknowledged by one of the agency respondents. The
regulator, RURA, painted a picture of favorable policy-environment for UAP (promoting ubiquitous and
affordable coverage) when asked about the impact of UAP projects: “The setup is through telecentres as I said for families that do not have connectivity at their homes they use telecenters,… there
is also the project of building computers here. Its target is to manufacture the computers locally and put them on low cost.
There is also the program of putting fiber optic in the districts that will help the rural areas to be connected… also with the
Ministry of Education to connect the schools to the fiber…bringing the 4G penetration, coverage to the target of 70%, also
the government tax free policy for ICT in order to make it affordable, the universal access is helping us do some specific
projects…” (FIQ3, RURA)
A triangulation of claim (an independent account to enrich understanding, not necessarily to validate or invalidate claims) with some actors corroborated RURA‘s intervention efforts and the instrumentality of collaboration among the regulator, operators and non-governmental intermediaries. When asked about their knowledge of UAF in Rwanda, the actor responded:
“The universal access sits in the office of the regulator [RURA]. I know that it comes from the proceedings of the telecomm
operators which are used to promote the accessibility of ICT or other projects in disadvantaged areas. We benefited from that
fund last 3 or 2 years. The regulator provided that fund for the first 2 years of operations and in the third year we were able
to generate our own revenues and move forward. Actually when we started we were generating money for our revenues but we
were not using it, we were creating the buffer… we need to be sustainable.” (FIQ4, Anonymous)5
5 This quote was anonymised, even at agency level, because it was specific in terms of financial benefit received from the agency. Where no sensitive issue is raised the agency, not individuals, were cited.
EXPLORING THE URBAN DIGITAL DIVIDE IN KIGALI; SPATIAL ANALYSIS AND INSTITUTIONAL ADAPTATION
46
“…We have other initiatives that support the policy because the Universal Access Fund was initiated by RURA. RURA
was working with different telecommunication operators and they give some funds to be part of funding the projects.” (FIQ5,
RDB)
Ambitious ICT policies and network of actors and projects mean inevitable implementation challenges.
Table 4.9 summarises the challenges/constraints. From the accounts and policy document screening these
constraints manifest in the various dimensions; Weak ancillary/support infrastructure, paucity of
funds, self-exclusion, curse of multi-actor participation, inadequate skill base and local content
deficiency.
Ancillary infrastructure has two components; electricity and computers (including the soft sub-
component). In the spatial-statistical analysis presented earlier in this work it was found that electricity is a
strong correlate of ICT access across Kigali City. The triangular recognition of this factor by the three
independent sources; spatial-statistical analysis (based on data from NISR), policy documents (especially
from MYICT) and multi-actor interviews (governmental and non-governmental) makes it one of especial
interest in the study. This is particularly strong given the fact that all ICT-intervention projects depend on
electricity to function effectively, which makes it one cross-cutting constraint of ICT access and
intervention projects, especially in the remote areas (see Table 4.9). The account of some of the actors
interviewed in the field when asked about the main challenges pointed out power issue:
“The main challenge that we have is people but I can categorize …You know ICT infrastructure depends on other
infrastructure like power. That is the challenge that we have because it is still a challenge in some rural areas, also funding in
a sense we need more than what we have, also the private operator or investors that can invest in ICT, also the level of
understanding of local people is still a challenge”. (FIQ6, RDB)
“In general the improvement is needed in terms of infrastructures like electricity, improvement is needed in activities which
must be affordable and also improvement is needed in content. Also the awareness of people in ICT needs some improvement,
but the first one is connectivity.” (FIQ7, RTN)
In the case of computers, where these are limiting it becomes difficult to reap the advantages of vast
broadband coverage (Access Network), especially among the existing and potential participants in the
Irembo Platform. The recognition of the challenge informed the strive of GoR to intensify efforts at
deploying computers to sector offices, though this is far from universal availability and adequacy. Besides,
this ancillary infrastructure is vital for access and use in homes, offices/schools and cyber cafés. Funding as a constraint of any project implementation is arguably a given. However, it becomes a stronger factor where a relatively less-resourced, low-income country in Africa births the vision of jumpstarting service development into the middle-income category. The constraint of funding was well-acknowledged among the actors interviewed. This factor is naturally intertwined with and at the root of those of ancillary infrastructure or material resources required to support UAP.
From the interviews conducted self-exclusion was found to be a strong constraint of ICT use. According
to an account by one of the ICT-CD project implementing actors the poor and less educated, especially in
peripheral areas perceived ICT to be a thing for the rich only. Such an adverse perception cannot be said
to be rooted in income alone but also education since a segment of the poor who have some education
and are digitally-literate would at least have the motivation to use ICT services. Besides, similar
demographic groups in different areas could have varied levels of motivation owing to socio-spatial
network-effects or ICT-co-types such that, for instance, continued interactions with digital natives in an
ICT-premium environment could stimulate interest and reverse adverse perception. A strong influence of

EXPLORING THE URBAN DIGITAL DIVIDE IN KIGALI; SPATIAL ANALYSIS AND INSTITUTIONAL ADAPTATION
47
parents‘ education levels on household use and skills is documented elsewhere(see Li & Ranieri, 2013).
The essence of education (combined with affordability) for inclusiveness in community-oriented ICT
projects, based on a South African case, is reflected in Butcher(1998) as reported earlier in this study (see
section 2.4). Hence, self-exclusion thrives with the adverse socio-economic correlates of ICT access.
Similar to the case of deficient infrastructure the spatial statistical analysis part of this study corroborated
this relation (See section 4.2, Table 4.6), which was equally acknowledged by ICT-CD actors.
It was reported earlier in this study that innovation networks were instrumental to the quest for bridging
the digital divide in Kigali City. The various actors were found to have collaborated effectively in pursuit
of the UAP-relevant projects. However, a complexity of actors and projects equally means conflicting
interests even where there is shared vision and symbolic policy initiatives. This is the curse of multi-actor
participation. In fact, the strongest constraint of multi-actor participation was associated with the iconic
Irembo (owned by GoR but managed by Rwanda Online Platform in e-network of MDAs offering up to
44 services, Table 4.9). The challenges are those of perception of the ownership of Irembo services given
its Public-Private-Partnership (PPP) arrangement, difficulty in reaching understanding/signing
Memorandum of Understanding (MoU) with some of the participating MDAs, slowness of service
digitalisation and poor interoperability among partner MDAs. While the issue of MoU is one of
administration (also associated with economic motive) that of digitalisation relates to competitive
technology and skills (see FIQ8, MYICT on the challenge of skills to explore ICT) as interoperability
relates more closely to technology, internal bureaucracy and inter-agency rivalries.
“[The challenge is] in skills or citizen empowerment, the challenge is how much skills people have to explore this ICT.”
(FIQ8, MYICT)
The challenges of MoU and interoperability in Kigali agree with an earlier study by Criqui (2015) of socio-
technical innovations in two cities: water and sanitation in Lima(Peru) and electricity in Delhi (India).
Those projects involved technology adoption and upgrade in the urban utilities provision in a co-
production (multi-actor) environment. While that of Lima recorded a modicum of success built on faster,
less chaotic, more flexible and incentivised environment, that of Delhi encountered stifling draw backs
owing to a ―complex situation where public authorities compete to pass burden and responsibilities, and
politicians interfered with decision-making process‖ (p 97). This constrained the expansion of utilities
network, consequently compelling the electricity service providers in Delhi to by-pass regulation in order
to provide services. In the context of Kigali City, the account of the operator interviewed (FIQ9,
AIRTEL) relates more to the challenge of ensuring regulatory fairness in spectrum allocation to all
operators (without politically-mediated undue advantage for some) though the efforts of the governmental
actors in mass fibre connectivity reported earlier were acknowledged:
“What I know is that government sets some initiatives to make sure that all communities have access to ICT services…There
is also the initiative of government where government is trying to lay fibre across all sectors of the country and it will help access
to Internet… Improvement is needed in having spectrum where all operators can have the same capacity in the market.”
(FIQ9, AIRTEL)
“…the problem is how to bring the operators to the part of business; the best improvement to do is content because
content attracts people to use ICT that is the one still on a low level.” (FIQ10, RURA)
The challenge of local content (FIQ10, RURA) is one that equally presents prospects as the development of service content adapted to the peculiar environment and need of the ICT users in Kigali means an added value. It also entails the incorporation of more services and package which are useful and usable by the citizens. RTN and RINEX/RICTA strongly acknowledged this constraint. More on the prospects of the observed condition is summarised in the opportunities component of the SWOT matrix (Table 4.11).

EXPLORING THE URBAN DIGITAL DIVIDE IN KIGALI; SPATIAL ANALYSIS AND INSTITUTIONAL ADAPTATION
48
Table 4.9 Digital Access Project Matrix, Kigali (Rwanda) 2016 (Cont.)
Feature Project
Spatial Level
Theme Geo- target
Demographic target
Goal /Strategy
* Type
Pri. Actor
Sec. Actor
Reported Outcomes
Challenges /Constraints
Mobile Access Bridge Bus Initiative (Part of Smart Rwanda Initiative) (P)
National (*)
CD (*)
Mainly Rural/ Semi-Urban (*)
Low-income, ICT less-educated, less-equipped population (*)
Empower and transform communities through access to ICT services using mobile itineraries (*)
Gov. RDB (*)
MYICT, RURA, RTN, WB (*)
-Increased ICT awareness in remote regions -ICT Training -empowerment of community ICT agents -Improved participation in ICT-based governance
-Poor electricity (*) -Low funding capability(*) -Poor private sector participation, in CD-oriented ICT(profitability-affordability/ universality divergence) (*) -Perception of ICT among the poor/ less educated as a service for the rich and educated(*)
Rwanda Tele- centre Network (P)
Intra-Urban/ Organisational
CD Mainly Rural/Semi-Urban
Low-income, ICT less-educated, less-equipped population
Reduce rural-urban digital gap through public access centres where people can use Internet, acquire digital skills, access financial services and government information
NGO RTN AED, USAID Banks** Opera-tors ELEC-TRO-GAZ
-Over 400 centres operational(*) -Each centre has an average of 3 employees - 100 online visitors per day -Local ICT certification -Improved ICT opportunities -BDSCs availability -Increased participation in ICT policy; 1000 Telecentres Project in NICI
-Poor electricity -Relative poor interest/perception among local people -Paucity of funds -Emergence of competitors providing training -Low literacy;, even where there is motivation to learn
.RW Internet exchange (RINEX) (P)
National Cc X-geographies/ Cross-geographies
Mainly corporate; High-profile users
Register and maintain domain names and internet exchange points
Joint RITA /RDB, RICTA**
SIDA, KTH, NUR, KIST, RURA, WB, AU, UNDP
-Over 11 providers peered -Maintenance of local Internet back bone for shared route server to facilitate new entrants -Improved interface speed, up to 100 mb-1g/s Ethernet -Improved reachability, connectivity solution and Internet user experience due to proximity to end-users -Affordable domain names, even for personal and SME users, as low as 4USD/year -Integration of local content
-Low level of ICT immersion in education and corporate services(*) -Poor understanding of the sector among well-resourced investors who could be financiers(*) -The issue of doubts among actors, including citizens that ‗‘it can be done‘‘
EduNet/ School-Net (P)
National SD
X-geographies -Mainly primary school children (case of OLPC/ SchoolNet) -All education levels
-Inculcate ICT usage at early life stages through increased access at all education levels
Gov. PPP
MINEDU
OLPC, POSITIVO
-56, 000 laptops: 113 pri. schools -Students‘ competitiveness -Device cost savings for schools: recycled equipment -100 % tertiary schools connected. -Domestic computer assembly POSITIVO
-Poor access to electricity in schools; -Many primary schools, up to 80% depend on the headmasters‘ personal phones for official communication - shortfalls in technical support -inadequate funding to meet demand

EXPLORING THE URBAN DIGITAL DIVIDE IN KIGALI; SPATIAL ANALYSIS AND INSTITUTIONAL ADAPTATION
49
Data for Project Matrix from actors‘ accounts (2016) and MYICT (2015)
(*): Information derived from the designated agency interview(s)/project experience account (Field Interview Quote, FIQ),
distinct from policy/strategy papers.
X-geographies: Cross-geographies; spatially non-discriminatory/rural and urban,
**: Various; for example, in the case of financial services, multiple banks involved.
*: Classification based on primary actor, goal and operational modalities ,
(P): Primary focus during field work; key/primary actor(s) directly and formally interviewed during study,
Cc: Cross-cutting, CD: Community Development,
SD: Skills Development, (S): Important service/initiative but key actors not directly and formally interviewed,
e-gov: e-government
PSD; Private Sector Development, Pri/Sec Actor: Primary /Secondary Actor
Table 4.10 Digital Access Project Matrix, Kigali (Rwanda) 2016 (Cont.)
Feature Project
Spatial Level
Theme
Geo- target
Demo- graphic target
Goal/ Strategy
* Type
Pri. Actor
Sec. Actor
Reported Outcomes
Challenges /Constraints
IREMBO Rwanda Single Integrated e-govt Platform (S)
National e-gov X-geographies Cross-demo- graphics
Provide/promote open and fast single platform access to government online services
Gov. GOR** Rwanda Online Platform Ltd
RTN -44 services available on Irembo - More than 432 Irembo centres -Improved e-gov efficiency (reduced citizens‘ document processing time and crowd) - ICT service solution through PPP mechanism: reduced running cost -Stronger motivation among MDAs for service digitalisation
- Unreliability and unavailability of Internet access, in remote regions (connectivity /speed) -Inadequate number of computers in MDAs -Erratic electricity -Limited awareness of services among citizens -Difficulty In MoU with multiplicities of agencies targeted; poor interoperability among MDAs -The burden of training multiple MDAs in the specialised, sophisticated and recent e-services -Delay in payment digitalisation among MDAs: politics, motivation and technical capacity
Rwanda Access Network (S)
National PSD X-geographies Cross-demo- graphics(mainly commercial /government offices; public buildings including schools and hospitals)
Extend Internet access across country to bridge digital gap between backbone nodes and end-users‘ premises by means of fiber optic or wireless broadband (WIBRO)
Gov. MYICT, RDB
Operators, RURA
-Estimated connectivity of at least 40%;key public end-users targeted as at 2015 -Extended broadband connectivity; up to 2,300 km -Improved corporate digitality -Increased mobile penetration; up to 31.5% (2015), 5.3% (2010) -At least 38% broadband presence: MDAs -Increased innovation and start-ups; up to 71 (2015) -Increased operator revenue streams -Broadband price reduction following universal deployment
-Fund -High-end technologies deployment amidst relatively less technologically-inclined workforce, especially in public sector

EXPLORING THE URBAN DIGITAL DIVIDE IN KIGALI; SPATIAL ANALYSIS AND INSTITUTIONAL ADAPTATION
50
Table 4.11 Digital Access Key Actors in Kigali (Rwanda) 2016; Main Role and Mechanism
Actor Role Mechanism Relation
MYICT Policy formulation Strategy/paper
work/envisioning/target-
setting
Direct with RDB, RURA, OLPC;
others indirect
RDB Digital bridge project
design &
implementation
Wi-Fi/public access
facilitation, internet-
enabled mobile buses
mainly targeted at fringes,
training of key community
digital literacy
agents(future trainers)
Direct with MYICT, RURA, RTN,
AIRTEL; others indirect
RURA ICT service regulation Standard setting ,
enforcement, spectrum
allocation, QoS and
contributory commitment
from operators and
intermediaries
Direct with MyICT(agency under
MYICT), AIRTEL, RTN,
RINEX/RICTA;
others indirect
AIRTEL Telecommunication
service provision
Individual user and
corporate service,
technology deployment,
physical expansion,
content development,
innovation
Direct with RURA, RTN, RDB;
others indirect
RTN Government/operator-
community intermediary
Establishment/recruitment
of multi-purpose
telecentres, community
awareness creation
Direct with AIRTEL, RDB
RINEX/
RICTA
Internet gateway/access
point data
management/data
exchange
Domain registration,
multi-operator data
warehouse/exchange
Direct with RURA, AIRTEL,
MYICT
OLPC Child/School computer
delivery and
instrumentation/training
School-to-school delivery,
Children‘s content
development and
customisation
Direct with MYICT (also closely
with MINEDU on SchoolNet)
Data for Role Specification Derived from actors‘ accounts (2016)

EXPLORING THE URBAN DIGITAL DIVIDE IN KIGALI; SPATIAL ANALYSIS AND INSTITUTIONAL ADAPTATION
51
4.3.3. Possible Policy-Initiative Measures from the Current Analysis
SWOT matrix is presented in Table 4.11 It is a sorting of the strengths, weaknesses, opportunities and
threats (based on the integrated ICT ecosystem analysis of Kigali City) into concise and workable
groupings. This is intended for a deeper understanding of the challenges and prospects of digital access
performance improvement. It is possible to draw on the observed situation for potential policy choices
and the sustainability of the digital access gap-closing initiatives. Hence, the primary SWOT components
can crystallise into prospects in strategic combination.
The basic features of the thriving ICT-enabled urban services are currently found in Kigali City. This has
commenced with policy formulation to inspire the need for individual and organisation change to fit with
emerging digital culture. Naturally, the mass mobilisation, connectivity, multi-actor co-optation and long-
term ICT-project resourcing have given the vision of a regional ICT hub and transformation to a
knowledge-based economy a tangible expression in form of projects.
However, the current and possible challenges in these mass ICT access initiatives in the quest for digital
transformation are enormous and have been sorted into weaknesses and threats. Challenges may appear
vague and difficult to spot. By sorting seemingly chaotic challenges into groups of the typically internal
and external factors (see SWOT Matrix, Table 4.11), information becomes coherent for problem-solving
and strategies. In challenges lie prospects as long as observed weaknesses and strengths are optimally
combined with opportunities and threats in problem-solving for sound policy choices and sustainability.
These possible combinations are documented in the SWOT matrix which shall be explored further in
proffering recommendations at the later stage of this report. This tool (SWOT matrix) is particularly
unique and effective as it enables deep sensing of the ICT-project environment and specific-system-
generated inputs for policy and research rather than generic strategies drawn from unrelated cases; hence it
is relevant to the problem context and geography.

EXPLORING THE URBAN DIGITAL DIVIDE IN KIGALI; SPATIAL ANALYSIS AND INSTITUTIONAL ADAPTATION
52
Table 4.12 SWOT Matrix for Digital Access Policy-Initiatives in Kigali (Rwanda) 2016
Internal Factors External Factors
Strengths (S) - Growing revenues from start-ups and scale-ups as well as e-gov. and urban development services on Irembo Platform -Well-articulated policy initiatives -Established MDAs as ICT policy channels -Emerging/dynamic operators -Access network; Broadband foundation -Responsive workforce; open to innovation (across regulatory, operating organisations) -Deep understanding of policy initiatives among ICT-actors -Basic/baseline data on ICT KPIs access available for performance Monitoring & Evaluation(M&E)
Weaknesses (W) -Top-down initiatives/bureaucracy; inefficiency/slowness; ICT policy initiatives conceptualised at national levels in all but one case -Inadequate power supply for service support -Slow broadband speed -Inadequate self-funding capacity; over-reliance on development partners -Shortage of digital assets in MDAs to support innovative ICT platform; case in point Irembo -Shortage of high-profile human capital and skills to domesticate technology transfer -Conflicts: Challenge of MoU and interoperability among MDAs -Deficiency of local content -Relatively poor UAP initiative understanding and immersion among operators -Target KPIs not aligned with official/NISR key ICT KPIs
Opportunities (O) -Robust innovation networks -Dominance of youth population; digital natives -Presence of policy support; SRMP/NICI, ICT/Computer-related items production tax exemption -Cross-cutting adoption of ICT across MDAs; public service digitalisation through symbolic projects -Growing/mass adoption of WIBRO; Relevance for affordability -Technology & skills transfer; local/foreign development partners -Funding from external sources(WB and others)
SO-Strategies/Policy Measures -Use well-established regulatory, policy initiatives and organisations to co-opt and educate operators on UAP -Tap potential of the digital natives by launching more channels supported by cutting-edge operators -Use the Access Network, increasing digitalisation, pervasive ICT adoption to keep digital culture well-resourced and embedded -Stiffen the competition(beyond the current monopoly of computer assemblage) in hard components manufacturing using the instrumentality of existing tax incentive -Ensure precise geo-based mapping of project opportunities using available baseline data; away from present generic geo-targeting
WO-Strategies/Policy Measures -Resource the projects through sustainable revenue capacities of the innovation networks -Stimulate operators to participate more in local ICT/UAP initiatives by continued enlightenment on initiatives and long-term returns on investment -Loosen the top-down/bureaucratic practices to accommodate the perspectives of local MDAs and Non-State Actors early; obviate MoU tussles. -Consolidate the increasing mass adoption and digital natives/EduNet for future talent pool, technology retention and sustainability -Combine the possibilities of improved resource and talent bases to scale up signal strength and speed -Profile future opportunities in line with base data for robust M&E and policy-initiative relevance to need
Threats (O) -Dissatisfaction among partners with MoU and the risk of contagious disaffection among targeted users, especially citizens -Growing relevance of secondary cities in Rwanda; risk of GoR and partner investment/funding switch from Kigali City -Affordability-profitability divergence; operators‘ profit target determined by external forces(executives and trends) -Over-reliance on external partners; stiff competition from other LDCs -Proliferation of informal activities; difficult to integrate into platforms -The self-excluding segments of the population; adverse perception
ST-Strategies/Policy Measures -Consolidate shared culture and policy initiatives to enlighten self-excluding citizens -Keep partnership with operators to widen connectivity and uphold downward price trends; avoid demotivating operators by direct price regulation -Use heavy presence of enlightened, committed and dynamic workforce who are also well-versed in the local culture to reach and enlighten the locals
WT-Strategies/Policy Measures -Ensure poor QoS does not result in users‘ paying for service not rendered; implication for affordability -Decentralise system to enable local authorities and intermediaries conceptualise ICT-initiatives and integrate the mainly informal activities into the platform -Encourage more local operators for community/regional/ small scale services for deeper local knowledge, better content development, affordability and less external influence on profit target
Data for SWOT Analysis derived from actors account and MYICT (2015)

EXPLORING THE URBAN DIGITAL DIVIDE IN KIGALI; SPATIAL ANALYSIS AND INSTITUTIONAL ADAPTATION
53
CONCLUSIONS AND RECOMMENDATIONS 5.
This chapter draws on the findings and discussion presented earlier to conclude on key objectives of the study and contributions
to existing research, policy implications, and reflections on limitations and scope for future research.
Conclusions 5.1.
This study explored ICT access in order to establish the digital divide in Kigali City. The research was
placed within the context of spatial and socio-economic correlates of digital access and the role of policy
intervention in improving access. Hence, it adopted a mixed method of analysis; Quantitative-qualitative
Method. In order to establish the existence or otherwise of the digital divide it examined the digital key
performance indicators of ICT asset ownership and use by location. It presented a spatial grouping of
indicators, explored relations with correlates across space and tested the spatial pattern of overall
performance. Key projects targeted at universal access were examined to find evidence for policy efforts.
The digital divide does exist in Kigali City. It is manifested in two ways; ICT access dimensions (assets and
use by location) and space, both embedded in existing socio-economic conditions. The study reveals the
dominance of household ICT asset ownership of TV and mobile phones. Internet use by location (home,
offices/schools, cyber cafés and others) does not match physical ICT asset ownership. Such a mismatch
represents dimensional digital divide (subsection 4.1.1). Of all Internet access outlets, cyber café still
remains dominant. When this is added to the fact that Internet use is less than household ownership of
assets required for Internet it becomes clear that the Kigali City is at the rudimentary stage of digital
access. On spatial-digital divide, Location Quotient analysis shows administrative sectors with ICT
utilisation concentrations, the ICT-Basic sectors, which account for 48.6% of all 35 sectors of Kigali City.
The spatial grouping of the city into clusters reveals one dominant and high performing cluster at the core
of the city, the Kicyiru-Nyarugenge region, 100%-composed of sectors of ICT-Basic status. Still within the
core, but westwards, lies the intermediate and medium-high performing cluster, composed of a mix of
sectors of ICT-Basic and ICT-Non-Basic statuses. Two clusters of medium-low and low performance are
found mainly in the north-eastern and south-western peripheries of Kigali City, represented by Bumbogo-
Rutunga-Nduba and Gahanga-Kanyinya regions respectively. The overall access performance, using
aggregated Location Quotient, shows that the spatial distribution of ICT access and use is significantly
clustered. This test indicates the existence of the digital divide in Kigali City. Further analysis using Anselin
LISA/Local Moran‘s I has enabled the identification of specific co-types, High-High clusters at the core
and Low-Low ICT clusters at the northeastern periphery; thereby revealing the actual intra-urban digital
divide. This gives insights into areas that are favourably-inclined to ICT and are well-resourced to acquire
emerging technologies; with potential for playing a key role in the technology-mediated urban services
while others lag behind. Such disproportionate spatial concentration of ICTs corroborates earlier findings
in digital divide studies (Nishida et al., 2014; Pick et al., 2015; Song, 2008; Zook, 2001).
Based on the results it is concluded here that geography and socio-economic conditions do play significant
roles in ICT access of the city. Analysis of spatial-economic correlates of ICT access in Kigali indicates
that existing conditions which typically underscore the distribution of urban services and opportunities are
replicated in this context. Principal factors associated with access are the existing infrastructure (typified by
electricity), socio-economic activity (employment), agglomerative strength (share of total population) and
planning status or settlement informality (proportion of sector planned). Besides, gendering of access is
still significant in Kigali City and should be taken into consideration for demographic targeting, at variance

EXPLORING THE URBAN DIGITAL DIVIDE IN KIGALI; SPATIAL ANALYSIS AND INSTITUTIONAL ADAPTATION
54
with a recent observation of less significant gender correlate of digital access in response to narrowing
gender gaps (see Li & Ranieri, 2013), albeit their investigation was based on direct user survey. Therefore,
in ICT access, the significance of gender, a typical socio-cultural construct, varies with the case under
investigation.
The policy initiatives are anchored on National Information and Communication Infrastructure Plans.
The research finds the ICT policy initiatives to be rooted in innovation networks of actors working across
themes and geographies. Key actors are MYICT (policy formulation), RDB (implementation), RURA
(ICT market regulation), Airtel and other operators (service provision), OLPC, RTN, RINEX (not-for-
profit ICT intermediaries) and Rwanda Online (e-government solution partner). Most of the projects are
socially progressive, based on the accounts of the actors and official documentation, as they are mainly
geo-demographically-targeted at ICT-deficient clusters. However, they are challenged by poor electricity,
paucity of funds, low-level local skills pool to domesticate and/or develop technology and content, and
self-exclusion tendencies among certain segments of the target population. With these institutional
characteristics, in line with Madon et al. (2009), the efforts at closing gaps in ICT access in Kigali City are
institutionalised; they are built on structures linked to social activities and materially-resourced, in a policy-
supported environment. The key gap-closing institutions, mechanisms and resources are being adaptively
applied to bridge the gap in ICT access evidenced by a change-driven and change-driving ICT master plan,
with tangible expressions in projects, albeit mainly conceived at the centre.
In addition to the contribution to the study of the digital divide at the micro-spatial level or intra-urban
scale, this study applied robust spatial pattern/distribution test to establish the existence of the digital
divide in Kigali. This contributes to existing research on the topic in two ways. First, it is an objective
investigation of spatiality and digitality; that location or geography plays a role in digital access and
emerging technology-mediated urban culture, service and economy. The physical-spatial divide replicates
itself in cyberspace, in form of the digital divide. This contributes to the ongoing debate on the spatiality
of technology-mediated urbanism (Graham, 2011, 2015; Graham & Marvin, 2001). It draws from and
redounds to the multi-disciplinary theoretical and methodological perspectives on technology and the city;
the spatial-econometric thinking of technology use, innovation and the networked economies (Arribas-Bel
et al., 2015; Johansson et al., 2007). Second, the core of spatial analysis is to establish the local patterns
that actually exist, beyond what seems to exist (Anselin, 1995). As most studies typically focus on the
description of the digital divide and socio-economic correlates (see section 1.1), the present study
redounds to recent efforts(Nishida et al., 2014; Pick et al., 2015; Tranos et al., 2014) at spatial testing of
the actual patterns of digital access that do exist in the case in point. Given that the phenomenon
(object of analysis) occurs in space, this study has added concrete spatial context to the discourse on the
digital divide, beyond demographics and abstract statistics. It incorporates and addresses the where
component and spatial interdependence of the digital divide.
Furthermore, at a time when multidisciplinary approaches and mixed methods are gaining ground, this
current study contributes to the Quant-qual research community. The contribution is linked to the
research findings and insights that are rooted in empirical quantitative analysis (state/pattern and
underlying factors of the digital divide), while incorporating qualitative analysis of problem context in
aspects that entail exploring policies, projects, actors and situated issues in bridging the digital divide
(policy response).
Beyond methods and perspectives, the study contributes to understanding and incorporating emerging
dimensions (ICT asset and use) of urban inequality, an issue of especial significance to the social and
spatial sciences. It contributes to conceptualising unequal access with focus beyond traditional urban
infrastructures, services and opportunities. This point is cogent in view of the increasing role of

EXPLORING THE URBAN DIGITAL DIVIDE IN KIGALI; SPATIAL ANALYSIS AND INSTITUTIONAL ADAPTATION
55
information and cyberspace in modern urban services and daily life, in which old inequalities are being
replicated.
Contributions to Policy 5.2.
This research has implications for planning, policy and research. The spatial analysis of ICT access in
Kigali City provides scope for understanding ICT opportunities at the intra-urban levels. Hence, it can
help planners, policy makers, providers and project development partners recognise the need and
subsequently integrate ICT dimensions with traditional planning and provision of urban services. It
therefore recommends that standards be developed for incorporating access network into building design
from the beginning in planned residential and public buildings, including schools. This means in the
emergent digital economy and e-urban services, it should be considered an irreducible minimum
integrating ICT access with planning for physical infrastructure, fibre access network and public spaces.
Internet access points are a tool for digital inclusion and should be incorporated in the design of new
public spaces and/or review of existing ones to ensure access across space and groups since the cyber
space is fast becoming the new public space. This kind of integration becomes critical when viewed
against the background that digital indicators and policy initiatives analysed here confirm that existing
infrastructure access and socio-economic strata are correlates of ICT access.
The study is of especial relevance to urban space-based policy as it disaggregates ICT access, at intra-urban
levels, a further research effort previously recommended in the literature (Pick & Nishida, 2015).The
current study is a Spatial Level Analysis improvement on the existing studies at national and regional scales
(see section 1.2). Hence, beyond generalised national and regional analyses for macro-spatial policy, the
ICT-deprived within the city can now be targeted by local authorities. Besides, premium ICT clusters can
serve as the hubs for driving innovation and spatial attraction of the private sector operators while the less
penetrated clusters become priority targets for ICT interventions and niche markets for the operators.
This contribution has been made possible by the application of the Local Moran I, which disaggregates
data and spots the target clusters of concentration and sparsity. These inherent spatial disparities in ICT
performance would seem non-existent with descriptive statistics and visualisation. The research therefore
provides scope for evidence-based ICT-intervention programmes. Intra-urban disaggregation of ICT-
indicators can be used for future panel data analysis for policy performance assessment. Taking the
current study as the baseline, ICT performance monitoring can track the trends to ascertain how ICT-
Non-Basic sectors or clusters improve overtime. This is relevant for ICT-Project Monitoring &
Evaluation by such agencies as RDB, MYICT and RURA.
Interoperability needs to be considered for policy focus as regards ICT performance indicators. This will
entail integrating the household access indicators (available at National Institute of Statistics, Rwanda)
with official and broader key performance indicators of ICT policy (at Ministry of Youth and ICT,
Rwanda) in goal setting and monitoring. This is currently amiss and disjointed.
The issue of affordability was frequently recalled during the survey of policy initiatives. This is a
complicated case since the regulator has no power over pricing. It is recommended that the ongoing mass
connectivity, tax exemption for computer and ICT equipment producers and assemblers be intensified.
However, the current dominance of a single computer manufacturer lacks the potential to reduce price.
Hence, it is recommended that local and smaller players be motivated even if at regional scales to bridge
the gap, obviate the situation in which external forces play significant roles in setting private sector goals
and determining prices. In addition, it was found that the operators were comparatively less aware about
the policy initiatives than any other actor, thereby obfuscating the affordability/universality-profitability
divergence. It is therefore recommended that operators be specially informed about government ICT
EXPLORING THE URBAN DIGITAL DIVIDE IN KIGALI; SPATIAL ANALYSIS AND INSTITUTIONAL ADAPTATION
56
visions and projects, in order to have them key in to the initiatives, using various incentives such as low-
cost sites and fast tracked permit in ICT-Non-Basic communities. This has potential for long-term
affordability since it is agreed and expected that incremental investments and ubiquitous broadband access
would force down prices.
Furthermore, the tendency of self-exclusion among some target groups, found during policy initiative
analysis, goes beyond quantitative geo-demographic correlates of ICT in research, policy-making and
project implementation. This gives credence to the value of the mixed method (Quant-qual analysis)
applied in this study. Such factors as level of education, electricity and population can be more easily
identified and quantified from census data. Conversely, the tendency for adverse perception that ICT is
designed for the rich and educated (self-exclusion) is better captured qualitatively. Hence understanding
this aspect through qualitative problem detection for targeted awareness creation could redound to the
outcomes of policy initiatives.
Limitations and Future Research Directions 5.3.
This study set the goal of analysing digital access at an intra-urban level to check that there is a divide
associated with socio-economic and spatial correlates amidst institutional efforts to improve access.
Though it has achieved this goal, which could aid space-based ICT policy initiatives and research, it
aggregates household data based on National Institute of Statistics of Rwanda (2015), with its typical
census data publication time lag and has not considered ICT access at household or individual levels.
While it shows variations within urban spatial units and serves as an improvement on the existing macro-
spatial studies, further intra- spatial variations (finer Spatial Levels of Analysis, SLAs, than the current
SLA) are equally important and should be explored to reduce the risk of ecological fallacy: assumed
evenness of access within each spatial level of analysis.
Another limitation, which is tied to data availability, is the absence of time-series data that could have
enriched the research in terms of spatial-temporal analytics. This could have helped to understand the
changing geographies of ICT-penetration over time. However, this study, having not found any such
synchronous data at the intra-urban levels, becomes the foundation for future space-time ICT research in
Kigali City.
The third limitation is the type and diversity of ICT indicators. The indicators agree with the existing
census data and are in line with the current level of ICT development of Kigali City. However, elements of
user-professed motivation or barriers to access such as affordability, digital skills, cyber security concerns
and regulatory restrictions on use and content could be treated. These were mitigated, indirectly, by actor
interviews through which affordability and motivation elements were revealed. The studies of these
elements are important in order to understand behavioural aspects and find possible objective-subjective
mismatches; possible users‘ contentment amidst officially-reported/census-based low access performance
or dissatisfaction amidst census-based high access performance(Berhe et al., 2014). Besides, the actual
activities of the users can be explored. However, embarking on a user survey means the spatial coverage of
all 35 sectors of Kigali, the original design of the research, is unfeasible within the current research
framing and timeline; hence the trade-off between spatial-demographic coverage and dimensions of ICT
KPIs. Besides, the alternative source of big data for micro-spatial and broader KPIs, which is mobile
phone service providers, is typically expensive, if ever made available. The hording of such data is mainly
due to competitive market intelligence and regulatory concerns among the operators.
Overall, in those limitations lie prospects for designing future ICT utilisation research. A realistic research
proposal recognises that not all constraints can be fixed in a single study. One of the possibilities is to

EXPLORING THE URBAN DIGITAL DIVIDE IN KIGALI; SPATIAL ANALYSIS AND INSTITUTIONAL ADAPTATION
57
explore finer levels, trading off some indicators where data is limiting. It is also possible to accommodate
more indicators at finer levels using primary data survey, where secondary data is limiting, but with spatial
coverage trade-off. Another possibility is to consider indicators in space-time analytics to monitor ICT-
cluster status change taking the current work as a baseline, trading off some indicators and finer levels. On
the part of digital bridge policy analysis, there are also opportunities. Further analysis should map the
actual spatial pattern of the ICT programmes and investments. Another policy research potential is the
analysis of ICT policy performance; tracking trends, drivers and emerging challenges overtime. As
research builds the body of knowledge with the development and application of improved technology and
methods more could be achieved across space, time and dimensions.
Certain aspects of the qualitative data used in this study need to be placed in context. Actors‘ views were
limited to their knowledge of the existing condition and possibilities of ICT in Kigali City at the time the
fieldwork was conducted. In addition, their personal and/or organisational standing on the issues being
discussed could also have had some influence on their responses, within the circumstance and manner in
which the questions were presented to them. However, seeking similar answers from respondents who
belonged to different groups (triangulation of actors‘ responses) helped to ensure diversity and
consistency.

EXPLORING THE URBAN DIGITAL DIVIDE IN KIGALI; SPATIAL ANALYSIS AND INSTITUTIONAL ADAPTATION
58

59
LIST OF REFERENCES
Andreasson, K. (2012). Smart policies to close the digital divide: Best practices from around the world. London:The Economist Intelligence Unit. Retrieved from http://unpan1.un.org/intradoc/groups/public/documents/un-dpadm/unpan049753.pdf
Anselin, L. (1995). Local indicators of spatial association — LISA. Geographical Analysis, 27(2), 93–115. http://doi.org/10.1111/j.1538-4632.1995.tb00338.x
Arribas-Bel, D., Kourtit, K., Nijkamp, P., & Steenbruggen, J. (2015). Cyber cities: social media as a tool for understanding cities. Applied Spatial Analysis and Policy, 8(3), 231–247. http://doi.org/10.1007/s12061-015-9154-2
Barzilai-Nahon, K. (2006). Gaps and bits: conceptualising measurements for digital divides. The Information Society, 22(5), 269–278. http://doi.org/10.1080/01972240600903953
Basu, P., & Chakraborty, J. (2011). New technologies, old divides: Linking internet access to social and locational characteristics of US farms. GeoJournal, 76(5), 469–481. http://doi.org/10.1007/s10708-010-9370-x
Baum, S., Gellecum, Y. Van, & Yigitcanlar, T. (2004). Wired communities in the City: Sydney, Australia. Australian Geographical Studies, 42(2), 175–192. http://doi.org/10.1111/j.1467-8470.2004.00274.x
Berhe, R. T., Martinez, J., & Verplanke, J. (2014). Adaptation and dissonance in quality of life: A case study in Mekelle, Ethiopia. Social Indicators Research, 118(2), 535–554. http://doi.org/10.1007/s11205-013-0448-y
Bryman, A. (2012). Social research methods (4th ed.). Oxford;New York: Oxford University Press.
Burger, M., van Oort, F., & van der Knaap, B. (2010). A treatise on the scale-dependency of agglomeration externalities and the Modifiable Areal Unit Problem. Scienze Regionali, 9, 19–40.
Butcher, N. (1998). The possibilities and pitfalls of harnessing ICTs to accelerate social development: A South African perspective. Johannesburg: South African Institute for Distance Learning.
Chary, M., & Aikins, S. K. (2009). Policy as a bridge across the global digital divide. In E. Ferro, Y. K. Dwivedi, J. R. Gil-Garcia, & M. D. Williams (Eds.), Handbook of research on overcoming digital divides: Constructing an equitable and competitive information society (pp. 40–56). Hershey: IGI Global. http://doi.org/10.4018/978-1-60566-699-0.ch003
City of Kigali. (2013a). City of Kigali Development Plan(CKDP) 2012/2013-2018: Draft report. Kigali: CoK.
City of Kigali. (2013b). Detailed district physical plans for Kicukiro and Gasabo, Kigali Rwanda: Kigali City; analysis, benchmarking & vision report. Kigal: CoK.
City of Kigali. (2017). City of Kigali: Administrative structure. Retrieved February 9, 2017, from http://www.kigalicity.gov.rw/index.php?id=60&L=1
Crang, M., Crosbie, T., & Graham, S. (2006). Variable geometries of connection: Urban digital divides and the uses of information technology. Urban Studies, 43(13), 2551–2570.
Criqui, L. (2015). Infrastructure urbanism : Roadmaps for servicing unplanned urbanisation in emerging cities. Habitat International, 47, 93–102. http://doi.org/10.1016/j.habitatint.2015.01.015
Dewan, S., & Riggins, F. J. (2005). The digital divide: Current and future research directions. Journal of the Association for Information Systems, 6(12), 298–337.
Edwards, R., & Holland, J. (2013). What is qualitative interviewing? “What is?” Research Methods Series (1st ed.). London: Bloosbury. http://doi.org/10.5040/9781472545244
European Commission. (2003). New e-European indicator handbook. Brussels: European Commission.
60
European Commission. (2015). Cyber security: Report. Brussel.EU. Retrieved from http://bookshop.europa.eu/en/cyber-security-pbDR0115143/
Eynon, R., & Helsper, E. (2014). Family dynamics and internet use in Britain: What role do children play in adults‘ engagement with the internet? Information, Communication & Society, 4462(June 2015), 1–16. http://doi.org/10.1080/1369118X.2014.942344
Ghezelayagh, M., Yaghoubi, S., Alizadeh, J., Sasanpour, S., Branch, N. A., Abad, N., & Branch, K. (2014). Spatial analysis and ranking of information and communication technology(ICT) indicators of the East Azarbaijan Province Cities. Indian Journal of Fundamental and Applied Life Sciences, 4, 745–757.
Gloor, P. A. (2006). Swarm creativity: Competitive advantage through collaborative innovation networks. New York: Oxford University Press. http://doi.org/10.1111/j.1540-5885.2007.00258_2.x
Graham, M. (2011). Time machines and virtual portals: the spatialities of the digital divide. Progress in Development Studies, 11(3), 211–227. http://doi.org/10.1177/146499341001100303
Graham, M. (2015). Information geographies and geographies of information. In A. Fard & T. Meshkani (Eds.), New geographies 07: Geographies of information (pp. 159–166). Cambridge: Havard University Press.
Graham, M., Ojanperä, S., & Friederici, N. (2017). The Impact of Connectivity in Africa: Grand Visions and the Mirage of Inclusive Digital Development. Electronic Journal of Information Systems in Developing Countries., (in press).
Graham, S., & Marvin, S. (2001). Splintering urbanism: Networked infrastructures, technological mobilities and the urban condition (1st ed.). London: Routledge.
Grant, U. (2012). Education for All Global Monitoring Report: Youth and skills: Putting education to work; Urbanisation and the employment opportunities of youth in developing countries. Paris: UNESCO. Retrieved from http://www.unesco.org/ulis/cgi-bin/ulis.pl?catno=217879&set=00550F1190_1_349&gp=0&lin=1&ll=1
Haight, M., Quan-haase, A., Corbett, B. A., Haight, M., Quan-haase, A., & Revisiting, B. A. C. (2014). Revisiting the digital divide in Canada:The impact of demographic factors on access to the internet , level of online activity , and social networking site usage. Information, Communication & Society, 17(4), 503–519. http://doi.org/10.1080/1369118X.2014.891633
Holloway, D. (2005). The digital divide in Sydney. Information, Communication & Society, 8(2), 168–193. http://doi.org/10.1080/13691180500146276
Hove, M., Ngwerume, E. T., & Muchemwa, C. (2013). The urban crisis in Sub-Saharan Africa: A threat to human security and sustainable development. Stability, 2(1), 1–14. http://doi.org/10.5334/sta.ap
Howard, P. N., Busch, L., & Sheets, P. (2010). Comparing digital divides: Internet access and social inequality in Canada and the United States. Canadian Journal of Communication, 35(1), 109–128.
International Telecommunication Union. (2014). Manual for measuring ICT access and use by households and individuals. Geneva: ITU.
International Telecommunication Union. (2016). ICT Development Index 2015. Retrieved May 22, 2016, from https://www.itu.int/net4/ITU-D/idi/2015/
ITU. (2016). Key areas of action. Retrieved July 14, 2016, from https://www.itu.int/en/action/Pages/default.aspx
ITU/UNESCO. (2015). The state of broadband 2015. Geneva: ITU.
Jaglin, S. (2008). Differentiating networked services in Cape Town: Echoes of splintering urbanism? Geoforum, 39(6), 1897–1906. http://doi.org/10.1016/j.geoforum.2008.04.010
Johansson, B., Karlsson, C., & Stough, R. (2007). The emerging digital economy: entrepreneurship, Cluster and policy; Advances in spatial science. Berlin: Springer. http://doi.org/10.1007/978-3-642-17940-2
Kelley, M. J. (2014). Urban experience takes an informational turn: Mobile internet usage and the unevenness of geosocial activity. GeoJournal, 79(1), 15–29. http://doi.org/10.1007/s10708-013-9482-

61
1
Kneebone, E., & Garr, E. (2009). The landscape of recession:Unemployment and safety net services across urban and suburban America. Washington D.C.Metropolitan Policy Program at Brookings Institution.
Lancaster, H. (2016). Rwanda - telecoms, mobile and broadband - statistics and analyses. Retrieved November 6, 2016, from https://www.budde.com.au/Research/Rwanda-Telecoms-Mobile-and-Broadband-Statistics-and-Analyses
Li, Y., & Ranieri, M. (2013). Educational and social correlates of the digital divide for rural and urban children: a study on primary school students in a provincial city of China. Computers & Education, 60(1), 197–209. http://doi.org/10.1016/j.compedu.2012.08.001
Loader, B. (1998). Cyberspace divide: Equality, agency, and policy in the information society. (B. Loader, Ed.) (1st ed.). Florence: Routledge.
Luca, L. de, Sahy, H., Joshi, S., & Cortes, M. (2013). Learning from catalysts of rural transformation:rural employment and decent work programme. Journal of Chemical Information and Modeling (Vol. 53). Geneva: International Labour Organisation(ILO). http://doi.org/10.1017/CBO9781107415324.004
Madon, S., Reinhard, N., Roode, D., & Walsham, G. (2009). Digital inclusion projects in developing countries: processes of institutionalisation. Information Technology for Development, 15(2), 95–107. http://doi.org/10.1002/itdj.20108
Martin, R. (2012). Regional economic resilience, hysteresis and recessionary shocks. Journal of Economic Geography, 12(1), 1–32. http://doi.org/10.1093/jeg/lbr019
Ministry of Infrastructure Rwanda. (2015). National Urbanisation Policy. kigali: MININFRA.
Ministry of Infrastructure Rwanda. (2016). Kigali City Master Plan. kigali: MININFRA.
Ministry of Youth & ICT Rwanda. (2015a). National ICT Strategy and Plan NICI - 2015. Kigali: MYICT.
Ministry of Youth & ICT Rwanda. (2015b). Smart Rwanda Master Plan(SRMP) 2015-2020: A prosperous and knowledgeable society through SMART ICT. Kigali: MYICT.
Myrdal, G. (1957). Economic theory and underdeveloped regions. London: Duckworth.
National Communication Commission-Nigeria. (2016). Universal Service Provision Fund(USPF): Ongoing projects. Retrieved July 14, 2016, from http://www.uspf.gov.ng/
National Institute of Statistics of Rwanda. (2012). Integrated Household Living Conditions Survey(EIVC3): Distrct profile, Kigali-Gasabo. Kigali. NISR.
National Institute of Statistics of Rwanda. (2014). Fourth Population and Housing Census, Rwanda, 2012: Thematic report; Socio-economic status of youth. Kigali. NISR.
National Institute of Statistics of Rwanda. (2015). District profiles: Kicukiro, Nyarugenge and Gasabo. Kigali. NISR.
Negroponte, N. (1995). Being digital (1st ed.). New York: Vintage Books.
Nishida, T., Pick, J. B., & Sarkar, A. (2014). Japan‘s prefectural digital divide: A multivariate and spatial analysis. Telecommunications Policy, 38(11), 992–1010. http://doi.org/10.1016/j.telpol.2014.05.004
Noce, A. A., & McKeown, L. (2008). A new benchmark for internet use: A logistic modeling of factors influencing Internet use in Canada, 2005. Government Information Quarterly, 25(3), 462–476. http://doi.org/10.1016/j.giq.2007.04.006
Odufuwa, F. (2012). Understanding what is happening in ICT in Nigeria: A supply- and demand-side analysis of ICT sector (Evidence for ICT policy action, poilicy paper No. 6). Cape Town.Research ICT Africa(RIA).
OECD. (2011). Programme for International Student Assessment (PISA) 2009 results : Students online and performance (Vol. VI). Paris: OECD.
Ospina, A. V., & Heeks, R. (2010). Linking ICTs and climate change adaptation: A conceptual framework for e-resilience and e-adaptation. Ottawa: International Development Research Centre.

62
Ospina, A. V, & Heeks, R. (2015). Benchmarking , visualising and strengthening ICTs ‘ impact on agricultural livelihoods ‘ resilience : A Costa Rica Case Study, 1–12.
Pacione, M. (2001). Urban geography: A global perspective (2nd ed.). New York: Routledge.
Pick, J. B., & Nishida, T. (2015). Digital divides in the world and its regions: A spatial and multivariate analysis of technological utilization. Technological Forecasting and Social Change, 91, 1–17. http://doi.org/10.1016/j.techfore.2013.12.026
Pick, J. B., & Sarkar, A. (2015). The global digital divides: Explaining change. Berlin: Springer. Retrieved from https://books.google.com/books?id=swlJCAAAQBAJ&pgis=1
Pick, J. B., Sarkar, A., & Johnson, J. (2015). United States digital divide: State level analysis of spatial clustering and multivariate determinants of ICT utilization. Socio-Economic Planning Sciences, 49, 16–32. http://doi.org/10.1016/j.seps.2014.09.001
Prensky, M. (2001). Digital natives, digital immigrants. On the Horizon, 9(5), 1–6. http://doi.org/10.1108/10748120110424816
Reades, J., Calabrese, F., Sevtsuk, A., & Ratti, C. (2007). Cellular census : exploration in urban data collection. Institute of Electronics and Electrical Pervasive Computing Pervasive Computing, 6(3), 30–38. http://doi.org/10.1109/MPRV.2007.53
Riddlesden, D., & Singleton, A. D. (2014). Broadband speed equity: a new digital divide? Applied Geography, 52, 25–33. http://doi.org/10.1016/j.apgeog.2014.04.008
Rogers, E. M. (1995). Diffusion of innovations (3rd ed.). New york: The Free Press. http://doi.org/citeulike-article-id:126680
Rogerson, P. (2015). Statistical methods for geography: A student’s guide (4th ed.). Los Angeles: Sage.
RURA. (2013). Strategic Plan 2013-2018. Retrieved from https://www.uow.edu.au/content/groups/public/@web/@spq/documents/doc/uow135458.pdf
RURA. (2016a). Statistics and tariff information in telecommunication, media and postal service as of March 2016. Retrieved from http://www.rura.rw/fileadmin/docs/Statistics_report_1st__quarter___2016_02.pdf
RURA. (2016b). Universal Access Fund and broadband penetration. Retrieved June 1, 2016, from http://www.rura.rw/index.php?id=143
Rwanda Environmental Management Authority. (2013). Kigali: State of environment and outlook report 2013. Kigali: REMA.
Rwanda Online Platform. (2017). Irembo: Republic of Rwanda. Retrieved January 28, 2017, from https://irembo.gov.rw/rolportal/web/rol/aboutus
Sahin, I. (2006). Detailed review of rogers‘ diffusion of innovations theory and educational technology-related studies based on Rogers‘ theory. The Turkish Online Journal of Educational Technology, 5(2), 14–23.
Smit, M. J., Abreu, M. A., & de Groot, H. L. F. (2013). Micro-evidence on the determinants of innovation in the Netherlands: The relative importance of absorptive capacity and agglomeration externalities. Papers in Regional Science, 94(2), 250–272. http://doi.org/10.1111/pirs.12068
Song, W. (2008). Development of the Internet and digital divide in China : A spatial analysis. Intercultural Communication Studies, 12(3), 20–43.
Statistics New Zealand. (2004). New Zealand: An urban/rural profile. Wellington: Statistics NZ. Retrieved from http://www.stats.govt.nz/browse_for_stats/people_and_communities/Geographic-areas/urban-rural-profile-update.aspx
Steenbruggen, J., Borzacchiello, M. T., Nijkamp, P., & Scholten, H. (2013). Mobile phone data from GSM networks for traffic parameter and urban spatial pattern assessment: A review of applications and opportunities. GeoJournal, 78(2), 223–243. http://doi.org/10.1007/s10708-011-9413-y
Talvitie, J. (2004). Incorporating the impact of ICT into Urban and Regional Planning. European Journal of Spatial Development, (10), 1–32.

63
Terlouw, K., & Denkers, R. (2011). The geography of regional websites: Regional representation and regional structure. Geoforum, 42(5), 578–591. http://doi.org/10.1016/j.geoforum.2011.05.003
Tranos, E., Kourtit, K., & Nijkamp, P. (2013). Mobile phone data and urban analysis : An exploratory space – time study. Tinbergen Discussion Paper, 139(8), 1–14.
Tranos, E., Kourtit, K., & Nijkamp, P. (2014). Digital urban network connectivity: Global and Chinese internet patterns. Papers in Regional Science, 93(2), 409–428. http://doi.org/10.1111/pirs.12097
UN-Habitat. (2015). The role of ICT in the proposed Urban Sustainable Development Goals and the New Urban Agenda. Nairobi: UN-Habitat. Retrieved from http://www.ericsson.com/kn/res/docs/2014/the-role-of-ict-in-the-new-urban-agenda.pdf
UNDP. (2015). Human Development Report 2015: Work for Human Development. Retrieved from http://hdr.undp.org/sites/all/themes/hdr_theme/country-notes/MEX.pdf
US Bureau of Labour Statistics. (2011). Occupational Employment Statistics ( OES ) highlights: Using Location Quotients to analyze occupational data, (April). Retrieved from http://www.bls.gov/oes/highlight_location_quotients.pdf
van Deursen, A., Courtois, C., & van Dijk, J. (2014). Internet skills, sources of support, and benefiting from internet use. International Journal of Human-Computer Interaction, 30(4), 278–290. http://doi.org/10.1080/10447318.2013.858458
van Deursen, A. J., & Helsper, E. J. (2015). The third-level digital divide: Who benefits most from being online? Communication and Information Technologies Annual: Digital Distinctions and Inequalities Studies in Media and Communications, 10, 29–52. http://doi.org/10.1108/S2050-206020150000010002
Van Deursen, A., & Van Dijk, J. (2010). Measuring internet skills. Intl. Journal of Human–Computer Interaction, 26(10), 891–916. http://doi.org/10.1080/10447318.2010.496338
van Dijk, J. (2005). The deepening divide inequality in the information society. London: Sage Publications.
Várallyai, L., Herdon, M., & Botos, S. (2015). Statistical analyses of digital divide factors. Procedia Economics and Finance, 19(15), 364–372. http://doi.org/10.1016/S2212-5671(15)00037-4
Vicente, M. R., & López, A. J. (2011). Assessing the regional digital divide across the European Union-27. Telecommunications Policy, 35(3), 220–237. http://doi.org/10.1016/j.telpol.2010.12.013
Villasenor, J. D., West, D. M., & Robin, L. (2015). The 2015 Brookings financial and digital inclusion project: Measuring progress on financial access and usage. Washington DC: Centre for Technology Innovation at Brookings.
Whitacre, B. E. (2008). Factors influencing the temporal diffusion of broadband adoption: evidence from Oklahoma. Annals of Regional Science, 42(3), 661–679. http://doi.org/10.1007/s00168-007-0178-7
World Bank Group. (2016). World development report: Digital dividends. Washington DC. World Bank.
World Economic Forum/INSEAD. (2014). The Global Information Technology Report 2014: rewards and risks of big data. (B. Bilbao-Osorio, S. Dutta, & B. Lanvin, Eds.). Geneva: WEF/INSEAD.
World Economic Forum/INSEAD. (2015). The Global Information Technology Report 2015. (S. Dutta, T. Geiger, & B. Lavin, Eds.). Geneva: World Economic Forum/INSEAD.
Zook, M. A. (2001). Old hirearchies or new networks of centrality?: The global geography of Internet content market. American Behavioural Scientist, 44(10), 1679–1696.

64

65
ANNEXES
Household Information and Communication Technologies Asset Ownership and Use in kigali
City
A1 Asset Ownership and Use for ICT Indicators District Sector Rad TV Fixd Mobi Comp Int
home Intofsc Intcafe Intoth
Gasabo Bumbogo 70 11.7 0.3 72 1.6 40.5 45.7 56.4 12.8
Gatsata 75.1 46.7 1.4 91.6 9.3 42.9 38.3 61.6 18.5
Gikomero 69.3 0.4 0.2 50.3 0.3 25 48.2 64.3 12.5
Gisozi 70.1 40.4 0.8 90 14.3 50.7 62.6 56.6 18.2
Jabana 71.9 19.2 0.5 73.3 6.7 53.7 50.6 47.5 20
Jali 72.4 13.3 0.6 67.4 3.5 47.1 53.5 46.7 16.5
Kacyiru 76.5 58.9 2.2 94.4 25.2 57.4 58.7 49.2 15
Kimihururura 73.8 49.1 2.3 92.6 19.2 50.5 55.5 44.7 10
Kimironko 77.5 56.1 1.3 94.6 29.2 62.7 66.1 56.5 14.7
Kinyinya 69.3 31.8 1 85.4 7.9 51.3 52.8 50.5 18.9
Ndera 68.5 16.8 0.6 76.9 3.7 36.6 55.1 58.8 17
Nduba 71.9 5.7 0.3 63.3 0.8 49.2 46.2 49.2 14
Remera 74.3 48.5 1.4 92.6 18.4 51.1 55.7 50.9 15.8
Rusororo 71.2 18.1 0.6 76 5.2 37.5 44.1 67.5 16.2
Rutunga 73.5 0.7 0.1 76 0.3 18.2 58 42 29.5
Kicukiro Gahanga 67.7 12.8 0.3 74.6 1.6 38.8 47.7 66.6 20.7
Gatenga 74.6 46.9 0.7 91.5 11.1 45.3 48.8 57.8 12.7
Gikondo 76.6 57.1 2.2 95.6 24.9 51.3 52.7 65.9 22.3
Kagarama 77.5 48.4 1.5 92.9 24 59 67.9 47.5 24
Kanombe 76.4 48.4 1.3 91.4 21.1 61.6 63.8 51.8 15.3
Kicukiro 77.6 60.2 1.4 96.1 25.6 54.8 60.5 61 11.5
Kigarama 74.3 51.1 1.5 92.6 16.3 48.2 46 67.8 16.4
Masaka 72.8 19.2 0.4 79.3 4.3 33.9 44.2 61.8 18.8
Niboye 79.9 65.7 1.6 97.1 35 62 65.9 50.9 19
Nyarugunga 78.4 59.2 1.7 94.5 25.6 55.9 63.2 57.2 18.5
Nyaraugenge Gitega 74.2 54.3 0.9 93.4 12.5 29.1 43.2 69.9 8
Kanyinya 70.1 12.3 0.2 72.1 1 23.3 35.3 69 19.9
Kigali 67.7 18.9 0.4 75.2 1.6 35.9 33.3 62.6 20.6
Kimisagara 75.8 51.4 1.3 92.1 8.9 36.6 37.8 72.3 11.2
Mageragere 67.8 3.5 0.3 63 0.3 16.9 32.2 80.6 11.8
Muhima 74.5 55.6 1.9 94.6 19.4 55.5 52 58.8 20.5
Nyakabanda 78.3 56.8 1.6 94.1 17.5 46.3 45.4 60.8 15.5
Nyamirambo 75.3 51.4 1.6 91.8 18.2 45.9 49 60.5 15.4
Nyarugenge 72.4 58.6 2.3 93.6 23 56.3 49.7 52 13
Rwezamenyo 79.4 70.5 2 96.1 26.1 47.1 41.5 56 25.3

66
Location Quotients by Information and Communication Technologies Indicators in Kigali
Location Quotient (LQ) as applied in this study is explained below:
Location Quotient (LQ) = ( ⁄ )
( ⁄ )
Where is the number of households who own or use the ICT asset/Internet by location relevant to
focus digital indicator in a given administrative sector; X is the total of households in the given
administrative sector; y is the number of households who own or use the ICT asset/Internet by location
relevant to the focus digital indicator the focus digital indicator in the reference city(Kigali); Y is the total
of households in the reference city(Kigali).
The composite measure of ICT concentration, Location Quotient Aggregate (LQICTagg) is the ratio of
the sum of percentage scores for all indicators in the given sector to the sum of percentage scores for all
indicators at the reference city level (Kigali). For the purpose of context illustration:
ICTLQagg of sector A = ( )
( )
Hence location quotient compares the local share of the focus ICT indicator to that of the reference
region, Kigali City. Where ICTLQ (for individual indicator) or LQICTagg(for the composite ICT
measure) equals 1, it indicates that the sector ICT cluster or share is the same as the city share. An ICTLQ
or LQICTagg greater than 1 indicates that the sector is specialised or unique in terms of the focus
indicator or all indicators in the case of LQICTagg. Such sectors have higher concentrations of ICT asset
and/or use by location. Sectors with ICTLQ or LQICTagg less than 1 are low concentrations and less
specialised.

67
A2 Location Quotients for ICT indicators District Sector LQ
rad LQ tv
LQ Fixd
LQ mobil
LQ comp
LQ Inthome
LQ Intofsc
LQ Intercafé
LQ Intoth
LQ ICTagg
Gasabo Bumbogo 0.95 0.31 0.27 0.84 0.12 0.91 0.85 0.98 0.79 0.8
Gatsata 1.02 1.22 1.27 1.07 0.72 0.97 0.71 1.07 1.13 0.99
Gikomero 0.94 0.01 0.18 0.59 0.02 0.56 0.9 1.12 0.77 0.7
Gisozi 0.96 1.05 0.73 1.06 1.1 1.14 1.17 0.98 1.12 1.04
Jabana 0.98 0.5 0.45 0.86 0.52 1.21 0.94 0.83 1.23 0.88
Jali 0.99 0.35 0.55 0.79 0.27 1.06 1 0.81 1.01 0.83
Kacyiru 1.04 1.54 2 1.11 1.94 1.3 1.1 0.86 0.92 1.12
Kimihururura 1.01 1.28 2.09 1.09 1.48 1.14 1.04 0.78 0.61 1.02
Kimironko 1.06 1.46 1.18 1.11 2.25 1.42 1.23 0.98 0.9 1.18
Kinyinya 0.94 0.83 0.91 1 0.61 1.16 0.99 0.88 1.16 0.95
Ndera 0.93 0.44 0.55 0.9 0.28 0.83 1.03 1.02 1.04 0.86
Nduba 0.98 0.15 0.27 0.74 0.06 1.11 0.86 0.86 0.86 0.77
Remera 1.01 1.27 1.27 1.09 1.42 1.15 1.04 0.89 0.97 1.05
Rusororo 0.97 0.47 0.55 0.89 0.4 0.85 0.82 1.17 0.99 0.87
Rutunga 1 0.02 0.09 0.89 0.02 0.41 1.08 0.73 1.81 0.77
Kicukiro Gahanga 0.92 0.33 0.27 0.87 0.12 0.88 0.89 1.16 1.27 0.85
Gatenga 1.02 1.22 0.64 1.07 0.85 1.02 0.91 1.01 0.78 1
Gikondo 1.04 1.49 2 1.12 1.92 1.16 0.98 1.15 1.37 1.15
Kagarama 1.06 1.26 1.36 1.09 1.85 1.33 1.27 0.83 1.47 1.14
Kanombe 1.04 1.26 1.18 1.07 1.62 1.39 1.19 0.9 0.94 1.11
Kicukiro 1.06 1.57 1.27 1.13 1.97 1.24 1.13 1.06 0.71 1.15
Kigarama 1.01 1.33 1.36 1.09 1.25 1.09 0.86 1.18 1.01 1.07
Masaka 0.99 0.5 0.36 0.93 0.33 0.77 0.82 1.07 1.15 0.86
Niboye 1.09 1.72 1.45 1.14 2.69 1.4 1.23 0.89 1.17 1.23
Nyarugunga 1.07 1.55 1.55 1.11 1.97 1.26 1.18 0.99 1.13 1.17
Nyarugenge Gitega 1.01 1.42 0.82 1.09 0.96 0.66 0.81 1.22 0.49 0.99
Kanyinya 0.96 0.32 0.18 0.85 0.08 0.53 0.66 1.2 1.22 0.78
Kigali 0.92 0.49 0.36 0.88 0.12 0.81 0.62 1.09 1.26 0.81
Kimisagara 1.03 1.34 1.18 1.08 0.68 0.83 0.71 1.26 0.69 1
Mageragere 0.92 0.09 0.27 0.74 0.02 0.38 0.6 1.4 0.72 0.71
Muhima 1.01 1.45 1.73 1.11 1.49 1.25 0.97 1.02 1.26 1.11
Nyakabanda 1.07 1.48 1.45 1.1 1.35 1.05 0.85 1.06 0.95 1.07
Nyamirambo 1.03 1.34 1.45 1.08 1.4 1.04 0.91 1.05 0.94 1.05
Nyarugenge 0.99 1.53 2.09 1.1 1.77 1.27 0.93 0.9 0.8 1.08
Rwezamenyo 1.08 1.84 1.82 1.13 2.01 1.06 0.77 0.97 1.55 1.14

68
Sector Information and Communication Technologies Statuts and Cluster Membership
A3 Sector ICT Status
District Sector Cluster Distance to Cluster Centre
LQ ICTagg
Status
Gasabo Bumbogo 1 8.99 0.8 ICT-Non-Basic/Digital- Normal
Gatsata 2 10.32 0.99 ICT-Non-Basic/Digital- Normal
Gikomero 3 23.87 0.7 ICT-Non-Basic/Digital- Normal
Gisozi 2 19.99 1.04 ICT-Basic/Digital-Premium
Jabana 1 16.52 0.88 ICT-Non-Basic/Digital- Normal
Jali 1 10.92 0.83 ICT-Non-Basic/Digital- Normal
Kacyiru 4 6.15 1.12 ICT-Basic/Digital-Premium
Kimihururura 4 16.38 1.02 ICT-Basic/Digital-Premium
Kimironko 4 12.34 1.18 ICT-Basic/Digital-Premium
Kinyinya 2 23.97 0.95 ICT-Non-Basic/Digital- Normal
Ndera 1 11.47 0.86 ICT-Non-Basic/Digital- Normal
Nduba 1 16.33 0.77 ICT-Non-Basic/Digital- Normal
Remera 4 12.19 1.05 ICT-Basic/Digital-Premium
Rusororo 3 14.28 0.87 ICT-Non-Basic/Digital- Normal
Rutunga 1 30.08 0.77 ICT-Non-Basic/Digital- Normal
Kicukiro Gahanga 3 14.19 0.85 ICT-Non-Basic/Digital- Normal
Gatenga 2 5.64 1 ICT-Non-Basic/Digital- Normal
Gikondo 4 14.69 1.15 ICT-Basic/Digital-Premium
Kagarama 4 16.37 1.14 ICT-Basic/Digital-Premium
Kanombe 4 12.82 1.11 ICT-Basic/Digital-Premium
Kicukiro 4 10.41 1.15 ICT-Basic/Digital-Premium
Kigarama 2 8.84 1.07 ICT-Basic/Digital-Premium
Masaka 1 16.45 0.86 ICT-Non-Basic/Digital- Normal
Niboye 4 18.14 1.23 ICT-Basic/Digital-Premium
Nyarugunga 4 7.13 1.17 ICT-Basic/Digital-Premium
Nyarugenge Gitega 2 19.88 0.99 ICT-Non-Basic/Digital- Normal
Kanyinya 3 9.37 0.78 ICT-Non-Basic/Digital- Normal
Kigali 3 15.58 0.81 ICT-Non-Basic/Digital- Normal
Kimisagara 2 17.16 1 ICT-Non-Basic/Digital- Normal
Mageragere 3 22.09 0.71 ICT-Non-Basic/Digital- Normal
Muhima 4 9.91 1.11 ICT-Basic/Digital-Premium
Nyakabanda 2 11.65 1.07 ICT-Basic/Digital-Premium
Nyamirambo 2 7.20 1.05 ICT-Basic/Digital-Premium
Nyarugenge 4 10.69 1.08 ICT-Basic/Digital-Premium
Rwezamenyo 4 24.90 1.14 ICT-Basic/Digital-Premium

69
Clarifications/Notes on Data
ICT/Digital Indicators
All ICT KPIs used are based on data percentage of households whose at least one member has the
referent indicator; physical access indicators are ICT assets/devices (television, radio, fixed/land phone,
mobile phone, computer). In the dimension of use by location, the fundamental indicators are applied;
percentage of households whose at least one member has access to Internet by location (home,
school/office, cyber café and other places). Other places may not constitute a significant and regular
household access outlet. For example using other people‘s phones sometimes may not constitute a regular
access location. Computer may be desktop, laptop, tablet or similar handheld computer.
Internet access is irrespective of the device used; digital TV, tablet, mobile, computer and game machines).
Access window is defined normally as three months. Online inactivity more than three months is defined
as no access to Internet. Spatial and Socio-economic variables
Youth employment: Youth is defined in Rwanda as the population aged 14 to 35. But working age is 16-
64. The youth employed fall within age range 16 and 35. This is not household-based but individual
residents in this group aggregated at sector levels. Employment is any productive, legal engagement, in the
last seven days preceding the census. Those who are not engaged are in the last seven days are considered
temporarily inactive. The percentage of the youth employed or in a particular type of employment
(employee/employer/self-employed) is used in this study. The elderly belong to the age group 60 and
above.
Youth indicator was deliberately applied as the group plays a role in the digital use environment. This
enables the examination of the possible co-existence of youth factor and ICT access. Taking the other
extreme of youth (the elderly) makes for a clear comparison as those should naturally unveil any age-divide
in digital access. However, any possible lopsidedness is evened out since the actual ICT KPIs used are
based on cross-cutting age groups in households (irrespective of age). The extreme groups were applied
only as socio-economic correlates for relationship test, not ICT KPIs.
Secondary school age is 13-18 in Rwanda. The percentage of the population within this group who have
attained secondary school (as highest level of education) was used. For university as highest level of
education, the share of youth population who attained university education was used.
Post primary education centre is any formal school above primary school; this includes formal vocational
institutes where certificates are awarded, recognised by GoR. In this study it is the number of such centres
in a given sector. It was used as surrogate for possible innovation centres.
Share of total population is a given sector‘s population expressed as percentage of its host district. This
makes it useful for local context. Comparison is applicable since it has been regularised as a percentage.
Note that these computations were the official statistics. Where the author computes figures these are
clearly stated; for example Location Quotients.

70
A4 Variables in Analysis Variable Label
Full Name of Variable* Category Source Year
Rad Radio ICT asset NISR 2015
TV Television ICT asset NISR 2015
Fixd Fixed telephone ICT asset NISR 2015
Mobi Mobile phone ICT asset NISR 2015
Comp Computer ICT asset NISR 2015
Inthome Internet at home ICT/Internet use NISR 2015
Intofsc Internet in office/school ICT/Internet use NISR 2015
Intcafé Internet cyber café ICT/Internet use NISR 2015
Intoth Internet others ICT/Internet use NISR 2015
Percfemale Percent of females in the total population Socio-economic NISR 2015
Electricity Electricity Socio-economic
/Infrastructure
NISR 2015
Owner Home Owner Socio-economic NISR 2015
Elderpop Elder population Socio-economic NISR 2015
Youthpop Youth population Socio-economic NISR 2015
Youthsec Youth with secondary school education Social/education NISR 2015
Youthuniv Youth with university education Social/education NISR 2015
Youthemployed Youth who are employed(status) Socio-economic NISR 2015
Youthemployee Youth who are employed(type) Socio-economic NISR 2015
Youthemployer Youth who are employers(type) Socio-economic NISR 2015
Youthselfemployed Youth who are self-employed(type) Socio-economic NISR 2015
Elderemployed The Elderly who are employed(status) Socio-economic NISR 2015
Hholdheadfemale Household headed by female Socio-economic NISR 2015
Improvedwatersource Improved source of water Socio-economic
/Infrastructure
NISR 2015
Planned Planned habitat Socio-spatial/formality NISR 2015
Geoconstraint Geographic constraint Spatial/agglomerative CoK 2013
Postprycentre Post-primary education centres Spatial/agglomerative NISR 2015
Sharetotalpop Share of total population Spatial/agglomerative NISR 2015
Urbanpop Urban population Spatial/agglomerative NISR 2015
*Read accompanying clarification/note on data for description.
Those variables that typically tend to have spatial footprint and distinguish the core from the periphery
have been conceived in this context to be spatial. Some variables have elements of social and economic
constructs (socio-economic); for example female household heads who are typically the providers of the
household needs; status which could as well limit access to resources where gender is a strong factor.
Education as used here is primarily a social indicator relevant for understanding, partly, the digital natives,
awareness and general literacy. There is no hard and fast rule for this kind of categorisation and none is
being set in this study. Nomenclature has only been applied for the purpose of contextual understanding
of the underlying condition of ICT access in Kigali City.

71
Percentage planned is given in the official data and based on proportion of households in the type of
habitat (in sectors) considered to meet the planning standard required to be classified as planned,
spontaneous or others.
Urban population is defined as urban percentage of the total population. It is on the basis of settlement
type and other elements considered as dominantly urban in the given sector. It is individual resident-
based, not household. Since the data was used mainly as a spatial-statistical indicator, not directly collected
from urban planning authorities, this is expected to be generalised and sufficient for the purpose of
analysis; where the study is not particularly one of land use or settlement analysis.
Home ownership considers household tenure. It is the percentage of households who live in their own
homes. This is a (social) indicator of tenure security. ―Owner‖ may include inheritance, not necessarily
self-financed but distinguishable from tenant, free lodging, hire purchase or staff housing. Hence, quality
or formality plays less role in this case; an urban fringe household in own apartment without the modern
facilities and furnishing, which may be available in a well-manicured home at the core, is considered an
owner and enjoys the security thereof.
Electricity is a subset of household sources of energy for lighting, with others being candle, firewood and kerosene lamps mainly used in the remote/rural areas, which are most affected by power outage or in some cases not connected to the national grid. It is the percentage of households who use electricity as the primary source of lighting.
Improved water source is aggregated from households and simply classified as either improved or
unimproved, taking into account local quality standards not specified in the statistical data. As used in the
study, it is the percentage of households who have access to improved water source.
Geographic constraint is the proportion/percentage of a given sector that is unfavourable for
development purposes. Geographic constraint refers to limitations associated with land: unfavourable
steepness/topography, soils, wetlands and forests ill-suited for new development based on scientific and
ecological principles (City of Kigali, 2013). Hence, a sector‘s share of these physical-ecological ills may be
indicative of relative backwardness, which could as well be a correlate of performance in emergent
technology availability and use. For example difficulty in laying fibre optic, base transceiver stations or
poor signal due to geographic constraints could reflect in poor ICT ownership and use in the affected
sector.

72
Mobile Access Bus
A5 One of the Mobile Access/ICT Buses, Kigali
Field Interview Guide
Interview Guide for Universal Access Provision (UAP) in Kigali
I am conducting a research on ICT access in Kigali. Universal Access Provision, particularly via
Multipurpose Telecentres (MTCs)/Telecentre Networks, is important for ICT access different
geographical areas and demographic segments of the city. This interview is intended to collect information
on UAP in Kigali, the different groups involved and the working of the project(s). Kindly note that this is
an academic study, as such the information provided by any individual respondent will be treated with
utmost confidentiality. The final information can be made available to the respondent for confirmation
before publication. Your collaboration is highly appreciated.
Introduction/ background
1. Could you briefly tell me what your work is about in this organisation and the current project(s) in
which you are engaged?
Universal Access Provision in Kigali – project governance and setting
2. Could you describe the Universal Access Provision Project in Kigali?
3. Please describe how the UAP projects influence ICT access in homes, schools, city wifi points and e-
learning centres including e-libraries outside regular schools.
4. Who is/which organisations are involved in UAP in Kigali and what is their role?
-Government please mention relevant agency/agencies
- GSM operators (mention how many but name of operator not important)
- Communities
- NGOs (mention how many or use many if more than 5, Local/International)

73
No Activities(Aug. 2016-Feb.
2017)
Week 1 2 3 4 1 2 3 4 1 2 3 4 1 2 3 4 1 2 3 4 1 2 3 4 1 2 3 4
1 Proposal writing
2 Proposal presentation
3 Literature review
4 Fieldwork preparation
5 Fieldwork
6Data check, cleaning &
preliminary analysis
7 Mid-term presentation
8 Spatial statistical analysis
9 Institutional analysis
10 Compilation of output
11 Report writing
12 Thesis presentation
Feb.Aug. Sept. Oct. Nov. Dec. Jan.
-International development partners; other agencies not NGOs (please mention relevant partners
known to you).
5. Kindly describe how you arrange for meetings among the different groups involved in
UAP/MTCs/RTNS in terms of formality/informality, meeting time, venue and choice of who should
preside.
-How often do you work together in these group projects and/or share results or data from
UAP/MTCs/RTNs among these groups?
6. What do you think of the future of the UAP in Kigali? (Please base this on your experience in the
project(s), relationship between groups, socio-economic realities of the city/central government and
others)
UAP- positive outcomes
7. State in which of the public access points (homes, schools, central Wi-Fi points etc) above you think the
UAP has worked best.
8. Why do you think that the aspect(s) you mentioned are where the UAP has worked best?
UAP – challenges ahead/ limiting factors
9. Discuss the aspects of UAP in Kigali you would need to improve in relation to the following issues:
For example funding, knowledge of role and cooperation among groups (eg. clarity of goals and roles,
awareness, group mobilisation/empowerment, also skills, urban economy), community participation, private
sector investment and other organised private sector support (please specify).
10. Which of the constraints would you consider the strongest of these limiting factors stated above?
Thesis Work plan