Exploring the Structure of the Illegal Market for Cannabis
16
De Economist (2006) 154:547–562 © Springer 2006 DOI 10.1007/s10645-006-9029-7 DE ECONOMIST 154, NO. 4, 2006 EXPLORING THE STRUCTURE OF THE ILLEGAL MARKET FOR CANNABIS ∗∗∗ BY CHRIS WILKINS ∗,∗∗ AND PAUL SWEETSUR ∗∗ Summary This paper explores the middle and retail levels of the illegal market for cannabis in New Zealand using national household drug survey data. Those who reported purchasing half or full ounces of cannabis were defined as middle level market participants, while those who purchased smaller weights or merely used cannabis were defined as retail level participants. Those who had pur- chased cannabis were then further categorised as either cannabis ‘buyers’ (i.e. those who only purchased sufficient cannabis for their own consumption needs) or cannabis ‘dealers’ based on whether the surplus of cannabis they had, after their own personal consumption was deducted, exceeded the legal definition of cannabis dealing (i.e. possession of 28g of cannabis or more). Nine per cent of those who had purchased cannabis in the previous year were categorised as mid- dle level participants with 69% of these defined as middle level dealers and 31% as middle level buyers. Middle level cannabis dealers were projected to earn, on average, $2927 (NZD) net annual profit from selling surplus (rate of return of 34%). There was a wide variation in the projected net earnings of the middle level cannabis dealers with the majority earning only modest incomes (bottom 50% – $260per year, top 10% – $25000 per year). Participants at all levels of the mar- ket commonly reported receiving cannabis for ‘free’ and this is likely to reflect the social sharing of cannabis during group consumption and non-cash payments for cannabis. This barter and gift giving tradition may provide cannabis users with a degree of insulation from any price increases for cannabis brought about by law enforcement activity. Cannabis selling creates a convenient source of income for heavy cannabis users to finance their own personal cannabis consumption, which may also dampen the impact of any rise in price brought about by law enforcement success. ∗ Corresponding author: e-mail: [email protected] ∗∗ Centre for Social and Health Outcomes Research and Evaluation (SHORE), Massey University, P.O. Box 6137, Wellesley Street, Auckland, New Zealand. ∗∗∗ The 2003 HBS-Drug Use was funded by the New Zealand Ministry of Health and carried out as part of the Public Health Intelligence (PHI) Health Behaviours Survey Monitor. The statistical design for the 2003 survey was completed by Dr. Megan Pledger at SHORE, and by James L. Reilly from Statistical-Insights. The questionnaire was adapted and extended from the National Drug Survey questionnaire for the Health Behaviours programme by Dr. Chris Wilkins. Data collection was managed by Dr. Chris Wilkins, Rachael Lane, Joe Morley and Mary Blade. The statistical analysis of 2003 HBS-Drug Use was completed by Paul Sweetsur. The analysis in this paper was partly funded by the New Zealand Police.
-
Upload
chris-wilkins -
Category
Documents
-
view
218 -
download
1
Transcript of Exploring the Structure of the Illegal Market for Cannabis

De Economist (2006) 154:547–562© Springer 2006DOI 10.1007/s10645-006-9029-7
DE ECONOMIST 154, NO. 4, 2006
EXPLORING THE STRUCTURE OF THE ILLEGAL MARKETFOR CANNABIS∗∗∗
BY
CHRIS WILKINS∗,∗∗ AND PAUL SWEETSUR∗∗
Summary
This paper explores the middle and retail levels of the illegal market for cannabis in New Zealandusing national household drug survey data. Those who reported purchasing half or full ouncesof cannabis were defined as middle level market participants, while those who purchased smallerweights or merely used cannabis were defined as retail level participants. Those who had pur-chased cannabis were then further categorised as either cannabis ‘buyers’ (i.e. those who onlypurchased sufficient cannabis for their own consumption needs) or cannabis ‘dealers’ based onwhether the surplus of cannabis they had, after their own personal consumption was deducted,exceeded the legal definition of cannabis dealing (i.e. possession of 28 g of cannabis or more).Nine per cent of those who had purchased cannabis in the previous year were categorised as mid-dle level participants with 69% of these defined as middle level dealers and 31% as middle levelbuyers. Middle level cannabis dealers were projected to earn, on average, $2927 (NZD) net annualprofit from selling surplus (rate of return of 34%). There was a wide variation in the projectednet earnings of the middle level cannabis dealers with the majority earning only modest incomes(bottom 50% – $260 per year, top 10% – $25000 per year). Participants at all levels of the mar-ket commonly reported receiving cannabis for ‘free’ and this is likely to reflect the social sharingof cannabis during group consumption and non-cash payments for cannabis. This barter and giftgiving tradition may provide cannabis users with a degree of insulation from any price increasesfor cannabis brought about by law enforcement activity. Cannabis selling creates a convenientsource of income for heavy cannabis users to finance their own personal cannabis consumption,which may also dampen the impact of any rise in price brought about by law enforcement success.
∗ Corresponding author: e-mail: [email protected]∗∗ Centre for Social and Health Outcomes Research and Evaluation (SHORE), MasseyUniversity, P.O. Box 6137, Wellesley Street, Auckland, New Zealand.∗∗∗ The 2003 HBS-Drug Use was funded by the New Zealand Ministry of Health and carriedout as part of the Public Health Intelligence (PHI) Health Behaviours Survey Monitor. Thestatistical design for the 2003 survey was completed by Dr. Megan Pledger at SHORE, and byJames L. Reilly from Statistical-Insights. The questionnaire was adapted and extended from theNational Drug Survey questionnaire for the Health Behaviours programme by Dr. Chris Wilkins.Data collection was managed by Dr. Chris Wilkins, Rachael Lane, Joe Morley and Mary Blade.The statistical analysis of 2003 HBS-Drug Use was completed by Paul Sweetsur. The analysis inthis paper was partly funded by the New Zealand Police.

548 CHRIS WILKINS AND PAUL SWEETSUR
Key words: cannabis, earnings from drug dealing, illegal market structure, national householddrug survey
JEL Code(s): L11, K42
1 INTRODUCTION
Illegal drug markets have long been conceptualised as multi-layer distribu-tion pyramids (see Preble and Casey (1969)). At the top of the pyramiddrugs are traded in large weights by a small number of drug importersor manufactures (Johnson (2003)). They are then traded down through themiddle and retail levels of the illegal market in progressively smaller weightsand by an increasing number of drug dealers until they are sold to the finalconsumer (Caulkins and Reuter (1998) and Johnson (2003)). These extendeddistribution structures have been explained as a natural risk reduction strat-egy, where sellers seek to reduce their risk of detection and betrayal by mini-mising the number of people they conduct business with in person (see Prebleand Casey (1969), Moore (1977), Reuter (1985) and Dorn et al. (1998)). Yet,to date, there has been little empirical research describing the structure of ille-gal drug markets.
In New Zealand, as in many countries in the world, cannabis is by farthe most widely used and purchased illegal drug (Black and Casswell (1993),Field and Casswell (1999), Jansen (2002), Wilkins et al. (2002a), and UnitedNations Office on Drugs and Crime (2005)). New Zealand is entirely selfsufficient in the supply of cannabis with large scale clandestine cultivation ofcannabis known to take place in several economically depressed rural regions(Walker et al. (1998), and Yska (1990)). The black market for cannabis inNew Zealand has been recently estimated to have an annual dollar turnoverof $131–190 million dollars (NZD) (see Wilkins et al. (2002b), and Wilkinset al. (2005a)).
The aim of this paper is to explore the structure of the illegal market forcannabis in New Zealand. Greater understanding of the overall structure ofthe cannabis market could potentially inform cannabis enforcement strategyand cannabis policy in New Zealand and elsewhere.
2 METHOD
The analysis was carried out using national population level data on cannabisuse and purchasing from the most recent New Zealand national householddrug survey. This survey data provides a representative sample of cannabisusers and cannabis purchasers operating at the middle and retail levels ofthe cannabis market – subject to some survey sampling limitations.1 Those1 These sampling limitations and the implications for the analysis are discussed at the endof the paper.

EXPLORING THE STRUCTURE OF THE ILLEGAL MARKET FOR CANNABIS 549
in the survey who reported using cannabis in the preceding 12 months wereplaced in the respective retail and middle levels of the cannabis market basedon the weight of cannabis they had purchased. Previous police descriptionsof the structure of the cannabis market in New Zealand had indicated whatweights of cannabis selling were associated with different levels of the mar-ket (ABCI, (2001)). Consistent with the police descriptions, those who hadpurchased ounces and half-ounces of cannabis in the survey were placed inthe middle level of the market, while those who had purchased lesser weightswere placed in the lower retail level of the market. Those last year canna-bis users who had not purchased any cannabis in the previous 12 monthswere categorised as cannabis consumers only and were placed at the retaillevel of the market. Those who had purchased cannabis in the previous12 months were then defined as either cannabis ‘buyers’ (i.e. those who pur-chase cannabis solely for their own consumption needs) or cannabis ‘dealers’(i.e. those who purchase cannabis for re-sale on to others), based on whetherthe surplus of cannabis purchased after their own personal cannabis con-sumption was deducted exceeded the legal definition of cannabis dealing inNew Zealand (i.e. possession of an ounce or more of cannabis).
3 SURVEY METHODOLOGY
The 2003 New Zealand national household drug survey (known as the HealthBehaviour Survey – Drug Use) collected a national sample of 5727 peopleaged 13–45 years using a computer assisted telephone interviewing (CATI)system. Telephone numbers were selected using a stratified random digit dial-ling method so that each household had an equal chance of being called.To represent the different socio-economic characteristics of the populationthe country was divided into 34 strata. A proportionate sample from eachstratum was then taken. Within each household one person was randomlyselected for an interview. Each telephone number was tried at least 10 timesat different dates and times of the day in an effort to reach those seldomat home. Respondents were informed that the study was being conducted onbehalf of the New Zealand Ministry of Health and that everything they saidwould be confidential. The questionnaire was designed so that the telephoneinterview would remain private from anyone who may be in the room withthe respondent when the interview was being conducted. Questions askedover the telephone could only be heard by the respondent and responsesgenerally only required one word answers, such as ‘yes/no’, ‘higher/lower’,or ‘all/most/some/hardly any’. Interviewers received intensive training at thebeginning of the survey and a supervisor was present at each shift to mon-itor the quality and consistency of interviewing. Interviewing was conductedfrom April to late November 2003. An overall weighted response rate of 68%was achieved.

550 CHRIS WILKINS AND PAUL SWEETSUR
4 SURVEY VARIABLES
4.1 Procurement of Cannabis
Those who had used cannabis in the previous 12 months were asked howmuch of the cannabis they use was given to them for ‘free’, how muchis ‘bought from someone’, and how much they ‘grow for your own use’.Respondents could answer ‘all’, ‘most’, ‘some’, ‘hardly any’, or ‘none’.
4.2 Quantity of Cannabis Used
Those who had used cannabis in the previous 12 months were first askedhow many people they would normally share cannabis with. Respondentscould indicate if they usually smoked cannabis alone. Respondents were thenasked how much cannabis they or the group would use on a typical occasion.Responses were coded by number of cannabis ‘joints’ or grams of cannabisused. One cannabis joint was assumed to consist, on average, of 0.5 g of can-nabis. This data allowed the calculation of the average number of cannabis‘joints’ or grams of cannabis a respondent had smoked on a typical occa-sion. Cannabis users were also asked how many times they had used cannabisin the previous 12 months. Combining frequency of use and amount typicallyused allowed the calculation of the total number of cannabis joints or gramsof cannabis a respondent had smoked over the previous year.
4.3 Purchase of Cannabis
Those who had purchased cannabis in the previous year were asked a seriesof questions about all the different weights of cannabis they may have pur-chased in the last 12 months. Each cannabis buyer was first asked whetherthey had purchased any of a list of weights of cannabis in the previousyear. The weights asked about were joints (approx. 0.5 g); ‘tinnies’2 (approx.1.5 g); ‘$50 bags’ (approx. 4.0 g); quarter-ounces (approx. 7.1 g); third-ounces(approx. 9.5 g); half-ounces (approx. 14.2 g); ounces (approx. 28.4 g); andpounds (approx. 453.6 g). These weights of cannabis were all the differenttypes of cannabis known to be sold in New Zealand. For each weight of can-nabis purchased, the respondent was then asked ‘how many of that weightthey had purchased in the last year’ and ‘how much they would expect to payfor that weight’.
2 A ‘tinny’ of cannabis is roughly sufficient cannabis for three cannabis smokes or ‘joints’wrapped in tinfoil.

EXPLORING THE STRUCTURE OF THE ILLEGAL MARKET FOR CANNABIS 551
5 ANALYSIS
The sample data was weighted by eligible household size to adjust for theselection of only one person from each household, and to ensure the surveyprovided an accurate representation of the New Zealand population basedon census data. A Multiple logistic regression was run with backwards elim-ination removing non-significant variables to test whether demographic char-acteristics were independently related to participating at different levels androles in the cannabis market structure. Odds ratios (OR) were calculated andtested at the 95% confidence interval (CI). The demographics tested werepersonal income, gender, ethnicity, employment status, highest educationalqualification, marital status and age. With the exception of age, all of thesevariables were categorical. All analysis was conducted using the SAS statisti-cal software environment. All dollar estimates of cannabis expenditure are inNew Zealand Dollars (NZD).3
6 RESULTS
6.1 Prevalence of Cannabis
Fifty-two per cent of the sample had tried cannabis and 18% had usedcannabis in the previous 12 months.
6.2 Types of Participants
Nine per cent (n=81) of last year cannabis users had purchased cannabis inlarge enough weights to qualify as middle level participants. Sixty-nine percent of these middle level participants were categorised as ‘cannabis deal-ers’ and 31% were categorised as ‘cannabis buyers’ only. The remaining 91%(n= 822) of last year cannabis users qualified for the retail level of the can-nabis market. Of these retail participants, 8% were categorised as ‘cannabisdealers’, 20% were ‘cannabis buyers’ and 71% were ‘cannabis consumers’only.
6.3 Procurement of Cannabis
At the middle level of the market, 80% of cannabis dealers had purchased atleast some of their cannabis, with 26% purchasing ‘most’ and 27% purchasing‘all’ of their cannabis. Ninety-one per cent of cannabis buyers at the mid-dle level had purchased at least some of their cannabis, with 45% purchas-ing ‘most’ and 6% purchasing ‘all’ of their cannabis. Middle level cannabis
3 1$NZ =0.481C =0.3317£=0.6179$ U.S.

552 CHRIS WILKINS AND PAUL SWEETSUR
dealers were more likely than middle cannabis buyers to have purchased ‘all’of their cannabis (27% versus 6%, p = 0.0317). Approximately seven out of10 of both cannabis dealers and cannabis buyers at the middle level of themarket had also received ‘some’ or ‘most’ of their cannabis for ‘free’. Approx-imately one in five of both cannabis dealers and cannabis buyers at the mid-dle level had grown ‘some’ cannabis for their own use. Cannabis dealers at themiddle level of the market were more likely than cannabis dealers at the retaillevel of the market to have grown ‘some’ of their cannabis (19% versus 1%,p=0.0058). Cannabis buyers at the middle level of the market were also morelikely than cannabis buyers at the retail level of the market to have grown‘some’ of their cannabis (23% versus 6%, p =0.008).
At the retail level of the cannabis market, 84% of cannabis dealers hadpurchased at least some of their cannabis, with 19% purchasing ‘most’ and27% purchasing ‘all’ of their cannabis. Seventy-one per cent of cannabis buy-ers at the retail level had purchased at least some of their cannabis, with 24%purchasing ‘most’ and 24% purchasing ‘all’ of their cannabis. Approximatelyeight out of 10 of both cannabis dealers and cannabis buyers at the retaillevel of the market had received ‘some’ or ‘most’ of their cannabis for ‘free’.Cannabis buyers at the retail level of the market were more likely than can-nabis buyers at the middle level of the market to have received ‘most’ of theircannabis for ‘free’ (34% versus 11%, p = 0.0191). Very few cannabis dealers,cannabis buyers or cannabis consumers at the retail level of the market hadgrown any cannabis for their own use. Eighty-two per cent of the cannabisconsumers at the retail level had received ‘all’ of their cannabis for ‘free’ witha further 11% receiving ‘most’ of their cannabis for ‘free’.
6.4 Total Quantity of Cannabis Consumed Per User Per Year
Cannabis buyers at the middle level of the market smoked a greater averagetotal number of cannabis joints in the last 12 months than the cannabis deal-ers at the middle level of the market (623 versus 104 joints, p < 0.0001).Middle level cannabis buyers were more likely than middle level cannabisdealers to have smoked 300 cannabis joints or more in the previous year(57.8% versus 15.0%, p < 0.0001). At the retail level, cannabis consumerswere more likely than cannabis buyers and cannabis dealers to have con-sumed less than three cannabis joints in the previous year (62.3% versus34.2% versus 16.5%, p < 0.0001). Cannabis dealers at the middle level ofthe market smoked a greater number of cannabis joints in the previous yearthan cannabis dealers at the retail level of the market (104 joints versus 31joints, p =0.0003). Middle level cannabis buyers also smoked a greater num-ber of cannabis joints in the previous year than retail level cannabis buyers(623 joints versus 214 joints, p < 0.0001). Cannabis consumers at retail levelsmoked an average of 57.0 joints in the previous 12 months.
EXPLORING THE STRUCTURE OF THE ILLEGAL MARKET FOR CANNABIS 553
TA
BL
E1
–C
AN
NA
BIS
PU
RC
HA
SED
AN
DP
RIC
ES
PAID
BY
DE
AL
ER
SA
ND
BU
YE
RS
FR
OM
TH
EM
IDD
LE
AN
DR
ET
AIL
LE
VE
LS
OF
TH
EIL
LE
GA
LC
AN
NA
BIS
MA
RK
ET
INT
HE
PR
EV
IOU
SY
EA
R
Num
ber
purc
hase
dTo
tal
quan
tity
purc
hase
d(g
)A
vera
gepr
ice
per
gram
($)
Tota
lpu
rcha
ses
($)
Mid
dle
Mid
dle
Ret
ail
Ret
ail
Mid
dle
Mid
dle
Ret
ail
Ret
ail
Mid
dle
Mid
dle
Ret
ail
Ret
ail
Mid
dle
Mid
dle
Ret
ail
Ret
ail
Dea
lers
Buy
ers
Dea
lers
Buy
ers
Dea
lers
Buy
ers
Dea
lers
Buy
ers
Dea
lers
Buy
ers
Dea
lers
Buy
ers
Dea
lers
Buy
ers
Dea
lers
Buy
ers
Join
t99
5–
(–)
184
9349
8–
(–)
9246
8.72
–(–
)14
.56
18.7
941
15–
(–)
943
907
(0.5
g)T
inny
1126
892
1084
3280
1689
1337
1626
4920
13.3
813
.33
14.0
613
.20
2251
517
832
2208
075
194
(1.5
g)$5
0ba
g66
5567
722
926
322
127
0891
712
.45
12.1
311
.69
11.9
232
7927
4331
960
1072
1(4
.0g)
Qua
rter
-35
–(–
)32
3824
6–
(–)
225
272
11.2
4–
(–)
10.4
514
.08
2696
–(–
)27
9735
09ou
nce
(7.1
g)T
hird
-oun
ce31
–(–
)15
411
296
–(–
)14
6710
810
.84
–(–
)9.
3110
.53
3126
–(–
)11
071
1137
(9.5
g)H
alf-
ounc
e14
057
–(–
)–
(–)
1995
803
–(–
)–
(–)
10.5
19.
90–
(–)
–(–
)20
059
8599
–(–
)–
(–)
(14.
2g)
Oun
ce13
9510
4–
(–)
–(–
)39
331
2941
–(–
)–
(–)
9.87
9.11
–(–
)–
(–)
4113
6428
080
–(–
)–
(–)
(28.
4)To
tal
3788
1108
2131
3651
4431
653
0261
1862
6446
7153
5725
468
850
9146
9

554 CHRIS WILKINS AND PAUL SWEETSUR
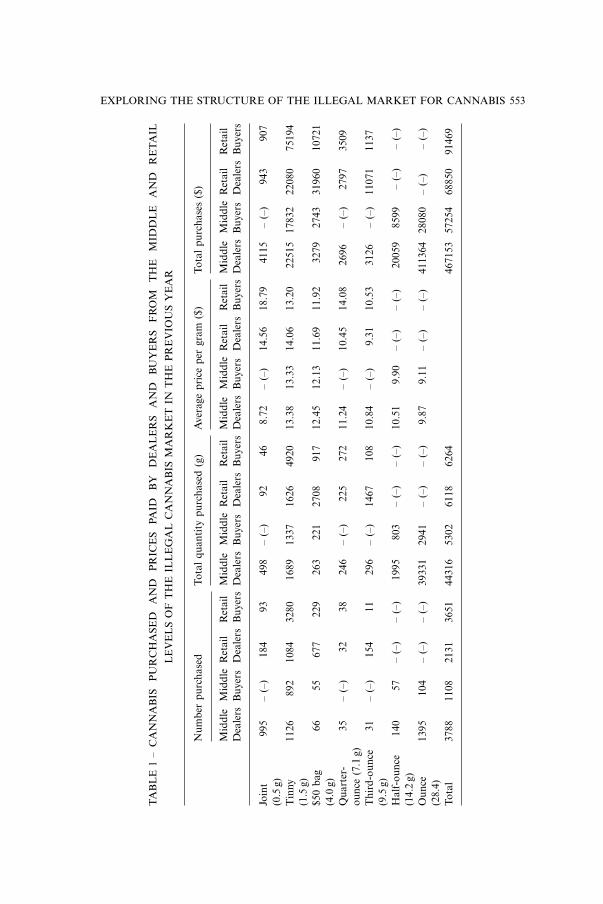
6.5 Quantities of Cannabis Purchased and Prices Paid for Cannabis
Table 1 presents the weights of cannabis purchased and prices paid forcannabis by the dealers and buyers from middle and retail levels of the canna-bis market over the preceding 12 months. Middle level cannabis dealers pur-chased 89% of all the cannabis purchased at the middle level of the market.Middle level cannabis dealers purchased an average of 931 g, or 33 ounces, ofcannabis each over the previous year. Eighty-eight per cent of the total weightof cannabis purchased by the cannabis dealers at the middle level of the mar-ket was in the form of ounces. The middle level cannabis dealers spent anaverage of $9818 each on cannabis in the previous year, or the equivalent of$818 each per month.
Cannabis buyers at the middle level of the market purchased an average of200.4 g, or 7.1 ounces, of cannabis each over the previous year. Fifty-five percent of the total weight of cannabis purchased by the cannabis buyers at themiddle level of the market was in the form of ounces, 15% was in the form ofhalf-ounces and a further 25% was in ‘tinny’ weights. The middle level canna-bis buyers spent an average of $2163 each on cannabis in the previous year, orthe equivalent of $180 each per month. Reflecting the higher per gram pricespaid for the smaller weights of cannabis, purchases of ‘tinnies’ of cannabis bymiddle level cannabis buyers actually made up 31% of the total dollar valueof the cannabis purchased by these buyers.
Retail level cannabis dealers accounted for 49% of all the cannabis pur-chased at retail level. Retail level cannabis dealers purchased an average of125 g or 4 ounces of cannabis each over the previous year. Twenty-four percent of the total weight of cannabis purchased by retail level cannabis deal-ers was in the form of third-ounces, 44% was in the form of $50 bags anda further 27% was in ‘tinny’ weights. Retail level cannabis dealers spent anaverage of $1403 each on cannabis in the previous year, or the equivalentof $117 each per month. Reflecting the higher per gram prices paid for thesmaller weights of cannabis, purchases of ‘tinnies’ by retail level cannabisdealers actually made up 32% of the total dollar value of their cannabispurchases.
Cannabis buyers at the retail level of the market purchased an average of38 g or 1 ounce of cannabis each over the previous year. Seventy-eight percent of the total weight of cannabis purchased by the cannabis buyers at theretail level of the market was in the form of ‘tinnies’, with a further 15% inthe form of $50 bags. The retail level cannabis buyers spent an average of$561 each on cannabis in the previous year, or the equivalent of $47 eachper month. Reflecting the higher per gram prices paid for the smaller weightsof cannabis, purchases of ‘tinnies’ actually made up 82% of the total dollarvalue of cannabis purchased by these cannabis buyers.

EXPLORING THE STRUCTURE OF THE ILLEGAL MARKET FOR CANNABIS 555
6.6 Income and Profit from Cannabis Dealing
The middle level cannabis dealers purchased an average of 931 g of cannabisand consumed an average of 52 g each over the preceding year, which leavesan average yearly surplus of 879 g, or 31 ounces, of cannabis each availablefor resale (median 134 g, range 28–8458 g). If the middle level cannabis deal-ers sold all their annual surplus of cannabis (i.e. 879 g) as ‘tinnies’ (i.e. $13.20g) they would earn, on average, $11604 each per year, or $967 per month,from cannabis selling. Assuming these cannabis dealers originally purchasedtheir stocks of cannabis in the form of ounces (i.e. $9.87 per gram) it wouldcost them, on average, $8,677 to purchase and consequently their average netprofit would have been $2,927 per year, or $244 per month. This amounts toa rate of return for middle level cannabis dealers on their original investmentof 34%. Recall, that middle level cannabis dealers smoked, on average, 52 gof cannabis in the previous year which would cost them $515 per year if pur-chased as ounces. If the cost of the middle level cannabis dealers own canna-bis consumption is deducted from their net profits from cannabis selling, thentheir net financial gain from cannabis would be $2412.
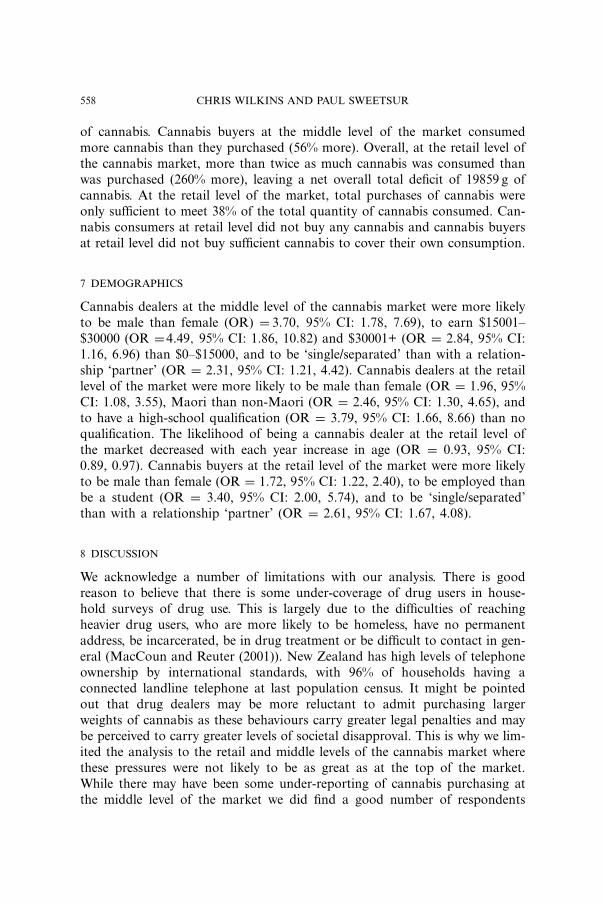
Table 2 shows there was a wide variation in the annual surplus of cannabisand therefore potential earnings from selling cannabis among cannabis deal-ers at both levels of the market. The bottom 50% of middle level cannabisdealers had, on average, an annual mean surplus of 78 g, or 3 ounces, of can-nabis, and could earn an annual net profit of $260. In contrast, the top 10%of middle level cannabis dealers had an annual mean surplus of 7508 g, or 264ounces, of cannabis, and could earn an annual net profit of $25003 or $2084per month. The bottom 50% of middle level cannabis dealers did not earnenough from selling their surplus cannabis to cover their own cannabis con-sumption expenses. The cost of middle level cannabis dealers own cannabisconsumption also reduce the profits of the next two quartiles of middle leveldealers.
The cannabis dealers at retail level purchased, on average, 125 g of canna-bis and consumed 16 g of cannabis each over the previous 12 months, whichleaves an average annual surplus of 109 g, or 4 ounces, of cannabis each(median 46 g, range 21–651 g). If the cannabis dealers at retail level sold theirsurplus of cannabis (i.e. 109 g) as ‘tinnies’ (i.e. $13.20 per gram) they couldearn, on average, $1439 per year or $120 per month. Assuming these canna-bis dealers originally purchased their stocks of cannabis in the form of third-ounces, quarter-ounces and $50 bags (i.e. overall average price $10.90 pergram) it would have cost them, on average, $1188 to purchase and conse-quently their net profit would have been $251 per year or $21 per month. Thisamounts to a rate of return of 21% on their original investment. Cannabisdealers at retail level consumed 16 g of cannabis at a cost of $171 whichwould reduce their overall average financial gain from cannabis to $80.

556 CHRIS WILKINS AND PAUL SWEETSUR
TA
BL
E2
–M
EA
NSU
RP
LU
SC
AN
NA
BIS
,M
EA
NIN
CO
ME
FR
OM
SEL
LIN
GC
AN
NA
BIS
,A
ND
ME
AN
NE
TP
RO
FIT
FR
OM
SEL
LIN
G
CA
NN
AB
ISF
OR
MID
DL
EA
ND
RE
TA
ILL
EV
EL
CA
NN
AB
ISD
EA
LE
RS
BY
PE
RC
EN
TIL
EO
FC
AN
NA
BIS
SUR
PL
US
Per
cent
ileof
cann
abis
surp
lus
0–50
%51
–75%
76–9
0%91
–100
%
Mid
dle
leve
lR
etai
lle
vel
Mid
dle
leve
lR
etai
lle
vel
Mid
dle
leve
lR
etai
lle
vel
Mid
dle
leve
lR
etai
lle
vel
deal
ers
deal
ers
deal
ers
deal
ers
deal
ers
deal
ers
deal
ers
deal
ers
Mea
nsu
rplu
sca
nnab
is(g
)78
3224
775
766
173
7508
521
Sale
sin
com
e($
)10
3042
032
5698
710
111
2282
9911
168
73N
etpr
ofit
($)
260
7382
217
225
5139
825
003
1198
Mea
npe
rson
alco
nsum
ptio
n(g
)49
835
1311
824
1550
Net
finan
cial
gain
($)
−220
−16
479
2713
9113
624
852
657

EXPLORING THE STRUCTURE OF THE ILLEGAL MARKET FOR CANNABIS 557
The bottom 50% of retail level cannabis dealers had an annual mean sur-plus of 32 g or 1 ounce, and earned, on average, an annual net profit of$73 (Table 2). In contrast, the top 10% of retail level cannabis dealers hadan annual surplus of 521 g, or 18 ounces, and could earned, on average, anannual net profit of $1198. As with the middle level cannabis dealers, thecosts of personal cannabis consumption eroded the profits from retail levelcannabis dealing. Three-quarters of retail level cannabis dealers barely madeenough net profit from selling cannabis to cover their own cannabis consump-tion costs.
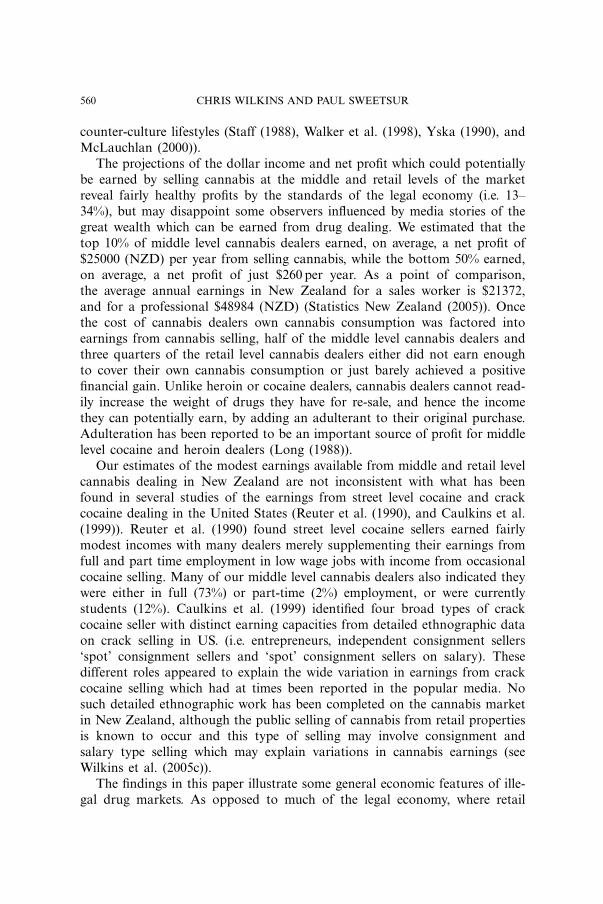
6.7 Overall Structure of Market
Figure 1 presents the total quantity of cannabis purchased and consumed bydifferent participant groups and levels of the market. There was a net totalsurplus of cannabis purchased at the middle level of the market, and a nettotal deficit of cannabis purchased at the retail level of the market. The can-nabis dealers at the middle level of the market only consumed 6% of thetotal weight of cannabis they purchased, leaving a net total surplus of 41833 g
Top levelPoundbuyers
Middle level (total)Purchased 49,618Consumed 10,732Difference 38,886
Ounce Dealers Ounce Buyers
Consumed 2,483Purchased 44,316 Purchased 5,302
Consumed 8,249Difference 41,833 Difference -2,947
Retail level (total)Purchased 12,382Consumed 32,241Difference -19,859
Dealers Buyers ConsumersPurchased 6,118 Purchased 6,264 Purchased-Consumed 767 Consumed 17,742 Consumed 13,732
Difference -11,478Difference 5,351 Difference -13,732
Figure 1 – Cannabis purchased and consumed by last year cannabis users arranged in thehypothesised structure of the cannabis market and by type of cannabis buyer
558 CHRIS WILKINS AND PAUL SWEETSUR
of cannabis. Cannabis buyers at the middle level of the market consumedmore cannabis than they purchased (56% more). Overall, at the retail level ofthe cannabis market, more than twice as much cannabis was consumed thanwas purchased (260% more), leaving a net overall total deficit of 19859 g ofcannabis. At the retail level of the market, total purchases of cannabis wereonly sufficient to meet 38% of the total quantity of cannabis consumed. Can-nabis consumers at retail level did not buy any cannabis and cannabis buyersat retail level did not buy sufficient cannabis to cover their own consumption.
7 DEMOGRAPHICS
Cannabis dealers at the middle level of the cannabis market were more likelyto be male than female (OR) = 3.70, 95% CI: 1.78, 7.69), to earn $15001–$30000 (OR =4.49, 95% CI: 1.86, 10.82) and $30001+ (OR = 2.84, 95% CI:1.16, 6.96) than $0–$15000, and to be ‘single/separated’ than with a relation-ship ‘partner’ (OR = 2.31, 95% CI: 1.21, 4.42). Cannabis dealers at the retaillevel of the market were more likely to be male than female (OR = 1.96, 95%CI: 1.08, 3.55), Maori than non-Maori (OR = 2.46, 95% CI: 1.30, 4.65), andto have a high-school qualification (OR = 3.79, 95% CI: 1.66, 8.66) than noqualification. The likelihood of being a cannabis dealer at the retail level ofthe market decreased with each year increase in age (OR = 0.93, 95% CI:0.89, 0.97). Cannabis buyers at the retail level of the market were more likelyto be male than female (OR = 1.72, 95% CI: 1.22, 2.40), to be employed thanbe a student (OR = 3.40, 95% CI: 2.00, 5.74), and to be ‘single/separated’than with a relationship ‘partner’ (OR = 2.61, 95% CI: 1.67, 4.08).
8 DISCUSSION
We acknowledge a number of limitations with our analysis. There is goodreason to believe that there is some under-coverage of drug users in house-hold surveys of drug use. This is largely due to the difficulties of reachingheavier drug users, who are more likely to be homeless, have no permanentaddress, be incarcerated, be in drug treatment or be difficult to contact in gen-eral (MacCoun and Reuter (2001)). New Zealand has high levels of telephoneownership by international standards, with 96% of households having aconnected landline telephone at last population census. It might be pointedout that drug dealers may be more reluctant to admit purchasing largerweights of cannabis as these behaviours carry greater legal penalties and maybe perceived to carry greater levels of societal disapproval. This is why we lim-ited the analysis to the retail and middle levels of the cannabis market wherethese pressures were not likely to be as great as at the top of the market.While there may have been some under-reporting of cannabis purchasing atthe middle level of the market we did find a good number of respondents

EXPLORING THE STRUCTURE OF THE ILLEGAL MARKET FOR CANNABIS 559
reporting they had purchased ounces and half-ounces of cannabis in theprevious 12 months. Indeed, when we arranged our cannabis buyers intothe pyramid market structure and examined the total quantities of cannabispurchased we found there was actually more cannabis reported purchased intotal at the middle level than the lower level of the market. It may also beargued that the high-reported incidence of receiving cannabis for free mayrepresent respondent’s strategic attempts to down-play their involvement in acriminal activity. As discussed later in this section, our findings concerningthe high level of ‘free’ cannabis are consistent with data on cannabis marketsfrom other countries.
A number of our findings concerning the structure of the illegal market forcannabis in New Zealand are worthy of further discussion. Sixty-five per centof those who had used cannabis in the previous year did not buy any canna-bis. Eighty-two per cent of these cannabis consumers reported receiving ‘all’of their cannabis for free. Both cannabis buyers and cannabis consumers atthe retail level of the market did not purchase enough cannabis to cover theirown personal consumption needs. This suggests a great deal of cannabis isgiven away for ‘free’ at the retail level of the market. Receiving cannabis for‘free’ was actually common among all the groups and levels of the market –even the middle level cannabis dealers. The high incidence of receiving can-nabis for free is likely to reflect the common practice of the social sharing ofcannabis during group consumption, where social acquaintances pass arounda cannabis ‘joint’ at a social gathering. The 2003 Health Behaviour Survey-Drugs survey found that over three quarters of last year cannabis users saidthey typically shared cannabis with three or more people.
The reports of receiving cannabis for ‘free’ may not necessarily refer toreceiving cannabis as an outright gift. Surveys of drug use by arrestees in theUnited States and Australia have found that while gift-giving is a commonnon-cash way to obtain cannabis, a range of other non-cash ways are used topay for cannabis such as performing legal and criminal work, bartering theirown and stolen property, bartering other drugs, and providing sexual favours(see Johnson et al. (1985), Makkai (1988), Ashcroft et al. (2001), and Taylorand Costa (2003)). In New Zealand, a recent study of frequent cannabis users(n=69) found that in the 6 months preceding the interview 72% had paid forcannabis with ‘paid employment’, 58% had received cannabis as ‘gifts fromfriends’, 43% had used various forms of credit and borrowing, 23% had paidfor cannabis with social welfare benefits, 23% had ‘bartered goods or otherdrugs’, 22% had used drug dealing as a source of income for cannabis, 4%had ‘pawned property’ and 1% had provided ‘sexual favours’ or committed‘property crime’ to pay for cannabis (Wilkins et al. (2005b)). Accounts ofthe illegal cannabis economy in New Zealand have suggested that in someparts of the country where cannabis cultivation is common, cannabis issometimes used to barter for goods and services as part of subsistence or
560 CHRIS WILKINS AND PAUL SWEETSUR
counter-culture lifestyles (Staff (1988), Walker et al. (1998), Yska (1990), andMcLauchlan (2000)).
The projections of the dollar income and net profit which could potentiallybe earned by selling cannabis at the middle and retail levels of the marketreveal fairly healthy profits by the standards of the legal economy (i.e. 13–34%), but may disappoint some observers influenced by media stories of thegreat wealth which can be earned from drug dealing. We estimated that thetop 10% of middle level cannabis dealers earned, on average, a net profit of$25000 (NZD) per year from selling cannabis, while the bottom 50% earned,on average, a net profit of just $260 per year. As a point of comparison,the average annual earnings in New Zealand for a sales worker is $21372,and for a professional $48984 (NZD) (Statistics New Zealand (2005)). Oncethe cost of cannabis dealers own cannabis consumption was factored intoearnings from cannabis selling, half of the middle level cannabis dealers andthree quarters of the retail level cannabis dealers either did not earn enoughto cover their own cannabis consumption or just barely achieved a positivefinancial gain. Unlike heroin or cocaine dealers, cannabis dealers cannot read-ily increase the weight of drugs they have for re-sale, and hence the incomethey can potentially earn, by adding an adulterant to their original purchase.Adulteration has been reported to be an important source of profit for middlelevel cocaine and heroin dealers (Long (1988)).
Our estimates of the modest earnings available from middle and retail levelcannabis dealing in New Zealand are not inconsistent with what has beenfound in several studies of the earnings from street level cocaine and crackcocaine dealing in the United States (Reuter et al. (1990), and Caulkins et al.(1999)). Reuter et al. (1990) found street level cocaine sellers earned fairlymodest incomes with many dealers merely supplementing their earnings fromfull and part time employment in low wage jobs with income from occasionalcocaine selling. Many of our middle level cannabis dealers also indicated theywere either in full (73%) or part-time (2%) employment, or were currentlystudents (12%). Caulkins et al. (1999) identified four broad types of crackcocaine seller with distinct earning capacities from detailed ethnographic dataon crack selling in US. (i.e. entrepreneurs, independent consignment sellers‘spot’ consignment sellers and ‘spot’ consignment sellers on salary). Thesedifferent roles appeared to explain the wide variation in earnings from crackcocaine selling which had at times been reported in the popular media. Nosuch detailed ethnographic work has been completed on the cannabis marketin New Zealand, although the public selling of cannabis from retail propertiesis known to occur and this type of selling may involve consignment andsalary type selling which may explain variations in cannabis earnings (seeWilkins et al. (2005c)).
The findings in this paper illustrate some general economic features of ille-gal drug markets. As opposed to much of the legal economy, where retail

EXPLORING THE STRUCTURE OF THE ILLEGAL MARKET FOR CANNABIS 561
sales are centralised and transactions impersonal, distribution in illegal drugmarkets is carried out by large numbers of the users themselves to smallgroups of friends and social acquaintances. Some users seek to finance theirown heavy drug use by buying surplus drugs and selling them on to othersfor income. The primary aim in many instances is to cover their own drugconsumption expenses rather than make lots of money. A high proportionof users are only moderate occasional users who do not purchase drugs andmay only use them when they are shared with them at social occasions. Heavyusers, on the other hand, cannot rely solely on social sharing but must pur-chase drugs to satisfy their consumption requirements. As we have seen, manyheavy cannabis users seek to minimise the number of risky illegal drug trans-actions they are required to make by buying cannabis in bulk. We found onlya very small proportion of middle level cannabis dealers were earning sub-stantial amounts of money from cannabis dealing once their own personalcannabis consumption expenses were taken into account.
The number of cannabis users involved in selling cannabis illustrates thedifficulties the authorities face in disrupting the illegal distribution of canna-bis. The barter and gift giving tradition reported in our findings may providecannabis users with a degree of insulation from any price increases for canna-bis which law enforcement agencies are able to achieve. Poor cannabis users inparticular, who would ordinarily be most responsive to price increases, may beable to avoid some of the pressure of any price increase through greater reli-ance on barter and gift giving as sources of cannabis supply. The ability ofheavy cannabis users to finance their own personal use through selling can-nabis would also seem to undermine to some extent the impact of any pricerise in cannabis that enforcement agencies are able to affect.
REFERENCES
Ashcroft, J., D. Daniels and S. Hart (2001), ADAM Preliminary 2000 Findings on Drug Use &Markets: Adult Male Arrestees, Washington, Office of Justice Programs, US Department ofJustice.
Australian Bureau of Criminal Intelligence (ABCI) (2001), Illicit Drugs in New Zealand: An Over-view in Australian Illicit Drug Report 1999–2000, Canberra City, ACT.
Black, S. and S. Casswell (1993), Drugs in New Zealand: A Survey 1990, Auckland, Alcohol &Public Health Research Unit, University of Auckland.
Caulkins, J.P. and P. Reuter (1998), ‘What Price Data Tell us About Drug Markets,’ Journal ofDrug Issues, 28(3), pp. 593–612.
Caulkins, J.P., B. Johnson, A. Taylor and L. Taylor (1999), ‘What Drug Dealers Tell us AboutTheir Costs of Doing Business,’ Journal of Drug Issues, 29(2), pp. 323–340.
Dorn, N., L. Oette and S. White (1998), ‘Drugs Importation and the Bifurcation of Risk,’ BritishJournal of Criminology, 38, pp. 537–556.
Field, A. and S. Casswell (1999), Drugs in New Zealand: A National Survey 1998, Auckland,Alcohol and Public Health Research Unit, University of Auckland.

562 CHRIS WILKINS AND PAUL SWEETSUR
Jansen, A.C.M. (2002), ‘The Economics of Cannabis Cultivation in Europe,’ Paper presented atthe 2nd European Conference on Drug Trafficking and Law Enforcement, Paris.
Johnson, B.D. (2003), ‘Patterns of Drug Distribution: Implications and Issues,’ Substance Use andMisuse, 18, pp. 1789–1806.
Johnson, B., P. Goldstein, E. Preble, J. Schmeidler, D. Lipton, B. Spunt and T. Miller (1985), Tak-ing Care of Business: The Economics of Crime by Heroin Users, Lexington, MA, LexingtonBooks.
Long, H.S. (1988), Getting Started in the Illicit Drug Business, Washington DC, LoompanicsUnlimited.
MacCoun, R. and P. Reuter (2001), Drug War Heresies : Learning from Other Vices, Times, andPlaces, New York, Cambridge University Press.
Makkai, T. (2000), Drug Transactions: Some Results from the DUMA Project, In AustralianIllicit Drug Report 1998–1999, Australian Bureau of Criminal Intelligence, Commonwealth ofAustralia, Canberra.
McLauchlan, M. (1996), Gone North: On the Cannabis Trail, North and South, November,pp. 117–123.
Moore, M. (1977), Buy and Bust, Lexington, MA, D.C. Heath.Preble, E. and J. Casey (1969), ‘Taking Care of Business – The Heroin User’s Life on the Street,’
International Journal of Addictions, 4, pp. 1–24.Reuter, P. (1985), The Organization of Illegal Markets: An Economic Analysis, Washington, DC,
US, Department of Justice, National Institute of Justice.Reuter, P., R. MacCoun and P. Murphy (1990), Money from Crime: A Study of the Economics of
Drug Dealing in Washington DC, CANY, Rand Corporation.Staff, B. (1988), A Report from Cannabis Country, North and South, April, pp. 103–109.Statistics New Zealand (2005), Household Economic Survey Year ended 30 June 2004 – Hot
Off The Press. 25 November. New Zealand Government Wellington <http://www.statis-tics.govt.nz>.
Taylor, B. and M. Costa (2003), “Drug markets,” in: 2000 Arrestee Drug Abuse Monitoring:Annual Report. Washington, DC. National Institute of Justice, Office of Justice, Programs, USDepartment of Justice.
United Nations Office on Drugs and Crime (2005), World Drug Report 2005, UNODC, Vienna<http://www.unodc.org/unodc/en/world drug report. html>.
Walker, L., C. Cocklin and G. Blunden (1998), Cannabis Highs and Lows: Sustaining and Dislo-cating Rural Communities in Northland, Auckland, Department of Geography, University ofAuckland.
Wilkins, C., S. Casswell, K. Bhatta and M. Pledger (2002a), Drug Use in New Zealand: NationalSurveys Comparison 1998 & 2001, Auckland, Alcohol & Public Health Research Unit,Auckland.
Wilkins, C., K. Bhatta and S. Casswell (2002b), ‘A Demand Side Estimate of the FinancialTurnover of the Cannabis Black Market in New Zealand,’ Drug and Alcohol Review, 21,pp. 145–151.
Wilkins, C., J. Reilly, M. Pledger and S. Casswell (2005a), ‘Estimating the Dollar Value of theIllicit Market for Cannabis in New Zealand,’ Drug and Alcohol Review, 24(3), pp. 227–234.
Wilkins C, M. Girling, P. Sweetsur and R. Butler (2005b), Cannabis and Other Illicit Drug Trendsin New Zealand, 2005, Massey Centre for Social and Health Outcomes Research and Evalua-tion & Te Ropu Whariki, Massey University.
Wilkins, C., J. Reilly and S. Casswell (2005c), ‘Cannabis ‘Tinny’ Houses in New Zealand, Implica-tions for the use of Cannabis and Other Drugs in New Zealand,’ Addiction, 100, pp. 971–980.
Yska, R. (1990), New Zealand Green: The Story of Marijuana in New Zealand, Auckland, DavidBateman.


![Mapping cannabis potency in medical and recreational ... · 26-03-2020 · the illegal market in the U.S. [30–32], we hypothesize that the THC content of cannabis offered in legal](https://static.fdocuments.in/doc/165x107/600a496dced5d4731b0deab5/mapping-cannabis-potency-in-medical-and-recreational-26-03-2020-the-illegal.jpg)