Exploring the Relationship Between Lexical Measures and L2 ... · Rationale for the study •...
35
Exploring the Relationship Between Lexical Measures and L2 Proficiency Veronica Benigno, William Bonk, and Masanori Suzuki (Pearson) 24 June 2016, LTRC – Palermo, Italy
Transcript of Exploring the Relationship Between Lexical Measures and L2 ... · Rationale for the study •...

Exploring the Relationship Between
Lexical Measures and L2 Proficiency
Veronica Benigno, William Bonk, and Masanori Suzuki (Pearson)
24 June 2016, LTRC – Palermo, Italy

Outline
• Section 1. General Overview
• Section 2. Data
• Section 3. Results
• Section 4: Discussion

Section 1
General Overview

Rationale for the study
• Research shows that learners at higher proficiency levels generally
use a more sophisticated vocabulary (e.g., Crossley & McNamara,
2009)
• There should be strong evidence that lexical characteristics of test-
takers’ productions vary with L2 proficiency as expected
• More research is needed on how vocabulary knowledge manifests
itself in different item types in written and spoken assessments

Theoretical background
• Much research has been conducted to identify lexical features
characterising the degree of complexity of a text (e.g. research on L2 CAF and
L2 development : Housen, Kuiken, & Vedder, 2012; Bulté and Housen, 2015)
• Nowadays sophisticated tools exist to assess lexical complexity (e.g. IEA
by Pearson; Coh-metrix by Graesser et al., 2004; the Gramulator by McCarthy et al., 2014;
TAALES by Kyle & Crossley, 2015)
• In some studies, features of lexical complexity (e.g. LD) are found to:
✓ Predict general proficiency, e.g. Treffers-Daller, 2013 (up to 62% of variance
explained); Yu, 2010
✓ Predict human judgements of lexical proficiency, e.g. Crossley et al., 2011
(over 45% of variance explained)
✓ Affect holistic ratings of essay quality, e.g. Yu, 2010 (about 11% of variance
explained)

• An exploratory study of a corpus of test-takers’ responses from a
test of general English
• Test-takers’ responses were analysed by means of lexical
measures, human holistic ratings of oral and written proficiency,
and test scores
Overview of the study

Research questions
RQ1: To what extent can lexical measures predict human raters’
CEFR estimates of test-takers’ spoken and written proficiency?
RQ2: To what extent do different item types vary in their ability
to predict test-takers’ overall proficiency level?

Lexical Measures
nLemmatypes Lexical diversity
medianFreq Median word frequency
avgLength Average word length
nContenttokens Lexical density (tokens)
nContenttypes Lexical density (types)
collocTokens # of collocations (tokens)
collocTypes Variety of collocations (types)
ExprTokens # of multiword expressions (tokens)
ExprTypes Variety of multiword expressions (types)
AvgExprFreq Avg. frequency of multiword expressions
Entropy (IEA) A measure of the Englishlikeness of a text
Vector Length (IEA) A measure of word concreteness
WperS (IEA) Avg. # of words per sentence (only for writing)
Zipf R2 (IEA) A measure of how close to real-life English a text is in
terms of the distribution of word frequencies

Section 2
Data

Data
• Progress - General English proficiency test reported on Global
Scale of English (GSE) and CEFR
• Fully automatically scored
• Field test data: n=10,074 test-takers from 57 countries
• A corpus of 5,000+ test-takers’ responses
• 4 different productive item types

Describe Image
Look at an image and describe it out loud
Prep Time: 25 seconds
Response Time: 40 seconds

Story Retell
Listen to a short narrative (30-90 words) and then retell it in one’s
own words
Prep Time: -
Response Time: 30 seconds
Sample StoryMolly took the bus home from work. When Molly got home, she realized she
didn't have her bag. She thought she might have left it on the bus. Molly
called the bus station and they had found her bag. She had to take the bus
all the way back to the bus station near her work to pick it up.

Short Writing
Read a short prompt and write a response to the prompt.
Response Time: 10 minutes
Sample Prompts
● Boys and girls should play sports together, rather than on separate
teams. Do you agree or disagree with the statement? Why or why not?
● It is better to travel on your own than with a tour guide. Do you agree or
disagree with the statement? Why or why not?

Passage Recall
Read a short passage (45-75 words) for 30 seconds. After 30
seconds, the passage disappears. Reconstruct the passage in one’s
own words
Response Time: 90 seconds
Sample Passage
On Sunday Dave wanted to read the newspaper but he couldn't find his
glasses anywhere. He remembered wearing them to read the menu at the
restaurant the night before. However, when he called the restaurant, the
waiter said they hadn't found any glasses when they were closing. Just as
Dave had decided he had lost his glasses, he looked in the mirror and saw
them on his head.

Data Preparation
• Equalize text length for all test-takers
• Concatenated all spoken or written responses per test-taker, and then
selected 100 words as a sample response
• Purpose was to reduce the effect of text length to which LD
measures are particularly sensitive
• Spell-check of test-takers’ responses
• Used human judgments to correct misspelled or partial words

Data Analyzed for Research Question 1
Picture Description
Story Retell
Lexical Analysis
Human Ratings
100 word sample
Spoken
Composite
score
For Writing, the process is the same except: Tasks were Short Writing and
Passage Recall. Human ratings were Written CEFR ratings.
Responses

Rating rubrics (overall written production)Rating Descriptors
C2 Excellent
command
Can write clear, smoothly flowing, complex texts in an appropriate and effective style and a
logical structure which helps the reader to find significant points.
C1 Strong
command
Can write, clear, well-structured texts of complex subjects, underlining the relevant salient issues,
expanding and supporting points of view at some length with subsidiary points, reasons and
relevant examples, and rounding off with an appropriate conclusion.
B2 Adequate
command
Can write clear, detailed texts on a variety of subjects related to his/her field of interest,
synthesizing and evaluating information and arguments from a number of sources.
B1 Partial
command
Can write straightforward connected texts on a range of familiar subjects within his field of
interest, by linking a series of shorter discrete elements into a linear sequence.
A2 Limited
command
Can write a series of simple phrases and sentences linked with simple connectors like ‘and’, ‘but’
and ‘because’.
A1 Inadequate
command
Can write simple isolated phrases and sentences.
0 No evidence · Unintelligible/gibberish
· Completely off-topic/irrelevant
· Response is less than 5 words
· Response is copied word-for-word from the prompt

Section 3
Results
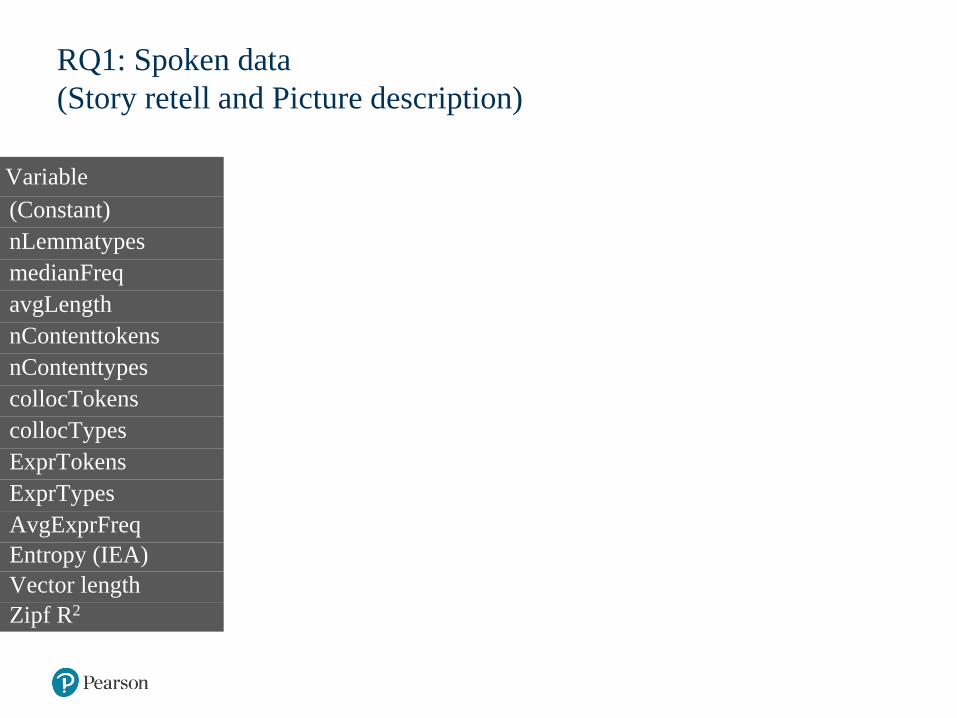
RQ1: Spoken data
(Story retell and Picture description)
Variable B β t Sig R2 Semipartial2
(Constant) 5.424 6.439 .000
nLemmatypes .026 .216 4.737 .000* .083 .011
medianFreq .000 -.141 -5.204 .000* .061 .013
avgLength .053 .016 .633 .527 .002 .000
nContenttokens .011 .064 2.056 .040* .020 .002
nContenttypes -.008 -.050 -.994 .320 .067 .000
collocTokens .048 .106 1.174 .241 .000 .001
collocTypes -.074 -.150 -1.650 .099 .000 .001
ExprTokens .003 .013 .179 .858 .007 .000
ExprTypes -.009 -.035 -.461 .645 .013 .000
AvgExprFreq .000 -.048 -2.135 .033* .001 .002Entropy (IEA) -.369 -.395 -16.806 .000* .178 .137Vector length 9.420 .127 4.389 .000* .032 .009Zipf R2 -1.126 -.045 -1.498 .134 .000 .001

RQ1: Spoken data R2 (adj.)=.275, n=1492 (75 outliers removed)
(Story retell and Picture description)
Variable B β t Sig R2 Semipartial2
(Constant) 5.424 6.439 .000
nLemmatypes .026 .216 4.737 .000* .083 .011
medianFreq .000 -.141 -5.204 .000* .061 .013
avgLength .053 .016 .633 .527 .002 .000
nContenttokens .011 .064 2.056 .040* .020 .002
nContenttypes -.008 -.050 -.994 .320 .067 .000
collocTokens .048 .106 1.174 .241 .000 .001
collocTypes -.074 -.150 -1.650 .099 .000 .001
ExprTokens .003 .013 .179 .858 .007 .000
ExprTypes -.009 -.035 -.461 .645 .013 .000
AvgExprFreq .000 -.048 -2.135 .033* .001 .002Entropy -.369 -.395 -16.806 .000* .178 .137Vector length 9.420 .127 4.389 .000* .032 .009Zipf R2 -1.126 -.045 -1.498 .134 .000 .001

RQ1: Written data
(Passage recall and short writing)
Variable B β t Sig R2 Semipartial2
(Constant) 4.120 7.596 .000
nLemmatypes -.024 -.182 -4.673 .000 .000 .012
medianFreq .000 -.080 -2.759 .006 .005 .004
avgLength -.081 -.031 -1.144 .253 .000 .001
nContenttokens -.013 -.088 -2.286 .022 .005 .003
nContenttypes .038 .254 5.183 .000 .017 .015
collocTokens -.061 -.162 -1.094 .274 .000 .001
collocTypes .042 .106 .713 .476 .000 .000
ExprTokens -.077 -.360 -2.695 .007 .001 .004
ExprTypes .088 .395 2.927 .003 .003 .005
AvgExprFreq -.000 -.021 -.869 .385 .001 .000Entropy .022 .034 1.277 .202 .001 .001Vector length -.147 -.002 -.064 .949 .000 .000Words per sent. .000 -.024 -.926 .355 .000 .000Zipf R2 -.073 -.005 -.158 .874 .000 .000

RQ1: Written data R2 (adj) = .035, n=1741 (94 outliers removed)
(Passage recall and short writing)
Variable B β t Sig R2 Semipartial2
(Constant) 4.120 7.596 .000
nLemmatypes -.024 -.182 -4.673 .000 .000 .012
medianFreq .000 -.080 -2.759 .006 .005 .004
avgLength -.081 -.031 -1.144 .253 .000 .001
nContenttokens -.013 -.088 -2.286 .022 .005 .003
nContenttypes .038 .254 5.183 .000 .017 .015
collocTokens -.061 -.162 -1.094 .274 .000 .001
collocTypes .042 .106 .713 .476 .000 .000
ExprTokens -.077 -.360 -2.695 .007 .001 .004
ExprTypes .088 .395 2.927 .003 .003 .005
AvgExprFreq -.000 -.021 -.869 .385 .001 .000Entropy .022 .034 1.277 .202 .001 .001Vector length -.147 -.002 -.064 .949 .000 .000Words per sent. .000 -.024 -.926 .355 .000 .000Zipf R2 -.073 -.005 -.158 .874 .000 .000

RQ1: To what extent can lexical measures predict human ratings
(CEFR estimates of test-takers’ spoken and written proficiency)?
Speaking: A model with six statistically significant lexical
measures provided small-to-moderate prediction of human ratings
(R2 adj.= .275).
• Entropy was by far the strongest predictor, with most of the
explained variance uncorrelated with other variables
Writing: A model with six statistically significant lexical
measures provided a negligible amount of prediction of holistic
scores R2 adj.= .035.
• No variables stood out as strong predictors

Data Analyzed for Research Question 2
Picture
Description
Story Retell
Short Writing
Passage
Recall
Overall Spoken
CEFRCEFR estimate
CEFR estimate
CEFR estimate
CEFR estimate
Overall GSE
score
Human Ratings Overall GSE score
based on all items on
the test (machine)

RQ2: Overall Proficiency Scores
Variable B β t Sig R2 Semipartial2
-5.383 -4.806 .000
Picture Description (spoken) 3.720 .205 1.174 .000 .476 .022
Story Retell (spoken) 4.890 .298 13.127 .000 .612 .037
Short Essay (written) 2.873 .170 9.142 .000 .413 .018
Passage Recall (written) 7.883 .396 18.598 .000 .642 .074

RQ2: Overall Proficiency Scores R2 (adj) = .80, n=932 (37
outliers removed)
Variable B β t Sig R2 Semipartial2
(Constant) -5.383 -4.806 .000
Picture Description (spoken) 3.720 .205 1.174 .000 .476 .022
Story Retell (spoken) 4.890 .298 13.127 .000 .612 .037
Short Essay (written) 2.873 .170 9.142 .000 .413 .018
Passage Recall (written) 7.883 .396 18.598 .000 .642 .074

RQ2: To what extent do different item
types vary in their ability to predict test-
takers’ overall proficiency level?
• The variables are highly predictive of machine-generated overall
scores on Progress (adjusted R2 = .80)
• The four variables were highly intercorrelated and each explains
only negligible amounts of unique variance
• The item types requiring more constrained responses (Passage
recall, Story retell) are better predictors of overall L2 proficiency
than the more open-ended response item types (Picture
description, Short essay)

Section 4
Discussion

Discussion
Our data suggest that…
• The two written item types do not tend to elicit the variety of
lexical knowledge known to be associated with varying L2
proficiency levels
• The two spoken item types do elicit responses that appear to
be more sensitive to lexical characteristic measures, in
particular entropy, number of lemmas, and overall word
frequency.

There’s so much
more to learn
Find out more about us at
English.com/gse


ab
R2 = a+b/c
Semipartial2 =