Exploring the Mechanisms of Primary Antibody Responses to T Cell-Dependent Antigens
22
J . theor . Biol . (1996) 181, 215–236 0022–5193/96/150215 + 21 $18.00/0 7 1996 Academic Press Limited Exploring the Mechanisms of Primary Antibody Responses to T Cell-Dependent Antigens M O A S. P† Santa Fe Institute , 1399 Hyde Park Road , Santa Fe , NM 87501 and the † Theoretical Division , Los Alamos National Laboratory , Los Alamos , NM 87545, U.S.A. (Received on 30 October 1995, Accepted in revised form on 12 April 1996) We have developed a model of the early events that occur during a primary antibody response to a T cell-dependent antigen. Within secondary lymphoid organs, B cell proliferation in response to antigen injection gives rise to two kinds of transient structures: foci that develop in the T cell area, and germinal centers, that develop in the secondary follicles of the B cell area. Foci give rise to plasma cells that are responsible for the majority of early circulating antibody, whereas germinal centers are sites of somatic mutation and memory cell formation. Here we model the cell–cell interactions and cell population kinetics involved in the generation of antibody-forming cell foci, and compare our model with experimental data. We focus on fundamental issues involving the control of B cell proliferation and differentiation, using simple kinetic models that depend on direct cell–cell interactions and on the action of cytokines. We show that with realistic parameter assumptions our model can account for both the rapid cellular expansion and the differentiation of B cells into antibody-secreting cells. By summing the expected antibody production of all the plasmablasts and plasma cells that are generated during the focus response we can account for much of the antibody observed in the serum of mice during a primary response. Lastly, we compare the predictions of our model for two different scenarios for the control of B cell proliferation. In one model, we assume that B cells, once activated, proliferate under the control of cytokines without direct interaction with activated T cells. In the other model, we assume that after dividing B cells return to rest and require a contact-dependent signal from an activated T cell to divide again. The first model gives rise to large foci and antibody levels similar to that observed in experiment, whereas the latter model gives rise to four-fold smaller foci and to circulating antibody levels that are one order of magnitude lower than typical experimental values. This result suggests that B cells may be able to divide without further contact with T cells once a cognate interaction has occurred. 7 1996 Academic Press Limited 1. Introduction The immune system, in order to provide defense against pathogens that can enter the body at many different points, is by necessity a distributed system. The system is composed of the primary lymphoid organs, the bone marrow and the thymus, where B and T lymphocytes are produced, and a collection of secondary lymphoid organs, where immune responses are initiated. The secondary lymphoid organs include the spleen, the lymph nodes, the tonsils, the Peyer’s patches of the small intestine, and the appendix (Jerne, 1973). Most models of the immune response that have been constructed so far have not explicitly considered the compartmentalized nature of the immune system. Perelson & Weisbuch (1992) considered events that occur in the spleen and in the circulation in the context of an immune network model. Here we develop a model of the initial events that occur in the spleen during a primary immune response to a foreign antigen. Similar events occur in other secondary lymphoid tissues, such as the lymph † Author to whom correspondence should be addressed. E-mail: asp.lanl.gov 215
-
Upload
mihaela-oprea -
Category
Documents
-
view
213 -
download
1
Transcript of Exploring the Mechanisms of Primary Antibody Responses to T Cell-Dependent Antigens

J. theor. Biol. (1996) 181, 215–236
0022–5193/96/150215+21 $18.00/0 7 1996 Academic Press Limited
Exploring the Mechanisms of Primary Antibody Responses to T Cell-Dependent
Antigens
M O A S. P†
Santa Fe Institute, 1399 Hyde Park Road, Santa Fe, NM 87501 and the † Theoretical Division,Los Alamos National Laboratory, Los Alamos, NM 87545, U.S.A.
(Received on 30 October 1995, Accepted in revised form on 12 April 1996)
We have developed a model of the early events that occur during a primary antibody response to aT cell-dependent antigen. Within secondary lymphoid organs, B cell proliferation in response to antigeninjection gives rise to two kinds of transient structures: foci that develop in the T cell area, and germinalcenters, that develop in the secondary follicles of the B cell area. Foci give rise to plasma cells that areresponsible for the majority of early circulating antibody, whereas germinal centers are sites of somaticmutation and memory cell formation. Here we model the cell–cell interactions and cell populationkinetics involved in the generation of antibody-forming cell foci, and compare our model withexperimental data. We focus on fundamental issues involving the control of B cell proliferation anddifferentiation, using simple kinetic models that depend on direct cell–cell interactions and on the actionof cytokines. We show that with realistic parameter assumptions our model can account for both therapid cellular expansion and the differentiation of B cells into antibody-secreting cells. By summingthe expected antibody production of all the plasmablasts and plasma cells that are generated duringthe focus response we can account for much of the antibody observed in the serum of mice during aprimary response. Lastly, we compare the predictions of our model for two different scenarios for thecontrol of B cell proliferation. In one model, we assume that B cells, once activated, proliferate underthe control of cytokines without direct interaction with activated T cells. In the other model, we assumethat after dividing B cells return to rest and require a contact-dependent signal from an activated Tcell to divide again. The first model gives rise to large foci and antibody levels similar to that observedin experiment, whereas the latter model gives rise to four-fold smaller foci and to circulating antibodylevels that are one order of magnitude lower than typical experimental values. This result suggests thatB cells may be able to divide without further contact with T cells once a cognate interaction hasoccurred.
7 1996 Academic Press Limited
1. Introduction
The immune system, in order to provide defenseagainst pathogens that can enter the body at manydifferent points, is by necessity a distributed system.The system is composed of the primary lymphoidorgans, the bone marrow and the thymus, where Band T lymphocytes are produced, and a collection ofsecondary lymphoid organs, where immune responsesare initiated. The secondary lymphoid organs include
the spleen, the lymph nodes, the tonsils, the Peyer’spatches of the small intestine, and the appendix(Jerne, 1973).
Most models of the immune response that havebeen constructed so far have not explicitly consideredthe compartmentalized nature of the immune system.Perelson & Weisbuch (1992) considered eventsthat occur in the spleen and in the circulation inthe context of an immune network model. Herewe develop a model of the initial events that occurin the spleen during a primary immune responseto a foreign antigen. Similar events occur in othersecondary lymphoid tissues, such as the lymph
† Author to whom correspondence should be addressed. E-mail:asp.lanl.gov
215

CA
GC GC
PALS
Follicle
FF
PAL
SGC
F
F
FGC
GC
CA
Trabecular a
rteryF
olli
cle
MZ
. . . 216
nodes (Nieuwenhuis & Keuning, 1974) and tonsils(MacLennan, 1994). We chose to examine the spleenbecause after primary intravenous and intraperitonealinjection of most antigens the spleen is the major siteof antibody production (Van den Eertwegh et al.,1992). Further, since eight times as many lymphocytesrecirculate via the spleen than via all lymph nodestogether (Pabst & Westermann, 1991), it is likely thatthe entire antigen-specific B and T cell repertoires areavailable in the spleen.
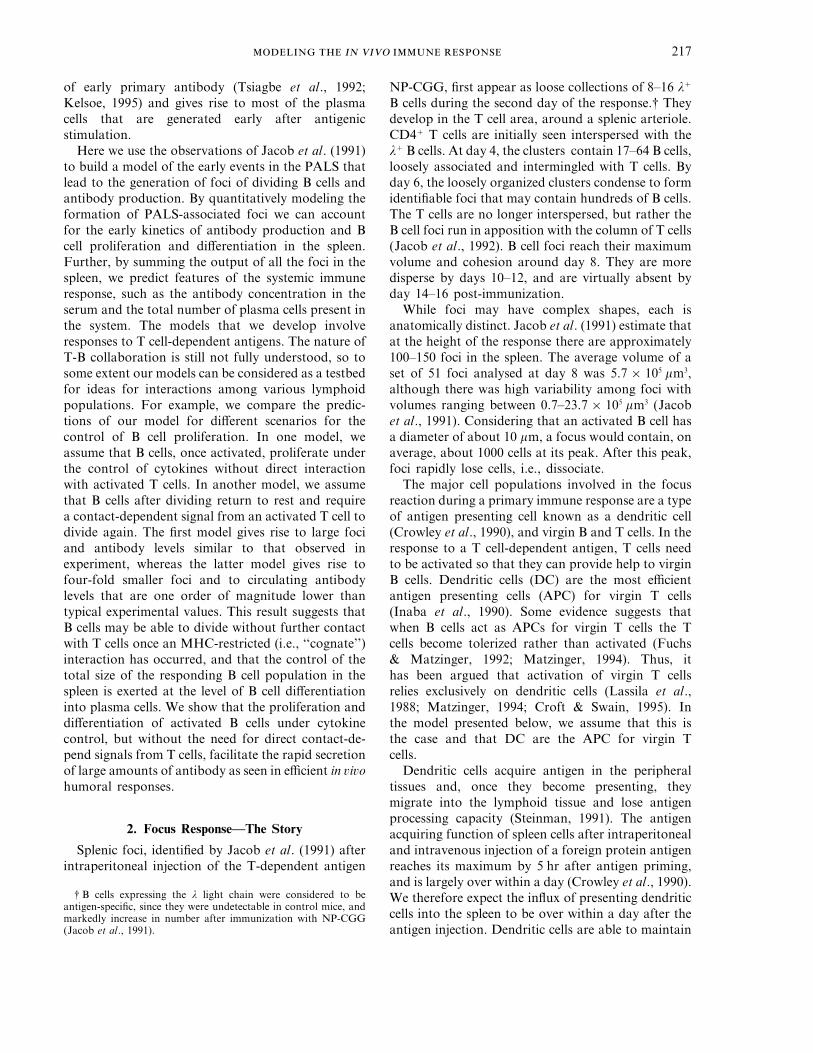
The spleen can be grossly divided into distinctregions of lymphoid and erythroid cells known as thewhite and red pulps, respectively. The white pulp(Fig. 1) is typically concentrated coaxially aroundcentral arterioles, which carry the arterial blood fromthe trabecular artery to the venous sinuses of themarginal zone. The inner layer of the white pulp,called the periarteriolar lymphoid sheath (PALS),contains mostly T cells, and is considered the T cellarea of the spleen. The outer layer, with a high densityof B cells, forms the B cell area or follicle. Duringimmune responses, populations of rapidly dividing Bcells in the B cell area form germinal centers (Fig. 1).The name germinal center was introduced byFlemming in 1885 because of the presence of largenumbers of dividing lymphocytes (Weiss, 1972).Antigen is presented to T and B lymphocytes byspecialized antigen-presenting cells. Within the PALS,antigen is presented to T cells by (interdigitating)dendritic cells that bear abundant major histocompat-ibility complex (MHC) class II molecules (Inabaet al., 1984) and the co-stimulatory molecule CD40(Clark & Ledbetter, 1986), while in germinal centersantigen is presented to B cells by follicular dendriticcells (FDC).
Studies of B cell responses in secondary lymphoidorgans, particularly lymph nodes and spleen, estab-lished a correlation between the local environmentand the outcome of B cell differentiation processes. Bcell memory and the generation of affinity-selected,somatically mutated B cells is associated withgerminal centers (Coico et al., 1983; MacLennan,1994), whereas the production of early antibodies isdue to B cells that proliferate in clusters, known asfoci (Fig. 1), at the edges of the T cell-rich PALS(Jacob et al., 1991; Liu et al., 1991; Van den Eertweghet al., 1993). Understanding how the environmentand architecture of lymphoid organs contribute toimmune responses is one of the outstandingunresolved issues in immunology today.
Jacob et al. (1991) provided a detailed study ofthe primary B cell response within the spleen tothe hapten-protein conjugate (4-hydroxy-3-nitro-phenyl)acetyl-chicken gammaglobulin, NP-CGG.
They showed that the first site of B cell proliferationin the spleen is the PALS, where clusters of B cellsappear as early as 2 days after antigen injection. Thesecells are interspersed with CD4+ antigen-specific Tcells (Kelsoe & Zheng, 1993; Zheng et al., 1994).Interaction between antigen-specific B cells and Tcells leads to B cell proliferation and differentiation.The B cell response in the PALS is the major source
F. 1. Organization of the splenic white pulp. Lymphoid cellsin the spleen are distributed around arterial vessels, called centralarterioles (CA). T cells are found in the periarteriolar lymphoidsheath (PALS), proximal to the blood vessel, this representing theT cell area. In the absence of an immune response, resting B cellsform the B cell follicle, surrounding the PALS. During immuneresponses, B cells proliferate both in foci (F), situated in the outerPALS, and in germinal centers (GC), which develop in the B cellarea.
217
of early primary antibody (Tsiagbe et al., 1992;Kelsoe, 1995) and gives rise to most of the plasmacells that are generated early after antigenicstimulation.
Here we use the observations of Jacob et al. (1991)to build a model of the early events in the PALS thatlead to the generation of foci of dividing B cells andantibody production. By quantitatively modeling theformation of PALS-associated foci we can accountfor the early kinetics of antibody production and Bcell proliferation and differentiation in the spleen.Further, by summing the output of all the foci in thespleen, we predict features of the systemic immuneresponse, such as the antibody concentration in theserum and the total number of plasma cells present inthe system. The models that we develop involveresponses to T cell-dependent antigens. The nature ofT-B collaboration is still not fully understood, so tosome extent our models can be considered as a testbedfor ideas for interactions among various lymphoidpopulations. For example, we compare the predic-tions of our model for different scenarios for thecontrol of B cell proliferation. In one model, weassume that B cells, once activated, proliferate underthe control of cytokines without direct interactionwith activated T cells. In another model, we assumethat B cells after dividing return to rest and requirea contact-dependent signal from an activated T cell todivide again. The first model gives rise to large fociand antibody levels similar to that observed inexperiment, whereas the latter model gives rise tofour-fold smaller foci and to circulating antibodylevels that are one order of magnitude lower thantypical experimental values. This result suggests thatB cells may be able to divide without further contactwith T cells once an MHC-restricted (i.e., ‘‘cognate’’)interaction has occurred, and that the control of thetotal size of the responding B cell population in thespleen is exerted at the level of B cell differentiationinto plasma cells. We show that the proliferation anddifferentiation of activated B cells under cytokinecontrol, but without the need for direct contact-de-pend signals from T cells, facilitate the rapid secretionof large amounts of antibody as seen in efficient in vivohumoral responses.
2. Focus Response—The Story
Splenic foci, identified by Jacob et al. (1991) afterintraperitoneal injection of the T-dependent antigen
NP-CGG, first appear as loose collections of 8–16 l+
B cells during the second day of the response.† Theydevelop in the T cell area, around a splenic arteriole.CD4+ T cells are initially seen interspersed with thel+ B cells. At day 4, the clusters contain 17–64 B cells,loosely associated and intermingled with T cells. Byday 6, the loosely organized clusters condense to formidentifiable foci that may contain hundreds of B cells.The T cells are no longer interspersed, but rather theB cell foci run in apposition with the column of T cells(Jacob et al., 1992). B cell foci reach their maximumvolume and cohesion around day 8. They are moredisperse by days 10–12, and are virtually absent byday 14–16 post-immunization.
While foci may have complex shapes, each isanatomically distinct. Jacob et al. (1991) estimate thatat the height of the response there are approximately100–150 foci in the spleen. The average volume of aset of 51 foci analysed at day 8 was 5.7×105 mm3,although there was high variability among foci withvolumes ranging between 0.7–23.7×105 mm3 (Jacobet al., 1991). Considering that an activated B cell hasa diameter of about 10 mm, a focus would contain, onaverage, about 1000 cells at its peak. After this peak,foci rapidly lose cells, i.e., dissociate.
The major cell populations involved in the focusreaction during a primary immune response are a typeof antigen presenting cell known as a dendritic cell(Crowley et al., 1990), and virgin B and T cells. In theresponse to a T cell-dependent antigen, T cells needto be activated so that they can provide help to virginB cells. Dendritic cells (DC) are the most efficientantigen presenting cells (APC) for virgin T cells(Inaba et al., 1990). Some evidence suggests thatwhen B cells act as APCs for virgin T cells the Tcells become tolerized rather than activated (Fuchs& Matzinger, 1992; Matzinger, 1994). Thus, ithas been argued that activation of virgin T cellsrelies exclusively on dendritic cells (Lassila et al.,1988; Matzinger, 1994; Croft & Swain, 1995). Inthe model presented below, we assume that this isthe case and that DC are the APC for virgin Tcells.
Dendritic cells acquire antigen in the peripheraltissues and, once they become presenting, theymigrate into the lymphoid tissue and lose antigenprocessing capacity (Steinman, 1991). The antigenacquiring function of spleen cells after intraperitonealand intravenous injection of a foreign protein antigenreaches its maximum by 5 hr after antigen priming,and is largely over within a day (Crowley et al., 1990).We therefore expect the influx of presenting dendriticcells into the spleen to be over within a day after theantigen injection. Dendritic cells are able to maintain
† B cells expressing the l light chain were considered to beantigen-specific, since they were undetectable in control mice, andmarkedly increase in number after immunization with NP-CGG(Jacob et al., 1991).

. . . 218
their presenting capacity for 1–2 days after antigenpulsing (Inaba et al., 1990) and the cells most likelydie in situ (Bujdoso et al., 1989).
Small, resting B cells migrate from blood and lymphinto secondary lymphoid tissue (Weiss, 1972). Duringan immune response, antigen specific B cells appear topreferentially move into the T cell area (Cyster &Goodnow, 1995), where they may obtain the cognateinteraction with T cells needed for their activation(Kehry & Hodgkin, 1993; Cyster & Goodnow, 1995).While the details of B-cell activation are still beinguncovered, much is known about this process (Parker,1993; Kehry & Hodgkin, 1993). Briefly, antigen bindsand crosslinks immunoglobulin receptors on the B cell.The antigen is then internalized, processed, andpeptidefragments bound to MHC class II molecules arepresentedon theB cell surface.The recognitionof theseMHC-peptide complexes by T cell receptors, alongwith interactions between complementary pairs ofco-stimulatory molecules [e.g., CD40 on the B cellsurface and CD40 ligand (CD40L) on the surface of anactivated T cell (Clark & Ledbetter, 1994)], leads toB-cell activation. The contact-dependent signalsdeliveredbyactivatedTcells to restingBcellswhile theyare in conjugates are necessary for inducing B cellproliferation (Maliszewski et al., 1993; Armitage et al.,1993). Membranes prepared from both activated Th1
and Th2 clones can provide this proliferative signal(Hodgkin et al., 1990; Petterson et al., 1983), whereascytokines alone cannot. However, in conjunction withthe signal provided by CD40-CD40L interaction,cytokines modulate the amplitude of B cell expansion(Armitage et al., 1993). SomeproliferatingB cells in thefoci differentiate into antibody secreting plasmablastsand plasma cells. Plasmablasts and plasma cells leavethe fociandcanbe identified in the redpulpof the spleenas early as day 4 of the primary response (Liu et al.,1991). Some activated B cells also migrate into thelymphoid follicles and form germinal centers (Jacob &Kelsoe, 1992).
3. Model
From the premises outlined above, we develop amodel of B cell growth and differentiation in a singlesplenic focus during a primary response to a Tcell-dependent antigen. For simplicity, we assumethat the foci within the spleen develop simultaneously,and that the volume of a focus is the average volumeestimated at the peak of foci development, whichoccurs at day 8 after the injection of the antigen. Cellconcentrations are expressed as number of cells perfocus, i.e., per volume of focus.
3.1.
Dendritic cells, B cells, and T cells constitute themain cell populations present in the model. T-cellactivation is assumed to occur via interaction withantigen presenting dendritic cells (DP ). Given that theinflux of antigen-carrying dendritic cells is largelyover within one day after immunization (Crowleyet al., 1990), we assume that all presenting dendriticcells are available when the focus is initiated. Later wewill show that the overall dynamics of the focus is notsignificantly altered when we relax this assumption.We also assume that presenting dendritic cells are lostexponentially, due to cell death, loss of presentingfunction or migration outside the focus.
Resting B cells need to present the antigen toactivated T cells, as the first step of a cognateinteraction resulting in B-cell activation. We assumethat resting B cells acquire the antigen from thesoluble phase, process and present it. Given that theonly site of long-term antigen retention is thefollicular dendritic cell network of the germinalcenters (Nossal et al., 1966), the persistence of freeantigen in the focus is considered to be of the orderof days.
We describe the initial concentration of presentingdendritic cells, DP (0), as a function of the injecteddose of antigen, Agdose , and the total number ofdendritic cells exposed to the antigen, DT . While itseems reasonable to assume that the number ofdendritic cells loaded with antigen is a saturatingfunction of the total antigen dose, there is no explicitdata to guide the choice of a specific functional form.Given this, we choose the simplest saturationfunction. We also assume there is a uniformdistribution of antigen and DC among all the splenicfoci so that
DP (0)=1NF
Agdose
Agdose +KAgDT , (1)
where DP (0) is the initial concentration of presentingdendritic cells within a single focus, NF is the averagenumber of foci in the spleen, and KAg is the antigendose that ‘‘loads’’ 50% of the total number ofdendritic cells (DT ) exposed to antigen.
The initial concentration of free antigen in thefocus, Ag(0), can be estimated in various ways. Wemay assume that some of the injected antigen israpidly cleared (e.g. by the liver and extracellularproteases), while the remainder is distributed over theentire fluid volume (plasma and extracellular fluid) ofthe mouse. In this case, assuming half the antigen israpidly cleared, the remaining fraction of the antigendose that reaches a single focus is given by the ratio

219
T 1Initial conditions and parameter values describing antigen dynamics,
cell dynamics and cell–cell interactionsParameter Value Reference†
Initial conditionsDP (0) 50 cells focus−1
T(0) 30 cells focus−1
B(0) 3 cells focus−1
Ag(0) 4×10⁻⁶ mgAgdose 50 mg Jacob et al. (1991)KAg 50 mg Lanzavecchia (1987)NF 125 foci spleen−1 Jacob et al. (1991)
Antigen dynamicsuB 6 day−1 Lakey et al. (1988)KB 5×10⁻⁷ mg focus−1
gB 2 day−1 Lanzavecchia (1987)gD 0.5 day−1 Inaba et al. (1990)gAg 0.6 day−1 Tew et al. (1979)
Cell dynamicsmT 2 Smith (1984)pT 1.2 day−1
dT 0.02 day−1 von Boehmer & Hafen (1993)dB 0.2 day−1 Chan & MacLennan (1993)dP 0.3 day−1 Liu et al. (1991)km 4 day−1
Cell–cell interactionNT 20 sites Romani et al. (1989)bD 0.5 (cells/focus)−1 day−1 Flechner et al. (1988)b−D 0.3 day−1 Flechner et al. (1988)aD 1 day−1 Romani et al. (1989)c1 1 (cells/focus)−1 day−1
c−1 0.3 day−1
c2 4 day−1
† Parameter values for which no reference is given are justified in the Appendix.
between the average volume of a focus, i.e.5.7×105 mm3, and the distribution volume of amouse, which we estimate to be around 3 ml.Alternatively, if we assume that the fraction of theinjected antigen that reaches the spleen is similarwhether the route of administration is intraperitonealor in the foot pad, then we may use the measurementsof Tew et al. (1979). A single focus will receive thena fraction, 1/NF , of the amount of antigen thatreaches the splenic compartment, NF being theaverage number of foci in the spleen. Estimates of thistype are necessarily imprecise. The Appendix providesfurther details of our parameter estimation procedureand Table 1 gives the parameter values we use in oursimulations.
Both antigen presenting dendritic cells and antigenin the focus are assumed to decay exponentially, atthe rates gD and gAg , respectively:
DP =DP (0)e−gDt, (2)
Ag=Ag(0)e−gAgt. (3)
The assumption of exponential decay of antigen isonly a first approximation to the real situation, inwhich the formation of antigen-antibody complexesfacilitates antigen elimination. Further discussion ofthis issue will be presented below in the context ofdeveloping a model for antibody dynamics.
3.2.
A single dendritic cell can activate as many as10–20 T cells in a day (Romani et al., 1989). Thus, asin Fishman & Perelson (1993) and elaborated furtherin DeBoer & Perelson (1994), we consider eachdendritic cell to have NT independent ‘‘sites’’ to whichT cells can bind. We model the reversible binding ofa T cell to a dendritic cell site, S, and the subsequentactivation of a T cell by the reaction scheme:
T+S FbD
b−D
[TS]4aD
T*+S. (4)
Here T and T* denote resting and activated T cells,respectively, S are free sites on a dendritic cell, and[TS] is the complex formed between a resting T celland a dendritic cell site. The intercellular binding is
. . . 220
characterized by a rate constant bD , whereas thedissociation of [TS] complexes occurs at rate b−D inthe absence of T-cell activation, and at rate aD whenthe T cell is activated as a result of this interaction.The subscript D is used to denote interactions with adendritic cell.
We assume, as a first approximation, that while adendritic cell is in the presenting state, the number ofpresenting sites remains constant. Thus, the concen-tration of free sites is given by:
S=NTDP −[TS], (5)
[TS] being the concentration of bound sites and DP
the concentration of presenting dendritic cells.We neglect T-cell activation by presenting B cells
since it is unlikely that virgin T cells can be activatedby interaction with antigen-presenting B cells (Fuchs& Matzinger, 1992; Matzinger, 1994). Preliminarysimulations using our model pointed out that, even ifpresenting B cells could activate virgin T cells, the lowfrequencies of antigen-specific B cells and T cellsmake it unlikely that many encounters would occurbetween the cells in these populations. Dendritic cells,being antigen-nonspecific, are present in highernumbers than antigen-specific B cells and shouldmore frequently encounter antigen-specific T cells.Once the B cell population expands, B cells maysignificantly contribute to antigen presentation to‘‘experienced’’ T cells, i.e., T cells that were previouslyactivated through their interaction with dendriticcells. Because B cells are more effective at capturingantigen than dendritic cells at low antigen concen-trations, we might expect B cell presentation to beimportant in the late primary response when theantigen concentration is low. However, the T cellresponse in the PALS is largely over within a week(Araneo et al., 1976; Van den Eertwegh et al., 1993),and therefore it is unlikely that T cell activation by Bcells is a major component of the primary response.Thus, during a primary immune response dendriticcells are likely to be responsible for most antigenpresentation to T cells involved in focus formation.
When activated T cells interact in a cognate mannerwith presenting B cells (BP ), the B cells can beactivated. This process involves a cascade ofintermolecular interactions in which a key role hasbeen attributed to the binding of the CD40 molecule,which is constitutively expressed on the B cell surface,to its ligand, CD40L, a molecule that is transientlyexpressed on the surface of activated T cells (Snow &Noelle, 1993; Clark & Ledbetter, 1994). Theassociation between a genetic deficiency in CD40Land the hyper-IgM syndrome described in humans(Aruffo et al., 1993; Fuleihan et al., 1995) emphasizes
the requirement of CD40–CD40L interaction in thedevelopment of a normal immune response. Theinteraction between CD40 and CD40L triggers theintracellular events associated with contact-depen-dent T cell help (Rousset et al., 1991; Kato et al.,1994). In particular, B cells proliferate whenstimulated through CD40 (Banchereau et al., 1994).As a result of this interaction, CD40L is down-modu-lated on T cell surface, and the T cell is renderedincapable of providing further contact-dependenthelp to resting B cells (Yellin et al., 1994; van Kootenet al., 1994). Soluble CD40 may also be released bythe B cell, which can bind CD40L, and preventfurther B-cell activation by T cells expressing CD40L(van Kooten et al., 1994).
We incorporate these features of B cell–T cellinteraction into our model, and propose the followingscheme:
T*+BP Fc1
c−1
[T*B]4c2
[T*B*]4pB
mBB*+T. (6)
An activated T cell, T*, reversibly binds a presentingB cell, BP , the binding and unbinding rate constantsbeing c1 and c−1, respectively. The complex thusformed, [T*B], allows the necessary crosstalk betweenthe activated T cell and the B cell, which results in theB cell becoming activated at rate c2. To account forcontact-dependent proliferation, we assume that Bcells dissociating from complexes with activated Tcells undergo a proliferative event. As experimentalevidence suggests, B cell progression through mitosisweakens the interaction with the T cell (Kupfer et al.,1994), and thus we assume the cells dissociate on Bcell proliferation. The proliferation rate of B cells ispB . We assume that only one round of division takesplace at this stage, and therefore mB , the number ofactivated B cells generated from a [T*B*] complex, istwo. However, we have written the model in a moregeneral form to allow for the possibility that T cellcontact triggers multiple B cell divisions, i.e. mB q 2.Note, we have assumed that the T cell returns to restafter activating a presenting B cell. This is done tomodel the down-regulation of CD40L and thus theinability of a T cell to activate more than one B cell.In a more detailed model, one might wish todistinguish these T cells that have been activated anddown-regulated their CD40L from virgin T cells.
To complete the picture of T cell dynamics, weassume that free activated T cells proliferate, givingrise to mT resting progeny at a rate pT . Thus,
T*4pT
mTT. (7)
In our simulations, we choose mT =2, i.e., we assumethat an activated T cell only divides once (Smith,1984). It is possible that an activated T cell divides

221
two or more times. In that case mT will be larger andpT smaller, to account for the time required for theextra divisions. However, in simulating systems withextra divisions we found it more accurate to explicitlymodel the intermediate steps, rather than to choosemT q 2.
Based on the scheme given by eqns (4–7), thefollowing differential equations can be constructed:
dTdt
= mTpTT*− bDT(NTDP −[TS])+ b−D [TS]
+ pB [T*B*]− dTT, (8)
d[TS]dt
= bDT(NTDP −[TS])− (b−D + aD )[TS], (9)
d[T*B]dt
= c1T*BP −(c−1 + c2)[T*B], (10)
d[T*B*]dt
= c2[T*B]− pB [T*B*], (11)
dT*dt
= aD [TS]− c1T*BP + c−1[T*B]− pTT*,(12)
where [T*B] and [T*B*] denote the complexes of anactivated T cell with a presenting and an activated Bcell, respectively. This model, while complicated, isstill a simplification. We have neglected many detailsof the T cell dynamics, such as the role of cytokinesin controlling proliferation, the migration of theactivated T cells outside the focus, the change in stateof T cells from virgin to experienced during theresponse, and death of activated cells by apoptosis.
3.3.
Presenting B cells are generated from resting B cellsthat have internalized free antigen. B cells concentrateMHC-peptide complexes on their surface (Lanzavec-chia, 1987). Since we expect the processing andantigen presentation machinery to have a maximalcapacity, we have modeled B cell ‘‘loading’’ by asaturation function of antigen concentration. Mem-brane turnover makes presenting B cells lose theirpresenting capacity at a rate gB . Provided that theantigen is still available, we assume that B cells thathave lost antigen presenting capacity can regain it. Amore complex and more accurate model of antigenprocessing and presentation has been developed bySinger & Linderman (1990).
We model the dynamics of resting and presentingB cells by
dBdt
= −uBAg
Ag+KBB+ gBBP − dBB, (13)
dBP
dt=
uBAgAg+KB
B− gBBP − dBBP
− c1T*BP + c−1[T*B], (14)
where uB denotes the rate at which B cells becomepresenting at saturating antigen concentrations, KB isthe concentration of free antigen for which the rate ofpresentation is half-maximal, and gB is the rate atwhich B cells lose presenting functionality. We use thesame death rate, dB , for both resting and presentingB cells in the focus.
Resting B cells in our model are short-lived and dieat per capita rate dB =0.2 d−1. We base thisassumption on the observation that the environmentof germinal centers is required for B cells to becomememory cells (Coico et al., 1983). Germinal centersare only initiated by the fourth day of the response,and fully-developed germinal centers are seen onlyafter day 8 (Kelsoe & Zheng, 1993). Since foci reachtheir peak development at day 8 and largely disappearby day 12–14, we expect little migration of memorycells into the focus. Further, cells in the focus lack thelarge number of antibody V-region gene somaticmutations that characterize memory cells, suggestingthat few or no cells in the focus are memory cells(Jacob & Kelsoe, 1992).
Once activated through cognate interaction withactivated T cells, B cells can both proliferate anddifferentiate into antibody-secreting cells, through theeffect of T cell-derived soluble factors (Armitageet al., 1993). Proliferation of B cell blasts precedes theappearance of antibody-secreting cells. Althoughcytokines are known to intervene in the differentiationprocess, the dynamic control of this process is largelyunknown. Morphologically, the pathway of B celldifferentiation has been traced from B cell blasts, todividing plasmablasts and ending in antibody-secret-ing, non-dividing plasma cells. To model thesefeatures of the B cell response to T cell-derivedfactors, we assume that the B cell proliferation ratedepends on a saturation function, fp , of the cytokineconcentration, C. We also assume that an intracellu-lar signal delivered through cytokine receptorsaccumulates such that the probability that a B blasttriggers its differentiation process into a plasma cellincreases as a function of its history of exposure tocytokines. We model the probability of differentiationof a B cell by a Hill function, fd , of a postulatedintracellular signal, X, delivered through cytokinereceptors. Since differentiation involves the turningon and off of many genes, we assume that the progenyof a cell involved in differentiation have the same stateas the parent. Thus, we believe that it is notunreasonable, as a first approximation, to treat X as

. . . 222
a population level variable rather than following thesignaling that occurs in each cell.
We describe the dynamics of B cell proliferationand differentiation with the following equations:
dB*dt
= mBpB [T*B*]+ [pBfp (C)− kdfd (X)]B*, (15)
dPB
dt= mPkd fd (X)B*− pBPB −(dP + km )PB , (16)
dPdt
= mPpBPB −(dP + km )P. (17)
Here activated B cells, B*, are generated throughcognate interaction with T cells, as given by scheme(6). B cells triggered this way either proliferate ordifferentiate, the functions controlling these pro-cesses, fp and fd , respectively, are discussed below. Themaximal B cell proliferation rate is pB and themaximum differentiation rate is kd . The number ofplasmablasts that a B blast gives rise to is mP . Forsimplicity, we also assume that mP plasma cells will begenerated from a plasmablast, and we set mP =2.Both plasma cells, P, and plasmablasts, PB die at arate dP and migrate outside the focus at a rate km . Onemay argue that being committed to become plasmacells, plasmablasts do not die in that stage. Althoughwe cannot rule out this hypothesis, death in theplasmablast/plasma cell population is a slow processrelative to the migration and proliferation rates, andthus has little impact on focus dynamics.
In eqn (15) we assumed that B cells once activated,can generate activated progeny. An alternativehypothesis, similar to the one we used for T cells, isthat activated B cells generate resting progeny, whichneed to be restimulated before they divide again. Inthis case the dynamics of resting and activated B cellsis given by:
dBdt
= −uBAg
Ag+KBB+ mBpB fp (C)B*
+ gBBP −dBB, (18)
dB*dt
= mBpB [T*B*]− [pB fp (C)+ kd fd (X)]B*.(19)
The implications of this alternative assumption on thepopulation dynamics of the focus are described inSection 4.5.
The differentiation of B cells into plasma cellsrequires T cell-derived soluble factors. Variouscytokines affect the proliferation, differentiation andisotype switching of B cells. Given that the primaryresponse starts with a virgin population of T cells, we
reasoned that IL-2 is the cytokine most likely to beproduced at this stage. A study that followed T celldynamics during the primary splenic response to theconjugate of trinitrophenyl with keyhold limpethemocyanin (TNP-KLH) (Van den Eertwegh et al.,1993), revealed mostly IL-2- and IL-4-producing cells,although other cytokines, such as IFN-g, were alsopresent. Both IL-2 and IL-4 affect B cells as well asT cells. In our model, we simplify matters and followthe production and effects of a single generic cytokine,C, which we postulate affects both proliferation anddifferentiation. In reality multiple cytokines areinvolved in this regulation. We assume that thecytokine, C, is secreted at rate k by activated T cells,whether isolated or in clusters, and that it is utilizedby both activated B cells and T cells, as is the case forIL-2. Cytokine concentration decays as a result ofclearance (e.g., degradation, diffusion away from thefocus, etc.) at a rate dC , and of utilization by activatedcells at a rate dUC . Thus,
dCdt
= ks (T*+ [T*B]+ [T*B*])− dCC
− dUC ([T*B]+ [T*B*]+B*+T*)C. (20)
Since the rate of proliferation of activated B cellsis affected by cytokines (Armitage et al., 1993), weassume that the rate of B cell proliferation is given bypB fP (C), where fP is a simple saturation function ofcytokine concentration that takes on values between0 and 1, i.e.,
fp (C)=C
C+KP. (21)
Here KP is the cytokine concentration for which theproliferation rate is half-maximal. We expresscytokine quantities in ‘‘units’’, a unit being theamount of cytokine secreted by an activated T cellduring one day.
Cultures of B cells and T cells in the presenceof their specific antigen result in B cell proliferationwith the appearance of an increasing number ofplasma cells (Nossal & Ada, 1971). In T-dependentresponses, T cell-derived cytokines are necessary forB cell differentiation (Hodgkin et al., 1990). Here wemodel this by assuming that activated B cells becomeplasma cells according to a function of a cumulativeintracellular signal, X, delivered through cytokinereceptors. To keep our model simple, we assume thatthe cytokine binding is rapid compared with thecellular response. We thus assume that the fraction ofreceptors bound by cytokine is given by C/(C+KC ),i.e., the fraction bound at chemical equilibrium,where KC is the dissociation constant of the cytokine.

223
We further assume that occupied receptors generatea signal at a rate k X , and that this signal decays withrate constant k−X .
Thus, we model the process controlling differen-tiation by the equation
dXdt
= k XRTC
C+KC− k−XX,
where RT is the total number of receptors available forinteraction with the cytokine. Since X is only meantto be a caricature of the myriad of events inintracellular signaling, we simplify the model furtherby neglecting the dynamics of cytokine receptors andthe decay of the intracellular signal. Thus, as a firstapproximation we take RT =constant and k−X =0,so that
dXdt
= kXC
C+KC, (22)
where kX = k XRT .Note, in this version of the model, X will always
increase. Since differentiation is an irreversibleprocess, we assume that the rate of differentiation isa saturation function of X. Rather than the simplesaturation function that we have used previously tomodel concentration dependent events, here we use aHill function, i.e., we assume that the function thatcontrols B cell differentiation is
fd (X)=Xn
Knd +Xn , (23)
where Kd is the value of the transduced signal forwhich differentiation occurs at half-maximal rate. Fornq 1 this function has an inflection point and forlarge n approaches a step function. Thus, by varyingn we can control the nonlinearity in this function andhence the timing and suddenness of appearance ofplasma cells. We explored different values of n andfound that this function with n=2, when used in ourmodel, gives reasonable kinetics for focus develop-ment and for plasma cell appearance.
Although we arrived at the model given byeqns (22) and (23) by reasoning through someplausible biology, in essence we have derived a modelin which differentiation is irreversible and occursdelayed with respect to the initiation of B cellproliferation. Other models with these propertieswould presumably give similar behavior.
3.4.
While it is difficult to obtain kinetic data on thevarious subpopulations in splenic foci, it is possible tomeasure antibody production. To see if our model isconsistent with this type of data, we followed the
dynamics of antibody secreting cells that are in thefocus, as well as those that migrate outside the foci.For antibody secreting cells outside the foci, we sumthe output of plasma cells and plasmablasts from theNF different foci located throughout the spleen:
dPoutB
dt=NFkmPB − pBPout
B −dPPoutB , (24)
dPout
dt=NFkmP+ mPpBPout
B −dPPout, (25)
where PoutB and Pout denote the total number of
plasmablasts and plasma cells present outside thesplenic foci. According to Liu et al. (1991), antibodysecreting cells that are not fully differentiated(plasmablasts), leave the foci and migrate to the redpulp of the spleen, where they complete thedifferentiation process, yielding mature plasma cells.Therefore, in our model plasmablasts that migrateoutside the foci undergo a division and yield mP =2mature plasma cells at a rate pB . Red pulpplasmablasts and plasma cells are short-lived (Hoet al., 1986), and for simplicity we use the same deathrate for these cells in and out of the focus.
Antibodies are produced at different rates byactivated B cells, plasmablasts and plasma cells (sB , sPb
and sPc , respectively) (Conrad & Ingraham, 1974;Melchers & Andersson, 1974), and are assumed to belost at a constant rate dA . Antibody secretion rates ofB cells in different states of differentiation are not wellestablished. We assume that fully differentiatedplasma cells secrete the fastest, that plasmablasts havean intermediate value, and that activated B blastssecrete at low rates (Table 2). In a primary response,the bulk of antibodies are of IgM subtype, and theirhalf-life in adult mice is 2 days (Vieira & Rajewsky,1988). Thus, the concentration of antibody, A, inmg ml−1 changes according to
dAdt
= a[NF (sBB*+ sPbPB + sPcP)
+ sPbPoutB + sPcPout]−dAA, (26)
where a is a constant factor resulting from conversionof units, since antibody secretion is usually reportedin molecules cell−1 s−1, which for IgM, with amolecular weight of 900 kD, converts into1.3×10−7 mg cell−1 day−1. Note that Pout
B and Pout arethe output from all of the NF foci, whereas B*, PB andP represent cell numbers per individual focus. We alsoassume that the secreted antibodies distribute into afluid volume of 1 ml.
This model of antibody dynamics is simplified inthat we have not included the kinetics of antigen–anti-

. . . 224
body complex formation and removal. We haveneglected these precesses because we expect that thefree antigen concentration will be low and notuniform throughout the body. Antigen is alsoremoved by macrophages and other phagocytic cellsand modeling these other removal processes and thespatial distribution of antigen is outside the scope ofthis paper.
4. Results
The model described in Section 3 was studiednumerically. Initial conditions and parameters aregiven in Tables 1–2 and justified in the Appendix. Wediscuss the kinetic behavior of the model with regardto dendritic cells, T cells, B cells, and antibodyproduction.
4.1.
Activation of T cells in the primary response isdependent on antigen presenting dendritic cells. Inour model, presenting dendritic cells in the focusdecay exponentially from their initial level DP (0), hereapproximately 50 cells, to virtually 0, a week afterantigen injection [Fig. 2(a)]. This behavior relies onour assumptions that dendritic cells acquire theantigen outside the focus, enter the focus in bolus andeither die there or lose their presenting capacity. Weexplored the effect of relaxing the constraint of havingall presenting dendritic cells available at the initiationof the focus. We used a function of the form
DP (t)= a(kt)n e−kt with the parameters a, k and n setsuch that the function is increasing until 5 hr afterantigen injection, and its integral over the first dayequals the value that we previously used for the initialnumber of presenting dendritic cells in the focus. Thisfunction was suggested by measurements of theantigen presenting capacity of spleen cells as afunction of time after antigen injection (Crowleyet al., 1990). With this function for dendritic cellinput, the B cell dynamics in the focus remainsbasically unaltered from that shown in Fig. 2(c), andso does the computed antibody level in the serum (notshown).
Free sites on presenting cells independently bindresting T cells. In this model each dendritic cell isassumed to have NT =20 T cell binding sites. Thus,the focus starts with a high excess of presenting sitesto T cells (with our default parameters this ratio is100:3). Due to this, the rate of T cell-dendritic cellcomplex formation is very high, and no antigen-specific resting T cells persist in the free state at day1 of the response [Fig. 2(a)]. T cell-dendritic cellcomplexes ([TS]) peak at day 4 after antigen injection,followed by activated T cells (T*), whose concen-tration in the focus reaches its maximum at day 5[Fig. 2(a)]. The peaking of activated cells at day 5 wasdescribed experimentally by Van den Eertwegh et al.(1993) in the primary response to TNP-KLH, and hasalso been seen by Kelsoe (personal communication) inthe response to NP-CGG. Although they werestudying the development of the primary response ina draining lymph node, McHeyzer-Williams & Davis
T 2Parameter values for B cell proliferation and differentiation, cytokine
dynamics, and antibody dynamicsParameter Value Reference†
B cell proliferationand differentiationpB 1.5 day−1 Tannenberg & Malaviya (1968)kd 1.5 day−1
KP 5 units/focusKC 0.2 units/focuskX 1 day−1
k−X 0Kd 7
Cytokine dynamicskS 1 unit cell−1 day−1
dC 0.5 day−1
dUC 10−2 units focus−1 day−1
Antibody dynamicssB 100 molecules cell−1 sec−1 Melchers & Andersson (1974)sPb 1000 molecules cell−1 sec−1
sPc 10 000 molecules cell−1 sec−1 Conrad & Ingraham (1974)dA 0.3 day−1 Vieira & Rajewsky (1988)a 1.3×10⁻⁷ mg cell−1 day−1
† Parameter values for which no reference is given are justified in the Appendix.

20
100
Time (days)
Cel
ls f
ocu
s–1
80
60
40
20
4 8 12 160
Dp
T*
[T-S]
20
500
Time (days)
Cel
ls f
ocu
s–1
400
300
200
100
4 8 12 160
T
Total T cells
20
1000
Time (days)
Cel
ls f
ocu
s–1
800
600
400
200
4 8 12 160
PB
B*
T
Total B cells
P
225
(b)
F. 2. Dynamics of cell populations involved in the development of the focus. The parameters and initial conditions are given in Tables1 and 2. (a) Dendritic cell and T cell dynamics. DP , presenting dendritic cells; T, resting T cells; T*, activated T cells; [TS], complexesof T cells with dendritic cell sites. (b) T cell dynamics. Both total T cells and resting T cells are shown, where totalT=T+T*+ [TS]+ [T*B]+ [T*B*]. (c) B cell dynamics. B*, activated B cells; PB , plasmablasts; P, plasma cells. B cells once activatedcan only proliferate or terminally differentiate, and therefore the concentration of resting B cells, B, presenting B cells, BP , and B cellsin complexes with T cells, [T*B] and [T*B*] is practically 0 after day 1.
(a)
(c)

12
0.5
Time (days)
0.2
0.1
4 80
0.4
0.3
. . . 226
(1995) observed that the peak of the in vivo T-cellresponse to pigeon cytochrome c occurred at day 6.
In our model, activated T cells return to rest eitherat the end of a proliferation cycle or as a result ofactivating a B cell, which results in down-regulationof the CD40L on the T cell surface (Yellin et al.,1994). The pool of free resting T cells expands rapidlyafter day 4. Activated T cells, generated through theinteraction with presenting dendritic cells, give rise toresting progeny, and since antigen presentation bydendritic cells decays rapidly, resting T cells fail to bereactivated. The expansion of resting T cells[Fig. 2(b)] lasts for as long as activated T cells persistin the system, which in our simulations is through thesecond week of the focus reaction [Fig. 2(a)].Thereafter, resting T cells are lost exponentially,through cell death. Since our model ignores T cellmigration and apoptosis, our results probablyoverestimate the number of T cells in the focus.
It is important to recognize that the concept of a‘‘focus’’ in our model does not fully overlap with thefocus described experimentally. In our model a focusincludes all the cell populations that are relevant forB cell dynamics in the T cell area. These populationsare shared between the B cell focus and the T cellPALS that are in close spatial proximity (Jacob et al.,1992).
4.2.
We first study the model given by eqns (13–17), inwhich we assume activated B cells proliferate andremain activated until they differentiate or die. InSection 4.5 we discuss the results that obtain when Bcells return to rest after they divide.
Figure 2(c) shows the dynamics of B lineage cells,as modeled by eqns (13–17). In contrast to cells of theT subset [Fig. 2(b)], the total number of B cells in thefocus displays a sharp peak at day 8 of the simulation.This is due to a shorter lifetime of B cells, as well asto the migration of effector B cells (plasmablasts andplasma cells) outside the focus.
The total number of B cells in the focus, given byour simulations, has an expansion phase [Fig. 2(c)],with about 12 B cells at day 2, 100 cells at day 4, 600cells at day 6, and reaching a maximum of 800 cellsat day 8. The dominant subpopulation is activated Bcells. Since B cells once activated can either proliferateor terminally differentiate into plasma cells, no restingB cells are seen in the focus after day 1 (not shown).Activated B cells expand rapidly until day 7–8, anddecay afterwards, due both to lack of cytokinesrequired for their proliferation, and to differentiationinto plasma cells. Plasmablasts and plasma cells firstappear in the focus at day 4 [Fig. 2(c)], and slowly
expand over the next 4 days. In our model, themechanism that limits this expansion, and that finallyresults in the depletion of cells from the focus, is themigration of differentiated cells outside the focus. Theproportion of plasmablasts and plasma cells in the Bcell population (Fig. 3) at the peak of the focusresponse, is 30–35%, and reaches 40% when the focusstarts dissociating (day 10–12). Although this ratiowas not assessed in the experimental system that wemodeled, studies of the B cell response in lymph nodesshowed that plasma cells represent a minority of thenewly generated cells within that site (Nossal, 1962).Measurements of the ratio of plasmacytes to B cellsin the focus as a function of time could be used torefine and further test our model.
The dissociation phase of the focus, as describedexperimentally, occurs at a rate similar to theexpansion. From a peak of a few hundred cells at day8, only 8–12 cells remain in the foci by day 12–14(Jacob et al., 1991). Our model gives a slowerdissociation phase: it takes up to day 16 of thesimulation to reach a similar number of B cells[Fig. 2(c)]. The mechanisms responsible for the shutdown of the focus response, as well as for immuneresponses in general, are less clear than the ones thatstart it. Various interactions associated with B-cellactivation are known to induce homotypic adhesion
F. 3. Fraction of the total B lineage cells that are committedto antibody secretion, i.e., that are plasmablasts and plasma cells,in the total B cell population of the focus.

20
4
Time (days)
Cel
ls ×
10–5
1
4 8 12 160
3
2
P out
PBout
20
1400
Time (days)
Ser
um
an
tibo
dy (
µg m
l–1)
800
600
400
200
4 8 12 160
1200
1000
227
F. 4. Dynamics of effector B cells outside the foci. Number ofplasmablasts, Pout
B , and plasma cells, Pout, outside foci vs time.Plasmablasts and plasma cells are assumed to be generated byNF =125 foci.
simulation. In our model, this number increases veryrapidly, such that by day 10, approximately 3.5×10⁵
plasma cells are present in the periphery.The concentration of specific antibodies in the
experimental model of Jacob et al. (1991) reaches1.2 mg ml−1 at day 10–12 (Han et al., 1995). Theisotype of the antibody was not reported but shouldbe a mixture of IgM and IgG. While IgM remainsmainly in the circulation, where the plasma volume isprobably 0.5–0.75 ml, IgG spreads from the circula-tion into extravascular spaces. Assuming that theantibody output of secreting cells in our model isdistributed over a 1 ml volume, a similar antibodyconcentration is reached at day 12 of the simulation(Fig. 5). If the distribution volume is larger, say 2 or3 ml, then our model would predict about half or athird of the measured antibody concentration.Because the antibody secretion rate is not known veryprecisely, and may be different for IgM and IgG,estimates of the predicted antibody concentration willnecessarily be somewhat inaccurate. The major pointof Fig. 5, is that with ball-park parameter estimatesour model obtains peak antibody concentrationssimilar to those observed.
Several phenomena that we neglect contribute toantibody dynamics, and are probably responsible for
of B cells (Clark & Lane, 1991; Clark & Ledbetter,1994) and plasma cells may simply lack the surfacemolecules involved in adhesion. Thus, plasma cellsmay easily migrate outside the focus. Moreover,plasma cells, which increase in proportion during thefocus response (Fig. 3), may hinder the homotypicinteraction of activated B cells. Thus, after a certainpoint in focus development, activated B cells may joinplasma cells in migrating outside the focus, assuggested by DNA sequencing data from foci andtheir neighboring germinal centers (Jacob & Kelsoe,1992). Our model ignores migration of activated Bcells and this may, in part, account for the slowdissociation in the model.
4.3.
The parameters that characterize the systemicantibody response are the number of antibodysecreting cells (plasma cells and plasmablasts) and theconcentration of antibodies in the circulatory systemof an animal. We computed the number of antibodysecreting cells, by summing the output from theaverage number of foci observed in the spleen by(Jacob et al., 1991) (Fig. 4). Plasmablasts and plasmacells appear in considerable numbers (a thousandcells) outside the focus compartment at day 4 of the
F. 5. Concentration of antigen-specific antibody in the serumas a function of time. Antibody secretion is due to plasmablasts andplasma cells from both within and outside the foci, as well as toactivated B cells, B*, present in the foci.

20
1500
Time (days)
B li
nea
ge c
ells
foc
us–1
1200
900
600
300
4 8 12 160
300
30
3
. . . 228
the long persistence of a high antibody titer that isobserved in vivo and which our model fails to display.In the late primary response, during the second weekafter antigen injection, germinal centers start develop-ing that also give rise to plasma cells (Liu et al., 1991).Some plasma cells, especially those from germinalcenters, home to the bone marrow. These cells, of IgGand IgA isotype, have a life span of around 4 weeks,considerably longer than the IgM secreting cellsfound at the same site (Ho et al., 1986). The totalantibody output of the long-lived plasma cells isprobably higher, and therefore the antibody titer willbe sustained on a high level for a period of time longerthan predicted by our model. Also, around day 6–8post-immunization B cells start switching to IgGsecretion (Jacob et al., 1991). IgG molecules have alonger persistence in the serum than IgM (Vieira &Rajewsky, 1988), and therefore an accurate dynami-cal description of the antibody level would have toinclude the isotype switch, a topic beyond the scopeof this paper.
4.4.
The low frequency of antigen-specific B cells and Tcells makes their cognate interaction quite improba-ble, and still the primary response develops in a fewdays. An activated B cell can potentially proliferate,but it may also differentiate into non-proliferatingplasma cells. Yet, in the focus, the B cell poolundergoes a rapid initial expansion before it generatesits effectors (plasmablasts and plasma cells). We usedour model to assess which scenarios would make thesebehaviors possible.
T cells intervene at various places on the path of Bcell differentiation into plasma cells. T cell dynamicspopulation affects the B cell response, as isdemonstrated by the slower B cell kinetics inunimmunized vs. carrier-primed animals (Liu et al.,1991). Since our estimate of the number of specific Tcells at the initiation of the focus response varied overan order of magnitude (see Appendix), we exploredthe effect of changing the initial number of restingantigen-specific T cells. Figure 6 shows the dynamicsgiven by our model for the total number of B cells inthe focus for various initial concentrations of T cells.Starting with three T cells, the resulting B cellresponse is slow, and the maximum B cell number isone order of magnitude lower than the one given byour default value of 30 T cells. On the other hand, 300initial T cells only raise the B cell peak by 75%. Thisis understandable because in our model differen-tiation is a function of the cumulative intracellular
F. 6. Dependence of the total B cell number in the focus on theinitial number of T cells, where total B=B+BP +B*+PB +P.The numbers on the curves represent the number of the T cells thatinitiated the focus. The middle curve corresponds to the defaultvalue of 30 T cells. The other initial conditions and parameters aredefined in Tables 1 and 2.
signal delivered by cytokine. Thus, a higher numberof activated T cells will release a larger amount ofcytokine and trigger faster B cell differentiation. Thefaster onset of maximal proliferation at high cytokineconcentration is not able to expand the B cell poolenough to make up for the loss of proliferating cellsdue to early differentiation.
The interplay between proliferation and differen-tiation is central to understanding focus dynamics.Therefore, we explored the sensitivity of the model tothe cytokine concentration that gives the half-maxi-mal proliferation rate, KP [see eqn (21)]. KP isexpressed in units of cytokine per focus, one unitbeing the amount secreted by a T cell in one day. Lowvalues of KP allow an earlier attainment of themaximal proliferation rate, which results in a largerexpansion of the B cell population. Figure 7 showsthat a decrease in KP by 50% of its default value,doubles the peak number of B cells in the focus.Sensitivity is lower at high KP values; a 50% increaselowers the peak of total B cells by only 30% (Fig. 7).This result emphasizes the importance of contact-de-pendent proliferation of B cells. Were B cells todepend only on the cytokines in their environment forproliferative signals, they would need to be sensitive

20
1000
Time (days)
B li
nea
ge c
ells
foc
us–1
800
600
400
200
4 8 12 160
20
1800
Time (days)
B li
nea
ge c
ells
foc
us–1 1200
900
600
300
4 8 12 160
2.51500
5
7.5
229
to minute amounts of cytokines in order to be able toexpand at the rates seen in experimental systems. Theproliferative signal delivered by direct contact withthe T cell eases this restriction, allowing some B cellexpansion before cytokines accumulate in theenvironment.
The dissociation constant for the cytokine bindingto its receptor, KC , which enters into the calculationof the intracellular differentiation signal X [eqn (22)],has a smaller influence on the total B cell number(Fig. 8). Changing the value of this constant by 50%hardly affects the B cell dynamics. This is notunexpected, since for our default parameters most Bcell differentiation occurs at a cytokine concentrationfar beyond the value of KC . The discrepancy insensitivity of proliferation and differentiation tocytokine concentrations is due to the mechanisms thatare responsible for these processes in our model. B cellproliferation is directly modulated by cytokines thatwhile the differentiation signal accumulates and doesnot decay in time. This makes B cell differentiationless sensitive to changes in the cytokine concentration.
The model also shows a high sensitivity to Kd , thevalue of the intracellular signal that gives half-maxi-
F. 8. Sensitivity of the total number of B cells in the focus tothe value of the dissociation constant, KC , where KC is the cytokineconcentration for which half of the cytokine receptors on the B cellsurface are bound. The middle curve corresponds to the defaultvalue, KC =0.2 units focus−1 and the curves above and below to50% variation around the default value, i.e. KC =0.3 units focus−1
and KC =0.1 units focus−1. All other parameter values are asdefined in Tables 1 and 2.
F. 7. Sensitivity of the total number of B cells in the focus onthe value of the saturation constant, KP , where KP is the cytokineconcentration for which proliferation is half-maximal [see eqn (21)].The numbers on the curves represent the value of KP used togenerate that particular curve, all other parameters beingunchanged and defined in Tables 1 and 2. The middle curvecorresponds to the default value, KP =5 units focus−1.
mal differentiation rate [eqn (23)]. A 50% decrease ofKd (Fig. 9) dramatically reduces the peak in B cellnumber to one fourth of the value that we obtainedfor the default value Kd =7. This is due to apremature start of differentiation of activated B cellsinto plasma cells. The opposite effect is given by a50% increase in the value of Kd . Due to a latedifferentiation of B cells into plasma cells, the pool ofactivated B cells expands more, and the total numberof B cells reaches a value that is 75% higher than theone obtained for Kd =7. The observed dynamics ofthe focus response is probably the result of a set ofcompromises between rapid clonal expansion and theneed for differentiation into antibody-secretingeffector cells. This set of compromises can be studiedin the context of generating an ‘‘optimal’’ response(Perelson et al., 1976).
4.5.
?
In the focus, a small number of B cells rapidlygenerate 1–2000 cells (Jacob et al., 1991; Jacob &Kelsoe, 1992). Our attempt to generate a rapid

20
1000
Time (days)
B li
nea
ge c
ells
foc
us–1
800
600
400
200
4 8 12 160
20
1400
Time (days)
Ser
um
an
tibo
dy (
µg m
l–1)
800
600
400
200
4 8 12 160
1200
1000
20
1500
Time (days)
B li
nea
ge c
ells
foc
us–1
1200
900
600
300
4 8 12 160
3.5
7
10.5
. . . 230
expansion motivated our assumption that proliferat-ing B cells give rise to activated B cells as progeny.While this seems plausible, it has not been experi-mentally verified in vivo. Thus, we also studied thealternative model in which activated B cells give rise toresting progeny by replacing eqns (13) and (15) for Band B* by eqns (18) and (19), and keeping all para-meters at their default values. For this alternativemodel, the total number ofB cells in the focus is around200 as opposed to 800 that we originally obtained[Fig. 10(a)], and the antibody output is decreased byone order of magnitude [Fig. 10(b)]. Although we donot argue that generating activated progenies of B cellsis the only mechanism able to account for rapid focusexpansion, our simulations suggest that if B cells returnto rest after each division and require a cognateinteraction with T cells to become activated andproliferate again, the focus would not be able toexpand rapidly and simultaneously generate a largenumber of antibody secreting plasma cells.
5. Discussion
We have developed a model for the in vivo primaryantibody response to a T cell-dependent antigen. The
F. 10. Effect of B cell proliferation giving rise to restingprogeny on (a) the total B cell number in the focus and (b) theserum antibody level. The dashed line represents the behavior ofthe model described in Section 3.3, in which B cell proliferationgives rise to activated progeny. The continuous line illustrates thebehavior of the model in which B cells return to rest after eachproliferation cycle. Notice that if the progeny of activated B cellsare resting B cells, the antibody response is almost negligible.
(a)
(b)
F. 9. Sensitivity of the B cell response to the value of theintracellular, cytokine-dependent signal that gives half-maximalrate of differentiation, Kd [eqn (23)]. The numbers on the curvesrepresent the value of Kd used to generate that particular curve, allother parameters are defined in Tables 1 and 2. The middle curvecorresponds to the default value, Kd =7 units focus−1.

231
model was motivated by detailed kinetic measure-ments made by Jacob et al. (1991) of the amplitudeof the response in the T cell dependent area of thespleen. While previous models have examined Tcell-dependent responses (e.g. Antia et al., 1991),none have taken into consideration the newlyemerging details about the localized features of theresponse. Thus, instead of a response occurringthroughout an animal, we now know that theresponse is generated by many local sets of B cellsgrowing into large colonies within secondarylymphoid organs (cf., Kelsoe, 1995; MacLennan,1994). Thus, even within secondary lymphoid organsthe response is restricted to particular microenviron-ments, in which different cell–cell interactions affectthe B cell differentiation pathway. Here, we study theresponse to a hapten-protein conjugate injected intothe peritoneal cavity. With this route of injection mostof the response occurs in the spleen. When antigensare injected into peripheral tissues, responses tend tobe localized in the draining lymph nodes. Our modelhas tried to take into account the major features ofthe B cell response including antigen presentation,and antigen specific B and T cell responses.
The constraints that we imposed on our model werederived from experimental findings. Antigen-specificB cells are observed to undergo a rapid expansion, inspite of low initial frequencies of antigen-specific Bcells and antigen-specific helper T cells. A largenumber of plasmablasts and plasma cells are alsogenerated, which increases the rate at which B cellsneed to expand, since plasma cells are non-dividingand leave the focus. B cell foci are transient structures,that reach maximum size at about day 8 of theresponse, and then almost completely disappear byday 12–14. The T cell response is more rapid, withactivated T cells reaching their maximal populationsize at about day 5 (Kelsoe, personal communication;Araneo et al., 1976; Van den Eertwegh et al., 1993;McHeyzer-Williams & Davis, 1995).
Our model began by considering the accumulationof the antigen in the spleen, and the generation ofantigen presenting dendritic cells. We, as well asothers, have argued that dendritic cells are the majorpresenting cells for resting T cells. We model thisinteraction, taking into account the fact that dendriticcells can present antigen to many T cells due to theirlarge surface area. Once T cells are activated byinteraction with antigen presenting dendritic cells, weassume that they upregulate the potent co-stimulatorymolecule CD40-ligand (CD40L), which can interactwith the constitutively expressed CD40 receptor onresting B cells. We assume this interaction is cognate,and thus restricted to B cells that have processed and
presented antigen for which the T cell is specific. Thisinteraction is assumed to lead to the down-regulationof CD40L, so that T cells are unable to affectstimulation of bystander B cells that they may interactwith in a non-cognate fashion. Further, this impliesthat one activated T cell can only stimulate oneresting B cell. While this may seem inefficient, weshow that if further B cell proliferation is regulatedthrough the secretion of cytokines by activated Tcells, rather than through further cognate inter-actions, enough B cell expansion can occur togenerate an effective primary response. However, ifprogeny B cells need further contact-mediatedinteractions with an activated T cell, the responsekinetics are too slow to account for the amount ofantibody produced in the response. Whether down-regulation of CD40L is sufficiently efficient that theone activated T cell–one activated B cell rule appliesis unknown. Our model suggests that a systemoperating by this rule and using cytokine regulationcan generate kinetics consistent with those observedduring primary responses.
Antigen distribution and persistence clearly playsan important role in the magnitude and nature of theimmune response. Our model is largely insensitive tothese parameters, since dendritic cells are assumed toprocess the antigen during the first few hours of theimmune response, and B cells, once activated,generate by proliferation progeny that are activated.Although a single proliferation cycle per activationevent is clearly not enough to allow for the magnitudeof the B cell expansion observed experimentally, it ispossible that B cells will return to rest after a fewcycles of proliferation. In this case, antigen persist-ence within the focus becomes crucial to themaintenance of the proliferative response. Our modeldid not follow in detail the dynamics of antigen andthe antigen–antibody interaction. Experimental datasuggest though, that the clearance of antigen is slowin the absence of serum antibody, and increasesdramatically when specific antibodies start beingproduced (I. MacLennan, personal communication).A more refined version of our model, which wouldallow B cells to return to rest after a certain numberof proliferation cycles, would need to follow theantigen dynamics with more precision, and includeboth antibody-independent and antibody-dependentmechanisms for antigen clearance.
The control of B cell proliferation and differen-tiation is not well understood. While the CD40–CD40L interaction appears to be involved in theoptimal activation of B cells by helper T cells leadingto a B cell proliferative response (Maliszewski et al.,1993; Armitage et al., 1993; Clark & Ledbetter, 1994),
. . . 232
cytokines such as IL-2 and IL-4 can enhance theresponse, and other cytokines such as TNF-b, IFN-g,IL-5, and IL-6 influence isotype switching anddifferentiation into plasma cells (Janeway & Travers,1994). Given our incomplete understanding of theseprocesses, we choose to model the control of prolifer-ation and differentiation in a simple way, consistentwith the biological features of cytokine control.
To get rapid B cell expansion, proliferation mustprecede differentiation. Also, differentiation needs tobe irreversible. Thus, once a cell commits todifferentiate, it should become a plasmablast and thena plasma cell, even if the signal causing differentiationceases. We found that a model in which proliferationwas controlled by the concentration of a ‘‘cytokine’’,C, and differentiation controlled by the level of anintracellular signal, X, generated by cytokine bindinggave results consistent with the kinetics of the focusresponse. Since the cytokine needed to be presentbefore the level of X built up, the model ensured thatproliferation preceded differentiation. Also, by havingthe level of X monotonically increase during the focusresponse, the differentiation signal would alsoincrease and differentiation would behave as anirreversible process. By choosing in an appropriateway the parameters in the functions that controlledproliferation and differentiation we could ensure thatthe focus would grow to a large size before too manycells were removed from the proliferative pathwaybecause of differentiation.
The function fd (X) that controlled the rate ofdifferentiation was chosen as a Hill function with Hillparameter n. If n is made large, then the functionbehaves as an on–off switch, with differentiation onlyoccurring if X is greater than some threshold value.For smaller values of n, e.g., n=2, the value used inour model, differentiation is more gradual. However,there still is little differentiation when X is small, andthus differentiation is delayed until X builds up. Atthe end of the response, the system needs to reset.Thus X should decay. In our simple model, whichonly followed the response up to day 20, we ignoredthis resetting by choosing k−X =0. However, smallvalues of k−X would give similar behavior as long asthe resetting were slow compared with the kinetics ofthe focus response.
Our model was simplified in other ways. Forexample, antigen needs to crosslink immunoglobulinreceptors on B cells in order to stimulate them. Herewe have ignored this phase of the antigen-B cellinteraction, and simply assume that at the antigendose being studied sufficient crosslinking occurs. Ifdata were available at many other antigen doses, thenB cell receptor crosslinking would need to be modeled
to correctly predict the antigen dose dependence ofthe response. Another simplification is that the modelfollowed the migration only of plasma cells andplasmablasts outside the focus. There are other cellmigration phenomena, still under experimentalinvestigation, that are also important in the focusresponse, and that can be included in this model. Suchphenomena include the recruitment of virgin cells orresting cells, in the on-going focus response(MacLennan & Gray, 1986; Gray et al., 1986), as wellas the migration of activated B and T cells outside thefocus area. This latter process is thought to beinvolved in the initiation of the germinal centerreaction.
Our model was aimed at the dynamics of anaverage focus and we concluded that the number ofT cells available for its development should be largeenough to provide B cells with the required help. Inthe experimental system though, primary responsesare characterized by a high variability in both focusand germinal center volumes across a spleen section(Jacob et al., 1991; Liu et al., 1991). A few factorsthat can account for this variability are suggested byour simulations. They are mainly related to T celldynamics in the context of limiting T cell help.Variability in the number of T cells that initiateindividual foci would result in variability in focus sizeacross the spleen. This conclusion is supported byexperiments done in carrier-primed animals, whereantigen-specific T cells greatly exceed the number ofspecific B cells. Under those circumstances, hetero-geneity in size among various foci and germinalcenters disappears (Liu et al., 1991), and foci havelarger maximal sizes (MacLennan et al., 1990).Dendritic cell distribution across the spleen foci hasa similar effect, manifested through the T cells thatthey activate. The change in the spectrum of cytokinessecreted by T cells during the focus reaction is alsolikely to alter the balance of proliferation anddifferentiation of B cells in the focus. Variouscytokines are known to have different efficacies on Bcell proliferation and differentiation into antibody-forming cells (Armitage et al., 1993).
The phases of cognate B cell–T cell interaction alsoneed a better experimental definition. Our modelsupports the view that T cell help involves both acontact-dependent and a contact-independent phase.Studying the behavior of our model also pointed outthat functional properties of cells in intercellularcomplexes have a significant effect on populationdynamics. For example, activated T cells are inconjugates with presenting dendritic cells or present-ing B cells for much of the early focus response. Weassumed that such cells, even though in conjugates,

233
can secrete cytokine into the extracellular medium. Ifwe assumed instead that all cytokine secretion waslocal and affected only cells in the conjugate (Kupferet al., 1994), then the dynamics of B cell expansion isslowed, since the cytokine level is decreased. In thisform of the model, the proliferation signal deliveredto B cells depends mainly on intercellular contact withT cells, unless we assume that B cells are sensitive tothe minute concentrations of soluble factors whichmight be available outside of conjugates. Since T cellsspend a long time in complexes with dendritic cells(Flechner et al., 1988), this may limit their interactionwith specific B cells in a mixture of B cells anddendritic cells. This limitation becomes critical if onetakes the view that T cell contact is required at eachB cell proliferation cycle.
In summary, we have developed a model that canaccount for the kinetics of primary antibodyresponses seen in mice. The model predicts kinetics ofB cell clonal expansion in the T cell zone of the spleenthat are consistent with the observations of Jacobet al. (1991). Detailed experimental measurements ofthe population dynamics of the various lymphocytesand antigen presenting cell subpopulations that forman antibody secreting cell focus can be used forevaluating this model as well as more elaboratevariants.
We thank Garnett Kelsoe and Tudor Oprea for helpfuldiscussions and Byron Goldstein for help with the artwork.Portions of this work were done under the auspices of theU.S. Department of Energy and supported by NIH grantAI28433 (A.S.P.) and the Santa Fe Institute through theJoseph P. and Jeanne M. Sullivan Foundation Program inTheoretical Immunology.
REFERENCES
A, R., L, B. & W, P. (1991). A quantitativemodel suggests immune memory involves colocalization of B andTh cells. J. theor. Biol. 153, 371–384.
A, B. A., M, P. C. & K, J. W. (1976).Functional heterogeneity among the T-derived lymphocytes ofthe mouse. V. Response kinetics of peripheral T cellsubpopulations. J. Immunol. 117, 1233–1237.
A, R., M, C. R., A, M. R., G,K. H., S, M. K. & F, W. C. (1993). CD40L: amulti-functional ligand. Sem. Immunol. 5, 401–412.
A, A., F, M., H, D., L, X.,M, A., N, S., B, J. et al. (1993). TheCD40 ligand, gp39, is defective in activated T cells from patientswith X-linked hyper-IgM syndrome. Cell 72, 291–300.
B, J., B, F., B, D., B, F., G,J. P., K, C. et al. (1994). The CD40 antigen and itsligand. Annu. Rev. Immunol. 12, 881–922.
B, R., H, J., D, B. M., Y, P. & MC,I. (1989). Characterization of sheep afferent lymph dendritic cellsand their role in antigen carriage. J. Exp. Med. 170, 1285–1302.
C, E. Y.-T. & ML, I. C. M. (1993). Only a smallproportion of splenic B cells in adults are short-lived virgin cells.Eur. J. Immunol. 23, 357–363.
C, E. A. & L, P. J. L. (1991). Regulation of human B cellactivation and adhesion. Annu. Rev. Immunol. 9, 97–127.
C, E. A. & L, J. A. (1986). Activation of human Bcells mediated through two distinct cell surface differentiationantigens, Bp35 and Bp50. Proc. Natl. Acad. Sci. U.S.A. 83,
4494–4498.C, A. A. & L, J. A. (1994). How B and T cells talk
to each other. Nature 367, 425–428.C, R. F., B, B. S. & T, G. J. (1983).
Relationship of germinal centers in lymphoid tissue toimmunologic memory. VI. Transfer of B cell memory with lymphnode cells fractionated according to their receptors for peanutagglutinin. J. Immunol. 131, 2254–2257.
C, R. E. & I, J. S. (1974). Rate of hemolyticantibody production by single cells in vivo in rabbits.J. Immunol. 112, 17–25.
C, M. & S, S. (1995). Recently activated naive CD4 Tcells can help resting B cells, and can produce sufficient autocrineIL-4 to drive differentiation to secretion of T helper 2-typecytokines. J. Immunol. 154, 4269–4282.
C, M., I, K. & S, R. M. (1990). Dendritic cellsare the principal cells in mouse spleen bearing immuno- genicfragments of foreign proteins. J. Exp. Med. 172, 383–386.
C, J. G. & G, C. C. (1995). Antigen-inducedexclusion from follicles and anergy are separate and complemen-tary processes that influence peripheral B cell fate. Immunity 3,
691–701.D B, R. J. & P, A. S. (1994). T cell repertoires and
competitive exclusion. J. theor. Biol. 169, 375–390.F, M. A. & P, A. S. (1993). Modeling T cell–antigen
presenting cell interactions. J. theor. Biol. 160, 311–342.F, E. R., F, P. S., K, G. & S,
R. M. (1988). Antigen-specific T lymphocytes efficiently clusterwith dendritic cells in the human primary mixed-leukocytereaction. Cell. Immunol. 111, 183–195.
F, E. & M, P. (1992). B cells turn off virgin but notmemory cells. Science 258, 1156–1159.
F, R., R, N. & G, R. S. (1995). X-linkedagammaglobulinemia and immunodeficiency with normal orelevated IgM: Immunodeficiencies of B cell development anddifferentiation. Adv. Immunol. 60, 37–56.
G, D., ML, I. C. M. & L, P. J. L. (1986). Virgin Bcell recruitment and the lifespan of memory clones duringantibody responses to 2,4-dinitrophenyl-hemocyanin. Eur. J.Immunol. 16, 641–648.
H, S., H, K., Z, B., K, T. B., H, R. &K, G. (1995). Cellular interactions in the germinal centers.Roles of CD40 ligand and B7-2 in established germinal centers.J. Immunol. 155, 556–567.
H, F., L, J., K, M. & ML, I. C. M. (1986).Distinct short-lived and long-lived antibody-producing cellpopulations. Eur. J. Immunol. 16, 1297–1301.
H, P. D., Y, L. C., C, R. L. & K,M. R. (1990). Separation of events mediating B cell proliferationand Ig production by using T cell membranes and lymphokines.J. Immunol. 145, 2025–2034.
I, K., W, M. D. & S, R. M. (1984). Clusteringof dendritic cells, helper T lymphocytes, and histocompatible Bcells during primary antibody responses in vitro. J. Exp. Med.160, 858–876.
I, K., M, J. P., C, M. T. & S, R. M.(1990). Dendritic cells pulsed with protein antigens in vitro canprime antigen-specific, MHC-restricted T cells in situ. J. Exp.Med. 172, 631–640.
J, J. & K, G. (1992). In situ studies of the primaryimmune response to (4-hydroxy-3-nitrophenyl)acetyl. II. Acommon clonal origin for periarteriolar lymphoid sheath-associ-ated foci and germinal centers. J. Exp. Med. 176, 679–687.
J, J., K, R. & K, G. (1991). In situ studies of theprimary immune response to (4-hydroxy-3-nitrophenyl)acetyl. I.The architecture and dynamics of responding cell populations.J. Exp. Med. 173, 1165–1175.

. . . 234
J, J., M, C. & K, G. (1992). In situ studies of theantigen-driven somatic hypermutation of immunoglobulin genes.Immunol. Cell Biol. 70, 145–152.
J, C. A. & T, P. (1994). Immunobiology. TheImmune System in Health and Disease. London: Current BiologyLtd.
J, N. K. (1973). The immune system. Sci. Amer. 229, 52–60.K, T., K, T., T, T. & N, H. (1994).
Mechanisms of T cell contact-dependent B cell activation.J. Immunol. 152, 2130–2138.
K, M. R. & H, P. D. (1993). Helper T cells: delivery ofcell contact and lymphokine-dependent signals to B cells. Sem.Immunol. 5, 393–400.
K, G. & Z, B. (1993). Sites of B cell activation in vivo.Curr. Opin. Immunol. 5, 418–422.
K, G. (1995). In situ studies of the germinal center reaction.Adv. Immunol. 60, 267–288.
K, F. G. M., W, A. S., S, H. G. & N,P. (1987). Germinal centers develop oligoclonally. Eur. J.Immunol. 17, 1069–1072.
K, H., M, C. R. F. & K, A. (1994). Small splenicB cells that bind to antigen-specific T helper (Th) cells and facethe site of cytokine production in Th cells selectively proliferate:immunofluorescence microscopic studies of Th-B antigen-pre-senting cell interactions. J. Exp. Med. 179, 1507–1515.
L, E. K., C, L. A., N, W. L., M, E. &P, S. K. (1988). Time dependence of B cell processing andpresentation of peptide and native protein antigens. J. Immunol.140, 3309–3314.
L, A. (1987). Antigen uptake and accumulation inantigen-specific B cells. Immunol. Rev. 99, 39–51.
L, O., V, O. & M, P. (1988). Can B cells turnon virgin T cells? Nature 334, 253–255.
L, Y. J., Z, J., L, P. J. L., C, E. Y.-T. & ML,I. C. M. (1991). Sites of specific B cell activation in primary andsecondary responses to T cell-dependent and T cell-independentantigens. Eur. J. Immunol. 21, 2951–2962.
ML, I. C. M. & G, D. (1986). Antigen-driven selectionof virgin and memory B cells. Immunol. Rev. 91, 61–85.
ML, I. C. M., L, Y. J., O, S., Z, J. & L,P. J. L. (1990). The evolution of B-cell clones. Curr. Top.Microbiol. Immunol. 159, 37–63.
ML, I. C. M. (1994). Germinal centers. Annu. Rev.Immunol. 12, 117–139.
M, C. R., G, K. H., F, W. C.,A, R., S, M. K. & S, T. A. (1993).Recombinant CD40 ligand stimulation of murine B cell growthand differentiation: cooperative effect of cytokines. Eur. J.Immunol. 23, 1044–1049.
M, P. (1994). Tolerance, danger and the extended family.Annu. Rev. Immunol. 12, 991–1045.
MH-W, M. G. & D, M. M. (1995). Antigen-specific development of primary and memory T cells in vivo.Science 268, 106–111.
M, F. & A, J. (1974). Secretion of immunoglobu-lins. In: Adv. Cytopharmacol., vol. 2 (Ceccarelli, B., Clementi, F.& Meldoiesi, J., eds) pp. 225–234. New York: Raven Press.
N, P. & K, F. J. (1974). Germinal centres andthe origin of the B-cell system. II. Germinal centres in the rabbitspleen and popliteal lymph nodes. Immunology 26, 509–519.
N, G. J. V. & A, G. L. (1971). Antigens, Lymphoid Cells,and the Immune Response. New York: Academic Press.
N, G. J. V., A, C. M., P, J. & M, J. (1966).Antigens in immunity. XII. Antigen trapping in the spleen. Int.Arch. Aller. Appl. Immunol. 29, 368–383.
N, G. J. V. (1962). Genetic control of lymphopoiesis, plasmacell formation and antibody production. Int. Rev. Exp. Pathol.1, 1–72.
P, R. & W, J. (1991). The unique role of the spleenand its compartments in lymphocyte migration. Res. Immunol.142, 339–342.
P, D. C. (1993). T cell-dependent B cell activation. Annu.Rev. Immunol. 11, 331–360.
P, A. S. & W, G. (1992). Modeling immunereactivity in secondary lymphoid organs. Bull. Math. Biol. 54,
649–672.P, A. S., M, M. & O, G. F. (1976). Optimal
strategies in immunology. I. B cell differentiation andproliferation. J. Math. Biol. 3, 325–367.
P, S., P, G., B, A. & C, A. (1983).Distinct helper activities control growth or maturation of Blymphocytes. Eur. J. Immunol. 13, 249–254.
R, N., I, K., P, E., C, M., W-P, M.& S, R. M. (1989). A small number of anti-CD3molecules on dendritic cells stimulate DNA synthesis in mouseT lymphocytes. J. Exp. Med. 169, 1153–1168.
R, F., G, E. & B, J. (1991). Cytokine-in-duced proliferation and immunoglobulin production of humanB lymphocytes triggered through their CD40 antigen. J. Exp.Med. 173, 705–710.
S, B., L, P., R, P., J, J. & K, D. (1994).Conditional ablation of dendritic cells in transgenic mice.J. Immunol. 152, 537–548.
S, D. F. & L, J. J. (1990). The relationship betweenantigen concentration, antigen internalization, and antigeniccomplexes: modeling insights into antigen processing andpresentation. J. Cell Biol. 111, 55–68.
S, K. A. (1984). Interleukin 2. Annu. Rev. Immunol. 2,
319–333.S, E. C. & N, R. J. (1993). The role of direct cellular
communication during the development of a humoral immuneresponse. Adv. Cancer Res. 62, 241–266.
S, R. M. (1991). The dendritic cell system and its role inimmunogenicity. Annu. Rev. Immunol. 9, 271–296.
T, W. J. K. & M, A. N. (1968). The life cycle ofantibody-forming cells. I. The generation time of 19S hemolyticplaque-forming cells during the primary and secondaryresponses. J. Exp. Med. 128, 895–925.
T, J. G., M, T. E. & M, G. A. (1979). Immuneretention: immunological requirements for maintaining an easilydegradable antigen in vivo. Australian J. Exp. Biol. Med. Sci. 57,
401–414.T, V. K., L, P. J. & T, G. J. (1992). The path
of memory B cell development. Immunol. Rev. 126, 113–141.V E, A. J. M., B, W. J. A. & C, E.
(1992). Immunological functions and in vivo cell–cell inter-actions of T cells in the spleen. Crit. Revs. Immunol. 11, 337–380.
V E, A. J. M., N, R. J., R, M., S,D. M., A, A., L, J. A. et al. (1993). In vivoCD40–gp39 interactions are essential for thymus-dependenthumoral immunity. I. In vivo expression of CD40 ligand,cytokines, and antibody production delineates sites of cognateT–B cell interactions. J. Exp. Med. 178, 1555–1565.
K, C., G, C., G, J.-P., H, P.,F, F., B, J. & B, D. (1994). B cellsregulate expression of CD40 ligand on activated T cells bylowering the mRNA level and through the release of solubleCD40. Eur. J. Immunol. 24, 786–792.
V, P. & R, K. (1988). The half-lives of serumimmunoglobulins in adult mice. Eur. J. Immunol. 18, 313–316.
B, H. & H, K. (1993). The life span of naivealpha/beta T cells in secondary lymphoid organs. J. Exp. Med.177, 891–896.
W, L. (1972). The Cells and Tissues of the Immune System.Structure, Functions, Interactions. Englewood Cliffs, N.J.:Prentice-Hall, Inc.
Y, M. J., S K., I, G., C, L. R. & L, J. J.(1994). CD40 molecules induce down-modulation and endocyto-sis of T cell surface T cell–B cell activating molecule/CD40-L.J. Immunol. 152, 598–608.
Z, B., X, W. & K, G. (1994). Locus-specific somatichypermutation in germinal centre T cells. Nature 372, 556–559.

235
APPENDIX
Parameter Values
The default parameter values used in the simu-lations are shown in Tables 1 and 2.
The influx of presenting dendritic cells into thespleen after intraperitoneal injection is largely overwithin a day after antigen injection (Crowley et al.,1990), therefore we computed the number of dendriticcells that participate in antigen presentation as afraction of the daily influx of dendritic cells into thespleen.
Steinman (1991) estimates that the proportion ofdendritic cells among splenocytes is 1%, which for anaverage of 108 spleen cells gives 106 dendritic cells. Theestimated turnover rate of splenic dendritic cells is0.15 day−1 (Salomon et al., 1994) and the resultingdaily input of dendritic cells in the spleen is 1.5×10⁵
cells day−1. Not all of these cells are likely to havevisited the peritoneal cavity, where the antigen wasinjected, so we assumed that only a fraction of themare effective in antigen presentation. We chose thisfraction to be 5%. Thus, we assume that the numberof dendritic cells exposed to antigen is 7.5×10³. Weassume that dendritic cells acquire the antigenaccording to a saturation function of the injected dose[eqn (1)]. With the saturation constant that we chose,KAg =10 mg and an antigen dose of 50 mg, as used byJacob et al. (1991), a focus will receive about 50presenting cells, provided that presenting dendriticcells distribute uniformly to the NF =125 splenic foci(Jacob et al., 1991).
We computed the initial number of T cells in afocus in a similar manner. The proportion of T cellsamong splenocytes is 30–50% (Weiss, 1972), whichfor population of 108 spleen cells gives a total of3–5×10⁷ T cells. If one in 104 to one in 105 are specificfor any given antigen, the spleen contains on theaverage 300–5000 T cells specific for the injectedantigen. Given a uniform distribution among the 125foci, each focus may potentially be started by 2–40 Tcells. This value probably underestimates T cellrepresentation, since antigen injection is known toinduce lymphocytes to concentrate at the drainingsite. We considered 30 T cells as the default initialcondition, and we also explored values of three and300 T cells.
Jacob et al. (1991) argued that a focus is originatedby one to three B cells, similar to germinal centers thatalso have been shown to develop oligoclonally(Kroese et al., 1987; Liu et al., 1991). Accordingly, weassumed that a focus is started on the average by threeB cells.
The available data concerning cell–cell interactionsin the immune system does not allow accurateestimation of in vivo binding and activation rates.Dendritic cell interaction with T cells has been studiedin vitro by Flechner et al. (1988). Clusters wereobserved after 8 hr at a T cell concentration of 3×10⁶
cells ml−1. At day 8, a splenic focus has an averagevolume of 5.7×105 mm3 (Jacob et al., 1991), whichfor a rate of complex formation of 3 day−1, gives abinding rate of T cells to dendritic cells bD =0.5(cells/focus)−1 day−1. Clusters formed by T cells withdendritic cells were stable for 3–4 days (Flechneret al., 1988), therefore we took the dissociation rate,b−D , to be 0.3 day−1. We assume that the activationrate of T cells by dendritic cells, aD , is 1 day−1, suchthat a dendritic cell, with NT =20 binding sites, willactivate 10–20 T cells per day.
The interaction between T cells and B cells involvesactivated T cells and presenting B cells. Althoughkinetic data about this type of interaction in vivo isunavailable, we considered the binding of anactivated T cell to a presenting B cell to be faster thanthe binding of a resting T cell to a dendritic cell site.It may be argued that a presenting B cell is not in aresting state anymore, since it has seen antigen.Therefore, we considered B-cell activation to occur ata higher rate than T-cell activation (see Table 1).
A study of antigen distribution after its injection inthe foot pad was performed by Tew et al. (1979). Weused that data to estimate the proportion of antigenthat reaches the spleen and obtained a value of 10−5.We assume that free antigen distributes uniformlyamong the foci, therefore one of the NF =125 focireceives 4×10⁻⁶ mg of antigen. Alternatively, if weassume that about half of the injected dose of antigenis homogeneously distributed in approximately 3 mlof extracellular fluid of a mouse, for a single focus,with a volume of 5.7×105 mm3, we obtained a similarestimate of the antigen load. Therefore, we set theinitial concentration of antigen per focusAg(0)=4×10⁻⁶ mg.
We used uB as the maximal rate at which B cellsacquire antigen presenting capacity. Lakey et al.(1988) reported an interval as short as 4 hr to besufficient for this process, therefore we considered themaximal rate, uB , to be 6 day−1. The maximal rate isexpected to be achieved for saturating antigenconcentrations. We reasoned that the concentrationof free antigen is in the saturation range in thebeginning of the response, and we set the value thatgives half-maximal rate, KB , to 5×10⁻⁷ mg/focus.
The differentiation rate of B cells into plasma cellsis difficult to estimate, since it is not a one-stepprocess. For the maximal rate, kd , we used a value

. . . 236
similar to the maximal proliferation rate, 1.5 day−1.Plasma cells migrate outside the focus and theyappear in the red pulp of the spleen around day 4post-immunization (Liu et al., 1991). Direct measure-ments of the migration rate are not available. Amigration rate of 4 day−1 was chosen in order to givea noticeable number of plasma cells outside the focusby day 4.
Antibody secretion rates of plasma cells in vivo havebeen estimated to range from 8000 to 20000
molecules per second (Conrad & Ingraham, 1974).Here we use 10000 molecules per second for a fullydifferentiated plasma cell. Plasmablasts and B blastsare less well differentiated and we assume they secrete1000 molecules per second and 100 molecules persecond, respectively.
The parameters governing cytokine dynamics andits interaction with B cells were chosen such that theresulting dynamics of the focus was similar to thatdescribed experimentally.