Exploring the Business Models behind Microsavings€¦ · Exploring the Business Models behind...
24
Exploring the Business Models behind Microsavings By Daniel Rozas Abstract The financial and business models for collecting savings by microfinance institutions have been relatively little explored in literature. This paper seeks to fill the gap by evaluating deposit-taking MFIs that rely on two primary types of savings: those that emphasize raising funding (through large deposit accounts) and those that emphasize service (through small deposit accounts). The findings suggest that geographic location, level of economic development, and regulatory environment all play an important role in dictating the types of models that are likely to be adopted. Different models also have substantially different funding and operating costs. Finally, net outreach levels in terms of number of savers served appear to be little affected by choice of model, though in many cases outreach may be skewed by widespread presence of empty accounts, which overstate the number of active depositors, and understate the average account balance.
Transcript of Exploring the Business Models behind Microsavings€¦ · Exploring the Business Models behind...

Exploring the Business Models behind Microsavings
By Daniel Rozas
AbstractThe financial and business models for collecting savings by microfinance institutions have been
relatively little explored in literature. This paper seeks to fill the gap by evaluating deposit-taking
MFIs that rely on two primary types of savings: those that emphasize raising funding (through large
deposit accounts) and those that emphasize service (through small deposit accounts). The findings
suggest that geographic location, level of economic development, and regulatory environment
all play an important role in dictating the types of models that are likely to be adopted. Different
models also have substantially different funding and operating costs. Finally, net outreach levels in
terms of number of savers served appear to be little affected by choice of model, though in many
cases outreach may be skewed by widespread presence of empty accounts, which overstate the
number of active depositors, and understate the average account balance.

2 FAI Exploring the Business Models behind Microsavings
Table of Contents
Forward 3
Introduction 3
Funding or Service? 5
Exploring the Models 7
Environmental Factors 7
Institutional Factors 9
Model Outcomes 14
Effectiveness in Raising Deposits 14
Outcomes in Outreach 14
Financial Returns 17
Conclusion 18
Appendix 1: The Mix Market Savings Dataset 19
Appendix 2: Methodology 20
Images and Case Studies
FIGURE 1: Savings Balances by Account Type 4
TABLE 1: Summary of Deposit Model Features 6
FIGURE 2: Prevalance of Savings Model by Region 8
FIGURE 3: Average Country GNI, Per Capita, by Deposit Model 8
FIGURE 4: Prevalance of Microsavings Model by Market Context 9
FIGURE 5: Prevalance of Microsavings Model by Legal Structure 10
FIGURE 6: Microsavings Model by Asset Size 11
FIGURE 7: Expenses, by Model (% of median assets) 11
Case Study: Customary Village Banks (LPDs) in Bali 12
Case Study: Tanzania Postal Bank 13
FIGURE 8: Deposits / Loan Portfolio, by Model 14
FIGURE 9: Depositors, by Model 15
FIGURE 10: Median Account Size 15
Case Study: BancoSol 16
FIGURE 11: Summary of Financial Outcomes by Model 17
FIGURE A-1: Distribution of Institional Characteristics in the MIX Dataset 20
FIGURE A-2: Dominant Accounts Contribute a Large Majority Share of Deposits 21
Figure A-3: Comparison of Deposit and Loan Sizes 22

Rozas FAI3
Forward Since the microfinance sector executed its pivot from “poverty alleviation” to “financial inclusion,” savings have gained greater prominence. And why not? By now, it’s a well-accepted and well-documented fact—the poor need dependable savings services as much or more as they need credit. But how is the industry, whose roots are after all in microcredit, doing on providing these services?
This paper grew out of a simple idea: when it comes to microsavings, objects in mirror may be larger than they appear. I first saw the image some years back, when scanning a paper by Felipe Portocarrero. On Table 6, there was a stratification list of all MFI deposit accounts in Bolivia, from 2003. Back then, Bolivian MFIs had 185,000 savings accounts. Of these, 160,000 accounts below $500 accounted for only 3% of total deposits. Just 671 accounts above $50,000 accounted for over 50% of deposits. And the average balance on all these accounts? $1,200. Yes, averages can be misleading.
Savings accounts from MFIs are really a tale of two cities. One city teems with small accounts, reaching many customers, but raising little in terms of actual funding. In this city, the poor seem to borrow far more than they save. The other is a city of social intermediation, with a handful of wealthy depositors providing funding to on-lend to the poor, and receiving tidy interest rates in return. Some cities are metropolises combining both versions. Others buck the trend altogether, where the poor, or at least the near-poor, save moderate amounts that do add up to something substantial.
To this tale, one must add an important wrinkle—many accounts aren’t just small, but sit altogether empty, often idle. A look at a diverse group of institutions suggests that upwards of 50% of accounts fall into that category, which mixes up our cities further still.1 All told, the story of financial inclusion via savings is more complicated than aggregate figures suggest.
This paper seeks to untangle some of these
complications. How might one define the different models by which MFIs provide savings? How are they distinguished, where are they more prevalent, and which institutions are more likely to adopt them? And is there a difference in outcomes—in terms of cost, outreach, and profit? The answers are preliminary, but they do raise important questions.
Yes, many of the larger MFIs, including those in Bolivia and throughout much of Latin America, still rely heavily on large savings balances, though they also have greater outreach among the poor and near-poor than was the case a decade ago. Meanwhile, MFIs in Africa and parts of Asia inhabit a different city, raising most of their funding from small savers, though most of those MFIs are themselves small. Many are credit unions.
But perhaps the bigger story is that the tale is difficult to tell with existing data. The outreach numbers are only estimates, extrapolated from data that isn’t meant to be unbundled or disaggregated. Thus, this is only a start. If we are to avoid building up another story that we can’t back up with facts, we need to change how deposits data is publicly reported. Otherwise, what we show will still be seen through that mirror, where savings may be larger than they appear, and real outreach remains beyond reach.
IntroductionThe expansion of financial access via savings has been a major focus area for the microfinance sector over the past several years. As of 2012, MFIs reporting to MIX Market raised $56 billion in deposits, serving 71 million depositors.2 For every 100 borrowers, there are now 75 depositors. These figures are often cited as evidence of the industry succeeding in meeting its objective to expand and broaden financial access. Indeed, they are downright impressive for an industry whose modern roots are, after all, in credit.
4 FAI Exploring the Business Models behind Microsavings
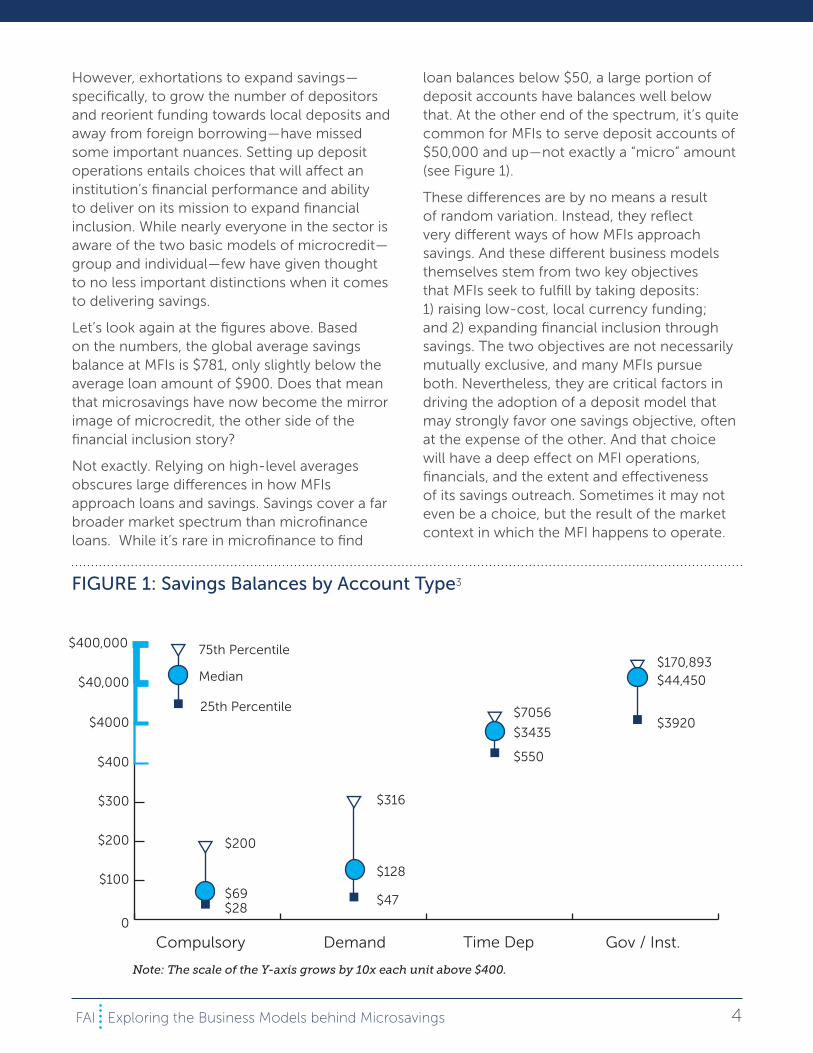
However, exhortations to expand savings— specifically, to grow the number of depositors and reorient funding towards local deposits and away from foreign borrowing—have missed some important nuances. Setting up deposit operations entails choices that will affect an institution’s financial performance and ability to deliver on its mission to expand financial inclusion. While nearly everyone in the sector is aware of the two basic models of microcredit—group and individual—few have given thought to no less important distinctions when it comes to delivering savings.
Let’s look again at the figures above. Based on the numbers, the global average savings balance at MFIs is $781, only slightly below the average loan amount of $900. Does that mean that microsavings have now become the mirror image of microcredit, the other side of the financial inclusion story?
Not exactly. Relying on high-level averages obscures large differences in how MFIs approach loans and savings. Savings cover a far broader market spectrum than microfinance loans. While it’s rare in microfinance to find
loan balances below $50, a large portion of deposit accounts have balances well below that. At the other end of the spectrum, it’s quite common for MFIs to serve deposit accounts of $50,000 and up—not exactly a “micro” amount (see Figure 1).
These differences are by no means a result of random variation. Instead, they reflect very different ways of how MFIs approach savings. And these different business models themselves stem from two key objectives that MFIs seek to fulfill by taking deposits: 1) raising low-cost, local currency funding; and 2) expanding financial inclusion through savings. The two objectives are not necessarily mutually exclusive, and many MFIs pursue both. Nevertheless, they are critical factors in driving the adoption of a deposit model that may strongly favor one savings objective, often at the expense of the other. And that choice will have a deep effect on MFI operations, financials, and the extent and effectiveness of its savings outreach. Sometimes it may not even be a choice, but the result of the market context in which the MFI happens to operate.
0
$100
$200
$300
$400
$40,000
$400,000
$4000
Compulsory Demand Time Dep Gov / Inst.
25th Percentile
75th Percentile
Median
$69$28
$200
$128
$316
$47
$3435
$7056
$550
$44,450
$3920
$170,893
Note: The scale of the Y-axis grows by 10x each unit above $400.
FIGURE 1: Savings Balances by Account Type3

Rozas FAI5
Understanding the implications of both environmental factors and institutional choices that lead an MFI to adopt one or another type of deposit model should be a high on the agenda for those in the sector—whether practitioners, investors, or government officials —as they seek to increase microfinance savings. We hope that this paper will help highlight those choices.
Funding or Service?Let’s say an MFI is looking for a channel that will provide relatively cheap, local currency funding, or it simply wants to diversify its funding sources. The last few hundred years of banking experience suggest that deposits are a great way to get there. However, managing deposits can be expensive, requiring beefing up operations and hiring more staff to meet needs that are very different from lending.It also comes with a whole new set of risks, including liquidity and asset-liability matching, and greater regulatory and compliance burdens that governments—appropriately—impose on deposit-taking institutions.
But what if an MFI could raise deposits from a relatively small number of wealthy or institutional depositors, placing their funds for fixed time periods (a.k.a. time deposits)? That would dramatically lower the complexity and cost of deposit operations, since handling a few hundred or even few thousand time deposits is something altogether different from servicing half a million demand deposit accounts. All that’s required is to convince those wealthy depositors to place their money with the MFI—maybe not such a difficult proposition for a stable, profitable institution that can offer interest rates well above those of competing banks. Since the sole purpose of targeting such wealthy clients is to provide funding, we call this the funding deposits model.
Of course, targeting institutions and wealthy individuals won’t help an MFI that wants to use deposits as a way to deepen its client relationships. Such institutions must raise
deposits from their existing clients or others with similar income levels, which usually means serving large numbers of demand deposit accounts. That brings with it the complexity of managing complex operations, but then such deposits need not offer high interest rates and could even use various savings-related fees and cross-selling to recoup some of the added operational expense.4 And for some MFIs, deposits may comprise an intrinsic part of their lending operations, often in the form of compulsory savings accounts. These are examples of the service deposits model, in which MFIs gather savings from their own borrowers or a similar target population.
These two models—funding deposits and service deposits—form the foundation for our analysis. But because of how savings are reported to the MIX Market, we have the opportunity to break them down further by disaggregating the data by account type (for more detail, see Appendix II):
» Compulsory Deposit (a.k.a. forced savings): usually a feature of microcredit that requires the posting of cash collateral. The accounts may be built up via a series of fixed payments, as a precursor to loan disbursement and must be maintained during the life of the loan. In other cases, cash collateral is posted upfront, often by deducting a portion of the loan proceeds. It is also common for clients to use these compulsory accounts to set aside additional savings, beyond what is required.
» Demand Deposit (a.k.a. Checking Account, Current Account, Savings Account, Passbook Savings): accounts that allow withdrawals at any time, including both transactional accounts and savings accounts, which may have limits on withdrawal frequency but not the amount.
» Time Deposit (a.k.a. Certificate of Deposit, Term Deposit, or Fixed Deposit): an account with a fixed sum and fixed maturity; early withdrawals may be possible by paying a penalty.

6 FAI Exploring the Business Models behind Microsavings
» Government and Institutional Accounts: These aren’t separated by type of account, but by the type of customer: corporate, government, and financial institutions, which we’ve consolidated into a single category for the purposes of this analysis. Note that in MIX, these institutional accounts are counted separately from the three categories above (i.e. no overlap).
We use these account types to define the MFI deposits sub-models, and because they are so closely linked to either the service or funding models, they form the basis of our subsequent analysis, summarized in Table 1.
It’s clear from even this brief summary that there are important environmental and institutional variables that support different savings models. And in turn, those models
shape the MFIs, be it the level of staffing and consequent operating expenses required to support broad-based deposit collection, or the high interest rates and consequent financial expenses required to attract large deposits.
However, what is perhaps most intriguing is that while the approaches differ substantially, the outcomes don’t vary nearly as much. One expects service deposit model MFIs (large number of small savers) to have higher depositor outreach than those applying the funding model (small number of large savers). Yet this is not the case. It is rare for funding-model MFIs to focus exclusively on large depositors; most take a mixed approach, relying on large deposits for the bulk of their funding, while using small deposits to broaden the array of financial services to their core customers.
Compulsory Demand Dep Time Dep
SA
1,207
Low
NGO
10.3
12.4%
4.5%
43%
37,322
2.8%
CARD Bank,
BRAC, LAPO,
KWFT
SSA
2000
Low
COOP
8.5
14.1%
3.2%
77%
21,045
1.3%
SEWA Bank,
K-Rep,
PRODEM
ECA
5,226
Low
COOP
6.8
9.8%
5.4%
83%
19,841
1.4%
XacBank,
Equity Bank,
BASIX (KBS)
ECA / LAC
3,667
Moderate
NBFI
61.7
11.2%
6.4%
80%
30,705
2.4%
Access Bank,
Banco
Solidario
LAC
3,001
High
Bank
147.9
10.0%
3.5%
79%
46,882
2.1%
EcoFuturo,
BancoSol,
Khan Bank
Time Dep Gov & Inst.
Funding Deposit Model
Environmental factors Dominant region
Per capita income (avg)
Market development
Institutional factors Dominant legal structure
Minimum assets
Operating expense
Financial expense
Outcomes Deposits / Loan portfolio
Number of depositors*
ROA
Examples
Service Delivery Model
TABLE 1: Summary of Deposit Model Features
*Numbers may be distorted due to dormant or little-used accounts.

Rozas FAI7
And because large deposit model MFIs also tend to be larger institutions, the consequent outreach would likewise be greater.
The framework laid out in this paper is just a start, and in some cases—particularly in the analysis of outreach—it suffers from the widespread problem of dormancy. Despite the skewed numbers, the model helps analyze the options available to MFIs seeking to offer savings or reevaluate existing savings programs.
The paper is structured in two parts. Part one explores the two dimensions that influence the availability of these options: the context in which the MFI operates (geographic location, level of economic development, and the regulatory and institutional environment), and the institution’s structure, including legal status and size, as well as the cost structure of its operations. Part two explores the outcomes that the institution is likely to experience as a result of its choices: deposits raised, number of people reached, and overall institutional profitability. We also include a few case studies that exemplify different savings models.
Exploring the ModelsWe take a closer look at how the models differ when viewed through the lens of two key factors: Environmental and Institutional.
Environmental Factors
Microfinance deposits models appear to be byproducts of their environments. There is a strong and readily apparent regional distribution, only some of it explained by the level of economic development, structure of human capital, and the legal/regulatory environment. A significant part of the explanation likely lies in the evolution of financial institutions and their antecedents.
Geography
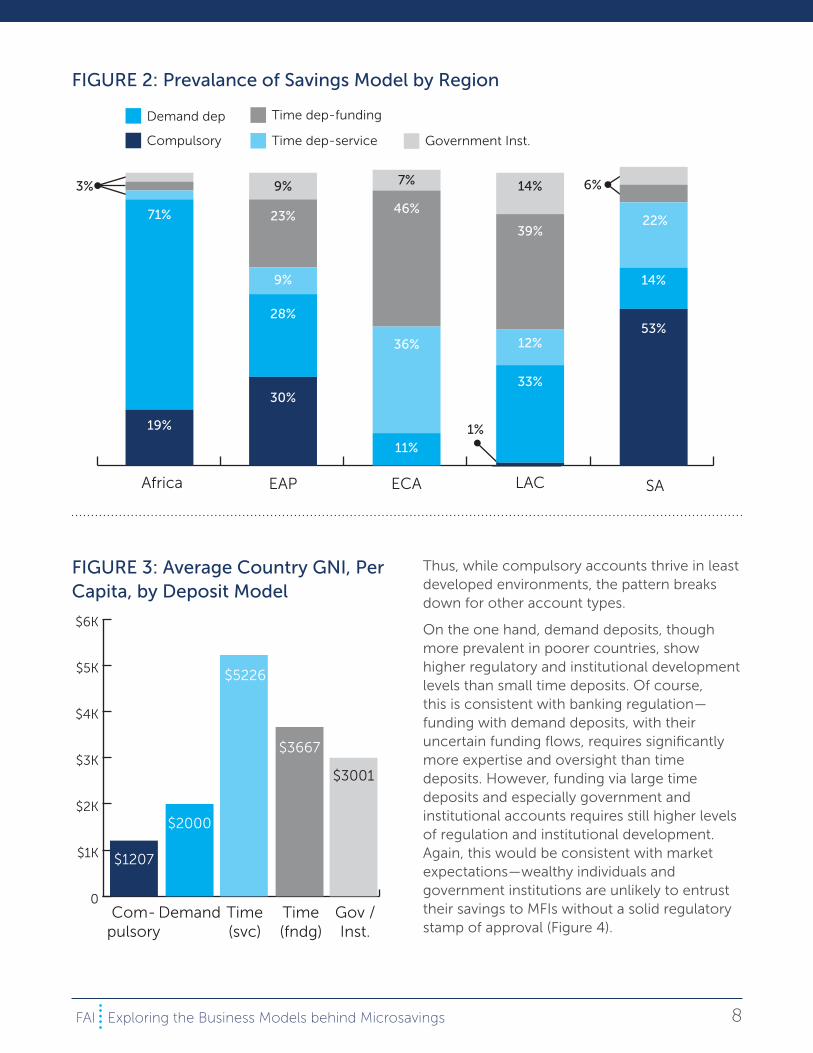
Every region has at least one occurrence of each deposit submodel (Figure 2). The sole exception to this is the ECA region, which does
not have a single instance of a compulsory-model MFIs in the MIX dataset. Despite this broad representation, the distributions are vastly different across the regions.
Sub-Saharan Africa is almost entirely dominated by service deposit model MFIs (19% compulsory and 71% demand deposits). A similar picture is present in South Asia, though the compulsory account model is nearly three times more common there than in Africa.
On the other hand, MFIs in ECA and LAC are more likely to seek funding from large deposits than small ones. At the same time, these two markets feature almost no institutions that rely on compulsory accounts as a significant source of funding. Also interesting is the widespread use of time deposits (both as service and funding models) in ECA and to a lesser extent LAC, yet this type of account is dominant in very few African MFIs.
The picture is not just regional. There’s a strong association with the relative wealth of the country (see Figure 3 on page 8).
As expected, MFIs that rely on compulsory deposits operate in the poorest countries. Perhaps less expected is the location of MFIs relying on time deposits: those categorized under the service model are more likely to be in substantially wealthier countries than those using the funding model. A possible explanation is that in wealthier countries, lower and middle income households are more likely to have excess funds to set aside in a time deposit account. While their counterparts in poorer economies might also be active savers, they may be too financially vulnerable to park significant funds for a fixed period of time. Thus, in poor countries, time deposits are left primarily as the domain of the wealthy.
Regulatory and Financial Sector Development
Beyond geography and country wealth, there’s also the element of regulation and sector-level development. Looked at through this lens, the models tell a somewhat different story than national income figures alone would suggest.
8 FAI Exploring the Business Models behind Microsavings
Thus, while compulsory accounts thrive in least developed environments, the pattern breaks down for other account types.
On the one hand, demand deposits, though more prevalent in poorer countries, show higher regulatory and institutional development levels than small time deposits. Of course, this is consistent with banking regulation—funding with demand deposits, with their uncertain funding flows, requires significantly more expertise and oversight than time deposits. However, funding via large time deposits and especially government and institutional accounts requires still higher levels of regulation and institutional development. Again, this would be consistent with market expectations—wealthy individuals and government institutions are unlikely to entrust their savings to MFIs without a solid regulatory stamp of approval (Figure 4).
3%
Africa LAC SAEAP ECA
19%
71%
30%
28%
23%
9%
9%
11%
36%
46%
7%
1%
33%
12%
39%
14%
53%
14%
22%
6%
Government Inst.
Time dep-funding
Time dep-service
Demand dep
Compulsory
FIGURE 2: Prevalance of Savings Model by Region
0
$1K
$2K
$3K
$4K
$5K
$6K
Com-pulsory
Demand Time(svc)
Time(fndg)
Gov /Inst.
$1207
$2000
$5226
$3667
$3001
FIGURE 3: Average Country GNI, Per Capita, by Deposit Model

Rozas FAI9
Institutional Factors
While the external environment exerts great influence on which deposit models are chosen by MFIs and which can flourish, much still remains within the control of the MFI itself. Compulsory accounts may dominate in the poorest countries with the least developed markets, yet even a middle income market like Mexico has MFIs using this model. At the other extreme, reliance on large deposits from wealthy or institutional clients is generally a feature of wealthier countries with mature financial markets, yet even Madagascar has two such MFIs, despite a substantially underdeveloped market. MFIs cannot affect the macroeconomic and regulatory conditions under which they operate, but the choice of deposit models remains largely in their hands.
Legal Structure
One of the first such choices is the legal structure under which the MFI decides to be
organized (see Figure 5 on page 10). It’s not surprising that NGOs, which in most countries are prohibited from collecting official deposits, are most likely to rely on compulsory accounts (67%). Cooperatives are most likely to rely on demand and small-time deposits (53% and 21%, respectively). NBFIs are more likely to rely on time deposits (large and small) than any other account type, given that many are prohibited from providing more complex savings accounts. Finally, rural and commercial banks show the most equal distribution of savings models; the latter has the largest share from government and institutional accounts (20%).
One of the interesting aspects of viewing deposits models through the legal structure lens is the difference in the client-centricity of cooperatives compared to other providers. They are the least likely to rely on compulsory deposits (5%), lower even than banks (7%). Cooperatives are also nearly four times as likely to employ the service model than the funding model, in sharp contrast to all other non-NGO
Regulatory Framework Institutional Development Investment Climate
Government Inst.
Time dep-funding
Time dep-service
Demand dep
Compulsory
53
59
51
67
73
39
4744
52
64
41 4044
46 46
FIGURE 4: Prevalance of Microsavings Model by Market Context

10 FAI Exploring the Business Models behind Microsavings
legal structures, where the split between the models is relatively even.
We see this in action among the community-based banking structures in Bali’s LPDs, which are in many ways reminiscent of credit cooperatives (see Case Study, Page 13).
Institution Size
As with legal structure, deposit models appear to thrive in certain size categories. The vast majority of service model MFIs have total assets of less than $50 million. Meanwhile, institutions at $50 million or above are dominated by funding-model MFIs (Figure 6).
Simply put, raising funds from a broad base of small savers is hard. For example, BancoSol is able to raise more than $400 million in deposits by tapping some 8,000 accounts averaging $50,000. At the same time, its portfolio of nearly 600,000 depositors raises less than $200 million, so that the bank ends up leaning heavily on the largest accounts for its funding.
Nevertheless, the small coterie of very large MFIs whose deposits consist mainly of compulsory or demand deposit accounts suggest that attaining such size is possible by focusing on small accounts. Crédit Mutuel du
Sénégal, a $260 million cooperative, raises $113 million from nearly 350,000 demand deposit accounts that average $330, supplemented with another $39 million in time deposits averaging $1400 per account. The $240 million NBFI Kenya Women’s Finance Trust, reports over 440,000 compulsory deposit accounts averaging $160—thus raising $71 million, or nearly half of its loan portfolio. And just because these accounts are denoted as compulsory, it’s very unlikely that clients are actually forced to set aside nearly half of their loan proceeds in compulsory accounts. Instead, this reflects a practice commonly heard from NGO MFIs, whose clients use the apparent convenience of compulsory accounts to set aside savings far in excess of what is required by the terms of their loans.
One also finds financial institutions outside the traditional microfinance domain raising substantial deposits from small accounts. This is the example of Tanzania Postal Bank, which raises $57 million (2/3rds of its total deposits) from 330,000 demand accounts averaging $175 (see Case Study, Page 12). While the relative rarity of such institutions suggests that scaling up service models may be difficult, it is not impossible.
7%
2%
5%
2%
NGO CU / COOP NBFI Rural Bank Bank
67%
21%
9%
53%
21%
20%
15%
26%
8%
38%
12%
24%
24%
24%
12%
15%
36%
11%
25%
20%
Government Inst.
Time dep-funding
Time dep-service
Demand dep
Compulsory
FIGURE 5: Prevalance of Microsavings Model by Legal Structure

Rozas FAI11
Operating and Financial Costs
Pursuing different savings models entails significant choices in setting up operations. Generally speaking, running a service deposit model entails higher operating expenses, while a funding deposit model entails greater financial expense (see Figure 7). If managing a large number of accounts requires more staff, attracting large deposits usually requires offering high interest rates. As the average size of deposits rises, the cost of attracting them increases, so that the decline in operating expense is offset by the increase in financial expense. The total cost is thus largely unchanged, regardless of the deposit model.
This trend is best epitomized by comparing the two largest groups: demand deposit MFIs with those relying on large time deposits (funding model). The former have the lowest financial expense ratios (3.2%), but have the highest operating expenses (14.1%). Meanwhile the latter incur the highest financial expense (6.4%), but report much lower operating expenses (11.2%). Despite these differences, their total expense is essentially identical (17.2% vs 17.5%).
The biggest exception to this trend is at the extreme of the model—Government &
4%2%
<2million 2-10 million 10-50 million 50-200 million >200 million
32%
38%
13%
15%
18%
44%
23%
11%
28%
39%
9%
18%
6%
14%
24%
8%
41%
12%
6%
12%
12%
41%
29%
Government Inst.
Time dep-funding
Time dep-service
Demand dep
Compulsory
FIGURE 6: Microsavings Model by Asset Size
Compul-sory
Demand Time(svc)
Time(fndg)
Gov /Inst.
12.4%
14.1%
9.8%
3.2%4.5%
16.9%17.2%
5.4%
15.3%
11.2%
6.4%
17.5%
10%
3.5%
13.5%
Financial Exp Operating Exp Total
FIGURE 7: Expenses, by Model (% of median assets)5
12 FAI Exploring the Business Models behind Microsavings
Case Study: Customary Village Banks (LPDs) in Bali
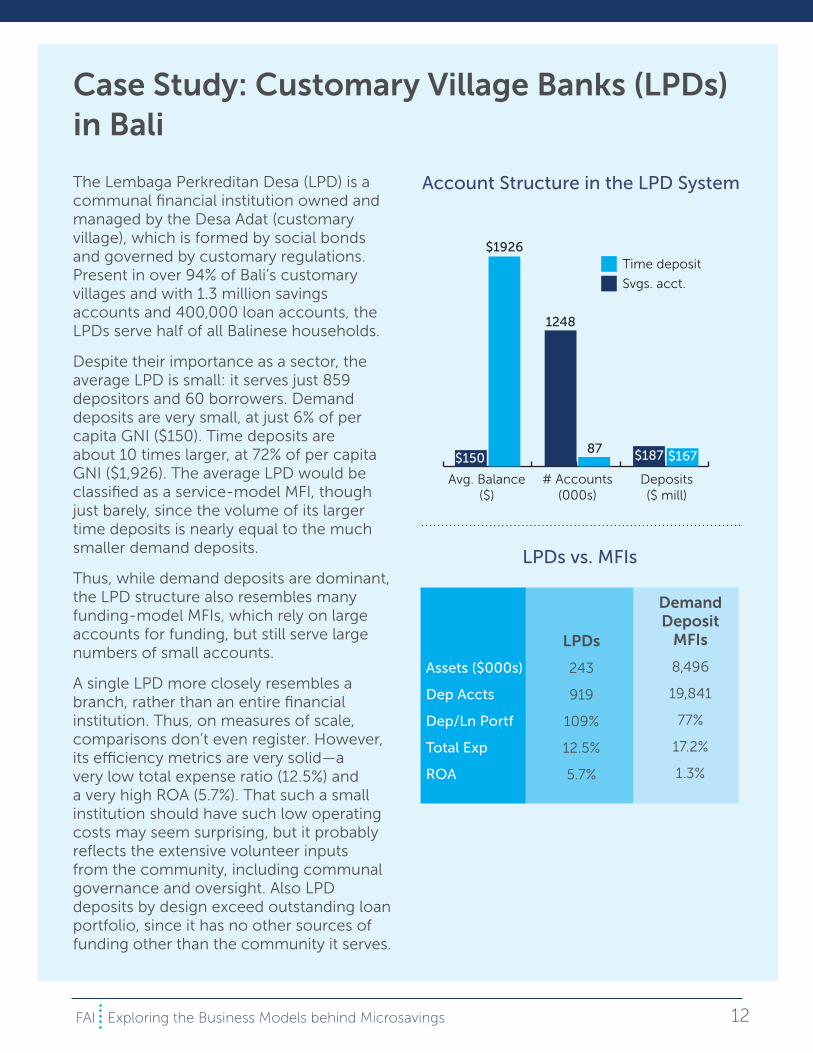
The Lembaga Perkreditan Desa (LPD) is a communal financial institution owned and managed by the Desa Adat (customary village), which is formed by social bonds and governed by customary regulations. Present in over 94% of Bali’s customary villages and with 1.3 million savings accounts and 400,000 loan accounts, the LPDs serve half of all Balinese households.
Despite their importance as a sector, the average LPD is small: it serves just 859 depositors and 60 borrowers. Demand deposits are very small, at just 6% of per capita GNI ($150). Time deposits are about 10 times larger, at 72% of per capita GNI ($1,926). The average LPD would be classified as a service-model MFI, though just barely, since the volume of its larger time deposits is nearly equal to the much smaller demand deposits.
Thus, while demand deposits are dominant, the LPD structure also resembles many funding-model MFIs, which rely on large accounts for funding, but still serve large numbers of small accounts.
A single LPD more closely resembles a branch, rather than an entire financial institution. Thus, on measures of scale, comparisons don’t even register. However, its efficiency metrics are very solid—a very low total expense ratio (12.5%) and a very high ROA (5.7%). That such a small institution should have such low operating costs may seem surprising, but it probably reflects the extensive volunteer inputs from the community, including communal governance and oversight. Also LPD deposits by design exceed outstanding loan portfolio, since it has no other sources of funding other than the community it serves.
DemandDeposit
MFIs
8,496
19,841
77%
17.2%
1.3%
LPDs
243
919
109%
12.5%
5.7%
Assets ($000s)
Dep Accts
Dep/Ln Portf
Total Exp
ROA
LPDs vs. MFIs
Avg. Balance($)
# Accounts(000s)
Deposits($ mill)
$150 $187 $167
$1926
1248
87
Time deposit
Svgs. acct.
Account Structure in the LPD System

Rozas FAI13
Tanzania Postal Bank (TPB) is an NBFI established with the mission of promoting a savings culture in the country. It is a government-owned institution, separate from Tanzania Post, but has agreements with the latter to leverage the postal branch network to provide its services, in addition to its own branches.
The bulk of TPB’s deposits are raised through its Quick Account, a type of demand deposit account, with 328,000 accounts and an average balance $175. By our methodology, TPB would thus be classified as a service model institution, with demand deposits as its dominant account. However, its total 693,000 deposit accounts and assets of $100 million place well above most demand deposit MFIs.
TPB’s performance metrics are likewise stronger than its peer group. Its deposits are well in excess of its loan portfolio, and its ROA well above that of most demand deposit MFIs. Interestingly, its operating expense is slightly higher than the peer group, but financial expense is much lower—perhaps because its deposits cover all of its funding needs, TPB requires no significant borrowing.
DemandDeposit
MFIs
8
20
77%
14.1%
3.2%
1.3%
TanzaniaPostal Bank
100
693
158%
14.4%
1.3%
2.0%
Assets ($mills)
Dep Accts (000s)
Dep/Ln Portf
Op Exp
FinEx
ROA
Tanzania Postal Bank vs. MFIs
80
67%
47%
40%
6%
12%6%
9% 1%10%
0%
$175
$18$66
$1658
$5771
% of deposits % of accounts Avg. balance
Quick Acct(Demand)
Saving Acct(Demand)
WADU(Cmmt. Svgs)
Fixed Deposit(Time Dep)
Call Acct.(Gov & Inst.)
Case Study: Tanzania Postal Bank
Desposits at Tanzania Postal Bank

14 FAI Exploring the Business Models behind Microsavings
Institutional deposit MFIs, which features the lowest total costs (13.5%), with both low operating costs and low financial expenses. This is probably because such institutional depositors are attracted by things other than high interest rates: sometimes, these MFIs attract local pension funds and similar depositors by taking advantage of laws that require them to invest a part of their assets in socially responsible vehicles (this was exactly the case with one Latin American NBFI in our study). However, this model also features the largest MFIs that are also most likely to be banks (see Figure 5, again), so the lower financial expense may also reflect less need to offer high interest rates to compensate depositors for perceived institutional risk compared to non-microfinance banks.
Model OutcomesWhile it can be useful to recognize the potential causative factors that drive different savings models, ultimately the types of outcomes these models are likely to generate matter more. We examine these from three different perspectives: effectiveness in raising deposits, outreach to financially excluded groups, and impact on financial returns.
Effectiveness in Raising Deposits
Among the different possible outcomes, one that shows relatively little variation is the actual amount of deposits raised. The median MFI is able to fund about 80% of its loan portfolio via deposits, and those at the upper quartile approach or even slightly exceed 100%. The sole exception to this are MFIs funded via compulsory deposits, most of which are limited to funding 30-55% of their portfolio, even after including additional (non-compulsory) accounts (see Figure 8). While that is a strong indication that compulsory accounts are used by clients for voluntary savings, it nevertheless highlights the substantial limitations of such unofficial deposit-taking techniques.
Outcomes in Outreach
By “outreach,” we are referring to the poor, near-poor, or otherwise financially excluded. Wealthy clients bypassing lower-yielding bank offers and going to an MFI to deposit a sum 10 times the country’s per capita GNI would not fit the bill. One could be forgiven for assuming that funding-model MFIs relying on exactly these types of depositors would have lower outreach numbers than MFIs that tap the poor to raise deposits, yet this is not the case.
As it turns out, there is little relationship between the MFI’s chosen deposit model and its outreach numbers (Figure 9). If anything, the MFIs that depend on the largest deposits—government and institution accounts—also have the largest outreach numbers. How can this be? Part of this is certainly due to institution size, since these MFIs also comprise the largest institutions (see Figure 6 again). However,
0
20
40
60
80
100
Compul-sory
Demand Time(svc)
Time(fndg)
Gov /Inst.
43% 77% 83% 80% 79%
Median
25th percentile
75th percentile
FIGURE 8: Deposits / Loan Portfolio, by Model

Rozas FAI15
it’s worth recalling that the deposit models throughout this paper are defined by dominant account types, that is, those accounts that contribute the largest share of deposits. And this definition says nothing about the number of depositors served.
Institutions with funding-deposit models simultaneously provide savings products targeted at low-income customers, whose small accounts greatly outnumber those that contribute the bulk of funding. Indeed, for funding deposit model MFIs, the average balances of these other accounts (usually demand or compulsory deposits) look remarkably similar to the dominant accounts of service model institutions (Figure 10) and would meet the standard for a service model account, were it to be applied (see Appendix 2 for detailed definition). For example, BancoSol raises most of its funding from 8,000 accounts averaging $50,000, while simultaneously serving nearly 600,000 depositors.
This finding needs an important caveat—as demonstrated by the case of BancoSol, many small deposit accounts of funding model MFIs
0
20K
40K
60K
80K
100K
37K 21K 20K 31K 47K
Compul-sory
Demand Time(svc)
Time(fndg)
Gov /Inst.
Median
25th percentile
75th percentile
FIGURE 9: Depositors, by Model
$100
$1K
$10K
$100K
Compulsory Demand Time(svc)
Time(fndg)
Gov / Inst.
$37 $46
$141
$491$679
$57
$6218
$183
$59K
$293
Dominant Accounts
Other Accounts
FIGURE 10: Median Account Size7

16 FAI Exploring the Business Models behind Microsavings
Case Study: BancoSol8
In the field of microfinance, BancoSol is a trailblazer. When its founding NGO, PRODEM, spun off a part of its operations into a commercial bank named BancoSol in 1992, it charted a path that hundreds of MFIs would follow in the subsequent two decades.
The bank is a classic example of a funding model MFI, reporting nearly 600,000 total savings accounts, just over 8,000 of which account for nearly 70% of total deposits raised. These time deposit accounts average balances of over $50,000 or some 30 times per capita GNI, meaning that they are well out of the reach of BancoSol micro-entrepreneur clients. However, BancoSol’s 575,000 demand deposit accounts average just $331, or about 1/10th of its average loan amount ($3,021). It’s an impressive outreach figure, nearly three times greater than its total number of borrowers.
Unfortunately, that figure is also deeply misleading. Using more detailed data, we find that over 60% of accounts are empty, while the average balance of non-empty accounts is around $800. As with other Bolivian MFIs, where some 75% of deposit accounts are empty, Bancosol’s figures reflect in part legal obstacles to closing inactive accounts, and in part clients using those accounts as vehicles to receive government payments and remittances.
And though the presence of empty accounts changes the level and nature of the outreach, it doesn’t change the fact that Bancosol has over 80,000 accounts with balances between $50-$2,000. These accounts suggest perhaps less spectacular, though nevertheless serious outreach to BancoSol’s main client base, even if they raise relatively little in the way of funding. Clearly, BancoSol’s reliance on large
deposits for funding does not preclude simultaneously providing savings services to the poor and near-poor.
TimeDeposit
$428
8
$51,588
DemandDeposit
$190
576
$331
Deposits ($ mills)
Number of
Accts (000s)
Avg. Balance
BancoSol Demand Deposit vs. Time Deposit
0-10 11-50 51-500 500-2K 2K-5K 5K-10K 10K-100K >100KOutstanding Balance ($)
348K
125.5K
55.7K
25.7K11.9K 5.1K
Number ofAccounts
3.5K 62
Reported Data
Extrapolated Data
Distribution of BancoSol Demand Deposit Accts. (by outstanding balance)

Rozas FAI17
may be either dormant or have negligible balances, which may overstate actual outreach, while skewing average balances downward. And BancoSol is not an exception—its deposit distribution patterns closely mirror those reported in an earlier study of Latin American MFIs in 2006 (see Case Study, Page 16).6 Meanwhile, another Latin American NBFI that relies mainly on government and institutional accounts for funding, reported to us that 65% of its accounts are dormant.
It is also possible that some of the institutions classified as service model MFIs may likewise have a similar dormancy issue and thus should properly be classified under the funding model instead. This is unlikely in the case of compulsory accounts, which would be hard-pressed to attract large depositors, but certainly it is quite possible for both demand and small time deposits. What this suggests is that for both service and funding model MFIs, some data on account stratification is needed to
properly assess the actual level of outreach. Otherwise, one is left to draw conclusions that may prove deeply misleading.
Financial Returns
Finally, the impact on the financial bottom line —do different deposit models affect financial returns? It turns out there is significant impact —the median return on assets (ROA) is around 2.5%, but the figure for demand- and service- time deposit MFIs is a full 1% lower than others (Figure 11). The lower returns of the latter two service model MFIs may well be the result of taking on the relatively complex operations involved in managing small deposits, especially in the case of demand deposits, while doing so without the benefits of scale economies (see Figure 9 again).
Another common question facing deposit-taking MFIs is how much benefit does it receive by reducing debt as a source of funding? On this point, the data is fairly strong. Institutions
-1%
0%
1%
2%
3%
4%
5%
6%
7%
8%
Deposit-Borrowing SpreadReturn on Assets
2.8%
1.3% 1.4%
2.4%2.1% 2.1%
1.8%0%
.1%
2.1%
Government Inst.
Time dep-funding
Time dep-service
Demand dep
Compulsory
FIGURE 11: Summary of Financial Outcomes by Model

18 FAI Exploring the Business Models behind Microsavings
offering relatively low interest rates have the highest spread between cost of deposits and cost of borrowing, with compulsory accounts —unsurprisingly—providing the biggest benefit (see Figure 11 again).
By the same token, MFIs relying on relatively costly time deposits gain little in direct financial terms by replacing borrowing with deposits. There may certainly be many other benefits, including lower currency exposure, greater reliability of funding and more diversification, but on purely P&L terms, the spread between cost of time deposits and cost of debt is at or near zero. Finally, MFIs that are able to attract government and institutional accounts without resorting to high rates tend to enjoy similar benefits as their service model counterparts, but without the added expense of high personnel costs.
Finally, there’s the question of revenue. As liabilities, deposits can’t generate revenue directly. However, the use of transaction fees can generate some returns. The data here is imperfect: not all institutions report detailed revenue by income stream, and for those that do, there is still no way to separate out deposit-related fees from other non-loan activities, such as insurance. Nevertheless, the data that does exist suggests that fees comprise a relatively small portion of revenues overall.9
Interestingly, funding model MFIs show significant non-loan income, and among the upper range of these institutions (75th percentile), this non-loan income accounts for some 25% of net income. The relative importance of fee income to large-deposit model MFIs and its relative unimportance for
their small-model cousins is very surprising. After all, one cannot expect to make significant fees from large deposit accounts—such clients tend to be more price sensitive (as demonstrated by the higher interest rates they demand). Presumably, the fees come from add-on services provided by these larger institutions, whether from payments, insurance and other products, as well as from fees associated with smaller demand deposit accounts.
ConclusionThe founding premise of this exploration of different MFI deposit models is that there are different strategies available for deposit-gathering MFIs. The choices available are to a great degree influenced by the external environment, including degree of economic development, regulatory and market context, and the country in which the institution happens to be located.
Despite these environmental constraints, MFIs still have choices that will ultimately affect the path their institution will take, as well as the likely outcomes it can expect. We hope that this analysis helps lay the founding for making more informed decisions about microsavings products and business models.
We would also like to emphasize the importance of developing appropriate reporting for microsavings programs, including some data on account activity and stratification, to properly assess the actual level of outreach. Current reporting structure is simply unsuitable for the purpose, and may lead to poor decisions and conclusions that prove misleading.

Rozas FAI19
Notes:
1. D. Rozas, G. Erice, “Microfinance and Savings
Outreach: What are we measuring?”, e-MFP,
Luxembourg, March 2014.
2. MIX Market, 2012 annual data as of 7 Jan 2014;
excludes MFIs in China. All dollar amounts are in
USD. All data in this report derives from this source
and year, unless otherwise noted.
3. Source: MIX Market, 2010.
4. G. D. Westley, X. M. Palomas, Is There a Business Case for Small Savers?, CGAP, Sep 2010.
5. Source: MIX Market 2010.
6. F. Portocarrero, A.Tarazona, G. Westley, How Should Microfinance Institutions Best Fund Themselves?, Inter-American Development Bank,
Nov 2006. For deposit stratification, see Table 6.
7. Source: MIX Market 2010.
8. All data in BancoSol charts was contributed by the
bank or extrapolated from bank data by the author.
9. This appears to contradict the finding from
Westley (2010), where fees were found to bring in
1/3rd of the revenue at one MFI (Centenary Bank,
Uganda). Then again, that study looked at only two
MFIs, and the other (ADOPEM, Dominican Republic)
collected no savings-related fees at all, so the finding
is in truth more descriptive of a specific practice, but
provides little basis for generalizing or extrapolating
to others.

20 FAI Exploring the Business Models behind Microsavings
Appendix I: The MIX Market Savings datasetThe bulk of this paper is based using a dataset specially provided by the MIX Market, which provides breakdowns of numerous indicators that shed light on some of the facets of microfinance savings operations that have not been explored to-date. In preparation for the analysis, we first applied several filters:
» Fiscal year= 2010, extract date= Jun 28 2012
» Exclude any MFIs with deposits/loan portfolio ratio of <0.2
» MFIs must have reported a non-zero value in at least one savings account type (compulsory, demand deposit, etc.)
» The government & institutional category is a sum of the following deposit accounts:
•Corporations
•Financialinstitutions
•Government
» The resulting dataset comprises 342 MFIs. Figure A-1 shows the general characteristics of the dataset
Geography Legal Structure Size
SSA88
Bank70
Large171
Medium80
Small68
N/A 23
Other 7
CU/Coop102
NBFI79
NGO50
Rural Bank 34
EAP57
ECA44
LAC99
SA53
MENA1
FIGURE A-1: Distribution of Institutional Characteristics in the MIX Dataset

Rozas FAI21
Appendix II: MethodologyThere are several steps that go into defining both the main deposit models (service and funding) as well as the account type categories.
Step 1: Define the dominant account. This is the account type that contributes the largest share of the institution’s total deposits. All subsequent tests to determine under which deposit model and account-type category to classify the MFI are then performed on the dominant account only, ignoring other accounts.
This is a critical step in identifying MFIs that use mixed deposit strategies, and particularly those that emphasize deposits via large, fixed term accounts (the “funding deposits model”). Because many such institutions also offer far larger numbers of small accounts, looking at the average savings balance overall would obscure the presence of these large accounts. However, because these small accounts are often held as demand or compulsory deposits, disaggregating by account type enables better identification of the actual savings model. This also helps filter out at least some of the effect of dormant/little used savings accounts, most of which are likely to be in the form of demand deposits.
Focusing on dominant accounts is also supported by the fact that for most institutions these accounts are responsible for the vast bulk of deposit funding (~70%), and is thus a strong reflection of its savings strategy (Figure A-2).
Step 2: Define the basic deposit model (service or funding). The primary delineation between the two models is the average size of the dominant deposit account relative to the average loan in portfolio. This determines whether the institution’s deposits are drawn from a similar client segment as its borrowers. If the average deposit balance (dominant accounts only) is larger than the average loan size, then the model is deemed to be the “funding deposits,” otherwise it’s the “service deposits” model.
0
20%
40%
60%
80%
100%
60%54%
57%53%
63%
89%
71%
85% 86%
67%
84%
70%
Compulsory Demand TimeDep
Gov /Inst.
FIGURE A-2: Dominant Accounts Contribute a Large Majority Share of Total Deposits
22 FAI Exploring the Business Models behind Microsavings
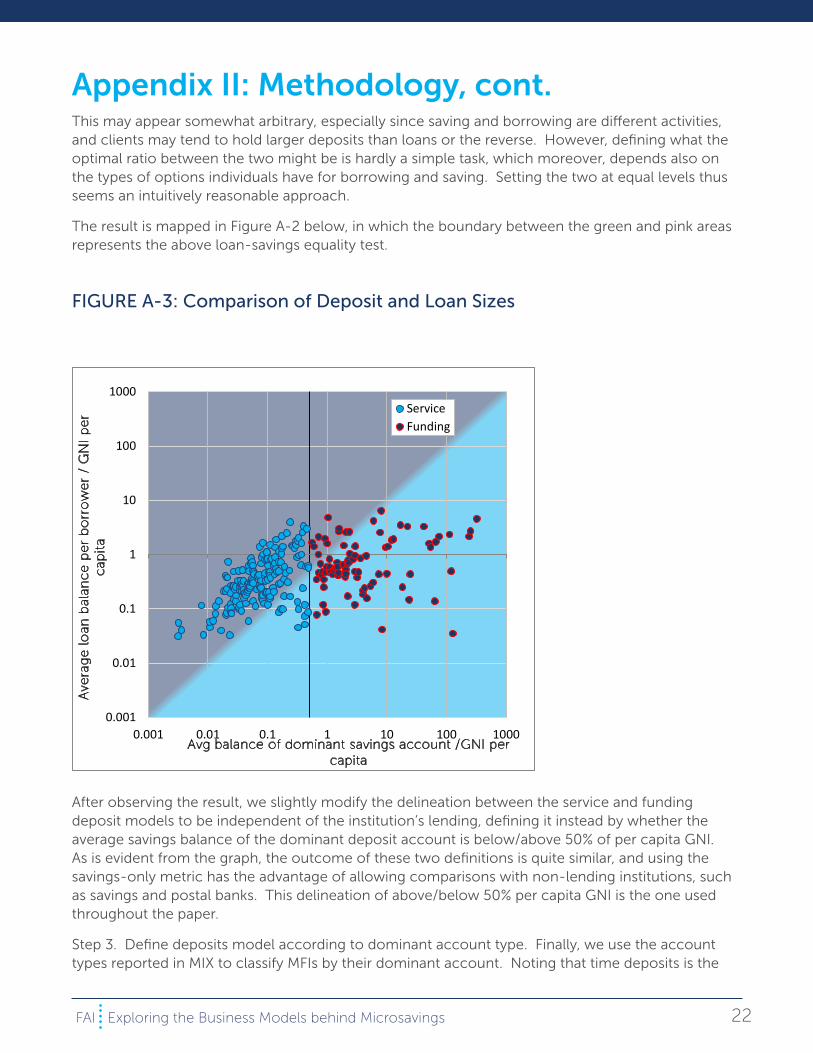
Appendix II: Methodology, cont.This may appear somewhat arbitrary, especially since saving and borrowing are different activities, and clients may tend to hold larger deposits than loans or the reverse. However, defining what the optimal ratio between the two might be is hardly a simple task, which moreover, depends also on the types of options individuals have for borrowing and saving. Setting the two at equal levels thus seems an intuitively reasonable approach.
The result is mapped in Figure A-2 below, in which the boundary between the green and pink areas represents the above loan-savings equality test.
0.001
0.01
0.1
1
10
100
1000
0.001 0.01 0.1 1 10 100 1000
Ave
rag
e l
oan
bal
anc
e p
er
bo
rro
we
r /
GN
I p
er
cap
ita
Avg balance of dominant savings account /GNI per capita
ServiceFunding
After observing the result, we slightly modify the delineation between the service and funding deposit models to be independent of the institution’s lending, defining it instead by whether the average savings balance of the dominant deposit account is below/above 50% of per capita GNI. As is evident from the graph, the outcome of these two definitions is quite similar, and using the savings-only metric has the advantage of allowing comparisons with non-lending institutions, such as savings and postal banks. This delineation of above/below 50% per capita GNI is the one used throughout the paper.
Step 3. Define deposits model according to dominant account type. Finally, we use the account types reported in MIX to classify MFIs by their dominant account. Noting that time deposits is the
FIGURE A-3: Comparison of Deposit and Loan Sizes

Rozas FAI23
only account type that isn’t clearly linked to either a service or funding model (Figure A-3), we separate further subdivide, thus yielding a total of model 5 categories used throughout the paper:
» Compulsory
» Demand deposit
» Time deposit (service)
» Time deposit (funding)
» Government & institutional
Note that the first three are strongly associated with the service model, while the last two are mainly funding model groups. To facilitate comparisons between the charts, wherever possible we use a consistent color-scheme, with groups associated with service model in shades of orange, and funding model in shades of blue