Exploring socio-spatial inequalities in bike-sharing … socio-spatial inequalities in bike-sharing...
17
Exploring socio-spatial inequalities in bike-sharing systems: Case studies from Brazil and Spain ESTHER ANAYA-BOIG CENTRE FOR ENVIRONMENTAL POLICY - IMPERIAL COLLEGE LONDON 28 th September 2017, Manchester
Transcript of Exploring socio-spatial inequalities in bike-sharing … socio-spatial inequalities in bike-sharing...

Exploringsocio-spatialinequalitiesinbike-sharingsystems:CasestudiesfromBrazilandSpain
ESTHERANAYA-BOIGCENTRE FOR ENVIRONMENTAL POL ICY - IMPER IAL COLLEGE LONDON
28th September2017,Manchester

Contents
vWhoisinvolved?vGeneralbackground,incl.decolonisingaspects.vStage1:TheBrazilianStudyvStage2:TheBarcelonaStudyvConclusions

Whoisinvolved?Brazilstudy:◦ AnaClaraDuranandThiagoHérick deSá,CentreforEpidemiologicalStudiesinNutritionandHealth,UniversityofSaoPaulo,SaoPaulo,Brazil
◦ EstherAnaya-Boig,CentreforEnvironmentalPolicy,ImperialCollegeLondon,London,UK
◦ JoshuaDanielShake,CentreforMetropolitanStudies,UniversityofSaoPaulo/BrazilianCentreofAnalysisandPlanning,SaoPaulo,Brazil
◦ LeandroMartinTotaro Garcia,NationalSchoolofPublicHealth,OswaldoCruzFoundation,RiodeJaneiro,Brazil
◦ LeandroFórnias MachadodeRezende,DepartmentofPreventiveMedicine,SchoolofMedicine,UniversityofSaoPaulo,SaoPaulo,Brazil
Barcelonastudy:◦ EstherAnaya-Boig,CentreforEnvironmentalPolicy,ImperialCollegeLondon,London,UK
◦ Àngel Cebollada i Frontera,DepartmentofGeography,AutonomousUniversityofBarcelona,Barcelona,Spain

TransferabilityremarksI
Populationdensity(inhabitants/km2)(2014 &2016)
Recife(BR) 7,133 SaoPaulo(BR) 7,913
Salvador(BR) 4,187 RiodeJaneiro(BR) 5,286
PortoAlegre(BR) 3,030 Barcelona(ES) 15,881!!
GINIcoefficient(2016)
Recife(BR) 0.689 SaoPaulo(BR) 0.645
Salvador(BR) 0,645 RiodeJaneiro(BR) 0.639
PortoAlegre(BR) 0.614 Barcelona(ES) 0.325
Ofthisstudy:◦ Interestingly,lessdatawasavailableinBarcelona(lesstransparency!)◦ InBraziliancitiestheinequalities arebiggerthaninBarcelona:
◦ Mobilityalternatives,urbanfeatures,modalsplit,culturalaspects… quitedifferentinoneplaceandintheother.Populationdensityisarelevantindicatorsthatseemcounter-intuitive:

TransferabilityremarksIIOfthisstudy:◦ Theelementofthestudywherebuiltenvironmentanditsperceptionandusehasimpactedthemostwasinthedefinitionofthecatchmentareas.
1. Wefirsttriedtofindwillingnesstowalktothenearestbike-sharingstation.Ofcourse,thiswasunavailable(wishlist indicator).
2. Theperceptionoftheacceptablewalkingdistancetoastationcouldbedeterminedbytheperceptionofthedistancesinthewholenetwork(assumingtheuserhadthatknowledge).Sowedecidedtocalculatetheaveragedistancebetweentheneareststations,usingtheNearestNeighbourAnalysis:
Braziliancities:500mBarcelona:150m!!

EquityBike-sharingisapublicservice,butforwhom?
HEALTHandotherBENEFITSOFCYCLING.Basedonmodeshift,healthimpactassessmentattributeshealthbenefitstobike-sharing(iftheshiftisnotfromwalking).
ACCESSTOAPUBLICSERVICE.Anypopulationgroupsleftaside?
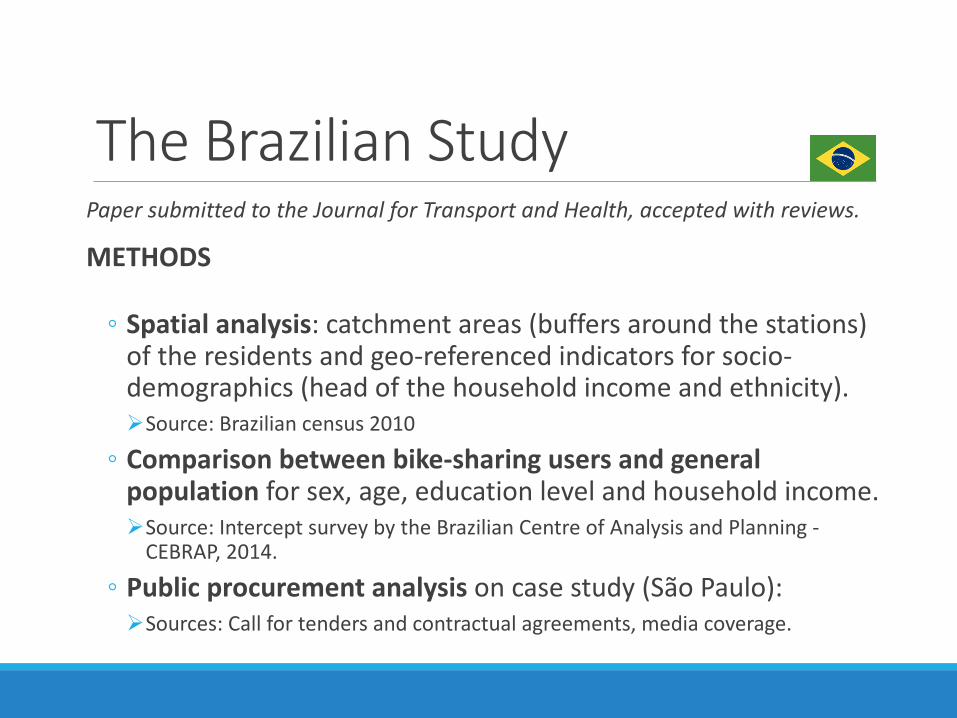
TheBrazilianStudyPapersubmittedtotheJournalforTransportandHealth,acceptedwithreviews.
METHODS
◦ Spatialanalysis:catchmentareas(buffersaroundthestations)oftheresidentsandgeo-referencedindicatorsforsocio-demographics(headofthehouseholdincomeandethnicity).ØSource:Braziliancensus2010
◦ Comparisonbetweenbike-sharingusersandgeneralpopulationforsex,age,educationlevelandhouseholdincome.ØSource:InterceptsurveybytheBrazilianCentreofAnalysisandPlanning-CEBRAP,2014.
◦ Publicprocurementanalysisoncasestudy(SãoPaulo):ØSources:Callfortendersandcontractualagreements,mediacoverage.

1a. Recife
1e. Rio de Janeiro
1c. Porto Alegre
1d. Sao Paulo
1b. Salvador
Bicycle-sharingsystemcatchmentareasinthe5selectedBrazilianstatecapitalsandneighborhood-levelmeanincome.

TheBrazilianStudyFINDINGS◦ Spatialanalysis:areascoveredbythesystems:◦ Encompass8to25%ofthecities’areasand6to18%ofthecities’population.◦ Favourwealthierandcentrallylocatedneighbourhoods.◦ Mean incomeoftheheadofthehouseholdwas1.6to2.3timesthecities’mean!◦ Have13to36%higherproportionofwhiteresidentsthancitywideaverage.
◦ Comparisonbetweenbike-sharingusersandgeneralpopulation:bike-shareusers:◦ Wereoverwhelminglyhighereducatedthanthegeneralpopulation.◦ Whostudiedlessthanhighschoolwerelessthan3%,whereasthisgrouprepresents30to40%ofthecities’population!
◦ Arepoorerthancitywideaverages,butnotasmuchasfoundinthespatialanalysis.Thisseemstoindicatethatasub-groupofusersdon’tlivebutprobablyworkinthecatchmentareas.(limitation)
◦ Publicprocurementanalysisoncasestudy(SãoPaulo):◦ Contractualarrangementshaveastrongimpactshapingthelocationandcoverageofsystems.◦ Equityisabsentofthesedocuments !

TheBarcelonastudyOn-goingstudy,nopublicationsyet.
Wefocusedindeepeninginthespatialanalysis:◦ Weincludedaccesstoothercyclinginfrastructure:cyclepaths(generallysegregatedorsemi-segregated).
◦ WedefinedaSpatialEquityIndexinspired intheAvailableHouseholdIncomeIndex(RFD2016,BarcelonaCityCouncil) forthecensusunitsgathering4selectedavailablevariables:
◦ Introductionofthehillinessvariableforvalidation.ØSources:Census,NationalStatisticsInstitute,BarcelonaCityCouncil.
Variables Weight
Highereducationproportion 0,175
Propertyvalue 0,35
SUVproportion 0,15
Non-commercialvehicleownership 0,15

TheBarcelonastudyResults◦ Buffercalculationforbike-sharingstations(NearestNeighbour
Analysis):◦ 150m,vs.500mforBraziliancities.◦ Temporarilythesameforthebicyclelanes.
◦ Catchmentareas:◦ Bicyclelanes:30%◦ Bike-sharingstations:23%
◦ Populationserviced:◦ Bicyclelanes:48%◦ Bike-sharingstations:44%
◦ Nodifferencesfoundforsexrationornon-nationalsratio.
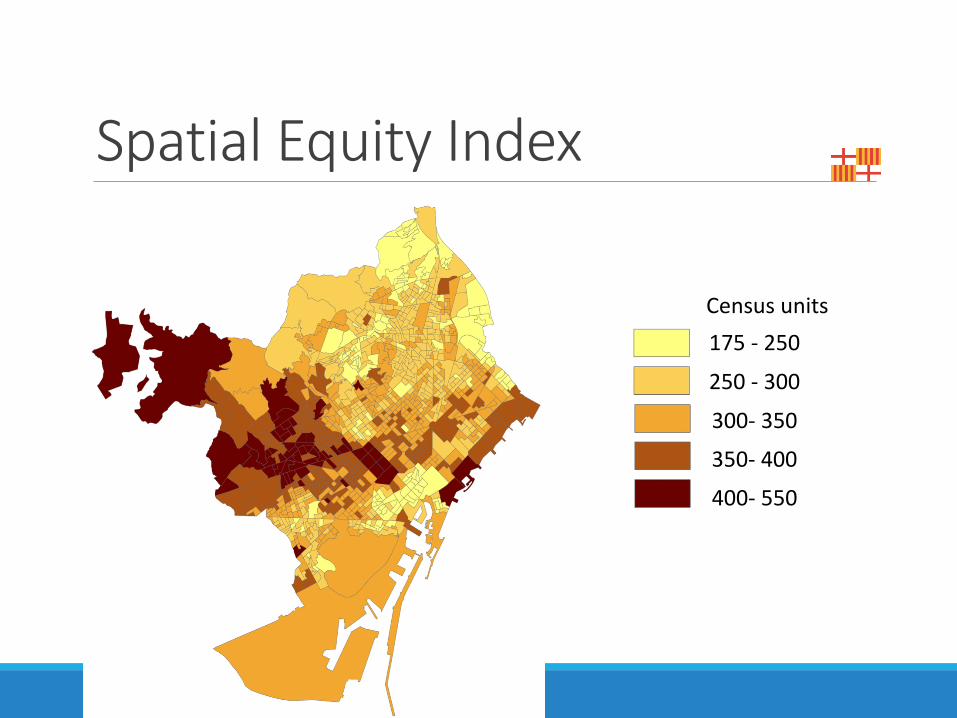
SpatialEquityIndex
Censusunits175- 250
250- 300
300- 350
350- 400
400- 550

SpatialEquityIndexUnder-servicedcensusunitsarepoorer.◦ Censusunitswithoutbike-sharingservice,have7%lowerindexthanthosewithinthecatchmentarea.
◦ Censusunitswithoutbicyclelanes,have6%lowerindexthanthosewithinthecatchmentarea.

LimitationsandfurtherresearchVariablewishlist (transparency/opendataissues):◦ Refinecatchmentareacalculations.◦ Income.◦ Worklocation,withassociatedsociodemographics (currentlyonlyresidentsandatthelevelofcensusunit).IncludingHomelocationforworkerswithincatchmentareas– intermodality assessment.
◦ Bike-shareuserssurvey.◦ Anyothervariableforaccessibility(notonlydistance?)
Furtheranalysis:◦ Integrationwithpublictransportnetworks– intermodality assessment(tariffintegrationsupport).
◦ Otherbarrierstocyclingandbike-sharingthatmightexplainaloweruptakeofthesystembythecloserresidents- surveys/qualitativemethods.
◦ TesttheIndexwithmorecase-studies,ideallywithvariablesfromwishlist ifavailable,inordertovalidatethemodel.

Spatialequityindex-adjustments
Controllingforhillinessprovedirrelevant(>5%slopeinhalfofthecensusunitarea)
◦ Censusunitswithouthillinesshad3%higherindexthanthehillyones.
Validated forthecaseofBarcelona,butshouldbetestedforothercases.

Conclusions◦ Spatialbike-sharingequitystillneedstobedefined.Weproposeanindexthatmainlydependsonavailabledataandselectedrelevantindicatorsforbike-sharinguse.
◦ Therearelocalvariablesthatneedtobecalculatedforeverycase,e.g.bufferdistance:WeproposetheNearestNeighbourDistanceanalysis,butotherbehaviouralaspectsmightapply(suchasavailabilitytowalktonearestbike-sharestation,ortocycletonearestsegregatedcycleinfrastructure).
◦ Relevanceofbike-sharingforequitycouldbedifferentdependingontheproportionofcycletripsmadebywithpublicbicycles.
◦ Procurementprocessesandregulationsmighthaveabigimpactforspatialdistributionofbike-sharingstations.Politicalaspectsalsounder-studied.
◦ Theconfoundingeffectoftechnicallimitations(suchasslope)forthelocationofstationswasirrelevantinthiscase,butshouldbetakenintoaccountineverycase.

Thankyou!Contact:
EstherAnaya-Boig
◦ CentreforEnvironmentalPolicy– [email protected]
◦ Observatorio delabicicleta pública en España (Observatoryofbike-sharinginSpain)