Exploring self-reinforcing socio-economic forces that ...
26
Exploring self-reinforcing socio-economic forces that operate as catalyst or threat to social change Dr Roberto Pasqualino – [email protected]
Transcript of Exploring self-reinforcing socio-economic forces that ...

Exploring self-reinforcing socio-economic forces that operate as catalyst or threat to social changeDr Roberto Pasqualino – [email protected]

Time schedule
• Review of the Limits to growth and Reinforcing loop (10 minutes)
• Examples of reinforcing loops and interactions (5 minutes)
• Review of the 12 Villages 6 possible groups (5 minutes)
• Group activity 1 (30 minutes)
• Group activity 2 (20 minutes)
• Closing remarks (5 minutes)
• Group picture and Sending our recommendations to Assisi!

What is Limits to Growth about?
308/10/21
Natural resource
usage rate
Natural resources
Land erosion
Land development
Arable Land
Pollution absorption
Pollution generation
Pollution
Degradation rate
Regeneration rate
Land Fertility
Capital discard
Capital investment
Capital
LIMITS
DeathRate
Birthrate
Population
GROWTH
«What we meant in 1972 in ‘The Limits to
Growth’ and what is still true, is that there is simply no endless
physical growth on a finite planet.»
(Meadows, D. 2012)

World3 model and ‘what if’ scenario analysis
Natural resource usage rate
Natural resources
Land erosion
Land development
Arable Land
Pollution absorption
Pollution generation
Pollution
Degradation rate
Regeneration rate
Land Fertility
Capital discard
Capital investment
Capital
Death RateBirth rate
Population
Goal: avoid OVERSHOOT and
collapse of economic output and population
growth!
2016
(Meadows et. al, 1972)
What: Technology-oriented policies to remove planetary
constraints
World3 Variables Limits Scenario 2: There are resources…
Global Policies & Scenario analysis
Cost: Economic resources are allocated to
remove global constraints

Dynamics of growth and exponential growth?
-3-2-1012345678
1960
1963
1966
1969
1972
1975
1978
1981
1984
1987
1990
1993
1996
1999
2002
2005
2008
2011
World GDP Growth Rate (%/Year)
0
1
2
3
4
5
6
7
1960
1963
1966
1969
1972
1975
1978
1981
1984
1987
1990
1993
1996
1999
2002
2005
2008
2011
Real World GDP vs Ideal (Exponential) World GDP
!"#(%&'())!"#!"#$
= (1 + 0.036)%&'()
Average World GDP growth rate = 3.6%
IndustrialInvestment
Accumulation ofIndustrial Assets
+
Industrial Output
+
+
EconomicGrowth
A note on terminology:
• (+) Sign: Means that an increase in one factor causes an increase in another factor
• Loop: Closed causal chain from one node to itself
• Reinforcing Loop: A closed loop where an increase in one factor leads to an increase on itself through the loop

Times Folded mm m km Times Folded mm m km0 0.1 0.0001 0.0000001 21 209715.2 209.7152 0.20971521 0.2 0.0002 0.0000002 22 419430.4 419.4304 0.41943042 0.4 0.0004 0.0000004 23 838860.8 838.8608 0.83886083 0.8 0.0008 0.0000008 24 1677721.6 1677.7216 1.67772164 1.6 0.0016 0.0000016 25 3355443.2 3355.4432 3.35544325 3.2 0.0032 0.0000032 26 6710886.4 6710.8864 6.71088646 6.4 0.0064 0.0000064 27 13421772.8 13421.7728 13.42177287 12.8 0.0128 0.0000128 28 26843545.6 26843.5456 26.84354568 25.6 0.0256 0.0000256 29 53687091.2 53687.0912 53.68709129 51.2 0.0512 0.0000512 30 107374182.4 107374.1824 107.374182410 102.4 0.1024 0.0001024 31 214748364.8 214748.3648 214.748364811 204.8 0.2048 0.0002048 32 429496729.6 429496.7296 429.496729612 409.6 0.4096 0.0004096 33 858993459.2 858993.4592 858.993459213 819.2 0.8192 0.0008192 34 1717986918 1717986.918 1717.98691814 1638.4 1.6384 0.0016384 35 3435973837 3435973.837 3435.97383715 3276.8 3.2768 0.0032768 36 6871947674 6871947.674 6871.94767416 6553.6 6.5536 0.0065536 37 13743895347 13743895.35 13743.8953517 13107.2 13.1072 0.0131072 38 27487790694 27487790.69 27487.7906918 26214.4 26.2144 0.0262144 39 54975581389 54975581.39 54975.5813919 52428.8 52.4288 0.0524288 40 1.09951E+11 109951162.8 109951.162820 104857.6 104.8576 0.1048576 41 2.19902E+11 219902325.6 219902.3256… … … … 42 4.39805E+11 439804651.1 439804.6511
Tickness Tickness
Issues with exponential growth
608/10/21

7
(Steffen et al. , 2015)
(Berkeley’s Earth Report, 2020)
Planetary Boundaries Report
(Living Planet Report, 2008)
Results of exponential growth

Time schedule
• Review of the Limits to growth and Reinforcing loop (10 minutes)
• Examples of reinforcing loops and interactions (5 minutes)
• Review of the 12 Villages 6 possible groups (5 minutes)
• Group activity 1 (30 minutes)
• Group activity 2 (20 minutes)
• Closing remarks (5 minutes)
• Group picture and Sending our recommendations to Assisi!

Reinforcing loops can be good!
Number ofPeople on Strike
Speak Loud AboutReason for Strike
+
More People areConvinced and Join
the Strike
+
+
ClimateStrike

Examples of reinforcing loops: Systems Level
Investment onAssets
Profit fromAssets
+
Accumulation ofFinancial Assets
+
+
WealthGrowth
Fossil Fuels Pricesare Lower than
Renewables
Pension Funds areInvested on Fossil
Fuels
+
Fossil fuelsDominate the Energy
Market
+
+
FossilGrowth
AgriculturalProduction
Climate Crisis andEnvironmental
Extreme events
FoodProduction Loss
+
+
Agri-Clima
AgriculturalEmissions
+
+

Examples of reinforcing loops: Interpersonal level
Given Resourcesto Perform Well
GoodPerformance
+
Accepted byCommunity
+
+
GoodCareer More Difficult to
Get ResourcesBad
Performance
+
Excluded byCommunities
+
+
SlowCareer
Person A LovesPerson B
Person B LovesPerson A
Person B ShowsLove to Person A
+
+
Love Life
Person A ShowsLove to Person B
+
+
Person ACompetes with
Person B
Person BCompetes with
Person A
Person A isDamaged by
Person B
+
+
Tip forTap
Person B isDamaged by
Person A
+
+

Examples of reinforcing loops: Introspective Level
NegativeThoughts Feeling Bad
+
NegativeThinking
+
PositiveThoughts Feeling Good
+
PositiveThinking
+

Example of interaction between loops: Synergy
Wealth Creation
WealthAccumulation
PositivePerformance
+
+
+
Investment AidsEconomic
Development
Well-Being
+
+
+
+
WealthCreation
InvestmentAids

Example of interaction between loops: Threat
Influence ofCommunity A
Attraction rate ofCommunity A
Number ofParticipants toCommunity A
Influence toCommunity B
Number fParticipants toCommunity B
Attraction Rate ofCommunity B
+
+
+
+
++
-
-
Influenceof A
Influenceof B
Competition
Worth noting:
• (-) Sign: indicates that an increase in one factor determines a decrease in another factor – thus creating Opposition
• Two Negative influences that follow each other in a loop also create a Reinforcing loop
• In this diagram two groups aim for expansion, and erode each other’s influence

Time schedule
• Review of the Limits to growth and Reinforcing loop (10 minutes)
• Examples of reinforcing loops and interactions (5 minutes)
• Review of the 12 Villages 6 possible groups (5 minutes)
• Group activity 1 (30 minutes)
• Group activity 2 (20 minutes)
• Closing remarks (5 minutes)
• Group picture and Sending our recommendations to Assisi!
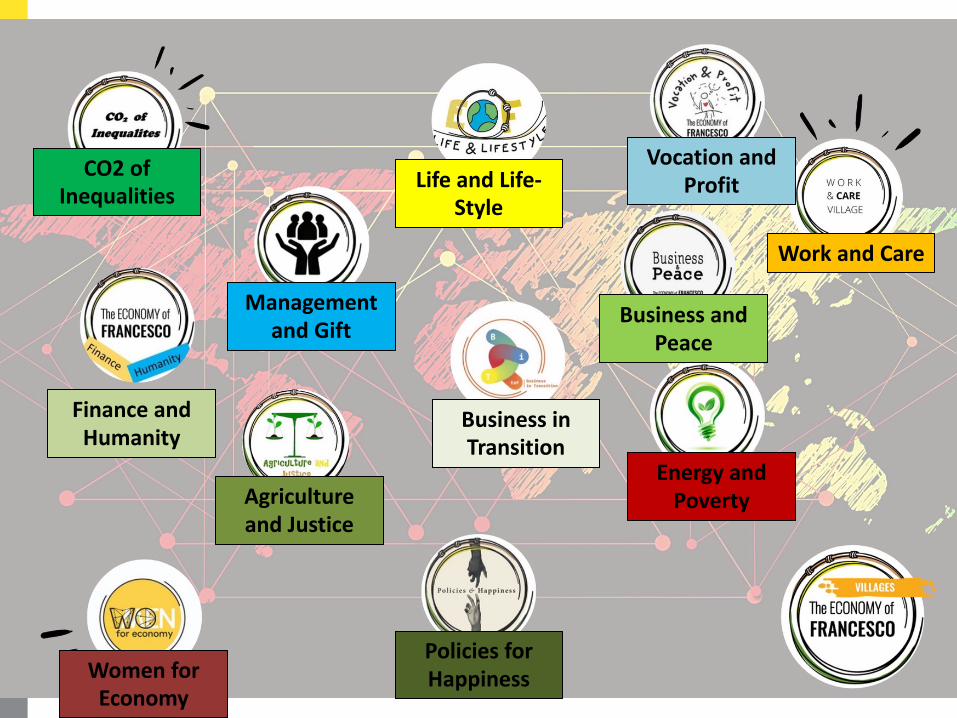
Management and Gift
Finance and Humanity
Work and Care
Agriculture and Justice
Energy and Poverty
Business and Peace
Women for Economy
CO2 of Inequalities
Vocation and Profit
Business in Transition
Life and Life-Style
Policies for Happiness

Proposed Systems: 1 and 2
Equal Gender Society Inequal Gender Society
Energy Transition Embracing the Poor Energy Transition Leaving the Poor Behind
Women for Economy
Energy and Poverty

Proposed Systems: 3 and 4
Finance for Well-Being (for the Many) Finance for Profit (for the Few)
Finance and Humanity
Climate-Resilience for the Poor Climate-Vulnerability for the Poor
CO2 of Inequalities

Proposed Systems: 5 and 6
Meaning and Balance Society Material Consumption Growth society
Life and Life-Style
Vocational Purpose Businesses Short-term Profit Businesses
Vocation and Profit

Time schedule
• Review of the Limits to growth and Reinforcing loop (10 minutes)
• Examples of reinforcing loops and interactions (5 minutes)
• Review of the 12 Villages 6 possible groups (5 minutes)
• Group activity 1 (30 minutes)
• Group activity 2 (20 minutes)
• Closing remarks (5 minutes)
• Group picture and Sending our recommendations to Assisi!

Group Activity 1 (30 minutes)
• You have:
• Sticky Notes• Paper• Markers
• As Individual:
• Choose the system you most feel like contributing to
• As small groups:
• Step 1: draw a system map of all the positive loops that can support system change in the direction of the objective set by the village (15 Minutes)
• Step 2: Expand the initial system map with all positive loops that can be seen as a threat to change (15 minutes)
• Step 3: List at least 3 intervention points that can support changing the system towards the better
Time schedule
• Review of the Limits to growth and Reinforcing loop (10 minutes)
• Examples of reinforcing loops and interactions (5 minutes)
• Review of the 12 Villages 6 possible groups (5 minutes)
• Group activity 1 (30 minutes)
• Group activity 2 (20 minutes)
• Closing remarks (5 minutes)
• Group picture and sending our recommendations to Assisi!

Group Activity 2 (30 minutes)
• Step 1: get close together with all system maps
• Step 2 (Each group in turn): describe to the other groups the functioning of their map, their rationale, and why they chose those intervention points (open to comments from other groups)
• Step 3 (all groups together): seek for synergies for system change and threatswhile looking at possible connections among all system maps
• Step 4 (all groups together): Do the intervention points change? List the key intervention points that could help change the interconnected system toward the better

Time schedule
• Review of the Limits to growth and Reinforcing loop (5 minutes)
• Examples of reinforcing loops (5 minutes)
• Review of the 12 Villages 6 possible groups (5 minutes)
• Group activity 1 (30 minutes)
• Group activity 2 (20 minutes)
• Closing remarks (5 minutes)
• Group picture and Sending our recommendations to Assisi!

Closing remarks
• Everything you do will impact and feed into some sort of reinforcing loop!
• You will need to recognize them if you really want to assure system change!
• Finding answers is hard, and systems will change under your feet – perseverance and system thinking are key

Thank you for participating, hope you enjoyed this activity today!
LET’S SEND OUR FINDINGS TO EOF IN ASSISI!!