Exploring Middle School Students’ Use of Inscriptions in
22
LEARNING Joseph Krajcik and Maria Varelas, Section Coeditors Exploring Middle School Students’ Use of Inscriptions in Project-Based Science Classrooms HSIN-KAI WU Graduate Institute of Science Education, National Taiwan Normal University, P.O. Box 97-27, Taipei 11699, Taiwan JOSEPH S. KRAJCIK School of Education, University of Michigan, Ann Arbor, MI 48109, USA Received 13 July 2005; revised 28 February 2006; accepted 10 March 2006 DOI 10.1002/sce.20154 Published online 2 May 2006 in Wiley InterScience (www.interscience.wiley.com). ABSTRACT: This study explores seventh graders’ use of inscriptions in a teacher-designed project-based science unit. To investigate students’ learning practices during the 8-month water quality unit, we collected multiple sources of data (e.g., classroom video recordings, student artifacts, and teacher interviews) and employed analytical methods that drew from a naturalistic approach. The findings showed that throughout the unit, provided with the teachers’ scaffold and social, conceptual, and material resources, the seventh graders were able to use various inscriptions (e.g., digital pictures, Web pages, and models) to demon- strate meaningful inscriptional practices such as creating and using inscriptions to make arguments, to represent conceptual understandings, and to engage in thoughtful discussions. Inscriptions and associated practices provided students with experiences and understand- ings about certain ways to organize, transform, and link data or scientific ideas. However, when constructing inscriptions, students did not consider how the inscriptions could serve certain reasoning purposes. In addition, more scaffolds were needed to help students use multiple inscriptions to make a coherent argument. C 2006 Wiley Periodicals, Inc. Sci Ed 90:852 – 873, 2006 Correspondence to: Hsin-Kai Wu; e-mail: [email protected] This paper was edited by former Section Coeditors Gregory J. Kelly and Richard E. Mayer. C 2006 Wiley Periodicals, Inc.
Transcript of Exploring Middle School Students’ Use of Inscriptions in
LEARNING
Joseph Krajcik and Maria Varelas, Section Coeditors
Exploring Middle SchoolStudents’ Use of Inscriptionsin Project-Based ScienceClassrooms
HSIN-KAI WUGraduate Institute of Science Education, National Taiwan Normal University,P.O. Box 97-27, Taipei 11699, Taiwan
JOSEPH S. KRAJCIKSchool of Education, University of Michigan, Ann Arbor, MI 48109, USA
Received 13 July 2005; revised 28 February 2006; accepted 10 March 2006
DOI 10.1002/sce.20154Published online 2 May 2006 in Wiley InterScience (www.interscience.wiley.com).
ABSTRACT: This study explores seventh graders’ use of inscriptions in a teacher-designed
project-based science unit. To investigate students’ learning practices during the 8-month
water quality unit, we collected multiple sources of data (e.g., classroom video recordings,
student artifacts, and teacher interviews) and employed analytical methods that drew from
a naturalistic approach. The findings showed that throughout the unit, provided with the
teachers’ scaffold and social, conceptual, and material resources, the seventh graders were
able to use various inscriptions (e.g., digital pictures, Web pages, and models) to demon-
strate meaningful inscriptional practices such as creating and using inscriptions to make
arguments, to represent conceptual understandings, and to engage in thoughtful discussions.
Inscriptions and associated practices provided students with experiences and understand-
ings about certain ways to organize, transform, and link data or scientific ideas. However,
when constructing inscriptions, students did not consider how the inscriptions could serve
certain reasoning purposes. In addition, more scaffolds were needed to help students use
multiple inscriptions to make a coherent argument. C© 2006 Wiley Periodicals, Inc. Sci Ed90:852–873, 2006
Correspondence to: Hsin-Kai Wu; e-mail: [email protected] paper was edited by former Section Coeditors Gregory J. Kelly and Richard E. Mayer.
C© 2006 Wiley Periodicals, Inc.

INSCRIPTIONS AND MIDDLE SCHOOL SCIENCE LEARNING 853
INTRODUCTION
Creating, reading, and reasoning with scientific inscriptions such as models, graphs,diagrams, data tables, symbols, and maps are among the fundamental elements of scientificlearning underlying the science education standards (National Research Council [NRC],1996) and valued as important learning practices for the development of scientific literacy(American Association for the Advancement of Science [AAAS], 1989, 1993). According tothe AAAS, during grades six through eight, students should be able to create graphs, tables,and simple models to organize information, represent relationships between variables of aconcrete situation, identify patterns and trends, make predictions about phenomena beingrepresented, and make arguments in oral and written presentations. These learning practicesmirror scientists’ use of inscriptions documented in science and technology studies (Latour,1987; Lynch & Woolgar, 1990). According to Latour (1999), inscription refers to various“types of transformations through which an entity becomes materialized into a sign, anarchive, a document, a piece of paper, a trace” (p. 306). Science and technology studies haveshowed that inscriptions are central to the practice of science and that scientists produce,share, and use a variety of inscriptions to conduct scientific investigations. Together theAAAS recommendations and findings of science studies suggest the importance of engagingstudents in activities that involve constructing, interpreting, presenting, and reasoning withscientific inscriptions. These various ways of using inscriptions are viewed as “inscriptionalpractices” in this study.
However, many students encounter difficulties when learning and using scientific in-scriptions (Krajcik, 1991; Leinhardt, Zaslavsky, & Stein, 1990). Students cannot selectivelycreate or use certain inscriptions to explain phenomena (Kozma & Russell, 1997), do notuse inscriptions as tools to expand their experience (Kozma, 2000a), and lack resourcesto interpret and create inscriptions meaningfully (Bowen, Roth, & McGinn, 1999). Thus,there is a need to understand how the design of a learning environment (e.g., classroomactivities, learning materials, and teaching practices) supports students’ enactment of mean-ingful inscriptional practices. The study reported in this article was designed to respond tothe need by exploring middle school students’ use of inscriptions during an eight-monthproject-based science unit that emphasized water quality and related concepts (the waterquality unit).
In this teacher-designed water quality unit, two teachers guided their seventh gradersto conduct scientific inquiry and to investigate the driving question of “what is the waterquality of the stream behind their school.” Throughout the unit, students collected waterquality data, analyzed the data, generated conclusions, and created artifacts to represent theirunderstandings. The purpose of this study is to examine students’ use of inscriptions in sucha project-based learning environment. The central questions for the study are (1) what arethe characteristics of students’ inscriptional practices?, (2) in what ways do the inscriptionalpractices interact with students’ understandings about concepts and inquiry processes?, and(3) what are the resources provided by the teacher and the learning environment supportingstudents’ enactment of inscriptional practices?
We use a naturalistic approach (Guba & Lincoln, 1994; Moschkovich & Brenner, 2000) toportray the emergence and evolution of inscriptional practices within the learning commu-nity. This approach has been used by other studies to examine students’ learning practicesin real-life settings (Barab, Hay, Barnett, & Squire, 2001; Roth & Bowen, 1994). Throughexamining the inscriptional practices demonstrated by seventh graders, this study aims atproviding insight into theoretical claims regarding the value of using scientific inscrip-tions at the middle school level (Roth & McGinn, 1998) and the impact it has on sciencelearning.
854 WU AND KRAJCIK
THEORETICAL BACKGROUND
This study takes a social practice perspective to exploring students’ use of inscriptionsin a project-based science classroom. Central to this perspective is the idea of learningthrough and engaging in social practice (Brown, Collins, & Duguid, 1989; Lave & Wenger,1991). It suggests that when students learn inscriptions they learn to do activities about andwith inscriptions. Therefore, rather than examining students’ graphing skills and mentalstructures, this study focuses on their learning practices in inscriptional activities that involvecreating, interpreting, and critiquing inscriptions.
According to Wenger (1998), practice is more than just doing and does not exist inisolation: “it is an action of doing in a social and historical context that gives structureand meaning to what we do” (p. 47). Practice in a context involves explicit instruction,subtle cues, underlying assumptions, and embodied understandings that are shared withand co-constructed by members in a community (Lave & Wenger, 1991). To capture thecomplex nature of practice, the foci of our analyses are on content and patterns of classroomdiscourse, teaching and learning sequences involved in inscriptional activities, and resourcesstudents used to carry out their practices.
The prominent role language plays in learning practices has been recognized by re-searchers in science education (Kelly & Chen, 1999; Lemke, 1990). Class members createparticular ways of talking, thinking, and interacting that shape and are shaped by the com-municative processes of class discourse. These discourse processes are rule-driven thatallow and exclude what and how scientific knowledge is practiced and constructed throughclass interactions (Wu, 2003). Classroom discourse therefore is an important source of dataon students’ inscriptional practices. A detailed analysis of the history, content, and dis-cursive pattern of classroom discourse can reveal the meanings and purposes of students’practices.
In addition to class discourse, the regular teaching and learning sequences of inscriptionalactivities are one of the primary ways that inscriptional practices get enacted. Analyses ofregular teaching and learning sequences could provide insight into a question of how stu-dents’ inscriptional practices evolve over time. Moreover, by identifying regular sequences,the occurrence of trouble and repair become salient (Jordan & Henderson, 1995). Troublesare interruptions of regular instructional and learning sequences. Troubles typically happenwhen the usual roles taken by class members change, when teachers introduce new ideasand skills, or when students do not have sufficient skills or knowledge to engage in desirablepractices. Troubles could also indicate insufficient resources or a lack of common knowl-edge among members. Analyses of the regular sequences and the occurrence of troublecould help identifying students’ difficulties in demonstrating certain inscriptional practices.
Students could demonstrate expert-like behaviors when sufficient social and materialresources are available to support learning processes (Kozma, 2000a). Resources couldbe “any piece of information, object, tool, or machine” (Roth, 1996, p. 191) that supportparticipants to enact a practice. In addition to materials and technological tools, resourcesinclude those of a conceptual nature and those of a social nature. For example, understand-ings of the context become a resource as they allow students and scientists to interpretgraphs (Preece & Janvier, 1992). Resources afford students to accomplish tasks and todemonstrate inscriptional practices (Gibson, 1977). The focus on resources is particularlyimportant for understanding how features in a learning environment promote students todevelop competent inscriptional practices.
Taken together, the constructs described above (i.e., practice, discourse, regular learn-ing sequence, and resource) constitute a framework that guides our analyses of students’inscriptional practices.

INSCRIPTIONS AND MIDDLE SCHOOL SCIENCE LEARNING 855
TYPES OF INSCRIPTIONAL PRACTICES IN SCIENCE
In this study, we identified four types of inscriptional practices demonstrated by scientistsand used them as an initial model of our analysis. First, scientists use tools or instrumentsto construct and generate inscriptions for various purposes, such as organizing data andhighlighting information (Latour, 1987). These instruments could be paper and pencil,computers, or machines that generate, record, and transform signals or readings into amaterialized form.
Next, scientists read and interpret inscriptions. If constructing inscriptions is viewedas transforming a phenomenon or a conceptual entity into another form, then interpretingcould be viewed as a reverse process of construction. Interpreting is a process of gener-ating meanings out of an inscription and reconstructing the phenomenon or concept thatis represented by the inscription. Yet, the constructor and the reader of an inscription arenot always the same person. This increases the difficulty interpreting an inscription. Also,some inscriptions, such as chemical formula, convey substantial conceptual knowledge sointerpreting them requires understandings about concepts. Therefore, students’ interpretingpractices and their conceptual knowledge mutually influence or coevolve with one another(Kozma, 2000b).
A third type of inscriptional practice is reasoning. Scientists demonstrate various waysto reason about and with inscriptions (Kozma, Chin, Russell, & Marx, 2000). They useinscriptions to generate hypotheses, make predictions, elaborate ideas, construct evidence,justify arguments, and make conclusions. These reasoning processes may involve resourcesthat could be material (e.g., a visualization tool) or social (e.g., supports from peers orteachers).
After constructing inscriptions, scientists use particular criteria, instruments, and valuesystems to critique and determine the quality or accuracy of inscriptions (Schank, 1994).Similarly, within a learning community, students need to generate (or be introduced byteachers) criteria to evaluate the quality of inscriptions that are consistent with those usedin the scientific community (diSessa, Hammer, Sherin, & Kolpakowski, 1991). Thus, theprocesses of generating criteria and critiquing each other’s inscriptions are regarded ascritiquing practices in this study.
METHODS
Guided by the framework described previously, this study is a long-term, classroom-basedinvestigation designed to examine students’ interactions and practices in a project-basedscience (PBS) context. A naturalistic approach is taken to study the dynamic and ongoinglearning process in two PBS classrooms.
The Learning Environment
Two seventh-grade science classes (27 students: 16 girls and 11 boys) at an independentschool participated in this study. Among the participants, 25 students were white and twowere Asian American. The school located in a Midwestern university city offered grades6–12 and enrolled approximately 75 students per grade. Although it was not a school forgifted students, it had an admission process that generally admitted students from the uppertwo-thirds of standardized test norms.
The science teachers at the middle school had been working with university researchersto develop and implement interdisciplinary, integrated, project-based science curricula(Novak & Gleason, 2000). The teachers regularly met before the first class period for

856 WU AND KRAJCIK
planning curriculum, creating materials, sharing handouts, and discussing students’progress. The two teachers participated in this study were Ms. Adams and Ms. Clement.1
Ms. Adams had 10 years of teaching experience, a bachelor’s of science (BS) with a majorin broad field science and a master’s of art (MA) in adolescent development. Ms. Clementhad 28 years of teaching experiences, a BS degree with a major in biology, and a MA degreein special education. Both teachers had secondary science teaching credentials.
The goal of the science program was to promote students to develop in-depth and inte-grated understandings of fundamental science concepts and process skills within a context ofinquiry, including using a variety of scientific inscriptions throughout the program. Duringeach school year, the students explored several science units that incorporated fundamentalscience concepts across several science disciplines. The instructional units were built aroundfive features of project-based science (Krajcik, Blumenfeld, Marx, & Soloway, 1994):(1) driving question, (2) artifacts, (3) long-term scientific investigation, (4) collaboration,and (5) learning technologies. Each unit began with a driving question that provided stu-dents with a real-life context. Students worked collaboratively with their group membersand conducted a long-term investigation of the driving question and related subquestions.Teachers provided substantial supports as students engaged in inquiry through activitiessuch as asking questions, collecting data, analyzing data, creating graphs, presenting ideas,and generating conclusions (Krajcik et al., 1998). Students developed a series of artifactssuch as concept maps, science reports, models, and their learning performances were eval-uated by multiple ways. Additionally, students were provided with a variety of learningtechnologies to carry out their scientific investigations. This instructional approach wasconsistent with the National Science Education Standards (NRC, 1996).
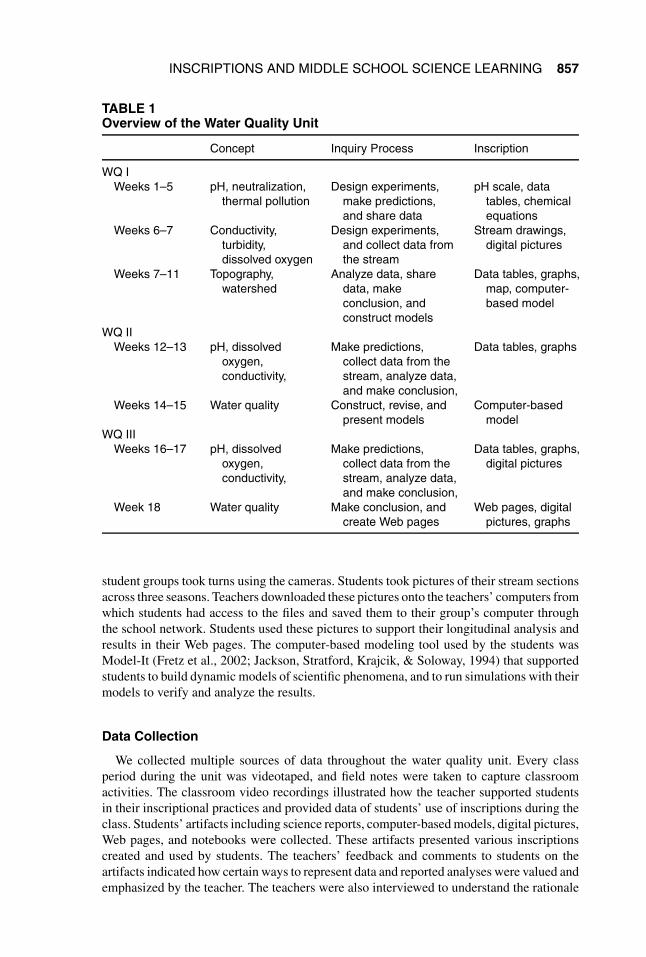
The Water Quality unit, the focus of this study, was the first time that most of the seventhgraders were exposed to a project-based instructional approach. Before the unit, the studentswere not familiar with the PBS features, including an emphasis on asking questions and theuse of technological tools. The Water Quality unit was taught in three subunits during theschool year (see Table 1). The students engaged in three rounds of data collection throughoutthe unit to investigate changes in water quality over a year. We refer to these three subunits asWater Quality I (WQ I in the fall season), Water Quality II (WQ II in the winter season), andWater Quality III (WQ III in the spring season). The unit began with a driving question aboutthe health of the stream behind the school and integrated a variety of inscriptions (e.g., streamdrawings, digital pictures, graphs, data tables, and models) into students’ investigations ofstream quality. The teachers used mini-lectures, class discussions, experiments, and groupactivities to introduce key ideas in science, including fundamental concepts and the processof inquiry. During each subunit (i.e., WQ I, II, and III), students explored the stream qualityby conducting various water quality tests including pH, conductivity, turbidity, dissolvedoxygen, and temperature change. They then analyzed the data, reported their analyses,generated conclusions to answer their driving question, and created artifacts to representtheir understandings.
Students used a variety of learning technologies (e.g., portable technology, computer,digital camera, and computer-based modeling tool) throughout the project. The portabletechnology used by the students was “emate” produced by Apple® which looked similarto a small laptop computer with an 8-inch touchable screen, a plastic pen, and a keyboard.Students attached different types of probes to the emates to collect water data, such astemperature, conductivity, pH value, and dissolved oxygen (DO). In addition, five Olympus®
D-360L cameras were used to capture pictures of the stream. With six groups in the class,
1 Pseudonyms for the teachers and students that maintain their gender and ethnicity are used throughoutthis paper.
INSCRIPTIONS AND MIDDLE SCHOOL SCIENCE LEARNING 857
TABLE 1Overview of the Water Quality Unit
Concept Inquiry Process Inscription
WQ I
Weeks 1–5 pH, neutralization,
thermal pollution
Design experiments,
make predictions,
and share data
pH scale, data
tables, chemical
equations
Weeks 6–7 Conductivity,
turbidity,
dissolved oxygen
Design experiments,
and collect data from
the stream
Stream drawings,
digital pictures
Weeks 7–11 Topography,
watershed
Analyze data, share
data, make
conclusion, and
construct models
Data tables, graphs,
map, computer-
based model
WQ II
Weeks 12–13 pH, dissolved
oxygen,
conductivity,
Make predictions,
collect data from the
stream, analyze data,
and make conclusion,
Data tables, graphs
Weeks 14–15 Water quality Construct, revise, and
present models
Computer-based
model
WQ III
Weeks 16–17 pH, dissolved
oxygen,
conductivity,
Make predictions,
collect data from the
stream, analyze data,
and make conclusion,
Data tables, graphs,
digital pictures
Week 18 Water quality Make conclusion, and
create Web pages
Web pages, digital
pictures, graphs
student groups took turns using the cameras. Students took pictures of their stream sectionsacross three seasons. Teachers downloaded these pictures onto the teachers’ computers fromwhich students had access to the files and saved them to their group’s computer throughthe school network. Students used these pictures to support their longitudinal analysis andresults in their Web pages. The computer-based modeling tool used by the students wasModel-It (Fretz et al., 2002; Jackson, Stratford, Krajcik, & Soloway, 1994) that supportedstudents to build dynamic models of scientific phenomena, and to run simulations with theirmodels to verify and analyze the results.
Data Collection
We collected multiple sources of data throughout the water quality unit. Every classperiod during the unit was videotaped, and field notes were taken to capture classroomactivities. The classroom video recordings illustrated how the teacher supported studentsin their inscriptional practices and provided data of students’ use of inscriptions during theclass. Students’ artifacts including science reports, computer-based models, digital pictures,Web pages, and notebooks were collected. These artifacts presented various inscriptionscreated and used by students. The teachers’ feedback and comments to students on theartifacts indicated how certain ways to represent data and reported analyses were valued andemphasized by the teacher. The teachers were also interviewed to understand the rationale

858 WU AND KRAJCIK
behind the curriculum design and their perceptions about the use of scientific inscriptionsin the unit. The interviews were transcribed and later analyzed.
Data Analysis
To answer the research questions, we followed analytic steps suggested by Erickson(1986) and Jordan and Henderson (1995). We first reviewed the field notes, identifiedepisodes on the videotapes that involved inscription activities, and transcribed these episodesverbatim into text files. Episodes were defined as “smaller units of coherent interactionwithin events” (Jordan & Henderson, 1995, p. 57). The episode transcripts and interviewtranscripts were then imported into a database for coding. The database was organized usingthe NUD∗IST analysis software (Qualitative Solutions, Melbourne, Australia).
The codes used to analyze the transcripts were generated based upon our theoreticalframework and emerged from a review of the data corpus. We identified four types ofinscriptional practices, i.e., constructing, interpreting, reasoning, and critiquing, from theliterature. Another type of practice, presenting, emerged from the data management process.We used a set of analytic tools suggested by Strauss and Corbin (1998) to facilitate the codingprocess and developed a coding scheme that included types of inscriptions, inscriptionalpractices, inquiry areas (Krajcik et al., 1998), and teacher scaffolds. We defined scaffoldas assistance that allowed students to accomplish tasks they could not do alone (Palinscar& Brown, 1984; Wood, Bruner, & Ross, 1976). Once these transcripts were coded, weextracted episodes that were identified by one or more codes (such as episodes containingconstructing practice [inscription practice code] and asking questions [inquiry area code])and created reports.
We then read through these reports and identified coding categories for the second levelof coding. These categories included tools and resources used to support practices, criteriaindicated by the class members about the quality of practices or inscriptions, characteristicsof an inscription created by the class members, and formats of an inscription. We reviewedthe reports, abstracted information around these categories, and generated descriptions andanalytical notes to generate themes. Themes were recurrent activities that emerged fromthe descriptions and notes. We searched for confirming and disconfirming evidence fromdifferent sources of data to triangulate our interpretations and to increase the credibility(Erickson, 1986).
FINDINGS
In this section, we describe how students used inscriptions when they engaged in inquiryactivities. Each subsection opens with a general description of the finding and is followed byexamples and segments drawn from the data. These examples provide evidence of students’inscriptional practices and illustrate the findings in detail.
Interrelationships Among Inscriptional Practices
In the unit, there were 10 types of inscriptions used: data tables, models, chemical rep-resentations, maps, tables, pH scales, digital pictures, graphs, stream drawings, and Webpages. Among them, six of them (i.e., data tables, models, digital pictures, graphs, streamdrawings, and Web pages) were constructed by students and involved in two or more in-scriptional practices. For example, each student group was assigned to a portion of thestream to conduct their water quality investigation. They identified three locations withinthe portion for data collection and created a hand-drawing map (stream drawing) to record

INSCRIPTIONS AND MIDDLE SCHOOL SCIENCE LEARNING 859
visual features of the three locations. Later the drawings were used to make predictions andto explain the results of their investigation. Thus, making predictions, creating a drawing,and using the drawing to explain results were three drawing-related learning activities. Inorder to make the drawing useful for their investigation, students had to capture visualfeatures of the three locations (e.g., grass, bubbles, and waterfalls) because these featurescould provide useful information for interpreting their test results, such that a location withwaterfalls might have higher amount of dissolved oxygen. Thus, the enactment of construct-ing practices with stream drawings (e.g., what features should be captured in a drawing andhow detailed a drawing should be) could influence students’ engagement in reasoning prac-tices (e.g., what predictions and explanations could be made from the drawings). Below wepresent students’ reasoning practices with digital pictures to further illustrate the point.
In the water quality unit, digital pictures were constructed to make predictions and to serveas evidence that supported arguments students made in their Web pages. This was the firsttime students used digital pictures as evidence. When engaging in this type of reasoningpractice, student groups formulated an argument and then searched for an appropriatephoto to support it. In the evidence-searching process, they usually modified or changedtheir argument based on the availability of the evidence. The following segment shows anexample in which Cynthia and Smita chose digital pictures to support an argument aboutdead grass increasing the conductivity level.
Segment 1: Reasoning practices with digital pictures
1 (CV122A) Cynthia and Smita are looking for digital pictures that could be used in2 their conductivity Web page.3 Smita: We’re going to use the litter and we’re going to say that is dissolved4 substances.5 Cynthia: okay.6 Smita: I know where the picture is. I have a picture.7 Smita opens a folder, searches for picture, and finds a picture of grass.8 Smita: See all this lawn. When it dies, they increase the conductivity.9 They copy the image and insert the image to the conductivity page.
10 Smita: Let’s make it smaller. Okay.11 Cynthia resizes the picture and changes the font.12 Smita types in the caption: “all of this lawn will one day die causing”13 Cynthia: Will die.14 Ms. Adams (T) stops by to check their progress.15 T: So, you guys are almost done?16 Smita: We still have a lot though.17 T: They will cause high conductivity level because? [Reading the caption on the18 screen.]19 T: Do you have another picture? Do you have another picture for this? So this is20 spring or fall, and we have pictures of winter or something whenever it’s dead,21 right? So you know what? You can split it and put a smaller one, nice and green,22 and then winter, dead.23 Smita: We don’t have a picture of winter.24 T: I have a folder [in the teacher station] that says winter stuff on that.25 Smita: Okay, sure.26 T: It’s in the digital thing [folder]. That says winter [folder name].27 Smita: Okay.28 Smita and Cynthia resize the picture.29 Smita: Make it smaller.

860 WU AND KRAJCIK
30 Smita and Cynthia split the cell into two. They then find a dead grass picture31 from picture folders in the teacher’s station and insert two pictures into their32 Web page.
Prior to searching for pictures, Smita already formulated an argument about litter andknew what picture she needed (line 3), but she did not find a picture that showed exactlywhat she wanted. Similarly, Charles and Stefon, another target student pair, did not findpictures they needed and went out to take more pictures (CV120A). It seems that studentsdid not think about how they would use these pictures when they took them. When theywere asked to use photos to explain their results, they either had to go out to take morepictures or select a picture that did not exactly capture what they wanted to illustrate.Among the available pictures, Smita chose a grass picture (lines 6,7) to explain an increasein conductivity during the winter. To better support the statement that “all of this grasswill die,” the teacher suggested that they insert a picture of dead grass (lines 18–21). Theytook up the teacher’s suggestion and used two pictures to show the seasonal changes ofgrass. Cynthia and Smita’s segment shows that students were able to use digital picturesas evidence to support their arguments about test results. However, the argument shown inthe figure caption was made to match the pictures that were available. It was not consistentwith the arguments made in the data analysis shown on the same Web page (Figure 1).
In their conductivity analysis (Figure 1), Smita and Cynthia explained that the conduc-tivity level was higher in the winter because of salt on the road. They attributed the highconductivity level in the spring to the use of fertilizers. There was no discussion about deadgrass increasing the conductivity level in the winter. To support the arguments made intheir analysis, Cynthia and Smita should have used pictures of salt on the roads, run-off,or fertilizers. The lack of such documentation could be attributed to the different focusesof attention students had when they engaged in constructing and reasoning practices withdigital pictures. When the digital pictures were taken early in the unit, they were not takento support students arguments. Students just took pictures for the locations where they col-lected data. During WQ II, when Stefon and Charles were asked how they decided whatpictures to take in the stream, Stefon answered (CV087A), “we want to take pictures foreach one of our locations.” Because students did not purposely capture certain features intheir pictures and did not keep records with them (e.g., where and why a picture was taken),
Figure 1. The analysis paragraph shown in Cynthia and Smita’s conductivity Web page. [Color figure can be
viewed in the online issue, which is available at www.interscience.wiley.com.]

INSCRIPTIONS AND MIDDLE SCHOOL SCIENCE LEARNING 861
it was not surprising that they could not find appropriate pictures to explain their results.As shown in Segment 1, Cynthia and Smita looked for available evidence to support anyargument relevant to the conductivity test, even though the arguments were different fromthose written in their analysis.
This case suggests that the enactment of constructing practices interacted with the en-actment of reasoning practices when the same inscriptions were involved. However, asfirst-time users of digital cameras, students did not recognize or foresee the potential in-terrelation among inscriptional practices so some digital pictures were unable to servereasoning purposes that they had to accomplish later. More scaffolding might be neededto help students recognize the interrelations among different inscriptional practices so thatthey could construct useful inscriptions for the enactment of other inscriptional practices.
Inscriptional Practices and Understandings About Concepts
and Inquiry Processes
Although students did not realize interrelations among inscriptional practices, engaging ininscriptional practices provided students with opportunities to have thoughtful discussionsabout inquiry processes and scientific concepts. Below we present two examples.
In WQ I, creating data tables was part of designing an investigation. Through creatingthese data tables, students reviewed procedures of the investigation, decided what informa-tion should be collected, defined measurement to make, and managed data collection. Thefollowing segment shows a typical example. Ally and Alan reviewed procedures of theirpH experiment and brought up their understandings about pH as they created a table fortheir pH experiment.
Segment 2: Constructing practices with data tables
1 (CV006C, EP 1) Students in Class II plan procedures for their pH experiment.2 Ms. Clement (T) wants them to “include what data table would look like to gather3 the information that you need.” Alan and Ally work together.4 Ally: Let’s make a chart.5 Alan: Yes.6 Ally: So it could be like something [substances] in the first column.7 Ally sketches a table on her notebook.8 Alan: Okay [looking at Ally’s notebook].9 Ally: Oh, so what kind of data are we getting out of it? Are we getting numbers,
10 color or what will we get?11 Alan: We’re getting pH level.12 Ally: In numbers? [Ally looks at another girl at her table. The girl answers her13 question, “It’s number.”]14 Ally: Okay, so we can have like trial 1, trial 2 [Drawing columns on her15 notebook.]16 Alan: Oh, good.17 T talks to the class: You don’t fill in any numbers, but what are the categories you18 will place into your data table?19 Alan: Oh. [He turns to Ally.]20 Alan: So we need neutral, basic, and acidic.21 Ally asks T: Are we supposed to have like this? [Ally shows T her table.]22 T: Yes, yes. Something like this.23 Ally: What else do we add to it though?24 Alan: Then from this side, we try to put like neutral, basic, and acidic and draw a

862 WU AND KRAJCIK
25 line. Put a check if it’s. . .26 Ally: You won’t know what they are until you fill it out.27 Alan: Yeah. But after we’re doing the graph, we. . .28 Ally: You put substances down, and you put that [trial 1] down, you put that [trial29 2] down, you put that [trial 3] down, write average, and then basic or acidic,30 and put that down.31 Alan: Okay, so we’re doing. . . we figure out what they are and in the end.32 Ally: And the trial pH level whatever it is. Is it acid middle? Or whatever is put33 here.
Ally first had a question about data format (lines 9–14). She was then confused aboutcreating a table without any data (line 25), and Alan’s suggestion about having a columnabout neutral, basic, and acidic (line 23) did not make sense to her. With the scaffoldingprovided by the teacher and Alan, Ally was able to conceptually go through the experiment(lines 27–29) and took up Alan’s suggestion although she was not certain about the pHrange of acid (lines 31, 32).
In this segment, Ally and Alan’s understandings about pH and the experiment wereprovoked and their confusions were revealed when they designed a data table. Ally’s con-structing practice was constrained by her limited understanding about the procedures ofthe experiment and the pH range of acid. This shows that inscriptional practices involvednot only the structure of an inscription and the data represented by it, but also the inquiryprocess and relevant concepts.
The second example also provides evidence of how inscriptional practices supported dis-cussions about science concepts. In Segment 3, Stefon and Charles engaged in a discussionof whether they should make a relationship between two variables, “sun” and “turbidity.”When engaging in inscriptional practices with models, students exchanged information,shared and clarified ideas, gave and received feedback. Models became artifacts of theiremergent understandings about water quality.
Segment 3: Model construction I
1 (PV169, Build Mode, 9:25 AM) Charles and Stefon’s model is to answer the2 question of “what are the effects and causes of thermal pollution?” They create a3 relationship between turbidity and thermal pollution in the build mode and start4 discussing whether they should connect turbidity to the sun variable (Figure 2).5 Stefon: Actually, you got to say the sun. You got to connect it to the sun.6 Stefon: Should we connect to these two [turbidity and sun]? [The cursor is7 moving between turbidity and sun.]8 Stefon: The sun heats up the stream.9 Charles: The stream is turbid.
10 Stefon: So why don’t just connect this [sun] to that [turbidity]? Everything will be11 fine.12 Charles: So sun goes to turbidity?13 Stefon: Because sun is the cause and it affects the turbidity and it also affects14 thermal pollution.15 Stefon: It causes the heat. It puts the heat into the turbidity.16 Students create a causal relationship between sun and turbidity.17 Stefon: Oh, wait, that’s wrong. [Reading the textual description on the top of the18 relationship editor (see Figure 3)] As the sun heat increases, turbidity increases.19 Charles: Yah.20 Stefon: That’s wrong. Cancel.

INSCRIPTIONS AND MIDDLE SCHOOL SCIENCE LEARNING 863
Figure 2. Charles and Stefon’s water quality model. [Color figure can be viewed in the online issue, which is
available at www.interscience.wiley.com.]
Stefon and Charles understood that sun heat (heat energy from the sun) affects thermalpollution when the stream is turbid (lines 8–14), but a simple causal relationship betweensun and turbidity did not represent what they meant. The textual description providedby Model-It helped students realize that the relationship between heat from the sun andturbidity was not causal. This realization led Stefon to cancel the relationship (lines 17–20). Line 20 signaled a trouble. Stefon and Charles were not the only pair who had difficultiesrepresenting their understandings about heat from the sun, turbidity, and thermal pollution.As shown in Segment 4 that occurred in the same class period, all three groups that modeledthe same question about thermal pollution had difficulty. Ms. Adams (T) used this commonconfusion as a learning opportunity and gathered the three groups to discuss the relationshipsamong heat from the sun, thermal pollution, and turbidity. Through a group discussion,students shared ideas (lines 34–52) and clarified their understanding.
Segment 4: Model construction II
21 (CV095A, 9:41 AM) T notices that the three groups [Annie/Carla, Cynthia/Smita,22 Charles/Stefon] who are creating models about thermal pollution have the same23 difficulty in making connections among heat from the sun, turbidity, and thermal24 pollution. She gathers them together to discuss a solution. Ms. Adams first asks25 students “what can the weather and the sun do?” Students volunteer their ideas26 that sun could directly warm up the stream, warm up the particles in the stream,

864 WU AND KRAJCIK
Figure 3. The relationship editor of heat from the sun and turbidity that provided a textual description, a
line graph, and a BECAUSE statement. [Color figure can be viewed in the online issue, which is available at
www.interscience.wiley.com.]
27 and hit sidewalks and pavement.28 T: Let’s hold this idea that it hits the sidewalks or parking lots or rooftops. Okay29 now this is the question that I posted to them yesterday. We have some days with30 sunshine in February, right?31 Stefon and Charles: Yap.32 T: And if we have sunny days in February and sunny days in July. How might33 those compare in terms of their effects on thermal pollution?34 Carla: Not really, I mean if there’s whole stream.35 Several students are talking at the same time.36 Charles: It [water temperature] wouldn’t change, would it?37 T: Well, I don’t know.38 Charles: If the stream is really cold, the water would be very cold, too. It39 wouldn’t be that much difference, ‘cause in July, the water will be warm, but it40 heats it up more, too.41 T: Okay.42 Annie: If it’s winter, water would be colder. And if the sun heats it up, it probably43 heats it up as much as it does in the summer.44 Charles: But the stream is already hot, it’s not going to be heated up.45 Carla: But it might rain more.

INSCRIPTIONS AND MIDDLE SCHOOL SCIENCE LEARNING 865
46 Stefon: Sometimes I remember sometimes in the winter, if it’s sunny, it’s probably47 colder outside.48 T: What about the temperature of the roads, the buildings, and the sidewalks?49 Charles: Maybe colder.50 Annie: They heat up in summer.51 Charles: There’re seasons. You need a season variable. That will connect to your52 sun variable that will connect to your turbidity variable.
Students’ responses to Ms. Adams’s question (lines 25–27) indicate that they had someunderstandings about how heat from the sun might directly or indirectly warm up the streamand cause thermal pollution. They also realized that the heat from the sun does not alwayscause thermal pollution (lines 34–36). Ms. Adams’s questions about the weather in differentseasons (lines 32, 33) became crucial for students to rethink about the relationship betweenheat from the sun and thermal pollution. Her questions led a productive discussion amongstudents (lines 34–52) that clarified the ideas and deepened their understandings aboutthermal pollution. At the end of the segment, Charles realized that what they needed was aseason variable that could mediate the relationship between heat from the sun and turbidity.
The two segments show that through constructing models students’ confusion about cer-tain concepts was revealed. Models had affordances for transforming students’ conceptualknowledge into a series of causal relationships and representing their emergent understand-ings of a specific topic. The segments also indicate the importance of teacher scaffoldingand peer interactions to support students in accomplishing inscriptional tasks.
Together Segments 2–4 show that using inscriptions could initiate and mediate thoughtfulclass discussions. When engaging in these discussions with inscriptions, students applied,reviewed, and externalized their understandings about concepts and inquiry processes.
Inscriptional Practices and Characteristics of Inscriptions
The decision of how inscriptions were used in the unit was made by the design of inquiryactivities as well as the characteristics of inscriptions. Analyses of classroom activity dataand students’ artifacts indicated that different inscriptions were used for different purposesin different inscriptional practices. For example, Segments 3 and 4 show that models allowedstudents to externalize their conceptual understandings through building causal relationshipsamong variables. Below we present an example of digital pictures. Although students haddifficulties using digital pictures to make a coherent argument, the visual nature of thesepictures supported students in developing links among stream features, concepts, and testresults.
In WQ I, students took pictures of their stream section to make predictions. When view-ing the pictures, students identified stream features shown in pictures, discussed whetherthese features would impact the stream quality, and predicted test results based on qual-ity standards and their understandings about how a test (e.g., conductivity and turbidity)was measured. The following segment shows a typical example in which Ally and Denny(Class II) discussed features they saw from the pictures and made predictions for waterquality tests.
Segment 5: Making predictions with digital pictures
1 (CV043C) Ms. Clement reminds students that the pictures they took are prompts,2 which help them make predictions in their part of the stream. She then shows3 them where picture folders are. Students work in pairs and use graphic converter4 to view their pictures. Denny and Ally open a picture file of one testing location.

866 WU AND KRAJCIK
5 They first predict turbidity results of the stream section.6 Denny: Excellent? [Looking at the screen.]7 Ally: But there’s stuff here [pointing to the screen].8 Denny: It’s like. . . [Moving toward the screen to take a close look at it.]9 Ally: Can I see another one and then we can compare to that one?
10 Denny: Okay. [He opens another picture file.]11 Ally: I think turbidity will be fine. What else? DO?12 Denny: Well, it’s [the water is] moving [He is not looking at the picture. The13 comment is made based on what he observed yesterday], so I guess it’s pretty14 good.15 Ally: So will it [D.O.] be excellent?16 Denny: I think it’s good, ‘cause there’s no plant there. So it’s good.17 Ally opens a picture of the second testing location.18 Ally: I think it looks pretty bad, isn’t it?19 Denny: Well, you can’t see the bottom.20 Ally: Look at all that stuff. It looks weird. I think the turbidity is bad. I say it’s21 really poor.22 Denny: I think it’s not that terrible. Fair, maybe.23 Ally: DO?24 Denny: I think there’s something in there.25 Ally: You’re right. DO is good.
In this segment, Ally and Denny made predictions by viewing digital pictures they tookthe day before. Based on what they saw from the pictures (lines 7, 16) and what theyobserved (lines 12–14), they made predictions for the tests. Ally and Denny knew thatcertain features in the stream indicated whether water quality would be excellent, good,fair, or poor. For different tests, therefore, they looked for different features shown in digitalpictures. They made predictions about dissolved oxygen based on whether the water wasmoving (line 12) and whether there were plants in water (line 16). When predicting turbidity,Ally and Denny focused on whether there was something in the water (line 20).
This segment shows that students were able to use digital pictures to show featuresof the stream and to make predictions based on the visual information represented by thepictures. Their discussions about predictions involved understandings about tests and relatedconcepts. For example, when they predicted turbidity, Denny and Ally’s discussions aboutwhether there was something in the water suggest that they understood that turbidity wasdetermined by the amount of suspended substances in the stream. They also realized thatmoving water would contain more dissolved oxygen.
However, analyses of this segment and other class activity data also show limitations ofusing digital pictures as the only resource to make predictions. Resolution of the pictureswas determined at the moment the pictures were taken. If the pictures did not show enoughdetails, students’ reasoning practices could be interrupted. As shown in lines 7 and 8, Allysaw something in the stream, but they were not certain about what they saw so they neededother pictures to validate Ally’s idea. Similarly, Olisa and Nathan (CV043C) had difficultiesidentifying some features from a picture. When they enlarged the picture, it looked blurreddue to the low resolution so they had to decide whether they should ignore these featuresor try to search for other pictures to confirm their observations. Additionally, some streamfeatures that supported students in making certain predictions might not be captured bydigital pictures. For example, pictures could not clearly show the depth of the stream andthe speed of current so Denny’s comment on water movement (line 12) was made by hisobservation instead of what he saw from digital pictures.

INSCRIPTIONS AND MIDDLE SCHOOL SCIENCE LEARNING 867
Therefore, by providing rich visual information, digital pictures could help students makepredictions and construct links among concepts, observations, and features of the streamrepresented in the pictures. Yet, digital pictures should not be the only source for makingpredictions because they have certain limitations. Students should combine other sourcessuch as observations on physical features of the stream when making predictions.
Inscriptional Practices and Use of Resources
In this PBS unit, students’ inscriptional practices were supported by various social, mate-rial, and conceptual resources. Social resources included teachers’ scaffolds and peer inter-actions. The segments presented earlier suggest that teachers’ scaffolds such as questioning,modeling, elaboration, and explaining served as crucial supports for students’ enactment ofinscriptional practices. For example, in Segment 1 (Reasoning practices with digital pic-tures), the teacher helped Cynthia and Smita demonstrate reasoning practices with digitalpictures. By incorporating pictures in their Web page, Cynthia and Smita made a convincingargument about seasonal changes and conductivity, although the argument differed fromthe one they made in their analysis on the same Web page. When students constructedmodels and encountered difficulty in making a relationship between heat from the sun andturbidity, the teacher gathered students and created an interactional space (Heras, 1993) forstudents to share and co-construct understandings. Additionally, students benefited frominteracting with peers by exchanging information, sharing and clarifying ideas, and givingand receiving feedback. The big group discussion in Segment 4 (Model construction II) isone of the examples.
Material resources, including textbooks, curriculum materials (e.g., guideline sheets),learning technologies, and the inscriptions students constructed early in the unit, also playedan important role in supporting students engagement in inscriptional practices. For example,the textual description provided by Model-It helped students realize that the relationshipbetween heat from the sun and turbidity was not a simple causal relationship.
As conceptual resources, students’ experience and knowledge developed from previousinscriptional practices provided them with understandings about certain ways to organize,transform, and link data or concepts that could be applied to a different context with a dif-ferent type of inscription. For example, students’ modeling experience became a conceptualresource when they created Web pages. The following segment took place in WQ III whenMs. Adams (T) demonstrated how to use Netscape Composer® to create Web pages. Toengage students in writing background information for each test page, Ms. Adams indicatedthe similarity between constructing a model and writing the background (lines 7–23).
Segment 6: Constructing practices with Web pages
1 (CV104A) During the Web page demonstration, Ms. Adams (T) indicates that each2 of students’ test Web pages should include “background” about the test.3 T: Background would be, I think that there will be a lot of thermal pollution,4 maybe ten degrees difference, because what kind of background will you put in5 there?6 No student answers the question.7 T: Think about Model-It. What is the whole purpose of Model-It? Show what?8 Students: Relationships.9 T: Relationships, okay. So, if you think we’re going to have high temperature
10 differences, what do we need to talk about temperature?11 Stefon: Thermal pollution.12 T: If you think there’s going to be thermal pollution, okay, that’s the effect. Then

868 WU AND KRAJCIK
13 what’s the background you want to say? Think about relationships. Think about14 working backwards.15 Cynthia: There’s like turbidity in the water.16 T: So that’s one of the reasons or the causes, right? So in Model-It, think of the17 things you put in Model-It, causes and effects. Remember all of your models18 were supposed to show the causes of something and the effects of something.19 These reasons are going to say why, what are the causes, so as the result the effect20 is what you’re predicting, right? Go and look at your fall and your winter21 predictions and take a look at my feedback.
To help students understand what information should be included and how the infor-mation should be organized in the background, Ms. Adams reminded students of theirmodeling experiences (lines 7, 8). One salient characteristic of modeling was to createcausal relationships between variables. Stefon and other students’ responses indicated theirrecognition of this feature (lines 8, 10, 12). Ms. Adams then reinforced the idea of incorpo-rating causes and effects in their background as students did in their models (lines 16–18).She also suggested including other resources such as predictions they made in previoussubunits and her feedback that would be helpful for students in writing their background(lines 20, 21).
In Segment 6, the teacher regarded modeling as a particular way of representing andlinking conceptual information that was to create causal relationships among variables. Byreminding students of this characteristic of modeling, Ms. Adams indicated the similaritybetween creating a model and writing background information for a Web page so thatstudents could realize the expectation of the task and engage in constructing practices withWeb pages with minimal difficulties. Students’ modeling experience and practices becamea conceptual resource that helped them engage in constructing a new inscription, Web page.The following background was written by Stefon and Charles on their Web page abouttemperature change.
Tempature [Temperature] change is the amount of change in degrees celsius [sic] from one
point of a stream to the end. This test helps us see if there is thermal pollution in the water.
Thermal polution [sic] can be caused by rain, chemicals, turbidity and factories. Sidewalks,
if hot, can heat up rain water and when it enetrs [sic] a body of water, it heats up the water in
a certain place, thus causing the temperature change to raise. Factories can dump chemicals
into the water and cause thermal pollution to occur. Thermal pollution is bad because it
causes less animals and plants to live there.
This background paragraph shows that Stefon and Charles did take up the idea of discussingcauses (i.e., rain, chemicals, turbidity, and factories) and effects (e.g., less animals and plantsto live) of thermal pollution. Although their description did not follow the discursive patternused in Model-It, that is, as one variable (a cause) increases/decreases, another variable (aneffect) increases/decreases (see Figure 3), they described the process of how a specific causeaffected temperature change.
The examples discussed above and the segments presented previously show that stu-dents drew on various resources when they engaged in inscriptional practices. Particularly,throughout the unit, students developed their inscriptional practices on a basis of their ownknowledge productions (i.e., inscriptions and associated practices) constructed early in theunit. As material resources, inscriptions created early in the unit provided students withconcrete ideas about structures that inscriptions could have, and data formats that couldbe transformed by an inscription. As conceptual resources, inscriptions and associated

INSCRIPTIONS AND MIDDLE SCHOOL SCIENCE LEARNING 869
practices provided students with experiences and understandings about certain ways toorganize, transform, and link data or ideas that could be applied to a different context.
DISCUSSION AND CONCLUSIONS
This study was designed to explore students’ use of inscriptions in a project-based learn-ing environment and to identify the resources provided by the learning environment thatsupported students’ enactment of inscriptional practices. The findings show that when theseventh graders were scaffolded by the teachers and provided with social, conceptual, andmaterial resources, they were able to use various inscriptions to demonstrate meaningfulinscriptional practices such as creating and using inscriptions to make arguments, to rep-resent conceptual understandings, and to engage in thoughtful discussions. This study ex-pands previous work reported in the literature (Bowen et al., 1999; Kozma, 2000b; Lynch &Woolgar, 1990) by showing that middle school students could also use inscriptions to con-struct scientific knowledge within a project-based learning environment.
Characteristics of Inscriptional Practices
This study indicates that constructing scientific inscriptions in a project-based learningenvironment was more than recording numbers or plotting data points. It occurred withdifferent inquiry activities such as making predictions and interpreting test results andinvolved various practices such as using tools to capture visual information, incorporatingseveral inscriptions into one, and creating relationships among variables to create a model.Additionally, the findings show that when creating an inscription, students had to considerthe functions of inscriptions in their inquiry so that the inscriptions could serve specificreasoning purposes. This suggests that middle school students’ use of inscriptions can gobeyond an “operational level” as proposed by Greeno and Hall (1997, p. 366). In this study,not only did students learn to create inscriptions by following conventions, but they alsolearned to realize how to create different inscriptions to serve different purposes.
Additionally, constructing inscriptions involves students’ knowledge about associatedconcepts as well as their understandings about how to represent the conceptual knowledgein a different form. In Segment 3, for instance, Stefon and Charles verbally describe therelationship between sun heat and thermal pollution (“because sun is the cause and it affectsthe turbidity and it also affects thermal pollution”), but they had difficulty representing it asa series of causal relationships in their model. This challenge became a learning opportunityfor students to improve their constructing practices and to advance their conceptual under-standings. The teacher gathered the three groups who modeled the same driving questiontogether and fostered a productive discussion that helped the students determine the relation-ships among sun, turbidity, thermal pollution, and seasons. Additionally, teachers playedan important role in framing such challenges as opportunities. Without the teacher’s inter-vention, the three groups might have ignored the problematic relationship and constructedrelatively simple models.
Furthermore, constructing practices with specific inscriptions can be distributed to an-other context. Segment 6 shows that students’ experience and practices on modeling couldserve as a conceptual resource and promote students’ engagement in constructing Webpages. As an inscriptional activity that students had experience with, modeling helped stu-dents make sense of Web page construction. This finding is consistent with the notionof “intertextuality” (Bloome & Egan-Robertson, 1993; Lemke, 1990) which means that“when we participate in an activity, read a text, or make sense of talk and other forms ofsocially meaningful action, we connect words or events up in familiar patterns” (Lemke,

870 WU AND KRAJCIK
1990, p. 204). As the teacher indicated the similarity between creating relationships inmodels and describing causes and effects in Web pages, an intertextual link between thetwo types of inscriptions was established. However, students might not know in what waysand under what conditions their learning experience or practice could serve as a conceptualresource. Making intertextual links could be a useful teaching strategy that helps studentsmake meanings of novel situations and events (Bloome & Egan-Robertson, 1993).
The findings also suggest that inscriptional practices might involve different levels ofdifficulty and complexity. Some inscriptional practices that could be enacted via groupcollaboration without much scaffolding, such as using digital cameras to capture visualinformation, creating a simple model, and inserting pictures into Web pages, seemed morelikely for seventh graders to demonstrate. Others that were scaffolded heavily by the teacherand were not enacted adequately until the end of the unit might be more conceptually com-plicated and sophisticated to these students. These practices include incorporating severalinscriptions into Web pages to make a coherent argument and constructing meaningfuldigital pictures for given reasoning purpose.
The Use of Inscriptions and Science Learning
This study suggests that using inscriptions and engaging in inscriptional practices couldhave positive impact on students’ understandings about concepts. Segments 2–4 show thatusing inscriptions provoked discussions about relevant concepts. As an object of practices,an inscription makes the content of conversations and the entity it inscribes (e.g., rela-tionships among the sun, turbidity, and thermal pollution) concrete and visible. Studentscould attach information to an inscription and modify its format and content to reflectupon their emergent understandings (Forman & Ansell, 2002). As Penner (2001) argued,“developing scientific understanding can be viewed as the appropriation of tools allowingstudents to build on their current knowledge while engaged in socially mediated activity”(p. 28). Inscriptions could be such tools. Additionally, different types of inscriptions (e.g.,digital pictures, models, and Web pages) as different notation systems could promote waysof knowing and doing science. That is, engaging in inscriptional practices might affectstudents’ understanding about how scientific knowledge is constructed and have epistemo-logical impact on science learning (Balacheff & Kaput, 1997). Possible interactions betweeninscriptional practices and students’ epistemological understanding about science could beexplored by future research.
The seventh graders in this study used some ready-made inscriptions (graphs and digitalpictures) create a new one (Web pages). What might students learn from incorporatinginscriptions into a new one? Lemke (1998) argued that as figures, graphs, tables, andcaptions are incorporated into scientific text, “scientific text is not primarily linear, it is notmeant to be read according to a unique implied sequence and represents a primitive form ofhypertext” (original emphasis, p. 95). Interpreting, constructing, and reasoning with multipleinscriptions require nonlinear ways of thinking and reading science, and allow students torepresent their ideas via hyperlinks. Segments 2–4 show that inscriptions could becomechangeable knowledge productions that demonstrate students’ emergent understandingsabout concepts and inscriptional practices.
Implications for Teaching
Through exploring seventh graders’ use of inscriptions, this study suggests some teach-ing practices and features in a learning environment that could promote the development ofcompetent inscriptional practices. First, exploiting the potential use of inscriptions might

INSCRIPTIONS AND MIDDLE SCHOOL SCIENCE LEARNING 871
provide students with more opportunities for science learning. In this study, some inscrip-tions were only used in one or two practices. These inscriptions indeed have capabilitiesfor students to engage in more inscriptional practices.
Next, sharing the driving question for models may be beneficial to engage students in in-depth discussions about the content of model and improve the quality of models. It supportsstudents to have large group discussions, to exchange ideas, and to co-construct their modelstogether.
Third, it is difficult for seventh graders to make a coherent argument by using evidencefrom different sources (Klahr, Fay, & Dunbar, 1993). Teachers could model how to makereferences and verbally relate inscriptions to written text, encourage students to identifythe argument they try to make, and remind them to make coherent arguments throughoutthe same inscription (e.g., science reports and Web pages).
Finally, to help students create meaningful inscriptions for reasoning purposes, whenstudents take digital pictures, teachers might require students to make annotations, recordthe reasons for taking pictures, and mark the locations where they take pictures on theirstream drawings. The annotations and records might later help students use these picturesas evidence and demonstrate meaningful reasoning practices.
The authors wish to thank Vincent Lunetta for his thoughtful comments on a draft of the manuscript.
REFERENCES
American Association for the Advancement of Science. (1989). Project 2061: Science for All Americans.
New York: Oxford University Press.
American Association for the Advancement of Science. (1993). Benchmarks for science literacy. New York:
Oxford University Press.
Balacheff, N., & Kaput, J. J. (1997). Computer-based learning environments in mathematics. In A. Bishop, K.
Clements, C. Keitel, J. Kilpatrick, & C. Laborde (Eds.), International handbook of mathematics education (pp.
467–501). Dordrecht, Netherlands: Kluwer.
Barab, S. A., Hay, K. E., Barnett, M., & Squire, K. (2001). Constructing virtual worlds: Tracing the historical
development of learner practices. Cognition and Instruction, 19(1), 47–94.
Blatchford, P., Moriarty, V., Edmonds, S., & Martin, C. (2002). Relationships between class size and teaching: A
multimethod analysis of English infant schools. American Educational Research Journal, 39(1), 101–132.
Bloome, D., & Egan-Robertson, A. (1993). The social construction of intertextuality in classroom reading and
writing lessons. Reading Research Quarterly, 28(4), 305–333.
Bowen, G. M., Roth, W.-M., & McGinn, M. K. (1999). Interpretations of graphs by university biology students and
practicing scientists: Toward a social practice view of scientific representation practices. Journal of Research
in Science Teaching, 36(9), 1020–1043.
Brown, A. L. (1992). Design experiments: Theoretical and methodological challenges in creating complex inter-
ventions in classroom setting. Journal of the Learning Sciences, 2, 141–178.
Brown, J. S., Collins, A., & Duguid, P. (1989). Situated cognition of learning. Educational Researcher, 18, 32–42.
Cobb, P. (2002). Reasoning with tools and inscriptions. Journal of the Learning Sciences, 11(2&3), 187–215.
Cobb, P., & Yackel, E. (1996). Constructivist, emergent, and sociocultural perspectives in the context of the
developmental research. Educational Psychologist, 31, 175–190.
diSessa, A. A., Hammer, D., Sherin, B., & Kolpakowski, T. (1991). Inventing graphing: Meta-representational
expertise in children. Journal of Mathematical Behavior, 10, 117–160.
Erickson, F. (1986). Qualitative methods in research on teaching. In M. C. Wittroc (Ed.), Handbook of research
on teaching (3rd ed., pp. 119–161). New York: Macmillan Press.
Finn, J. D., & Achilles, C. M. (1999). Tennessee’s class size study: Findings, implications, misconceptions.
Educational Evaluation and Policy Analysis, 21(2), 97–109.
Forman, E. A., & Ansell, E. (2002). Orchestrating the multiple voices and inscriptions of a mathematics classroom.
Journal of the Learning Sciences, 11(2&3), 251–274.
Gee, J. P. (1999). An introduction to discourse analysis: Theory and method. New York: Routledge.

872 WU AND KRAJCIK
Gibson, J. (1977). The theory of affordances. In R. Shaw & J. Bransford (Eds.), Perceiving, acting, and knowing.
Hillsdale, NJ: Erlbaum.
Glaser, B. G., & Strauss, A. L. (1963). The discovery of grounded theory: Strategies for qualitative research.
Chicago: Aldine.
Gordin, D. N., & Pea, R. D. (1995). Prospects for scientific visualization as an educational technology. Journal of
the Learning Sciences, 4(3), 249–279.
Greeno, J. G., & Hall, R. P. (1997). Practicing representation: Learning with and about representational forms.
Phi Delta Kappan, January, 361–367.
Guba, G. E., & Lincoln, S. Y. (1994). Competing paradigms in qualitative research. In D. K. Norman & S. Y.
Lincoln (Eds.), Handbook of qualitative research (pp. 105–117). Thousand Oaks, CA: Sage.
Heras, A. I. (1993). The construction of understanding in a sixth-grade bilingual classroom. Linguistics and
Education, 5(3&4), 275–299.
Fretz, E. B., Wu, H.-K., Zhang, B., Krajcik, J. S., Davis, E. A., & Soloway, E. (2002). An investigation of software
scaffolds supporting modeling practices. Research in Science Education, 32(4), 567–589.
Jackson, S. L., Stratford, S. J., Krajcik, J. S., & Soloway, E. (1994). Making dynamic modeling accessible to
precollege science students. Interactive Learning Environments, 14(3), 233–257.
Jick, T. D. (1979). Mixing qualitative and quantitative methods: Triangulation in action. Administrative Science
Quarterly, 24, 602–661.
Jordan, B., & Henderson, A. (1995). Interaction analysis: Foundations and practice. Journal of the Learning
Sciences, 4(1), 39–103.
Kelly, G. J., & Chen, C. (1999). The sound of music: Constructing science as sociocultural practices through oral
and written discourse. Journal of Research in Science Teaching, 36(8), 883–915.
Kelly, G. J., & Green, J. (1998). The social nature of knowing: Toward a sociocultural perspective on conceptual
change and knowledge construction. In B. Guzzetti & C. Hynd (Eds.), Perspectives on conceptual change:
Multiple ways to understand knowing and learning in a complex world (pp. 145–181). Mahwah, NJ: Lawrence
Erlbaum Associates.
Klahr, D., Fay, A. L., & Dunbar, K. (1993). Heuristics for scientific experimentation: A developmental study.
Cognitive Psychology, 25, 111–146.
Kozma, R. B. (2000a). Students collaborating with computer models and physical experiments. In C. Hoadley
(Ed.), Computer support for collaborative learning (pp. 314–322). Mahwah, NJ: Erlbaum.
Kozma, R. B. (2000b). The use of multiple representations and the social construction of understanding in chem-
istry. In M. Jacobson & R. Kozma (Eds.), Innovations in science and mathematics education: Advance designs
for technologies of learning (pp. 11–46). Mahwah, NJ: Erlbaum.
Kozma, R. B., Chin, E., Russell, J., & Marx, N. (2000). The roles of representations and tools in the chemistry
laboratory and their implications for chemistry instruction. Journal of the Learning Sciences, 9(2), 105–143.
Kozma, R. B., & Russell, J. (1997). Multimedia and understanding: Expert and novice responses to different
representations of chemical phenomena. Journal of Research in Science Teaching, 34, 949–968.
Krajcik, J. S. (1991). Developing students’ understanding of chemical concepts. In S. M. Glynn, R. H. Yeany,
& B. K. Britton. (Eds.), The psychology of learning science: International perspective on the psychological
foundations of technology-based learning environments (pp. 117–145). Hillsdale, NJ: Erlbaum.
Krajcik, J. S., Blumenfeld, P. C., Marx, R. W., Bass, K. M., Fredricks, J., & Soloway, E. (1998). Inquiry in
project-based science classrooms: Initial attempts by middle school students. Journal of the Learning Sciences,
7(3&4), 313–350.
Krajcik, J., Blumenfeld, P., Marx,, R. W., & Soloway, E. (1994). A collaborative model for helping science teachers
learn project-based instruction. Elementary School Journal, 94(5), 483–498.
Latour, B. (1987). Science in action: How to follow scientists and engineers through society. Cambridge, MA:
Harvard University Press.
Latour, B. (1999). Pandora’s hope: Essays on the reality of science studies. Cambridge, MA: Harvard University
Press.
Lave, J. (1988). Cognition in practice. Cambridge, UK: Cambridge University Press.
Lave, J., & Wenger, E. (1991). Situated learning: Legitimate peripheral participation. New York: Cambridge
University Press.
Leinhardt, G., Zaslavsky, O., & Stein, M. K. (1990). Functions, graphs, and graphing: Tasks, learning, and teaching.
Review of Educational Research, 60, 1–64.
Lemke, J. (1990). Talking science: Language, learning and values. Norwood, NJ: Ablex.
Lemke, J. (1998). Multiplying meaning: Visual and verbal semiotics in scientific text. In J. R. Martin & R. Vell
(Eds.), Reading science: Critical and functional perspectives on discourses of science (pp. 87–113). New York:
Routledge.
Lincoln, Y., & Guba, E. (1985). Naturalistic inquiry. Beverly Hills, CA: Sage.

INSCRIPTIONS AND MIDDLE SCHOOL SCIENCE LEARNING 873
Lynch, M., & Woolgar, S. (Eds.). (1990). Representation in scientific practice. Cambridge, MA: The MIT Press.
Moschkovich, J. N., & Brenner, M. E. (2000). Integrating a naturalistic paradigm into research on mathematics and
science cognition and learning. In A. E. Kelly & R. A. Lesh (Eds.), Handbook of research design in mathematics
and science education (pp. 457–486). Mahwah, NJ: Erlbaum.
National Research Council. (1996). National Science Education Standards. Washington, DC: National Academy
Press.
Novak, A. M., & Gleason, C. I. (2000). Incorporating portable technology to enhance an inquiry, project-based
middle school science classroom. In R. T. Tinker & J. S. Krajcik (Eds.), Portable technologies science learning
in context (pp. 29–62). Dordrecht, Netherlands: Kluwer.
Palinscar, A. M., & Brown, A. L. (1984). Reciprocal teaching of comprehension-fostering and comprehension-
monitoring activities. Cognition and Instruction, 1, 117–175.
Penner, D. E. (2001). Cognition, computers, and synthetic science: Building knowledge and meaning through
modeling. Review of Research in Education, 25, 1–35.
Penner, D. E., Lehrer, R., & Schauble, L. (1998). From physical models to biomechanics: A design-based modeling
approach. Journal of the Learning Sciences, 7(3&4), 429–449.
Preece, J., & Janvier, C. (1992). A study of the interpretation of trends in multiple curve graphs of ecological
situations. School Science and Mathematics, 92(6), 299–306.
Rivet, A., & Schneider, R. (2004). Exploring the role of digital photography to enhance student inquiry in a local
ecosystem. Journal of Computers in Mathematics and Science Teaching, 23(1), 47–65.
Roth, W.-M. (1996). Knowledge diffusion in a grade 4-5 classroom during a unit on civil engineering: An analysis
of a classroom community in terms of its changing resources and practices. Cognition and Instruction, 14,
179–220.
Roth, W.-M., & Bowen, G. M. (1994). Mathematization of experience in a grade 8 open-inquiry environment: An
introduction to the representational practices of science. Journal of Research in Science Teaching, 31, 293–318.
Roth, W.-M., Bowen, G. M., & McGinn, M. K. (1999). Differences in graph-related practices between high school
biology textbooks and scientific ecology journals. Journal of Research in Science Teaching, 36(9), 977–1019.
Roth, W.-M., & McGinn, M. K. (1998). Inscriptions: Toward a theory of representing as social practice. Review
of Educational Research, 68(1), 35–59.
Schank, R. C. (1994). Goal-based scenarios: A radical look at education. Journal of the Learning Sciences, 3,
429–453.
Schliemann, A. D. (2002). Representational tools and mathematical understanding. Journal of the Learning Sci-
ences, 11(2&3), 301–317.
Strauss, A., & Corbin, J. M. (1998). Basics of qualitative research: Techniques and procedures for developing
grounded theory. Thousand Oaks, CA: Sage.
Tuyay, S., Jennings, L., & Dixon, C. (1995). Classroom discourse and opportunities to learn: An ethnographic
study of knowledge construction in a bilingual third grade classroom. Discourse Processes, 19(1), 75–110.
Wenger, E. (1998). Communities of practices: Learning, meaning, and identity. London: Cambridge University
Press.
Wong, E. D. (1996). Students’ scientific explanations and the contexts in which they occur. Elementary School
Journal, 96(5), 495–511.
Wood, D. J., Bruner, J. S., & Ross, G. (1976). The role of tutoring in problem solving. Journal of Child Psychology
and Psychiatry, 17, 89–100.
Wu, H.-K. (2003). Linking the microscopic view of chemistry to real life experiences: Intertextuality in a high-
school science classroom. Science Education, 87, 868–891.