
Exploring Museum Collections Online: The Quantitative Method
Exploring Large Digital Library Collections using a Map-based Visualisation
Dr Mark Hall
Research Seminar, Department of Computing, Edge Hill University
7.11.2013
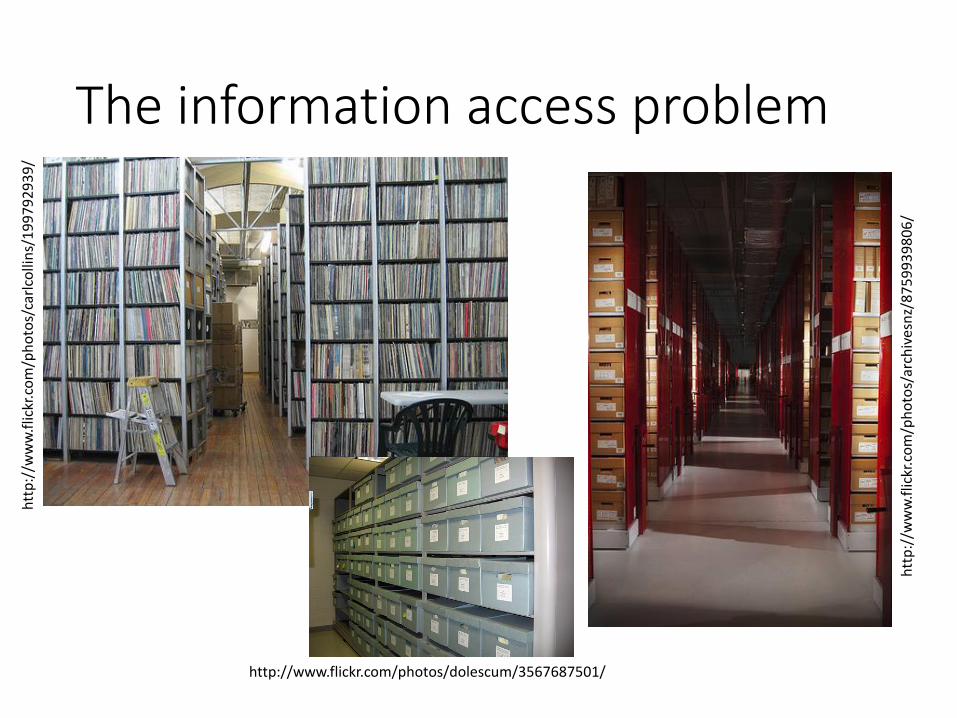
The information access problem
htt
p:/
/ww
w.f
lickr
.co
m/p
ho
tos/
carl
colli
ns/
19
97
92
93
9/
http://www.flickr.com/photos/dolescum/3567687501/
htt
p:/
/ww
w.f
lickr
.co
m/p
ho
tos/
arch
ives
nz/
87
59
93
98
06
/
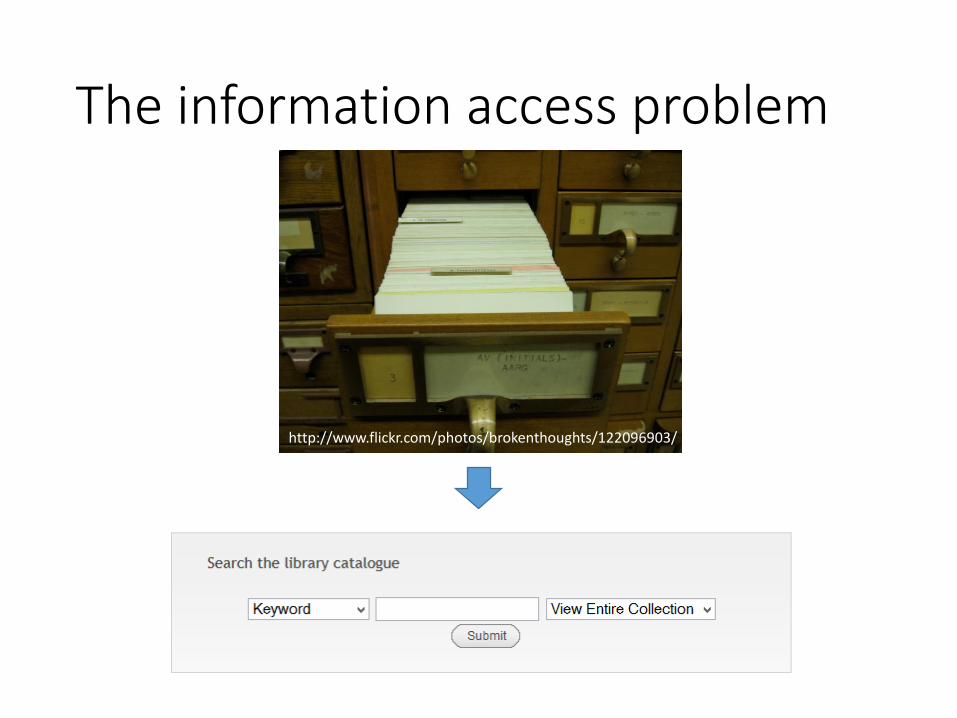
The information access problem
http://www.flickr.com/photos/brokenthoughts/122096903/
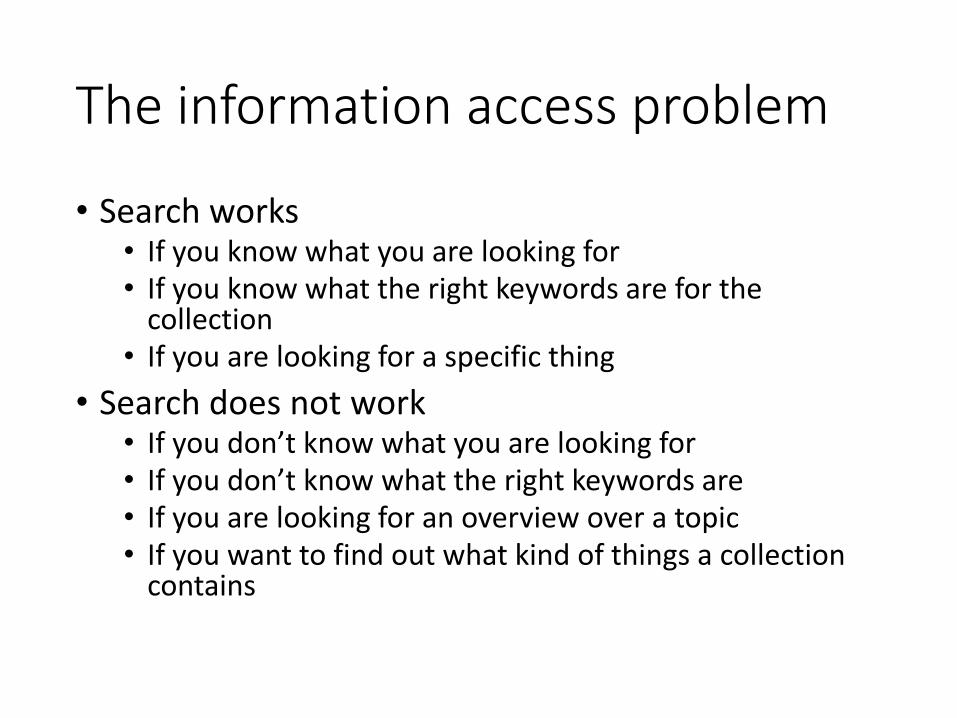
The information access problem
• Search works• If you know what you are looking for• If you know what the right keywords are for the
collection• If you are looking for a specific thing
• Search does not work• If you don’t know what you are looking for• If you don’t know what the right keywords are• If you are looking for an overview over a topic• If you want to find out what kind of things a collection
contains
The information access problem
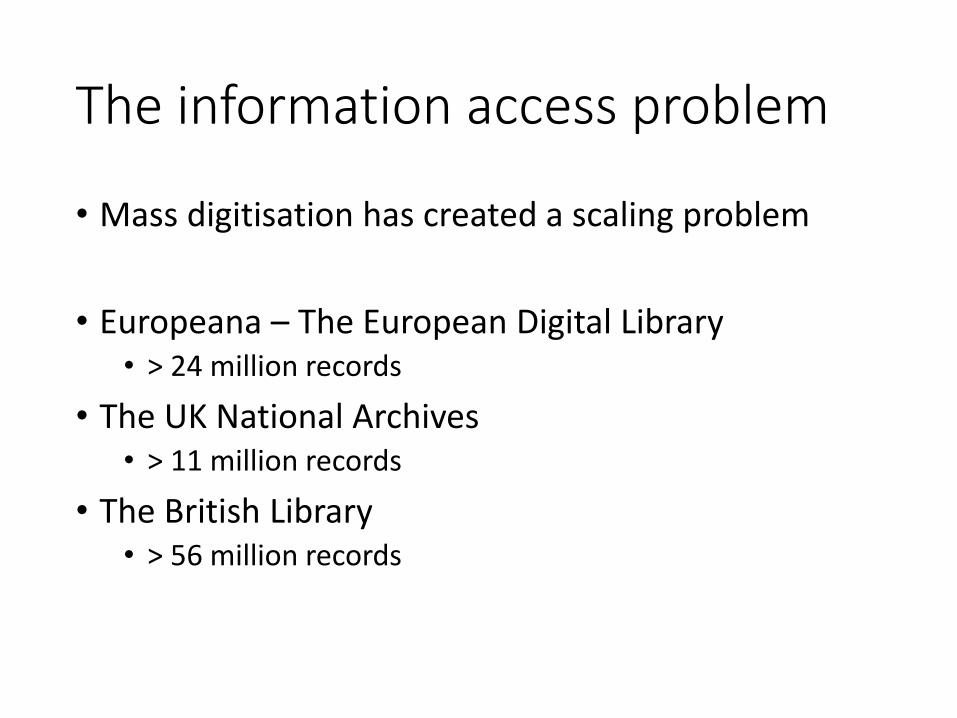
• Mass digitisation has created a scaling problem
• Europeana – The European Digital Library• > 24 million records
• The UK National Archives• > 11 million records
• The British Library• > 56 million records
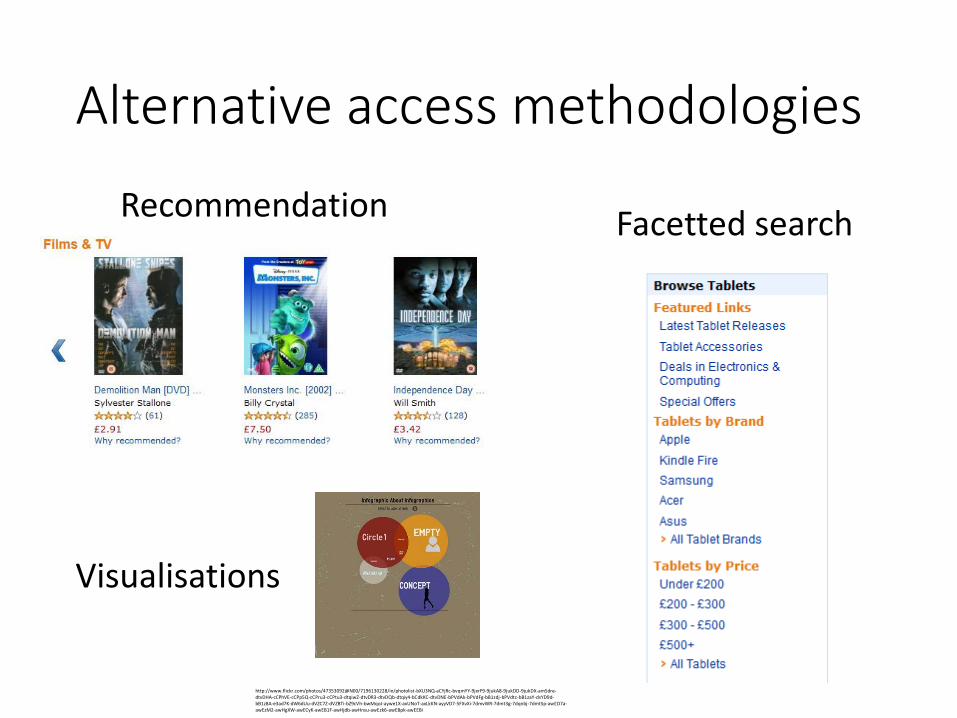
Alternative access methodologies
RecommendationFacetted search
Visualisations
http://www.flickr.com/photos/47353092@N00/7196130228/in/photolist-bXU3NQ-aCYjRc-bvqmYY-9jxrF9-9jukA8-9jukDD-9jukDX-amSdre-dtvDHA-cCPhVE-cCPp5Q-cCPru3-cCPtu3-dtqiwZ-dtvDR3-dtvDQb-dtqiy4-bCdkKC-dtvDNE-bPVdAk-bPVdFg-bB1zdj-bPVdtc-bB1zaY-dsYD9d-bB1z8A-e3ad7K-dW6dUu-dVZC7Z-dVZBTi-bZ9cVh-bwMqoJ-aywe1X-axUNoT-axLkKN-ayyVD7-5FXvXi-7dmvWR-7dmt3g-7dqnbj-7dmtSp-awED7a-awEzM2-awHgXW-awECyK-awEB1F-awHjdb-awHnsu-awEzk6-awEBpk-awEEBi
Spatialisation
• Turn a higher-dimensional semantic space into a two-dimensional representation
• Map similarity in the higher-dimensional space into distance in the two-dimensional space
• Provides a visual overview over the topics in a collection
• People readily understand the distance – similarity metaphor
Spatialisation
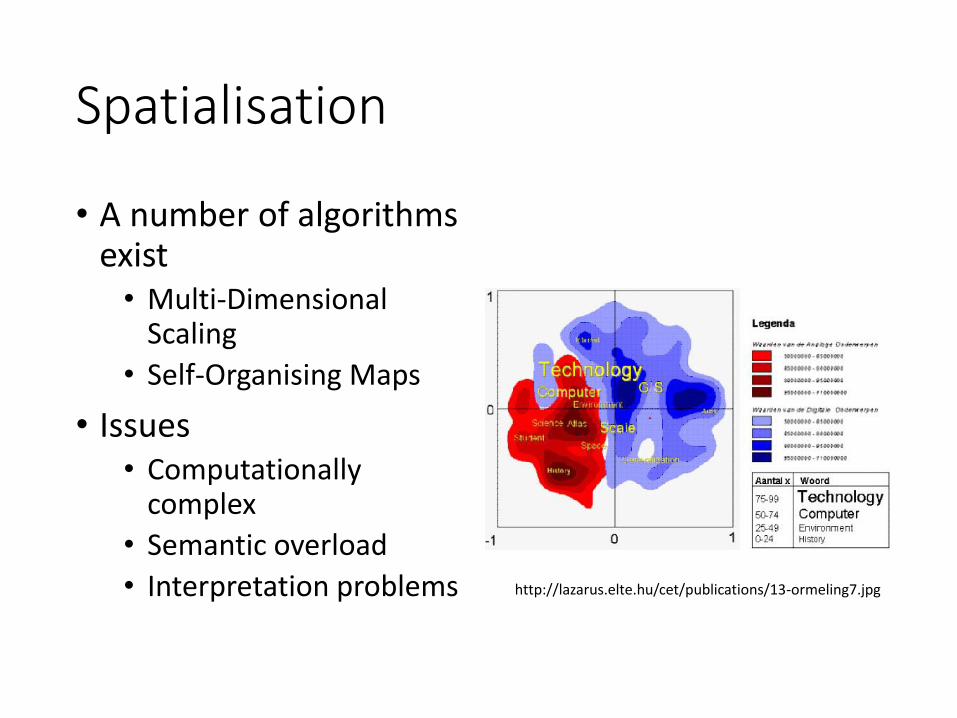
• A number of algorithms exist• Multi-Dimensional
Scaling
• Self-Organising Maps
• Issues• Computationally
complex
• Semantic overload
• Interpretation problems http://lazarus.elte.hu/cet/publications/13-ormeling7.jpg
Potential solution
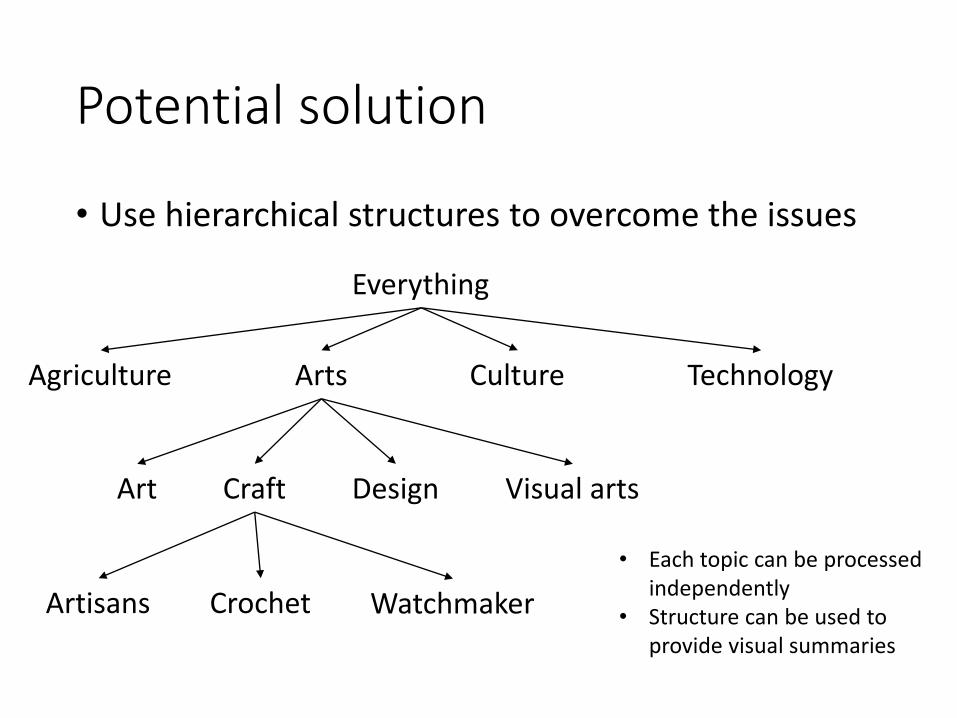
• Use hierarchical structures to overcome the issues
TechnologyAgriculture Arts Culture
Everything
Art Craft Design Visual arts
Artisans Crochet Watchmaker
• Each topic can be processed independently
• Structure can be used to provide visual summaries
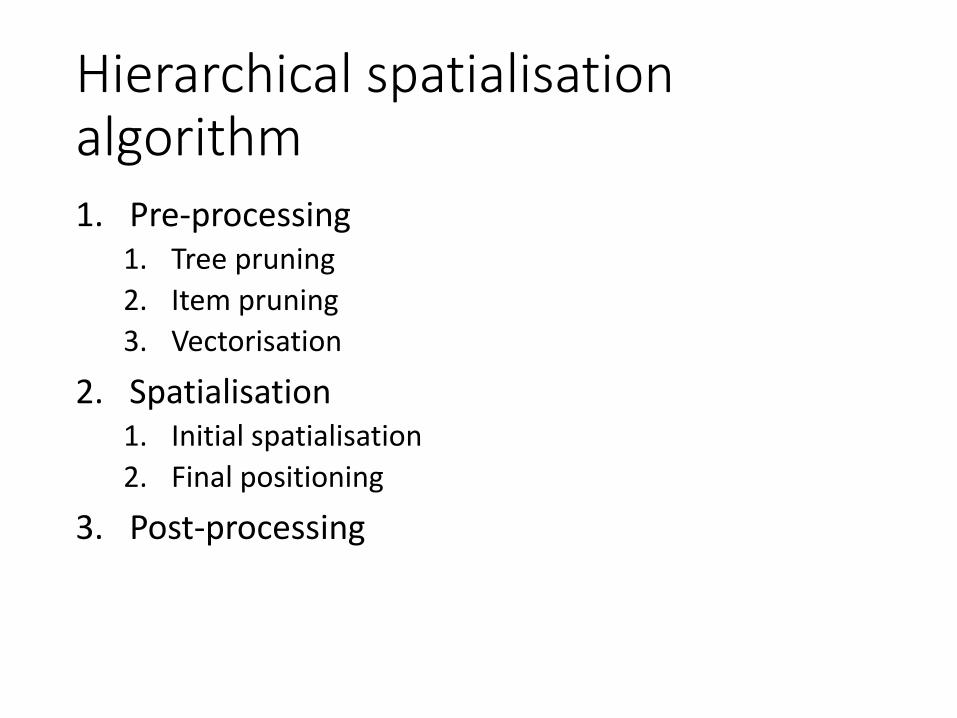
Hierarchical spatialisationalgorithm1. Pre-processing
1. Tree pruning
2. Item pruning
3. Vectorisation
2. Spatialisation1. Initial spatialisation
2. Final positioning
3. Post-processing
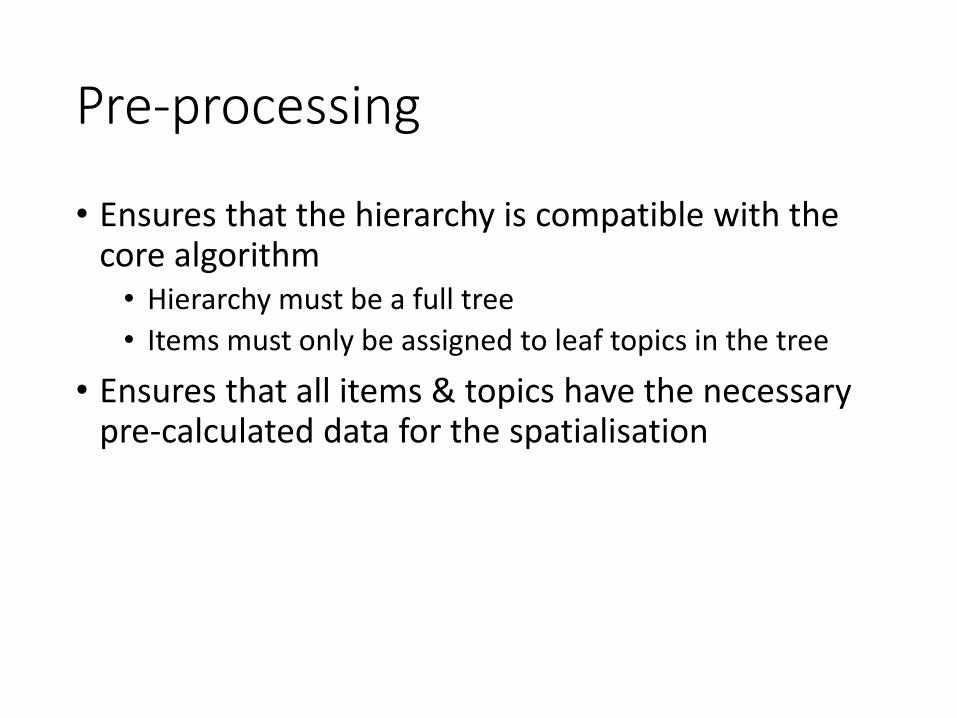
Pre-processing
• Ensures that the hierarchy is compatible with the core algorithm• Hierarchy must be a full tree
• Items must only be assigned to leaf topics in the tree
• Ensures that all items & topics have the necessary pre-calculated data for the spatialisation
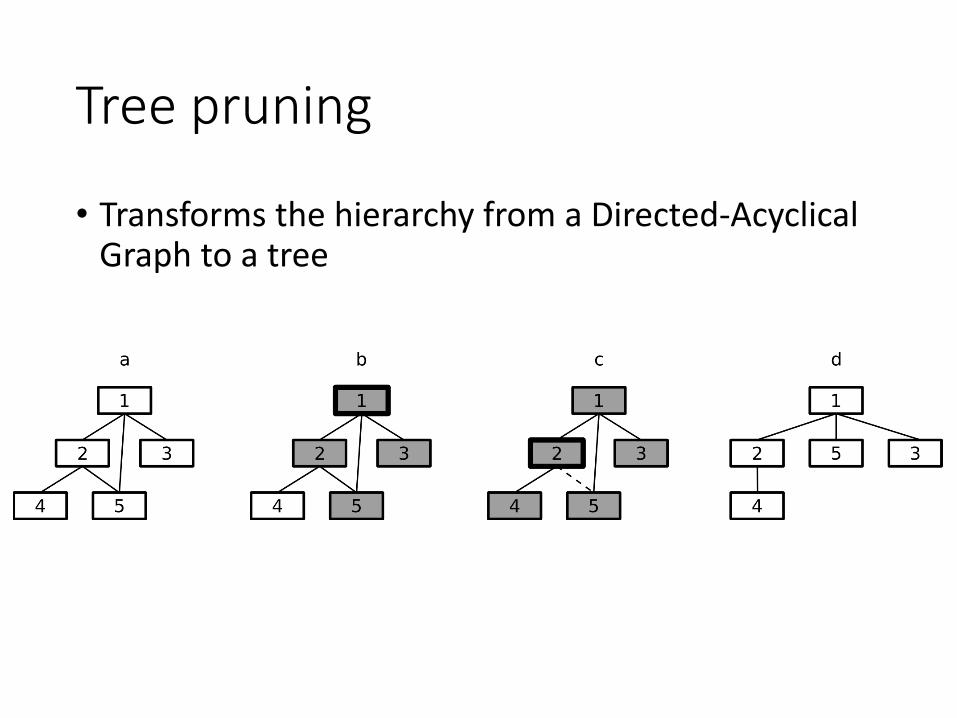
Tree pruning
• Transforms the hierarchy from a Directed-AcyclicalGraph to a tree
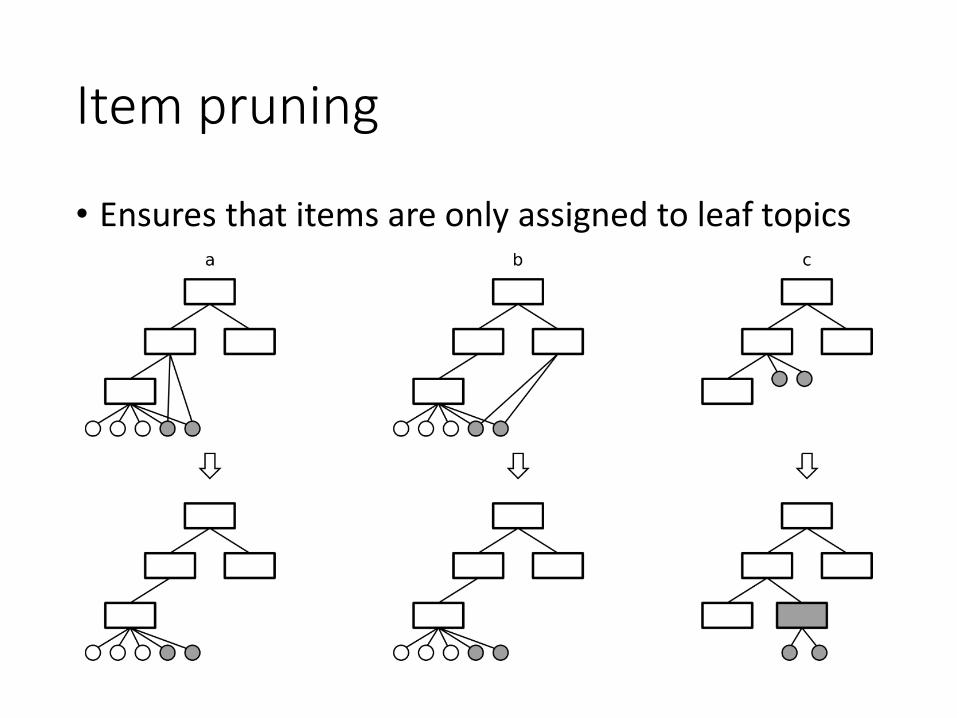
Item pruning
• Ensures that items are only assigned to leaf topics
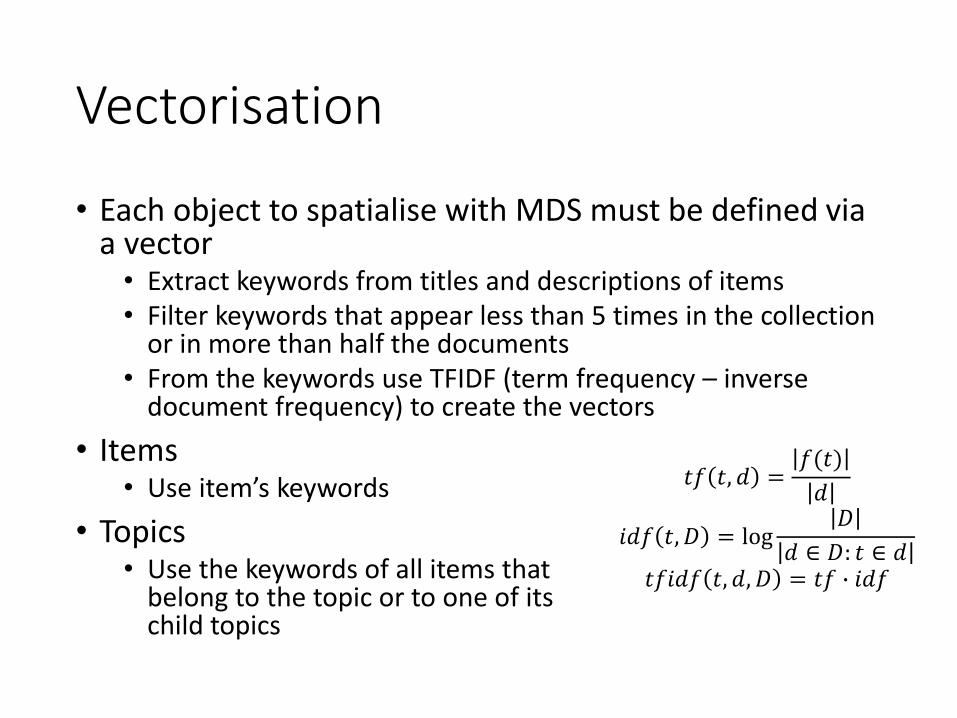
Vectorisation
• Each object to spatialise with MDS must be defined via a vector• Extract keywords from titles and descriptions of items• Filter keywords that appear less than 5 times in the collection
or in more than half the documents• From the keywords use TFIDF (term frequency – inverse
document frequency) to create the vectors
• Items• Use item’s keywords
• Topics• Use the keywords of all items that
belong to the topic or to one of itschild topics
𝑡𝑓 𝑡, 𝑑 =𝑓(𝑡)
𝑑
𝑖𝑑𝑓 𝑡, 𝐷 = log𝐷
𝑑 ∈ 𝐷: 𝑡 ∈ 𝑑𝑡𝑓𝑖𝑑𝑓 𝑡, 𝑑, 𝐷 = 𝑡𝑓 ∙ 𝑖𝑑𝑓
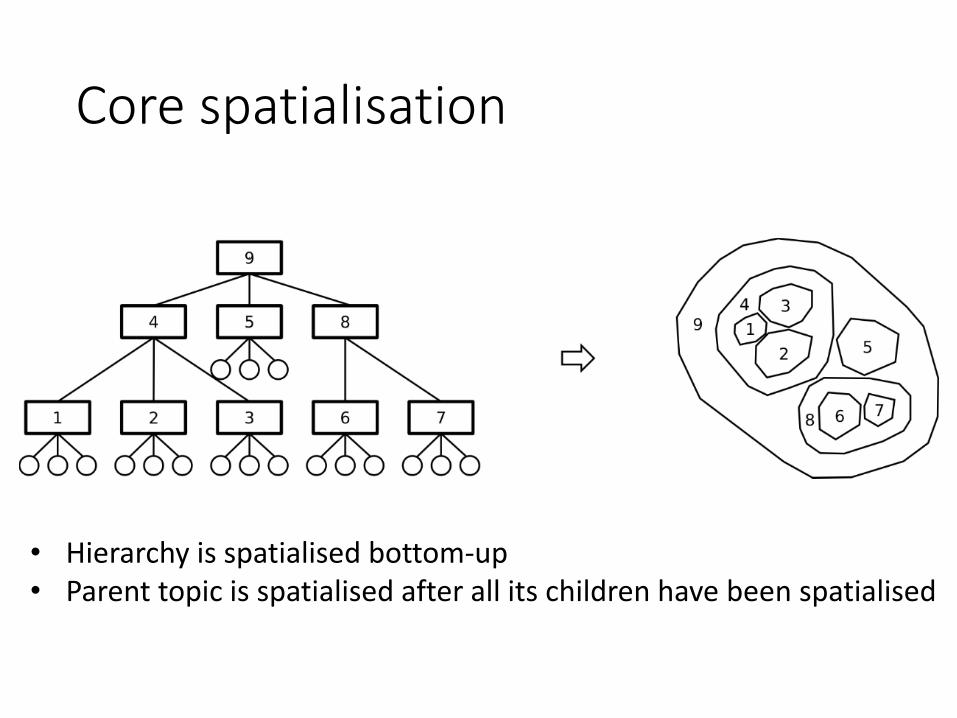
Core spatialisation
• Hierarchy is spatialised bottom-up• Parent topic is spatialised after all its children have been spatialised
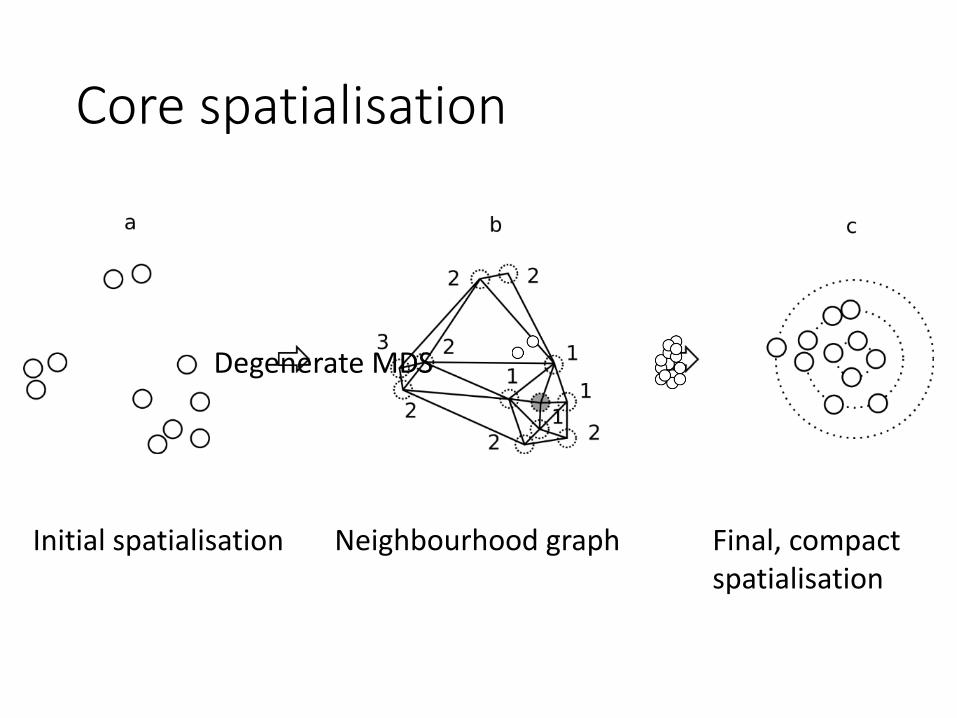
Core spatialisation
Initial spatialisation Neighbourhood graph Final, compact spatialisation
Degenerate MDS
Parallelisation
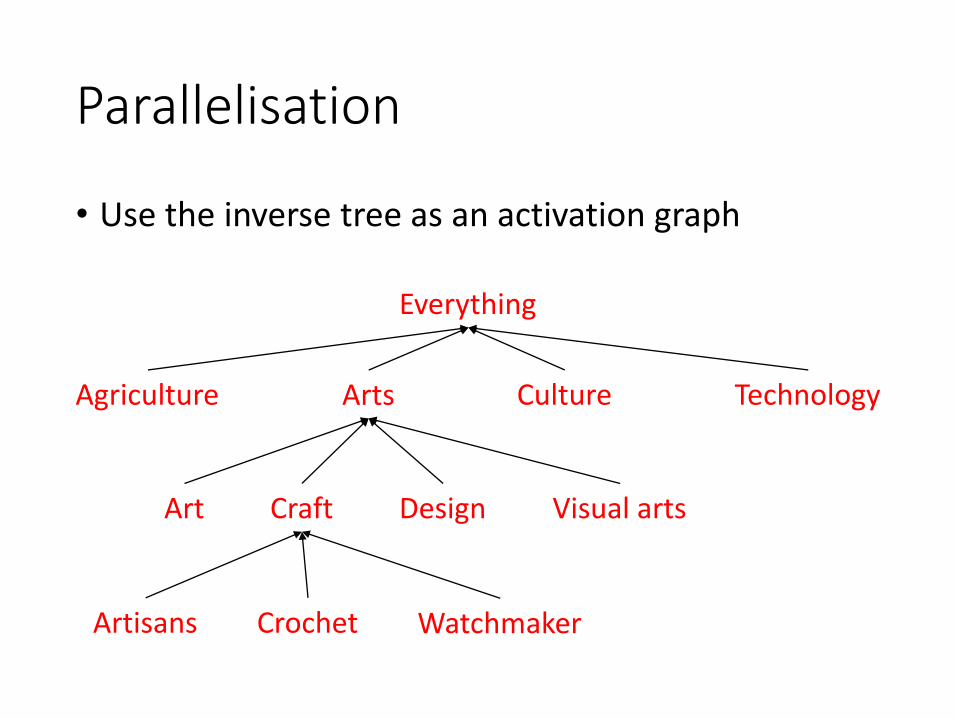
• Use the inverse tree as an activation graph
TechnologyAgriculture Arts Culture
Everything
Art Craft Design Visual arts
Artisans Crochet Watchmaker
Parallelisation
• Enables the algorithm to scale to large data-sets• 500 000 items processed in ~16 hours on a multi-core
desktop processor
• Limited by the shared map storage backend
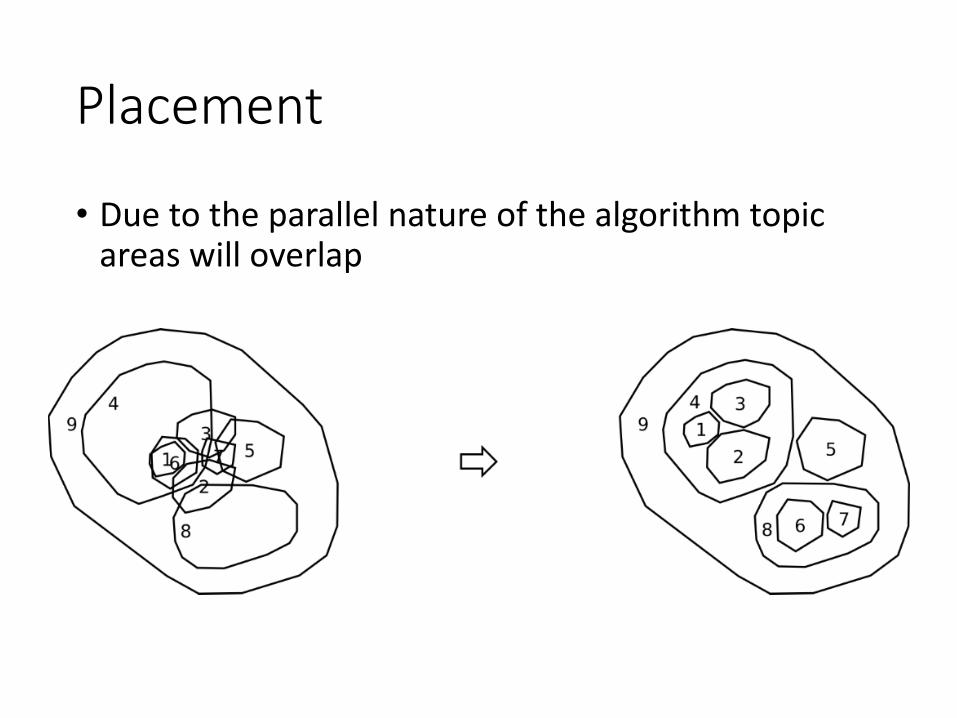
Placement
• Due to the parallel nature of the algorithm topic areas will overlap
Post-processing
• Re-calculate boundaries to achieve visual attractivity
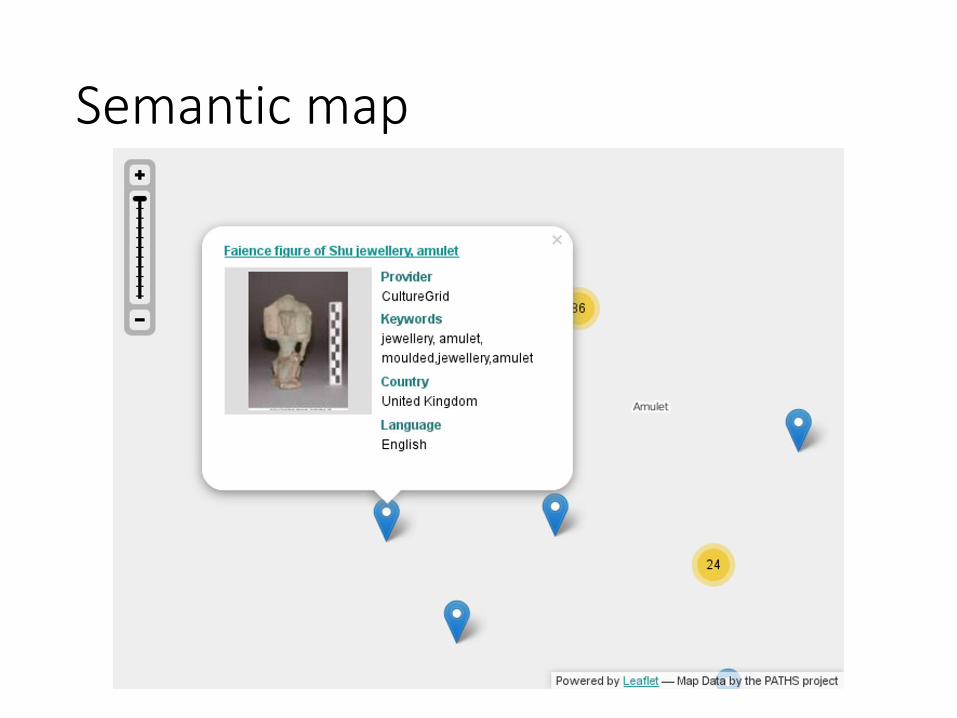
Semantic map
Semantic map
• Generally provides overviewing and exploration support
• Hierarchy provides overview labels at higher zoom levels
• Interaction follows the widely adopted Google-maps pattern (zoom / pan)
• At lower zoom levels allows interaction with individual items
• Provides a natural interface for touch-based devices
Semantic map
• Algorithm written in Python
• Data stored in PostgreSQL + PostGIS database
• Individual tiles rendered using• Mapnik – for the actual rendering
• TileLite – for caching and serving
• Web-based user interface provided via Leaflet
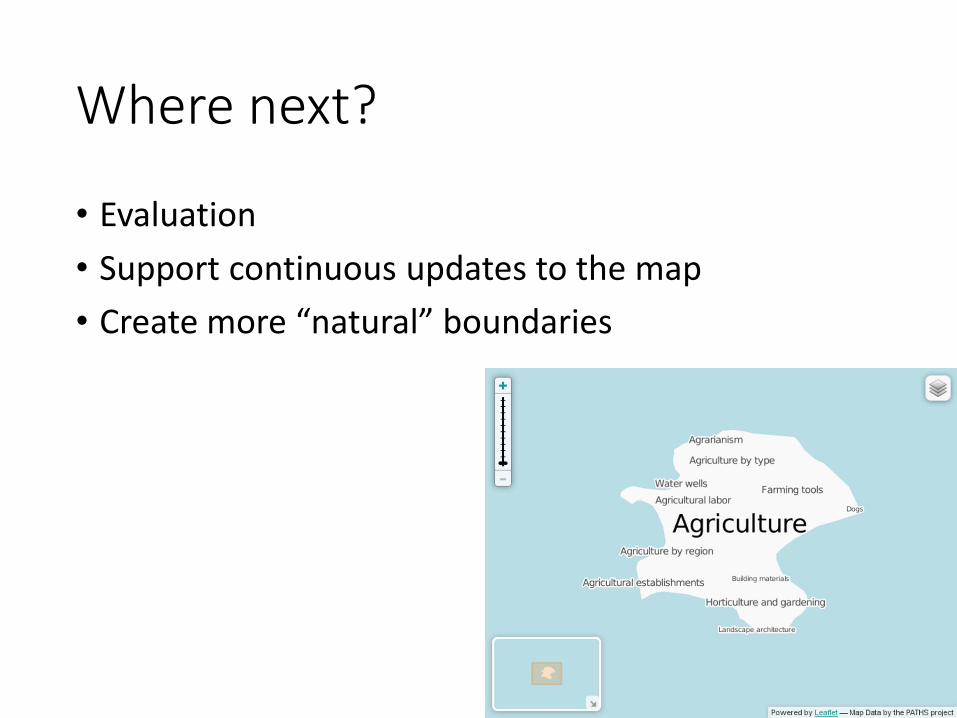
Where next?
• Evaluation
• Support continuous updates to the map
• Create more “natural” boundaries
Thank youQuestions?
See a demo at http://explorer.paths-project.eu


![Exploring Large Digital Library Collections using a Map ... · thesaurus-based search improvements [23,31], document clustering [27] or the use of concepts arranged hierarchically](https://static.fdocuments.in/doc/165x107/6056a4b2d2dbdc5f5c1d4122/exploring-large-digital-library-collections-using-a-map-thesaurus-based-search.jpg)