Exploring How Intangibility Affects Perceived Risk articles/JSR04.pdf · Exploring How...
17
Exploring How Intangibility Affects Perceived Risk Michel Laroche Concordia University Gordon H. G. McDougall Wilfrid Laurier University Jasmin Bergeron University of Quebec in Montreal Zhiyong Yang Concordia University Studies have found that product intangibility increases consumers’ perception of risk. However, most of these studies measured the intangibility and perceived risk con- structs unidimensionally. The primary objective of this ar- ticle is to examine the effects of the multiple dimensions of intangibility on the various types of risk. An empirical in- vestigation revealed that, of the three intangibility dimen- sions, physical intangibility was the least correlated to the consumers’ perception of risk in most situations, whereas mental intangibility and generality had a great impact on most dimensions of perceived risk. However, there were variations in the strength of the relationships between the intangibility dimensions and the risk dimensions when contrasting goods and services, generic products and brands, and online and offline purchase contexts. Theoretical and practical contributions to the service marketing literature are discussed. Keywords: intangibility; perceived risk; services mar- keting; structural equation modeling Two central concepts in marketing are intangibility and perceived risk. Both influence consumer decision making and marketing strategy. Intangibility, the major character- istic that distinguishes goods from services, affects the consumer’s ability to judge the quality of the good/service. The more intangible a product is, the more difficult its evaluation will be (Zeithaml 1981). Perceived risk, the un- certainty and consequences of the decision, affects the ex- The authors gratefully acknowledge the financial support of the Social Sciences and Humanities Research Council of Canada; the useful suggestions of the editor and three anonymous reviewers; and the able assistance of Filip Bartos, Ann Zhong, and Isabelle Miodek in collecting the data. Correspondence regarding this article should be addressed to Michel Laroche, John Molson School of Business, Concordia University, 1455 de Maisonneuve West, Montreal, QC H3G 1M8, Canada; phone: (514) 848-2942; fax: (514) 848-4576; e- mail: [email protected]. Journal of Service Research, Volume 6, No. 4, May 2004373-389 DOI: 10.1177/1094670503262955 © 2004 Sage Publications
Transcript of Exploring How Intangibility Affects Perceived Risk articles/JSR04.pdf · Exploring How...

Exploring How IntangibilityAffects Perceived Risk
Michel LarocheConcordia University
Gordon H. G. McDougallWilfrid Laurier University
Jasmin BergeronUniversity of Quebec in Montreal
Zhiyong YangConcordia University
Studies have found that product intangibility increasesconsumers’ perception of risk. However, most of thesestudies measured the intangibility and perceived risk con-structs unidimensionally. The primary objective of this ar-ticle is to examine the effects of the multiple dimensions ofintangibility on the various types of risk. An empirical in-vestigation revealed that, of the three intangibility dimen-sions, physical intangibility was the least correlated to theconsumers’ perception of risk in most situations, whereasmental intangibility and generality had a great impact onmost dimensions of perceived risk. However, there werevariations in the strength of the relationships between theintangibility dimensions and the risk dimensions whencontrasting goods and services, generic products andbrands, and online and offline purchase contexts.
Theoretical and practical contributions to the servicemarketing literature are discussed.
Keywords: intangibility; perceived risk; services mar-keting; structural equation modeling
Two central concepts in marketing are intangibility andperceived risk. Both influence consumer decision makingand marketing strategy. Intangibility, the major character-istic that distinguishes goods from services, affects theconsumer’s ability to judge the quality of the good/service.The more intangible a product is, the more difficult itsevaluation will be (Zeithaml 1981). Perceived risk, the un-certainty and consequences of the decision, affects the ex-
The authors gratefully acknowledge the financial support of the Social Sciences and Humanities Research Council of Canada; theuseful suggestions of the editor and three anonymous reviewers; and the able assistance of Filip Bartos, Ann Zhong, and Isabelle Miodekin collecting the data. Correspondence regarding this article should be addressed to Michel Laroche, John Molson School of Business,Concordia University, 1455 de Maisonneuve West, Montreal, QC H3G 1M8, Canada; phone: (514) 848-2942; fax: (514) 848-4576; e-mail: [email protected].
Journal of Service Research, Volume 6, No. 4, May 2004 373-389DOI: 10.1177/1094670503262955© 2004 Sage Publications

tent of search and information sought (Bauer 1960). Inresponse, marketing strategies include branding (to in-crease tangibility) and guarantees (to reduce risk), and ahost of other initiatives have been implemented toinfluence consumer behavior.
Intangibility is one of the main influences on perceivedrisk. As intangibility increases, so does perceived risk(Murray and Schlacter 1990). Typically, intangibility hasbeen defined as the lack of physical evidence (McDougall1987). Recent research empirically examined the concep-tual definition of intangibility and found that it was com-posed of three distinct dimensions: physical intangibility,generality, and mental intangibility (Laroche, Bergeron,and Goutaland 2001). Perceived risk has multiple dimen-sions as well, including social, financial, physical, psycho-logical, time, and performance risks (Stone and Gronhaug1993).
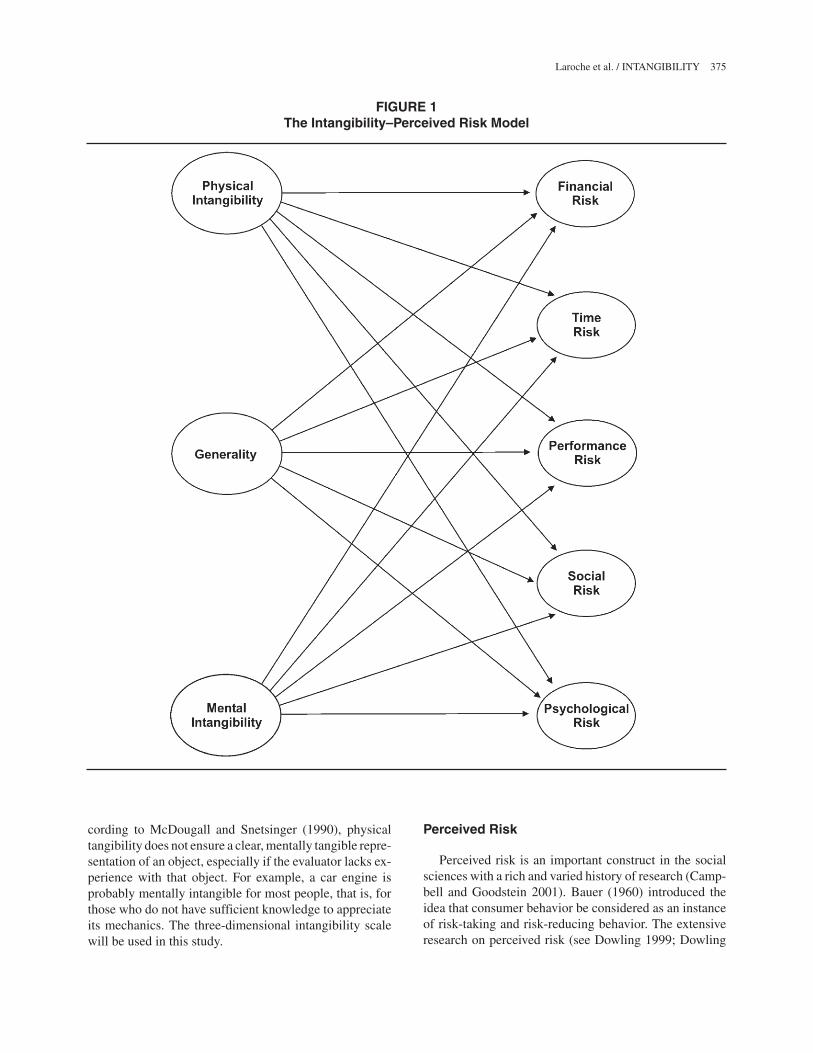
The major objective of this article is to investigate theimpact of the three intangibility dimensions on five dimen-sions of perceived risk across different product categoriesand brands for both goods and services (Figure 1).
A second objective of this research is to compare the re-lationship between intangibility and perceived risk in theonline versus the offline environments. With the advent ofthe Internet, new forms of goods and services and deliverychannels have appeared. For example, music and bankingservices can be directly delivered in a digital, nonphysicalformat by a firm that has no physical presence. Tradition-ally, these forms and channels are believed to be more in-tangible and increase perceived risk. However, recentstudies show that the Internet, despite being a fairly intan-gible medium, is currently used as a means of tangibilizingthe intangible (Berthon et al. 1999). Some researchers at-tribute this phenomenon to the powerful function of theInternet in easily providing consumers with appropriateinformation and in lessening the efforts needed in makingpurchase decisions (Thakor, Borsuk-Shtevi, and Kalamasforthcoming). Therefore, identifying the degree to whichthe online versus the offline environments may increase ordecrease intangibility and perceived risk can provideinsights to marketing managers involved in the onlineenvironments.
It is hoped the article will make the following contribu-tions to the marketing field. First, the present study ex-tends the understanding of intangibility and perceived riskin three ways: (a) by using multiple dimensions for bothintangibility and perceived risk; (b) by direct modeling ofintangibility and perceived risk to identify the relation-ships between the individual dimensions of intangibilityand those of perceived risk; and (c) by testing these rela-tionships across goods, services, brands, generic products,and purchase situations to increase the generalizability ofthe results. The study will extend the understanding of the
relationship between intangibility and perceived risk be-yond the general statement that increased intangibilityleads to increased perceived risk. Second, the study of-fers managerial implications to address the situationswhere intangibility and perceived risk are most likely tooccur. Globally, it is hoped that this investigation willprovide both theoretical and practical contributions to un-derstanding the impact of intangibility on perceived risk.
LITERATURE REVIEW
Intangibility
Intangibility has been defined as “impalpable” and “notcorporeal” (Shostack 1977); “that which cannot be easilydefined, formulated or grasped mentally” (Berry 1980);and “the lack of physical evidence” (McDougall 1987).According to the Oxford Dictionary of Current English(1996), intangibility is (a) that which cannot be touched orseen, (b) that which is difficult to define or describeclearly, and (c) that which cannot be easily grasped men-tally. Prior research has tended to view intangibility as asingle dimension related to the lack of physical evidence(Bebko 2000; Finn 1985) or a two-dimensional constructrelated to the lack of physical evidence and generality—how general or specific a consumer perceives a particulargood or service (Breivik, Troye, and Olsson 1998).
Recent research suggests the intangibility construct en-compasses three dimensions: physical intangibility, gen-erality, and mental intangibility (Laroche, Bergeron, andGoutaland 2001). The physical dimension represents theextent to which a good cannot be touched or seen; it is in-accessible to the senses and lacks a physical presence. Thegenerality dimension refers to the customer’s difficulty inprecisely defining or describing a particular good. Flipo(1988) argued that the word tangible is often used as a syn-onym of precise. Making a tangible promise, for instance,implies saying precisely what one commits oneself to do.Goods can be perceived as general if consumers cannot re-fer precisely to identifiable definitions, features, and/oroutcomes (e.g., a car is a complex vehicle that one uses toget from Point A to Point B) (Laroche, Bergeron, andGoutaland 2001). Inversely, goods are perceived as spe-cific if they generate numerous clear-cut definitions, fea-tures, and/or outcomes in the consumer’s mind (e.g., a caris an intricate machine; made of aluminum alloy; poweredby an internal-combustion engine; with numerous featuressuch as antilock braking systems, dual-side air bags,immobilizer theft-deterrent devices, air conditioning,etc.).
Mental intangibility reflects the fact that a good can bephysically tangible, but difficult to grasp mentally. Ac-
374 JOURNAL OF SERVICE RESEARCH / May 2004
cording to McDougall and Snetsinger (1990), physicaltangibility does not ensure a clear, mentally tangible repre-sentation of an object, especially if the evaluator lacks ex-perience with that object. For example, a car engine isprobably mentally intangible for most people, that is, forthose who do not have sufficient knowledge to appreciateits mechanics. The three-dimensional intangibility scalewill be used in this study.
Perceived Risk
Perceived risk is an important construct in the socialsciences with a rich and varied history of research (Camp-bell and Goodstein 2001). Bauer (1960) introduced theidea that consumer behavior be considered as an instanceof risk-taking and risk-reducing behavior. The extensiveresearch on perceived risk (see Dowling 1999; Dowling
Laroche et al. / INTANGIBILITY 375
FIGURE 1The Intangibility–Perceived Risk Model

and Staelin 1994; Mitchell 1999 for reviews) has shownthat consumers’ perceptions of risk are central to theirevaluations and purchasing behaviors (Dowling 1999).
Perceived risk has two components: uncertainty (thelikelihood of unfavorable outcomes) and consequences(the importance of a loss) (Bauer 1960). Different types ofrisk exist, namely, financial, performance, time, physical,psychological, and social risks (Havlena and DeSarbo1990; Jacoby and Kaplan 1972; Murray and Schlacter1990), and the importance of each varies across productcategories (Jacoby and Kaplan 1972; Kaplan, Szybillo,and Jacoby 1974). That is, the perceived risk for two dif-ferent product purchases may both be high, but in onecase—for example, a computer—performance and finan-cial risks are high, whereas the remaining risks may below. In the next case—for example, an Internet browser—the time and performance risks are high. The point is thatthe dimensions of risk are very product specific and can beindependent of each other.
Here, perceived risk is viewed as a subjective expecta-tion of loss (Mitchell and Greatorex 1993; Peter and Ryan1976). Briefly, social risk can be defined as the potentialloss of esteem, respect, and/or friendship offered to theconsumer by other individuals (Murray and Schlacter1990) and is more likely to occur with services because ofthe service encounter (Mitchell and Greatorex 1993;Murray and Schlacter 1990). Time risk is the potential lossof time and effort associated with purchasing the item(Murray and Schlacter 1990). Psychological risk is the po-tential loss of self-image or self-concept as the result of theitem purchase (Murray and Schlacter 1990). Financial riskis the potential loss of money associated with the item pur-chase, and performance risk is the potential loss due toitem failure after purchase.
It is important to understand how each of the risk di-mensions contributes to overall risk both from theoreticaland practical viewpoints. From a theoretical viewpoint,the risk dimensions will affect the type of informationsought, the information sources used, and the length oftime in the decision process. From a practical viewpoint,the marketing strategies used to reduce risk will be farmore effective if the contributions of each of the risk di-mensions to overall risk is well understood.
Perceived risk also varies across methods of shopping.Nontraditional shopping may have higher risk than tradi-tional shopping (Gillett 1976), and buying by phone ormail may be more risky than buying in retail stores (Coxand Rich 1964; Spence, Engel, and Blackwell 1970).Bobbitt and Dabholkar (2001) proposed that some typesof risk, such as financial, psychological, and performancerisks are more applicable to shopping on the Internet thanother nontraditional or traditional shopping methods. Forexample, in terms of financial risk, consumers may fear
that the company that they “know” only through theInternet may misuse their credit cards. Psychological riskmay occur because Web sites can capture personal infor-mation, and there is some psychological risk associatedwith not knowing the entity from which you are buying.Performance risk may occur when consumers purchase agood through the Internet but do not receive the good thatwas advertised. A five-dimensional perceived risk scalewill be used in this study.
Intangibility and Perceived Risk
Research has shown that intangibility is positively cor-related with perceived risk (De Ruyter, Wetzels, andKleijnen 2001; Finn 1985; McDougall and Snetsinger1990; Mitchell and Greatorex 1993; Murray and Schlacter1990; Zeithaml and Bitner 2000). The lack of informationavailable in making services versus goods decisions in-creases the risk (Bebko 2000). Also, services tend to beperceived as riskier to purchase than goods (McDougalland Snetsinger 1990; Mitchell and Greatorex 1993;Murray and Schlacter 1990). The properties of services—that is, heterogeneity, perishability, inseparability, andintangibility—may lower consumer confidence and in-crease perceived risk, mainly by augmenting the degree ofuncertainty in the decision (Mitchell 1999).
A review of the literature found no studies that relatedthe dimensions of intangibility to the dimensions of per-ceived risk. This is not surprising given the recent de-velopment of the three-dimensional intangibility scale(Laroche, Bergeron, and Goutaland 2001). The implica-tion is that there is little direct empirical or theoreticalwork to hypothesize the relationships that might exist be-tween the dimensions of intangibility and perceived risk.The hypotheses, presented below, should be regarded asexploratory in nature.
HYPOTHESES
While intangibility is generally related to perceivedrisk, the relationships between the three dimensions of in-tangibility and the five dimensions of perceived risk havenot been tested. Given the exploratory nature and objec-tives of this research, the major hypothesis is a test of theoverall intangibility–perceived risk model (Figure 1).
Hypothesis 1: The three dimensions of intangibility willbe significantly related to the five dimensions of per-ceived risk.
Branding has been used as a risk-reducing strategy andis often recommended for services, where higher risk ex-
376 JOURNAL OF SERVICE RESEARCH / May 2004

ists (Berry 2000). Both theory and empirical evidence sup-port the concept that brands, as opposed to genericproducts, should have lower risk (Mitchell and Greatorex1993; Roselius 1971). For example, consumers may feelthere is a great deal of risk associated with the genericproduct class; however, they may buy their favorite brandwith confidence (Dowling and Staelin 1994). Dowling andStaelin referred to this distinction as product-category andproduct-specific risks. In a comparison of the relationshipsbetween intangibility dimensions and perceived-risk di-mensions for generic products versus brands, the genericproduct model should provide a stronger relationship (i.e.,higher standardized coefficients) than the brand model.
Hypothesis 2: The intangibility–perceived risk relation-ship will be stronger with generic products versusbrands.
Services and goods have been arrayed on a tangibilitycontinuum where goods, because of high search qualities,are placed on the tangible end of the continuum (Shostack1977). Goods and services high in experience qualities areplaced in the middle, and services high on credence quali-ties are placed on the intangible end of the continuum(Shostack 1977; Zeithaml 1981). Because goods are highon search qualities and usually have a physical presence,both physical and mental intangibility should be low. Ser-vices should have higher physical and mental intangibility.
Hypothesis 3: The relationship between physical intan-gibility and the perceived risk dimensions will bestronger with goods versus services.
Hypothesis 4: The relationship between mental intangi-bility and the perceived risk dimensions will bestronger with services versus goods.
As noted earlier, with the Internet, new forms of goodsand services and delivery channels have appeared. Often,these forms and channels are more intangible and may in-crease perceived risk. A closer look at the previous studiesof online purchasing shows that privacy and security con-cerns are two most widely used antecedents of perceivedrisk (Hoffman, Novak, and Peralta 1999; Miyazaki andFernandez 2001), but the effect of intangibility of the at-tributes of goods and services on perceived risk is rarelyaddressed. A recent study (Thakor, Borsuk-Shtevi, andKalamas forthcoming) reported that the Internet, despiteits intangible attributes as a purchase mode, provides andoffers consumers proper access to and screening of appro-priate information to minimize their search efforts in thepurchase decision process. The improved efficiency at dis-tributing, categorizing, and screening information in anonline environment (e.g., Alba et al. 1997) should help di-
minish the mental intangibility of the product and there-fore the perceived risk associated with the purchase. Thisincreased access to specific, organized information wouldalso allow consumers to familiarize themselves with morespecific attributes and functions of the services or goodsthat they are purchasing, thus diminishing the impact ofgenerality on the perceived risk associated with the trans-action.
Hypothesis 5: The intangibility–perceived risk relation-ship will be weaker with the online situation versusthe offline situation.
METHOD
Product Selection
Both generic products and brands within the categorieswere selected for this investigation. Six different productcategories were chosen to increase the external validity ofthe study. They were selected based on three criteria. First,the products should be familiar to the student populationfrom which the sample was selected. Second, productswere chosen based on their expected variability along theperceived-risk and intangibility dimensions. Third, theproducts had to generate different types of risk. On the ba-sis of these guidelines, the following generic products(brands) were selected: jeans (Levi’s), computers (IBM),compact discs (Beatles), Internet browsers (Netscape),pizzeria dinners (Pizza Hut), and checking accounts(Royal Bank).
A pretest revealed that these products were character-ized by various degrees of intangibility and that they in-volved different types of risk. Jeans and computers werethought of as highly tangible goods, whereas music CDswere perceived as less tangible goods. Pizzeria dinnerswere judged as a tangible service, whereas checking ac-counts and Internet browsers were thought of as intangibleservices. The selected products also varied along the di-mensions of perceived risk. For example, a pair of jeanspresented more performance risk, compared to a computerthat entailed financial and performance risks or an Internetbrowser that involved more time risk.
Survey Instrument
A structured, nondisguised questionnaire was devel-oped. Two versions of the questionnaire were used, eachdealing with three of the six products in order to minimizerespondent fatigue. To reduce order effects, two versionsof each questionnaire were used with the products pre-
Laroche et al. / INTANGIBILITY 377

sented in reverse order. For example, the questionnairethat examined the purchase of a computer, a checking ac-count, and a compact disc had a reciprocal counterpart thatexamined the purchase of a compact disc, a checking ac-count, and a computer. These four versions were alsoadapted for brands (in addition to generic products) andfor online purchases (in addition to offline purchase), for atotal of 16 different versions. The versions with brands hadthe brand names added to the instructions and in the bodyof the questions where appropriate (e.g., Levi’s jeans). Theversions that dealt with offline purchases mentioned thebrick-and-mortar situation (e.g., music store for a CD pur-chase) in the instructions and in the body of the questionswhere appropriate. The versions that dealt with the onlinesituation had the word online clearly specified in the in-structions and in the body of the questions where appropri-ate (e.g., online purchase of jeans).
The questionnaires were divided into four subsections.The first three examined the consumer perceptions for thethree different goods or service classes (brands). Each sec-tion dealt with the consumer perceptions of one good orservice (brand). The fourth section (common to all 16 ver-sions) was included to gather general demographic infor-mation about each respondent.
Each questionnaire was pretested with students, andwritten comments were encouraged during the completionof the questionnaire. Following this procedure, minormodifications were made to the wording of the questionsto improve clarity.
Sampling Procedures
Self-administered questionnaires were completed by aconvenience sample of 783 college students at a northeast-ern university. Surveys were collected immediately uponcompletion, which yielded a total of 662 usable question-naires, each dealing with three goods and/or services. Be-cause, in testing the general model, we were interested inthe aggregated responses to each product, this became theunit of analysis, and the sample size was then 1,986 re-sponses. Eighty-five cases either with missing variables orconsidered as outliers were further discarded from thestudy; therefore, the remaining 1,901 observations wereincluded in the final analysis. An outlier was identified if itmet the two conditions simultaneously: (a) It gave the larg-est contribution to normalized multivariate kurtosis, and(b) it changed the estimates of the model after its deletion.
College students were deemed appropriate participantsfor this research because they are familiar and/or con-cerned with the type of products studied and because the-ory is being tested and developed (Calder, Phillips, andTybout 1981). Analyses of demographic information sug-
gest that the sample was representative of the student pop-ulation in terms of gender (approximately 53.6% femalestudents), age (94% were less than 30 years old), and edu-cation level (94% were undergraduate students).
Measurement
Intangibility. The Intangibility Scale developed andvalidated by Laroche, Bergeron, and Goutaland (2001)was used. This scale demonstrated strong reliability andvalidity (convergent and discriminant) properties. Modifi-cations were made to the generality scale based on the pre-vious research (Laroche, Bergeron, and Goutaland 2001).The modified scale more adequately reflected the concep-tual definition of generality (i.e., products are perceived asgeneral if consumers cannot refer precisely to identifiabledefinitions, features, and/or outcomes). The items arepresented in Appendix A.
Perceived risk. Five different types of risk were mea-sured in this study: financial, time, performance, social,and psychological. The Perceived Risk Scales developedby Stone and Gronhaug (1993) were used in this investi-gation. The scales demonstrated good reliability and va-lidity and were built on prior work (Stem, Lamb, andMacLachlan 1977). Three items were employed to mea-sure each risk dimension. For each of the 15 (3 × 5) items,9-point bipolar scales ranging from strongly disagree tostrongly agree were used. The items were worded accord-ingly to the product investigated. For instance, the item “IfI used an Internet browser . . .” was modified to “If I ate apizza . . .” or “If I wore jeans. . . .” One item with poor load-ings on the respective factors (< .50) was dropped out fromthe social risk construct (Pedhazur and Schmelkin 1991).A summary of the items used to measure each constructare presented in Appendix A.
ANALYSES AND RESULTS
Product Selection Check
As a check on the product selection, the means of thegoods and services ratings were compared using the intan-gibility and risk measures (Figure 2 and Appendix B). Forgoods, as expected, the ratings of jeans and computers onthe Physical Intangibility Scale did not show a significantdifference (Mjeans = 1.95 vs. MComputers = 2.00, t = .39, p >.15), but they were significantly lower than the ratings ofmusic CDs (MCDs = 2.39, F2, 962 = 7.46, p = .00). A furtherexamination showed that music CDs and computers wereperceived to have similar levels of generality and mentalintangibility (p >.05), whereas jeans were more tangible
378 JOURNAL OF SERVICE RESEARCH / May 2004

than either CDs or computers (Generality: Mjeans = 2.92 vs.MCDs = 3.57, t = 4.29, p = .00; Mental Intangibility: Mjeans =2.38 vs. MCDs = 2.89, t = 3.48, p = .00). Computers wereperceived to be the most risky purchase, whereas musicCDs were considered the least risky transaction acrossfour out of the five risk dimensions (Financial Risk: F2, 962
= 69.61, p = .00; Performance Risk: F2, 962 = 67.40, p = .00;Social Risk: F2, 962 = 33.50, p = .00; Psychological Risk:F2, 962 = 15.30, p = .00). The ratings of the Time Risk Scalewere not statistically different across groups (F2, 962 = 2.73,p > .05).
For services, pizzeria dinners were perceived as themost tangible service, with ratings much lower than thoseof Internet browsers and checking accounts on allintangibility scales (Physical Intangibility: Mpizzeria = 2.61,Mbrowsers = 6.62, and Mchecking = 7.06; Generality: Mpizzeria =2.91, Mbrowsers = 5.20, and Mchecking = 4.92, F2, 933 = 99.61, p =.00; Mpizzeria = 2.70, Mbrowsers = 4.41, and Mchecking = 4.32, F2, 933
= 61.90, p = .00). As expected, checking accounts obtainedthe highest rating on the Physical Intangibility Scale (t =2.38, p < .05) and the same rating as Internet browsers onthe other two intangibility dimensions (Generality: t = –1.55, p > .10; Mental Intangibility: t = –.48, p > .15). Alook at the differences on risk measures revealed thatInternet browsers were perceived as risky as checking ac-counts (p > .05), yet more risky than pizzeria dinners on fi-nancial risk (F2, 933 = 17.63, p = .00), time risk (F2, 933 = 3.69,p = .25), social risk (F2, 933 = 23.30, p = .00), and psycho-logical risk (F2, 933 = 10.74, p = .00), but not on perfor-
mance risk (F2, 933 = 2.65, p > .05). Overall, the selectedgoods and services have the expected variability in intan-gibility and perceived-risk dimensions.
Testing the Measurement Models
Prior to testing the intangibility–perceived risk model,the reliability and validity of both the Intangibility andPerceived Risk Scales were examined. Statistical pro-cedures used to validate the scales included assess-ment of construct reliability, convergent validity, anddiscriminant validity. In view of well-documented defi-ciencies of exploratory factor analyses and principalcomponents analyses (see, e.g., Fornell 1983; Gorsuch1990), the psychometric properties of the final measureswere assessed by means of confirmatory factor analysesusing the AMOS software (Arbuckle 1997), which usesthe maximum-likelihood estimation method to examinethe fit of models to their respective observed variance-covariance matrices. Different indicators can be used toassess the overall fit qualities of a model using structuralequations modeling. Historically, the chi-square value hasbeen the initial estimator of one model’s fit (Bollen 1989;Browne and Cudeck 1989); however, researchers have re-cently recommended modified versions of the chi-square(Gerbing and Anderson 1993) because it is very sensitiveto sample size and statistical power. Alternatively, accept-able model fits are indicated by both relative (standardizedχ2 [χ2/df], Goodness-of-Fit Index [GFI], Incremental FitIndex [IFI], and Comparative Fit Index [CFI]) and abso-lute (root mean square error of approximation [RMSEA])indexes. The cutoff value suggested for an adequate fit isGFI, IFI, and CFI greater than .90 (Bentler 1992); χ2/dfvalues smaller than 5 (Taylor and Todd 1995); andRMSEA smaller than .05 (Browne and Cudeck 1989).
The measurement model with three dimensions of in-tangibility and five dimensions of perceived risk was ex-amined and resulted in the following acceptable fitindexes: χ2(200, N = 1,901) = 894.3, p < .001; χ2/df = 4.4,GFI = .96, IFI = .98, CFI = .98, RMSEA = .04, as shown inFigure 3.
Fornell and Larcker’s (1981) procedures were followedto evaluate convergent and discriminant validity. Conver-gent validity is established if the average varianceextracted for each factor accounts for .50 or more of thetotal variance. As shown in Table 1, the average varianceextracted for the factors was as follows: .86 for physicalintangibility, .78 for generality, and .59 for mental intangi-bility. Overall, convergent validity was confirmed for eachdimension. Moreover, Anderson and Gerbing (1988)noted that convergent validity is demonstrated by statisti-cally significant path coefficients. In this study, all coeffi-cients are significant at the p < .05 level.
Laroche et al. / INTANGIBILITY 379
FIGURE 2Ratings of Goods and Services on theIntangibility and Perceived Risk Scales
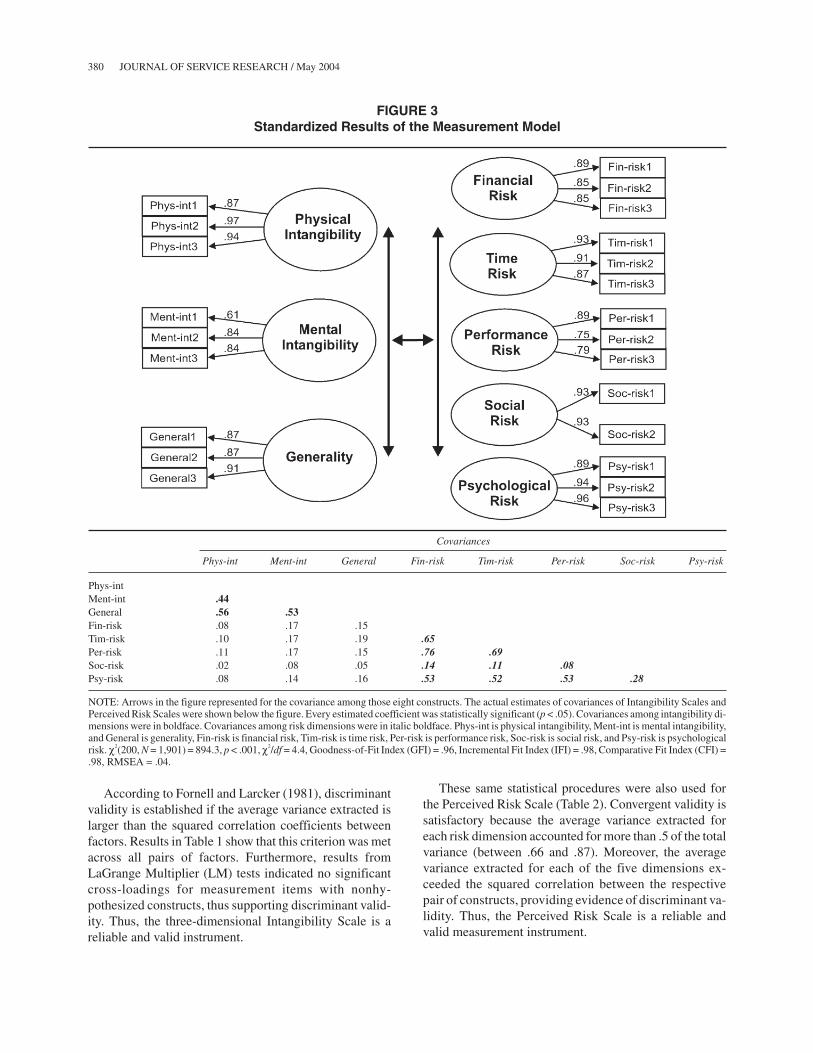
According to Fornell and Larcker (1981), discriminantvalidity is established if the average variance extracted islarger than the squared correlation coefficients betweenfactors. Results in Table 1 show that this criterion was metacross all pairs of factors. Furthermore, results fromLaGrange Multiplier (LM) tests indicated no significantcross-loadings for measurement items with nonhy-pothesized constructs, thus supporting discriminant valid-ity. Thus, the three-dimensional Intangibility Scale is areliable and valid instrument.
These same statistical procedures were also used forthe Perceived Risk Scale (Table 2). Convergent validity issatisfactory because the average variance extracted foreach risk dimension accounted for more than .5 of the totalvariance (between .66 and .87). Moreover, the averagevariance extracted for each of the five dimensions ex-ceeded the squared correlation between the respectivepair of constructs, providing evidence of discriminant va-lidity. Thus, the Perceived Risk Scale is a reliable andvalid measurement instrument.
380 JOURNAL OF SERVICE RESEARCH / May 2004
FIGURE 3Standardized Results of the Measurement Model
Covariances
Phys-int Ment-int General Fin-risk Tim-risk Per-risk Soc-risk Psy-risk
Phys-intMent-int .44General .56 .53Fin-risk .08 .17 .15Tim-risk .10 .17 .19 .65Per-risk .11 .17 .15 .76 .69Soc-risk .02 .08 .05 .14 .11 .08Psy-risk .08 .14 .16 .53 .52 .53 .28
NOTE: Arrows in the figure represented for the covariance among those eight constructs. The actual estimates of covariances of Intangibility Scales andPerceived Risk Scales were shown below the figure. Every estimated coefficient was statistically significant (p < .05). Covariances among intangibility di-mensions were in boldface. Covariances among risk dimensions were in italic boldface. Phys-int is physical intangibility, Ment-int is mental intangibility,and General is generality, Fin-risk is financial risk, Tim-risk is time risk, Per-risk is performance risk, Soc-risk is social risk, and Psy-risk is psychologicalrisk. χ2(200, N = 1,901) = 894.3, p < .001, χ2/df = 4.4, Goodness-of-Fit Index (GFI) = .96, Incremental Fit Index (IFI) = .98, Comparative Fit Index (CFI) =.98, RMSEA = .04.

Testing the Structural Model (H1)
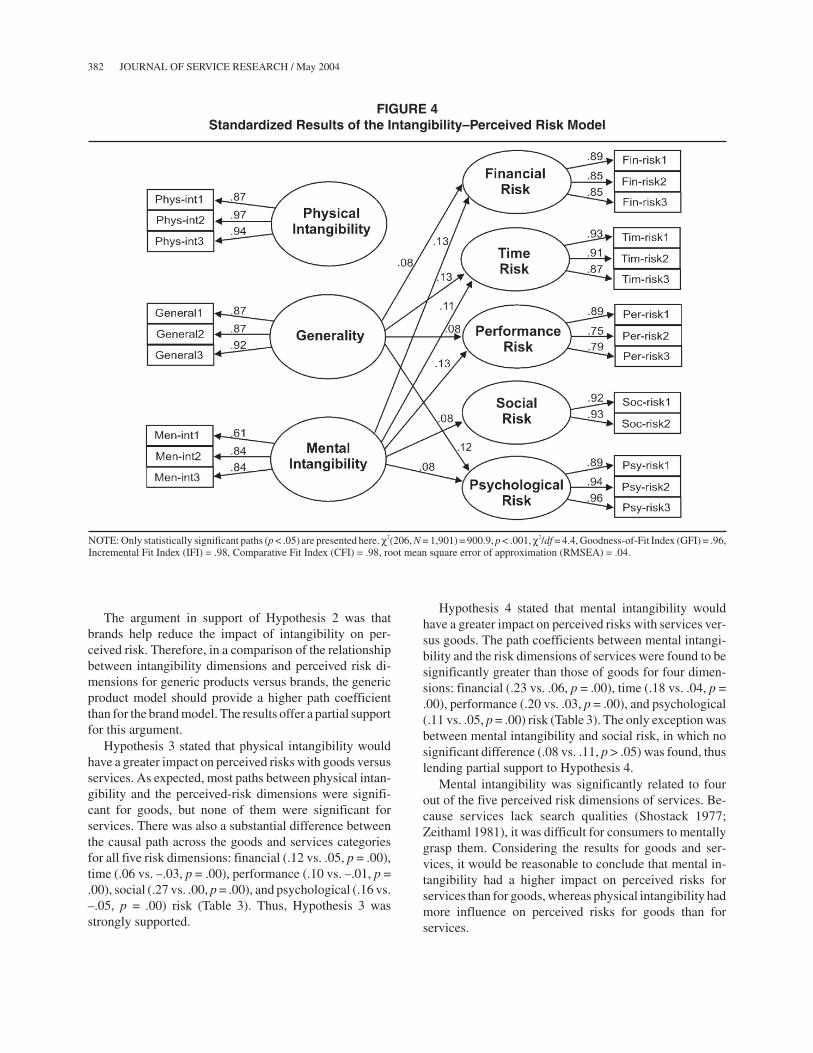
The structural model specified the hypothesized causalrelationships between the three dimensions of intangibil-ity and the five dimensions of perceived risk (see Figure 1).The overall GFI statistics of the general model suggestedthat the proposed model was consistent with the data ac-cording to relative (GFI, IFI, and CFI) and absolute(RMSEA) indexes of fit: χ2(206, N = 1,901) = 900.9, p <.001; χ2/df = 4.4, GFI = .96, IFI = .98, CFI = .98, RMSEA =.04. The results are presented in Figure 4.
The first hypothesis states that the three dimensions ofintangibility will be significantly related to the five dimen-sions of perceived risk. This hypothesis was partially sup-ported in that only mental intangibility was significantlyrelated to all five dimensions of perceived risk.
Specifically, mental intangibility had a significant ef-fect on financial risk (.13), performance risk (.13), timerisk (.11), psychological risk (.08), and social risk (.08)(Figure 4). The consumer’s ability to mentally grasp agood or service was the major determinant of theperceived-risk dimensions, relative to either generality orphysical intangibility. Because the perception of risk is
subjective (Bauer 1960), it follows that mentalintangibility would be related to the uncertainty in themental representation of the good or service. People whoare unable to develop a mental representation of the prod-uct will have difficulty evaluating it regardless of whetherthe product has a physical presence or not.
Generality, the inability to precisely define a particulargood, was significantly related to four perceived-risk di-mensions, time risk (.13), psychological risk (.12), finan-cial risk (.08), and performance risk (.08), in that order(Figure 4). Recognizing the exploratory nature of this re-search, it was reasonable to conclude that as generality in-creased, the consumer perceived that it would take moretime to make a decision; put more effort in searching for,and screening of, the appropriate information to make aselection; and felt more difficulty in evaluating the good.
Physical intangibility, the extent to which a good can-not be touched or seen, had no significant impact on any ofthe risk dimensions (p > .15). At the aggregated level, the(un)availability of physical cues does not dramatically in-fluence any type of risk.
Tests of Hypotheses 2 to 5
To test the remaining hypotheses, and using EQS, sixindependent risk models (baseline models) were analyzedfor each subsample (i.e., generic products, brands, goods,services, online purchases, offline purchases), and thentwo additional levels of constraints (i.e., measurementportion and the structural part) were introduced to eachpair of models (i.e., generic products vs. brands, goods vs.services, and online purchases vs. offline purchases) totest for their equality (Byrne 1994).
The second hypothesis stated that the intangibility–perceived risk model would have a stronger relationshipwith generic products versus brands. As hypothesized, themodel had a larger standardized coefficient with genericproducts than with brands in the relationships betweengenerality and three of the five risk dimensions: financial(.18 vs. .06, p < .05), performance (.12 vs. .08, p < .05),and psychological risk (.16 vs. .12, p = .00), as shown inTable 3. For the other two risk dimensions, time and social,the causal path differences between brands and genericproducts were not significant (p > .15). A look at the pathcoefficients for the mental intangibility–risk relationshipshowed, however, an opposite phenomenon: The impactof mental intangibility on perceived risk was weaker forgeneric products versus brands, specifically for financialrisk (.09 vs. .18, p = .02), performance risk (.12 vs. .16, p =.01), and psychological risk (.06 vs. .11, p < .05). More-over, all paths from physical intangibility to the five typesof risk were insignificant across both categories. Thus,Hypothesis 2 was partially supported.
Laroche et al. / INTANGIBILITY 381
TABLE 1Tests for Convergent and DiscriminantValidity of the Intangibility Dimensions
Physical MentalConstruct Intangibility Generality Intangibility
Physical intangibility .86Generality .32 .78Mental intangibility .20 .28 .59
NOTE: The diagonal entries show Fornell and Larcker’s (1981) index ofthe average variance extracted by the construct. Entries below the diago-nal represent squared correlation coefficients.
TABLE 2Tests for Convergent and Discriminant
Validity of the Perceived Risk Dimensions
Financial Time Performance Social PsychologicalConstruct Risk Risk Risk Risk Risk
Financial risk .74Time risk .42 .82Performance risk .58 .48 .66Social risk .02 .01 .01 .86Psychological risk .28 .27 .28 .08 .87
NOTE: The diagonal entries show Fornell and Larcker’s (1981) index ofthe average variance extracted by the construct. Entries below the diago-nal represent squared correlation coefficients.
The argument in support of Hypothesis 2 was thatbrands help reduce the impact of intangibility on per-ceived risk. Therefore, in a comparison of the relationshipbetween intangibility dimensions and perceived risk di-mensions for generic products versus brands, the genericproduct model should provide a higher path coefficientthan for the brand model. The results offer a partial supportfor this argument.
Hypothesis 3 stated that physical intangibility wouldhave a greater impact on perceived risks with goods versusservices. As expected, most paths between physical intan-gibility and the perceived-risk dimensions were signifi-cant for goods, but none of them were significant forservices. There was also a substantial difference betweenthe causal path across the goods and services categoriesfor all five risk dimensions: financial (.12 vs. .05, p = .00),time (.06 vs. –.03, p = .00), performance (.10 vs. –.01, p =.00), social (.27 vs. .00, p = .00), and psychological (.16 vs.–.05, p = .00) risk (Table 3). Thus, Hypothesis 3 wasstrongly supported.
Hypothesis 4 stated that mental intangibility wouldhave a greater impact on perceived risks with services ver-sus goods. The path coefficients between mental intangi-bility and the risk dimensions of services were found to besignificantly greater than those of goods for four dimen-sions: financial (.23 vs. .06, p = .00), time (.18 vs. .04, p =.00), performance (.20 vs. .03, p = .00), and psychological(.11 vs. .05, p = .00) risk (Table 3). The only exception wasbetween mental intangibility and social risk, in which nosignificant difference (.08 vs. .11, p > .05) was found, thuslending partial support to Hypothesis 4.
Mental intangibility was significantly related to fourout of the five perceived risk dimensions of services. Be-cause services lack search qualities (Shostack 1977;Zeithaml 1981), it was difficult for consumers to mentallygrasp them. Considering the results for goods and ser-vices, it would be reasonable to conclude that mental in-tangibility had a higher impact on perceived risks forservices than for goods, whereas physical intangibility hadmore influence on perceived risks for goods than forservices.
382 JOURNAL OF SERVICE RESEARCH / May 2004
FIGURE 4Standardized Results of the Intangibility–Perceived Risk Model
NOTE: Only statistically significant paths (p < .05) are presented here. χ2(206, N = 1,901) = 900.9, p < .001, χ2/df = 4.4, Goodness-of-Fit Index (GFI) = .96,Incremental Fit Index (IFI) = .98, Comparative Fit Index (CFI) = .98, root mean square error of approximation (RMSEA) = .04.

Hypothesis 5 stated that the intangibility–perceivedrisk model would have a weaker relationship with the on-line situation versus the offline situation. In support of thishypothesis, three of the path coefficients (Table 3) werelower in the online purchase situation than in the offlinebuying situation: the relationships between generality andtime risk (.13 vs. .19, p = .01), generality and performancerisk (.04 vs. .13, p = .00), and mental intangibility and psy-chological risk (.05 vs. .12, p = .00). There was no signifi-cant difference in the rest of the relationship paths acrosstwo purchase modes (all p > .05). Therefore, Hypothesis 5was partially supported.
Cox and Rich (1964) argued that certain forms of shop-ping may be riskier to the consumer than others, especiallythose that do not offer visual or tangible cues. This state-ment does not contradict our results. Our findings suggestthat the online environment helps diminish the perceived
risk caused by the intangible attributes of the product,which does not necessarily mean the risk level will belower in the online versus the offline purchase. A review ofthe mean scores for the five Perceived Risk Scales showed(Table 4) that all five perceived risk dimensions were sig-nificantly greater for the online than the offline environ-ments. More interestingly, no significant difference wasfound in any of the three intangibility scale means acrossthese two purchase situations. In other words, respondentsdid not perceive any differences in intangibility in the twopurchase situations.
This finding indicates that although intangibility doesinfluence perceived risk in the online environment, it is ap-parent that other factors might be influencing perceivedrisk, relative to the offline environment. Here, perceivedrisk is more likely to be driven by such factors as privacyand security concerns (Hoffman, Novak, and Peralta
Laroche et al. / INTANGIBILITY 383
TABLE 3Results of Invariance Tests for the Intangibility–Perceived Risk Model Across Different Categories
Brands Versus Generic Products Goods Versus Services Online Versus Offline PurchasesCausal Pathsa in theIntangibility–Perceived Standardized Standardized StandardizedRisk Model β Valuesb χ2 pc β Valuesb χ2 pc β Valuesb χ2 pc
PHYS-INT → FIN-RISK –.02 vs. –.07 .12b vs. .05 –.07 vs. .01PHYS-INT → TIM-RISK –.02 vs. –.03 .06 vs. –.03 –.07 vs. .02PHYS-INT → PER-RISK .04 vs. –.04 .10b vs. –.01 –.04 vs. .06PHYS-INT → SOC-RISK –.04 vs. –.01 .27b vs. .00 –.04 vs. .01PHYS-INT → PSY-RISK –.06 vs. –.02 .16b vs. –.05 –.07 vs. .01GENERAL → FIN-RISK .06 vs. .18b –.05 vs. .12b .11b vs. .10b 3.60 .06GENERAL → TIM-RISK .10b vs. .10b .05 .83 .06 vs. .14b .13b vs. .19b 7.11 .01GENERAL → PER-RISK .08 vs. .12b –.04 vs. .13b .04 vs. .13b
GENERAL → SOC-RISK –.01 vs. .04 –.12b vs. .05 .02 vs. .06GENERAL → PSY-RISK .12b vs. .16b 10.34 .00 –.03 vs. .21b .17b vs. .14b .10 .32MENT-INT → FIN-RISK .18b vs. .09b 5.36 .02 .06 vs. .23b .12b vs. .14b .49 .48MENT-INT → TIM-RISK .10b vs. .11b .28 .60 .04 vs. .18b .10b vs. .11b .11 .74MENT-INT → PER-RISK .16b vs. .12b 6.96 .01 .03 vs. .20b .13b vs. .12b .01 .92MENT-INT → SOC-RISK .08 vs. .08 .11b vs. .08 .06 vs. .08MENT-INT → PSY-RISK .11b vs. .06 .05 vs. .11b .05 vs. .12b
Fit indexes Baseline model (brands): Baseline model (goods): Baseline model (online):χ2(194, N = 951) = 435.1, c2(194, N = 965) = 445.1, χ2(194, N = 958) = 467.4,χ2/df = 2.2, CFI = .97 χ2/df = 2.3, CFI = .99 χ2/df = 2.4, CFI = .99Baseline model (generic products): Baseline model (services): Baseline model (offline):χ2(194, N = 950) = 536.2, χ2(194, N = 936) = 492.5, χ2(194, N = 943) = 529.6,χ2/df = 2.8, CFI = .97 χ2/df = 2.5, CFI = .98 χ2/df = 2.7, CFI = .98Invariance test: Invariance test:χ2(447) = 1,414.13, χ2(447) = 1,452.1,p < .001, χ2/df = 3.2, GFI = .96, p < .001, χ2/df = 3.3, GFI = .96,IFI = .97, CFI = .97, RMSEA = .04 IFI = .97, CFI = .97, RMSEA = .04
NOTE: CFI = Comparative Fit Index; GFI = Goodness-of-Fit Index; IFI = Incremental Fit Index; RMSEA = root mean square error of approximation.a. Phys-int = physical intangibility; Ment-int = mental intangibility; General = generality; Fin-risk = financial risk; Tim-risk = time risk; Per-risk = perfor-mance risk; Soc-risk = social risk; Psy-risk = psychological risk.b. This causal path is statistically significant (p < .05). Asymmetric paths (i.e., causal path significant at one category but not the other) are italicized.c. Only symmetric paths (i.e., causal path significant at both categories) were compared. Small p values (p < .05) indicated significant invariance betweenthe pair of causal paths.

1999; Miyazaki and Fernandez, 2001). To better under-stand the intangibility–perceived risk model in the on-line environment, it would be appropriate to incorporateprivacy, security, and other moderators into the model.This would help determine the relative influence of intan-gibility in the online context.
DISCUSSION
Intangibility
This study provides theoretical and practical contribu-tions to the service marketing literature. The results con-firm that intangibility is a three-dimensional construct,whether in the overall model and across goods and ser-vices, generic products and brands, and online and offlinepurchase situations. Consequently, this Intangibility Scaleis a psychometrically sound measure for both theoreticaland applied research.
Perceived Risk
Even though several types of risk were identified in theliterature (Jacoby and Kaplan 1972; Roselius 1971), mul-tiple measures of this concept were seldom employed inmarketing (Stone and Gronhaug 1993). This researchshowed that all five dimensions were distinct (Figure 3),thereby lending strong support to the reliability and valid-ity of Stone and Gronhaug’s (1993) scale as a measure ofperceived risk. Of interest was the relatively low contribu-
tion of social risk in all situations (Tables 3). Although itmay have reflected, in part, the products selected for thestudy, the social risk measures probably need to beimproved in future research in this area.
Intangibility and Perceived Risk
This research identified a significant strong impact ofmental intangibility and generality on most of the risk di-mensions (Figure 4). The importance of this finding is thatthe consumer’s ability to mentally grasp a good or serviceand the consumer’s difficulty in precisely defining or de-scribing a particular good are major determinants of theperceived-risk dimensions. This confirmed findings thatcreating strong mental representations and specific defini-tions of the product are critical to the tangibilization of ser-vices (Breivik, Troye and Olsson 1998; Mittal 2002). Ifsomeone does not know what a car engine is made of, thefact that it is a physical object will not be enough to easethe evaluation process. This would also support the strongrelationship between mental intangibility/generality andthe perceived risk dimensions.
Physical intangibility emerged as the least importantdimension of overall intangibility, with significant impactonly emerging for goods. This finding is consistent withBreivik, Troye, and Olsson’s (1998) study, in which theyfound that people have less difficulty evaluating physi-cally intangible versus physically tangible goods and ser-vices. The rationale behind this fact is that consumers callfor mental representations of the product that are resul-tant of prior knowledge, a process that requires less effortthan processing the information derived from tangible at-tributes (Breivik, Troye and Olsson 1998; Hirschman1980).
As hypothesized, the intangibility–perceived riskmodel had a stronger relationship with generic productsthan with brands for the generality dimension (Table 3).This finding is reasonable because brand names are usu-ally considered as product-specific information. In thissense, brand names will facilitate consumers to some ex-tent in their information search process, thus diminishingthe effort in forming consideration sets. In line with thisdiscussion, brand names should also enhance mental rep-resentations of the products and weaken the impact ofmental intangibility on perceived risk. However, an unex-pected finding appeared. Mental intangibility was found tohave a stronger influence on financial, time, and psycho-logical risks for brand categories than for generic productcategories. A possible explanation is that, in the presentstudy, we did not attach the benefits and qualities of theproduct to the specific brand of each product category. Be-cause there are many brands in each selected product, this
384 JOURNAL OF SERVICE RESEARCH / May 2004
TABLE 4Mean Scores for the Intangibilityand Perceived-Risk Dimensionsa
Online Offline
Dimension M SD M SD t-Value p Value
IntangibilityPhys-int 3.83 2.92 3.75 2.93 0.59 .56General 3.83 2.31 3.90 2.31 –0.68 .50Ment-int 3.23 2.19 3.21 2.14 0.20 .84Perceived RiskFin-risk 3.71 2.30 2.89 2.13 8.14 .00Tim-risk 3.64 2.30 2.54 1.88 11.38 .00Per-risk 4.35 2.35 3.42 2.16 8.98 .00Soc-risk 1.99 1.43 1.63 1.05 6.30 .00Psy-risk 2.87 2.26 1.75 1.48 12.77 .00
a. Phys-int = physical intangibility; Ment-int = mental intangibility; Gen-eral = generality; Fin-risk = financial risk; Tim-risk = time risk; Per-risk =performance risk; Soc-risk = social risk; Psy-risk = psychological risk.
would probably make the mental representations of thatbrand more difficult. Although the reason why brandnames of this study, versus generic products, generated acloser relationship between mental intangibility and per-ceived risk is still unknown, it is obvious that the patternsof the intangibility–perceived risk relationship are differ-ent between brands and generic products.
It was hypothesized that the physical (mental) intangi-bility–perceived risk relationship would be stronger(weaker) with goods versus services. The results lentstrong support for the physical intangibility hypothesis(Hypothesis 3), but only partial support for the mentalintangibility hypothesis (Hypothesis 4). Physical intan-gibility was significantly related to four out of five per-ceived-risk dimensions with goods, but none of five pathswere found to be significant for services. Mental intangi-bility, on the other hand, was significantly related to fourperceived-risk dimensions only for services. This sup-ports the argument that because services lack search quali-ties (Shostack 1977; Zeithaml 1981), it is difficult forconsumers to mentally grasp them. The fact that physical(mental) intangibility was more closely linked to per-ceived risk for goods (services) suggests that there are alsodifferences in the intangibility–perceived risk model be-tween goods and services.
The intangibility–perceived risk model was found tohave a stronger relationship in the offline versus the onlineenvironment. This finding indicates that factors other thanintangibility, such as privacy, security concerns, assur-ance, and trust, are also likely to influence perceived risksin the online environment (Miyazaki and Fernandez 2001;Yoon 2002; Zeithaml, Parasuraman, and Malhotra 2002).For example, Web site trust, which includes security andWeb site properties, is significantly related to online pur-chase intentions and Web site satisfaction (Yoon 2002).Privacy and security concerns have been hypothesized toinfluence e-service quality and purchase intentions(Zeithaml, Parasuraman, and Malhotra 2000). Althoughbeyond the scope of this article, it is possible that the driv-ers of perceived risk in the online environment includeother dimensions besides intangibility as main effects.
Some authors argue that the Internet, a fairly intangiblemedium, is currently used as a means of tangibilizing theintangible (Berthon et al. 1999). As an illustration, con-sider a consumer who wants to visit London for the firsttime. No matter how much information he or she has gath-ered from friends and associates, until the visit actually oc-curs, the visitor will not be able to judge the quality of theexperience. The highly acclaimed Strolling Web site(www.strolling.com) allows its visitors to immerse them-selves in images of great international cities. The con-sumer is now able to look at detailed maps of London,
clicking on each location to view a 360-degree surroundpicture or video of the city at that particular point. Thistype of virtual presence is an excellent example of theWeb’s ability to tangibilize a previously intangible experi-ence (Berthon et al. 1999).
MANAGERIAL IMPLICATIONS
Firms offering high perceived risk goods and/or ser-vices can pursue two strategies to reduce consumer risk:implement initiatives that directly address the risk (e.g.,guarantees) and/or the factors that contribute to the risk(e.g., increase tangibility). Some of these initiatives arenot mutually exclusive but in many cases will be more ef-fective in addressing the cause (intangibility) or the result(perceived risk). An important finding of this research,namely, that intangibility was a significant contributor toperceived risk, indicates there is merit in focusing somemarketing initiatives on increasing tangibility. Specifi-cally, on the basis of this research, firms should considerinitiatives to increase mental tangibility and specificity.
Firms that can effectively reduce consumers’perceivedrisk are providing an important source of consumer value,which translates into a competitive advantage. Servicemarketing strategists have suggested a plethora of tacticsto reduce the perception of risks associated with intangibleofferings. However, most of these approaches have dealtwith physical intangibility. Because it was found that per-ceived risk was strongly related to the mental dimension ofintangibility and generality, as opposed to its physicalcounterpart, the following implications seek to augmentthe mental tangibility and specificity of goods andservices.
In service settings, many aspects of the service produc-tion are not visible to the customer. Letting consumersevaluate and monitor a service production can increase themental tangibility that customers have of the service pro-vider and thus reduce the perception of risk. For instance,United Parcel Service (UPS) and Federal Express (FedEx)provide tracking numbers for shipments so consumers canuse the Internet to know exactly where a package is andwhat time it arrived at each intermediate and final destina-tion. The U.S. Postal Service does not provide this for Ex-press Mail, which may raise perceived risks for thatservice.
To increase the tangibility of a mentally intangible and/or general offer, firms could provide information from ob-jective product reviews. Many companies ensure that theirsalespeople, brochures, and Web sites provide reviewsfrom “neutral” media. Additional information could comefrom satisfied (or discontented) clients. Saturn, for exam-
Laroche et al. / INTANGIBILITY 385

ple, regularly sponsors a gathering of clients who owntheir vehicle. This strategy would not only increase the cli-ents’ mental tangibility and specificity of the offering butalso lower the social risk associated with this purchase.
Advertising can play an important role in reducingmental intangibility and generality (Mittal 1999). Strate-gies can include visualization, creating a vivid mental pic-ture of a service’s benefits or qualities (Berry and Clark1986; Stafford 1996), narratives, focusing on the subjec-tive human experience (Padgett and Allen 1997) and ser-vice process episode, and depiction of the service process(Mittal 1999).
The development of brand names for goods and ser-vices has also been discussed as a useful method of estab-lishing an image in consumers’minds (Onkvisit and Shaw1989). Brand names should suggest something about thebenefits and qualities of the product and help lower theperceived risks. Some pertinent examples are Federal Ex-press, Pizza Hut, LensCrafters, and Comfort Inns. Thisstrategy gives the consumer something mentally tangibleand specific with which to associate the service, and itmakes the process of pre- and postservice evaluationeasier and less risky.
To increase a consumer’s mental representation andspecificity of a product (and reduce his or her perceivedrisks), marketers should put much more emphasis on freetrial periods. For instance, computer firms such asMicrosoft, Adobe, or Macromedia allow consumers todownload an updated version of their software for a 30-day trial period. Similarly, car companies offer customersto rent and then apply rental fees to purchase if they decideto buy. One could even benefit from a free trial of theProquest software and read the Journal of Service Re-search on one’s home computer for a limited period oftime.
Due to the extensive and worldwide adoption of theInternet, intangibility will be increasingly present in soci-ety. The challenge for marketers might not be so much toincrease the physical tangibility of their offering, as hasbeen extensively advocated for the past three decades, butrather to mentally tangibilize and enhance the specificityof their goods and services so that the appropriate riskdimension(s) could be reduced.
LIMITATIONS AND FUTURE RESEARCH
The limitations of the study include the use of a studentsample. Although students are the most convenient re-spondents available to academic researchers, they do notrepresent the general adult population. However, for thepurpose of theory development, students are considered tobe an acceptable sample (Calder, Phillips, and Tybout1981). Moreover, this population offers the potential ad-vantage of being adapted to future research in the same ac-ademic field. Nevertheless, a more realistic environmentcould involve households instead of students, becausethey buy more for themselves, have experience in moreproduct categories, and may also have a more precise rep-resentation of certain goods and services (Laroche,Bergeron, and Goutaland 2001).
Another limitation is the set of goods and services se-lected for this study, which might have affected the results.Further empirical examination should include differentproducts. More and more physically intangible productsexist in our society, which are often called “informationproducts” (Freiden et al. 1998). Hence, it could be usefulto examine the relationship between highly intangiblegoods (e.g., software) and risk perceptions. It could alsoprove interesting to investigate goods and services that areknown to be extremely risky, such as law services andsurgeries.
A third limitation concerns the interesting findingsabout the online environment that was tested using thepaper survey method. Further research should look attesting the relationship between intangibility and per-ceived risk using an online questionnaire and measuringa number of potential moderators such as privacy and se-curity concerns.
This research extends the understanding of intangibil-ity and perceived risk by using multiple dimensions forboth intangibility and perceived risk and by direct model-ing to identify the relationships between the individual di-mensions of intangibility and perceived risk across goods,services, brands, generic products, and purchase situa-tions. It forms a basis for further research on two of themost important variables in marketing and consumerbehavior: intangibility and perceived risk.
386 JOURNAL OF SERVICE RESEARCH / May 2004

Laroche et al. / INTANGIBILITY 387
APPENDIX AMeasures and Reliability Analyses
Constructs/Measuresa Croubach
Intangibility (INTANG)b
Physical Intangibility .95PHYS-INT1c This item is very easy to see and touch.PHYS-INT2c I can physically grasp this item.PHYS-INT3c This item is very tangible.
Generality .91GENERAL1c I could easily explain many features associated with this item.GENERAL2c It is not difficult to give a precise description of this item.GENERAL3c It is easy to describe many features related to this item.
Mental Intangibility .80MENT-INT1 I need more information about this item in order to make myself a clear idea of what it is.MENT-INT2 This is a difficult product to think about.MENT-INT3 This is not the sort of product that is easy to picture.
Perceived Risk (RISK)b
Financial Risk .90FIN-RISK1 If I bought an item for myself within the next 12 months, I would be concerned that the financial
investment I would make would not be wise.FIN-RISK2 Purchasing this item could involve important financial losses.FIN-RISK3 If I bought an item for myself within the next 12 months, I would be concerned that I would not
get my money’s worth.Time Risk .91
TIM-RISK1 Purchasing an item could lead to an inefficient use of my time.TIM-RISK2 Purchasing an item could involve important time losses.TIM-RISK3 The demands on my schedule are such that purchasing an item concerns me, because it could
create even more time pressures on me that I don’t need.Performance Risk .88
PER-RISK1 If I were to purchase an item within the next 12 months, I would become concerned that the itemwill not provide the level of benefits that I would be expecting.
PER-RISK2 As I consider the purchase of an item soon, I worry about whether it will really “perform” aswell as it is supposed to.
PER-RISK3 The thought of purchasing an item causes me to be concerned for how really reliable that product will be. .92Social Risk
SOC-RISK1c If I bought an item, I think I would be held in higher esteem by my friends.SOC-RISK2c If I bought an item, I think I would be held in higher esteem by my family.
Psychological Risk .95PSY-RISK1 The thought of purchasing an item gives me a feeling of unwanted anxiety.PSY-RISK2 The thought of purchasing an item makes me feel psychologically uncomfortable.PSY-RISK3 The thought of purchasing an item causes me to experience unnecessary tension.
a. The term item was replaced with the appropriate product in the surveys. Each question was rephrased in accordance to the proper product.b. Each question was measured on a 9-point Likert-type scale (strongly disagree to strongly agree).c. This item was reversed.
APPENDIX BMeans and Standard Deviations of Goods and Services Ratings Using Intangibility and Perceived Risk Scales
Physical Mental Financial Time Performance Social PsychologicalIntangibility Generality Intangibility Risk Risk Risk Risk Risk
M SD M SD M SD M SD M SD M SD M SD M SD
Jeans 1.95 1.36 2.92 1.80 2.38 1.76 3.30 2.24 2.99 2.20 4.50 2.43 1.53 0.83 2.18 1.20CDs 2.00 1.67 3.57 2.32 2.56 1.79 2.57 1.91 2.88 2.21 2.72 1.74 2.00 1.45 2.06 1.78Computers 2.39 1.68 3.58 2.05 2.89 1.96 4.54 2.27 3.26 1.96 4.35 2.26 2.38 1.56 2.86 2.19Pizzeria dinners 2.61 2.08 2.91 2.03 2.70 1.95 2.54 2.12 2.88 2.27 3.70 2.45 1.29 0.65 1.90 1.76Internet browsers 6.62 2.25 5.20 2.29 4.41 2.37 3.53 2.14 3.35 1.99 4.12 2.10 1.86 1.26 2.25 1.77Checking accounts 7.06 2.37 4.92 2.23 4.32 2.06 3.30 2.23 3.18 2.25 4.01 2.39 1.77 1.27 2.62 2.23

REFERENCES
Alba, J. W., J. Lynch, B. Weitz, C. Janiszweski, R. J. Lutz, A. Sawyer, andS. Wood (1997), “Interactive Home Shopping: Consumer, Retailer,and Manufacturer Incentives to Participate in Electronic Market-places,” Journal of Marketing, 61 (July), 38-53.
Anderson, J. and D. Gerbing (1988), “Structural Equation Modeling inPractice: A Review and Recommended Two Step Approach,” Psy-chological Bulletin, 103 (May), 411-23.
Arbuckle, J. (1997), Amos Users’Guide Version 3.6. Chicago: Small Wa-ters Corporation.
Bauer, R. A. (1960), “Consumer Behavior as Risk Taking,” in Risk Takingand Information Handling in Consumer Behavior, Donald F. Cox, ed.Cambridge, MA: Harvard University Press, 23-33.
Bebko, C. P. (2000), “Service Intangibility and Its Impact on ConsumerExpectations of Service Quality,” Journal of Services Marketing, 14(1), 9-26.
Bentler, P. M. (1992), EQS: Structural Equations Program Manual. LosAngeles: BMDP Statistical Software.
Berry, L. L. (1980), “Services Marketing Is Different,” Business, (May–June), 16-23.
(2000), “Cultivating Service Brand Equity,” Journal of the Acad-emy of Marketing Science, 28 (1), 128-37.
and T. Clark (1986), “Four Ways to Make a Service More Tangi-ble,” Business, 36 (October–December), 53-54.
Berthon, P., L. Pitt, C. S. Katsikeas, and J. P. Berthon (1999), “ExecutiveInsights: Virtual Services Go International: International Services inthe Marketspace,” Journal of International Marketing, 7 (3), 84-105.
Bobbitt, L. M. and P. A. Dabholkar (2001), “Integrating AttitudinalTheories to Understand and Predict Use of Technology-Based Self-Service,” International Journal of Service Industry Management, 12(5), 423-50.
Bollen, K. A. (1989), Structural Equations with Latent Variables. NewYork: John Wiley.
Breivik, E., S. V. Troye, and U. H. Olsson (1998), “Dimensions of Intan-gibility and Their Impact on Product Evaluation,” working paper, pre-sented at the annual conference of the Association for ConsumerResearch, October, Montreal, Canada.
Browne, M., and R. Cudeck (1989), “Single Sample Cross Validation In-dices for Covariance Structures,” Multivariate Behavioral Research,24, 445-55.
Byrne, B. M. (1994), Structural Equation Modeling with EQS/Windows.Thousand Oaks, CA: Sage.
Calder, B. J., L. W. Phillips, and A. M. Tybout (1981), “Designing Re-search for Application,” Journal of Consumer Research, 8 (2), 197-208.
Campbell, M. C., and R. C. Goodstein (2001), “The Moderating Effect ofPerceived Risk on Consumers’ Evaluations of Product Incongruity:Preference for the Norm,” Journal of Consumer Research, 28 (3),439-49.
Cox, D. F., and S. V. Rich (1964), “Perceived Risk and Consumer Deci-sion Making—The Case of Telephone Shopping,” in Risk Taking andInformation Handling in Consumer Behavior, Donald F. Cox, ed.Cambridge, MA: Harvard University Press, 487-506.
De Ruyter, K., M. Wetzels, and M. Kleijnen (2001), “Customer Adoptionof E-service: An Experimental Study,” International Journal of Ser-vice Industry Management, 12 (2), 184-207.
Dowling, G. R. (1999), “Perceived Risk,” in The Elgar Companion toConsumer Research and Economic Psychology, Peter E. Earl and Si-mon Kemp, eds. Cheltenham, UK: Edward Elgar, 419-24.
and R. Staelin (1994), “A Model of Perceived Risk and Risk-Handling Activities,” Journal of Consumer Research, 21 (June),119-34.
Finn, A. (1985), “A Theory of the Consumer Evaluation Process for NewProduct Concepts,” Research in Consumer Behavior, 1, 35-65.
Flipo, J. P. (1988), “On the Intangibility of Services,” The Service Indus-tries Journal, 8 (3), 286-300.
Fornell, C. (1983), “Issues in the Application of Covariance StructureAnalysis: A Comment,” Journal of Consumer Research, 9, 443-48.
and D. F. Larcker (1981), “Evaluating Structural Equation Mod-els with Unobservable Variables and Measurement Error,” Journal ofMarketing Research, 18 (2), 39-50.
Freiden, J., R. Goldsmith, S. Takacs, and C. F. Hofacker (1998), “Infor-mation as a Product: Not Goods, Not Services,” Marketing Intelli-gence and Planning, 16 (3), 210-20.
Gerbing, D. W. and J. C. Anderson (1993), “Multifaceted Conceptions ofFit in Structural Equation Models,” in Testing Structural EquationModels, K. A. Bollen and J. S. Long, eds. Newbury Park, CA: Sage,10-39.
Gillett, P. L. (1976), “In-home Shoppers: An Overview,” Journal of Mar-keting, 34, 40-45.
Gorsuch, R. L. (1990), “Common Factor Analysis versus ComponentAnalysis: Some Well and Little Known Facts.” Multivariate Behav-ioral Research, 25 (1), 33-39.
Havlena, W. J. and W. S. DeSarbo (1990), “On the Measurement of Per-ceived Consumer Risk,” Decision Sciences, 22, 927-39.
Hirschman, Elizabeth C. (1980), “Attributes of Attributes and Layers ofMeaning,” in Advances in Consumer Research, Vol. 7, Jerry C. Olson,ed. Provo, UT: Association for Consumer Research, 7-12.
Hoffman, D., P. Novak, and M. Peralta (1999), “Building Consumer TrustOnline,” Communications of the ACM, 42 (4), 80-85.
Jacoby, J. and L. Kaplan (1972), “The Components of Perceived Risk,” inAnnual Conference of the Association for Consumer Research, M.Venkatesan, ed. Chicago: Association for Consumer Research,382-93.
Kaplan, L. B., G. J. Szybillo, and J. Jacoby (1974), “Components of Per-ceived Risk in Product Purchase,” Journal of Applied Psychology, 59(June), 287-91.
Laroche, M., J. Bergeron, and C. Goutaland (2001), “A Three-Dimensional Scale of Intangibility,” Journal of Service Research, 4(1), 26-38.
McDougall, G. H. G. (1987), “Determinants of Ease of Evaluation: Prod-ucts and Services Compared,” Canadian Journal of AdministrativeSciences, 4 (December), 426-46.
and D. W. Snetsinger (1990), “The Intangibility of Services:Measurement and Competitive Perspectives,” Journal of ServicesMarketing, 4 (Fall), 27-40.
Mitchell, V. W. (1999), “Consumer Perceived Risk: Conceptualizationsand Models,” European Journal of Marketing, 33 (1/2), 163-95.
and M. Greatorex (1993), “Risk Perception and Reduction in thePurchase of Consumer Services,” The Service Industries Journal, 13(October), 179-200.
Mittal, B. (1999), “The Advertising of Services: Meeting the Challengeof Tangibility,” Journal of Service Research, 2 (August), 98-116.
(2002), “Services Communications: From Mindless Tangibiliza-tion to Meaningful Messages,” Journal of Services Marketing, 16 (5),421-31.
Miyazaki, A. D. and A. Fernandez (2001), “Consumer Perceptions of Pri-vacy and Security Risks for Online Shopping,” Journal of ConsumerAffairs, 35 (1), 27-44.
Murray, K. B. and J. L. Schlacter (1990), “The Impact of Services VersusGoods on Consumer’s Assessment of Perceived Risk and Variabil-ity,” Journal of the Academy of Marketing Science, 18 (1), 51-65.
Onkvisit, S. and J. Shaw (1989), “Service Marketing: Image, Branding,and Competition,” Business Horizons, 32 (1), 13-19.
Oxford Dictionary of Current English (1996), Oxford, UK: Oxford Uni-versity Press, 438, 460, 931.
Padgett, D. and D. Allen (1997), “Communicating Experiences: A Narra-tive Approach to Creating Service Brand Image,” Journal of Advertis-ing, 26 (4), 55-62.
Pedhazur, E. and L. Schmelkin (1991), Measurement, Design and Analy-sis: An Integrated Approach. Hillsdale, NJ: Lawrence Erlbaum.
Peter, J. P. and M. J. Ryan (1976), “An Investigation of Perceived Risk atthe Brand Level,” Journal of Marketing Research, 13 (May), 184-88.
388 JOURNAL OF SERVICE RESEARCH / May 2004
Roselius, E. (1971), “Consumer Rankings of Risk Reduction Methods,”Journal of Marketing, 35 (1), 56-61.
Shostack, G. L. (1977), “Breaking Free from Product Marketing,” Jour-nal of Marketing, 41 (April), 73-80.
Spence, H. E., J. F. Engel, and R. D. Blackwell (1970), “Perceived Risk inMail Order and Retail Store Buying,” Journal of Marketing Research,7 (August), 364-69.
Stafford, M. R. (1996), “Tangibility in Service Advertising: An Investiga-tion of Verbal versus Visual Cues,” Journal of Advertising, 25 (Fall),13-28.
Stem, D. E., Jr., C. W. Lamb, and D. L. MacLachlan (1977), “PerceivedRisk: A Synthesis,” European Journal of Marketing, 11 (4), 312-19.
Stone, R. N., and K. Gronhaug (1993), “Perceived Risk: Further Consid-erations for the Marketing Discipline,” European Journal of Market-ing, 27 (3), 39-50.
Taylor, S. and P. A. Todd (1995), “Understanding Information Technol-ogy Usage: A Test of Competing Models,” Information Systems Re-search, 6 (June), 144-76.
Thakor, M. V., W. Borsuk-Shtevi, and M. Kalamas (forthcoming),“Hotlists and Web Browsing Behavior—An Empirical Investiga-tion,” Journal of Business Research, 57.
Yoon, S. (2002), “The Antecedents and Consequences of Trust in OnlinePurchase Decisions,” Journal of Interactive Marketing, 16 (2), 47-63.
Zeithaml, V. A. (1981), “How Consumer Evaluation Processes Differ be-tween Goods and Services,” in The Marketing of Services, Pro-ceedings of the 1981 National Services Conference, J. H. Donnellyand W. R. George, eds. Chicago: American Marketing Association,186-90.
and M. J. Bitner (2000), Services Marketing: Integrating Cus-tomer Focus across the Firms, 2nd ed. New York: McGraw-Hill.
, A. Parasuraman, and A. Malhotra (2000), “A Conceptual Frame-work for Understanding e-Service Quality: Implications for FutureResearch and Managerial Practice,” Report No. 00-115, MarketingScience Institute, Cambridge, MA.
, , and (2002), “Service Quality Delivery throughWeb Sites: A Critical Review of Extant Knowledge,” Journal of theAcademy of Marketing Science, 30 (4), 362-75.
Michel Laroche is the Royal Bank Distinguished Professor ofMarketing in the John Molson School of Business at ConcordiaUniversity, Montreal, Canada. He holds a Diplôme d’ingénieur(École Centrale de Paris), an M.S.E. (Johns Hopkins), an M.Ph.and a Ph.D. (Columbia), and an D.S.H.C. from the University ofGuelph. He is a Fellow of the Royal Society of Canada, theAmerican Psychological Association, and Distinguished Societyfor Marketing Advances Fellow. He has published 27 books and
more that 80 journal articles. He has also participated in numer-ous conferences and published more than 80 papers in all majorconference proceedings. He has served the Administrative Sci-ences Association of Canada in many capacities and was the firstperson to be awarded the Canadian Journal of AdministrativeSciences Service Award in 1997. He served as associate editor inmarketing of the Journal of Business Research (JBR) (1993-1999) and was the first recipient of the JBR Outstanding Associ-ate Editor Award (1997), which now bears his name. Since 1999he is managing editor of the Journal of Business Research.
Gordon H. G. McDougall is a professor of marketing in theSchool of Business & Economics at Wilfrid Laurier University,Waterloo, Canada. He has coauthored 15 books and published ina wide range of journals including the Journal of Marketing, theJournal of Retailing, the Journal of Consumer Research, theJournal of Services Marketing, the International Journal of BankMarketing, the Journal of Hospitality and Leisure Marketing, theInternational Journal of Contemporary Hospitality Manage-ment, the Canadian Journal of Administrative Sciences, EnergyPolicy, and the Journal of Public Policy and Marketing. His cur-rent research interests include service marketing, customersatisfaction and retention, and marketing strategy.
Jasmin Bergeron is an assistant professor of marketing at theUniversity of Quebec in Montreal. He authored or coauthoredthree marketing books, 20 case studies, and more than 10 articlesin academic journals such as the Journal of Service Research, theJournal of Consumer Marketing, the Journal of Consumer Be-havior, and the Journal of Services Marketing. His research inter-ests are in the areas of services marketing, relationship banking,and research methodology. He also serves as a marketing consul-tant in professional selling, service quality, and bank marketing.He has participated in conferences and seminars in NorthAmerica, Europe, and Africa.
Zhiyong Yang is a Ph.D. candidate in the John Molson School ofBusiness at Concordia University, Montreal, Canada. His currentresearch interests are in services marketing, e-marketing, andcross-cultural studies, with several research papers in progress.
Laroche et al. / INTANGIBILITY 389