Exploring Early Education Programs in peri-urban …...Exploring Early Education Programs in...
19
Exploring Early Education Programs in peri-urban Settings in Africa - Final report Kelly Bidwell and Loïc Watine Innovations for Poverty Action Version: 30 th January, 2014
Transcript of Exploring Early Education Programs in peri-urban …...Exploring Early Education Programs in...

Exploring Early Education Programs in peri-urban Settings in Africa
- Final report
Kelly Bidwell and Loïc Watine
Innovations for Poverty Action
Version: 30th January, 2014
2
1
1 The authors are grateful to Katie Parry for her outstanding project coordination and research assistance, as well as the staff of Innovation for Poverty Action in Kenya and Ghana, the staff of J-PAL Africa in South Africa, Grant Bridgman, Atanus Mutisya, Segun Ade, and Grace Gletsu for their support in the implementation of this research. All views expressed in this document are the authors’ personal views and do not necessarily reflect the position of Innovations for Poverty Action. The authors gratefully acknowledge the UBS Optimus Foundation in launching and sponsoring this research.

3
Executive summary
In 2013, Innovations for Poverty Action (IPA) performed a formative study of the preprimary education sectors in one peri-urban area in each of four cities: Accra (Ghana), Johannesburg (South Africa), Lagos (Nigeria), and Nairobi (Kenya). This study, launched and sponsored by the UBS Optimus Foundation, aimed to present descriptive details on access to and the quality of preschools in these areas. The preprimary education sector in peri-urban areas was found to be largely dominated by the private sector. While preschool enrollment rates are quite encouraging, overall age-appropriateness and quality of instruction need to be addressed.
The four study sites - Ashaiman in Accra, Soweto in Johannesburg, Agege in Lagos, and Mukuru in Nairobi- were chosen for their large size and their relative diversity. In each, the data collected is representative of the specific study area. However, they can provide broad insights on what the situation may be across other poor peri-urban neighborhoods. Data was collected in each study site through three instruments: household surveys, preschool headmaster surveys and classroom observations. The same instruments were used across study sites, except for minor context-specific adaptations for each city. In total, between May and October 2013, 870 households were surveyed -totaling 645 children aged between 3 and 6 years old-, 107 preschool headmasters or owners were interviewed, and 97 preschool classroom observations were conducted.
High participation rates, large number of
preschools School participation rates for children aged 3-6 are surprisingly high – between 80-90% - in Ashaiman (Accra), Agege (Lagos), and Mukuru (Nairobi).The slightly lower rate in Soweto (71%) is mainly driven by relatively low participation rates for children aged 3 or 4 (just below 60%).
No significant gender gap on participation was found in any of the study sites. While participation rates were generally found to be positively correlated with income levels, participation rates remain fairly large even for the poorest quintile: 77% in Mukuru (Nairobi), 52% in Soweto (Johannesburg), 73% in Agege (Lagos), and 84% in Ashaiman (Accra).
Caregivers of preschool aged children have many options to choose from: they know on average around 3 preschools within walking distance (and almost 5 in Mukuru, Nairobi). In addition, very few headmasters state that their school is at full capacity. This suggests high levels of supply and competition among preprimary education providers.
A dominant private sector
The private sector is the main provider of preschool education in the four study sites: 94% of preschool children in Mukuru (Nairobi) are attending a private center, 91% in Ashaiman (Accra), 83% in Agege (Lagos), and 56% in the study areas of Soweto (Johannesburg). This further documents the explosion of low cost private schools in poor peri-urban areas of Sub-saharan Africa. In Agege, Ashaiman and Mukuru, the typical preschool is attached to a primary school. In these three study sites, among children going to private preschool, more than 95% are going to a preschool which is attached to a primary school.
Parents value preprimary education and are
devoting substantial resources to it
Across all study sites, educational benefits were the main reason mentioned by caregivers for sending their children to preschool (53% in the study areas of Soweto, and around 80% in other study sites). There is very little sign that parents see preschools as daycare centers; only small portions stated that children are being sent to preschool because parents or relatives are too busy to watch the child.

4
Preschool-related expenditures for the average child are particularly high everywhere (e.g. $32 PPP in Mukuru, $93 PPP in Soweto study areas). Nominal fees in preschool related expenses typically represent only around half of total preschool related expenses. Food and school feeding expenses also represent a substantial portion everywhere. School selection is driven by multiple factors
Caregiver priorities in terms of school choice vary by location and no uniform trend emerges. Proximity and convenience, fees, teacher qualifications and motivation, and quality of curriculum, are all mentioned as important criteria taken into account when choosing a specific preschool.
Infrastructures and health services
Basic infrastructures, such as latrines, playground, enclosure around the school, and electricity, are largely available. Teacher-student ratio and class size are generally acceptable (around 20 to 30). Preschool-based provision of health services is particularly rare in Mukuru and should be a source of concern. The situation is better in other study sites.
Teaching: strong academic focus in Mukuru and
Ashaiman, more diversity in Soweto
Classroom observations provide insights on the quality of instruction. While most preschools in all study sites had basic materials such as textbooks, materials allowing for more diverse and age-appropriate teaching methods, such as art materials or toys were a norm only in Soweto. This goes hand to hand with the findings from the classroom observations: they clearly indicate that the teaching approach and content in classrooms of Ashaiman (Accra) and Mukuru (Nairobi) are focused on literacy and numeracy and closely mimicked after traditional primary school settings. Most of classroom time in Ashaiman and Mukuru is spent
with desks and rows facing front, focusing on literacy and numeracy lessons. Children spend most of the time listening to the teacher, repeating or writing. In contrast, there is more variety in the activities observed in the classrooms of Soweto (Johannesburg), where students spend most of their time sitting in small groups, and literacy and numeracy only accounted for a quarter of classroom time.
In terms of languages, English is widely used in Mukuru (Nairobi) and in Ashaiman (Accra). In both places, beyond translations of words, local languages are used by only in a minority of classrooms as a medium of instruction, and almost never as a subject. Given that English is very rarely the mother tongue in these areas, this is certainly an important finding. In Soweto (Johannesburg), while English remains the main subject language, local language is used in a large proportion of classes, most often as the medium of instruction. The preprimary education sector is thriving in all peri-urban areas included in this study. The explosion of low-cost private schools in peri-urban areas is at least as strong at the pre-primary level as it is at the primary level. Very high proportion of children aged between 3 and 6 years old are being sent to preschools, most of which are private. Parents are putting real value to preprimary education and are ready to spend substantial proportion of their income to send their child to preschool. Quality of instruction, however, remains a concern. Age-appropriateness of content and pedagogical approach is often questionable. Interventions on the supply side (e.g. teacher trainings or coaching) as well as on the demand side (e.g. increasing parental awareness on internationally-recognized best practices in the sector) could be explored to ensure that all dimensions of child development are at the center of the preschool experience.

Contents Executive summary ....................................................................................................................................................... 3
1. Introduction: background and goals of the study ................................................................................................ 6
1.1. Background ................................................................................................................................................... 6
1.2. Goals of Study ............................................................................................................................................... 7
2. Design of the study ............................................................................................................................................... 8
2.1. Study sites ..................................................................................................................................................... 8
2.2. Sampling design ............................................................................................................................................ 8
2.3. Data collection instruments .......................................................................................................................... 9
3. Overview: a thriving private preprimary education sector ................................................................................ 10
3.1. Participation rates and number of preschools are surprisingly large ......................................................... 10
3.2. A dominant private sector .......................................................................................................................... 11
4. Quality aspects .................................................................................................................................................... 12
4.1. Infrastructure, materials and services ........................................................................................................ 12
4.2. Teachers ...................................................................................................................................................... 13
4.3. Nature of instruction within classrooms .................................................................................................... 14
5. Parental views on preprimary education ........................................................................................................... 17
5.1. Preschool is highly valued by parents ......................................................................................................... 17
5.2. School choice is driven by multiple factors ................................................................................................ 18
6. Conclusion ........................................................................................................................................................... 19
Terminology used in this report: Preschool/Pre-primary Classes aimed at 3-6 year olds ECD center Any center offering preprimary grades Grade R/Reception year In South Africa, the year preceding Primary 1 (for 5-6 year olds) Pre-grade R In South Africa, the two years preceding grade R

6
1. Introduction: background and goals of the study
1.1. Background
Investing in early childhood programming is now a
high level priority for many multilateral agencies and
large donors, researchers across disciplines, national
policy makers, practitioners in public health,
nutrition and education, and a growing number of
parents around the globe. This emerging interest
stems from a body of research which suggests early
childhood development (ECD) programs positively
influence lifelong development, growing
documentation of low student learning levels and
challenges facing international education systems,
and a more immediate interest to ensure academic
preparedness and success for the youngest learners.
A range of evaluations of early education programs
in the United Sates suggest that early exposure to
education, health and nutritional services improves
children’s readiness for school, and help reduce
developmental gaps between advantaged and
disadvantaged groups. Research has repeatedly
shown that many parts of human development,
including cognitive, social and self-regulatory
capacities, are shaped by the ”environment and
experiences that are encountered in a cumulative
fashion, beginning in the prenatal period and
extending throughout the early childhood years”.2
The frequently cited Perry Preschool Project reports
that the benefits gained from the program
significantly outweighed the total costs of the
program.3 Further evaluations of ECD programs
have found similar returns, concluding that “a single
year of pre-primary education can result in an
increase of 0.20-0.33 standard deviations on
2 Shonkoff, JP and Phillips, DA (eds), From Neurons to
Neighbourhoods: The science of early child development, National Academy Press. Washington, DC, 2000. 3 Barnett, W. S. (1995). Long-term effects of early childhood
programs on cognitive and school outcomes. The Future of Children.
cognitive development,”4 and other aspects of
learning such as attention span, self-discipline and
concentration are positively impacted by such
programs.5 Evidence from other disciplines confirms
that early childhood is a critical time for human
development and that the timing and quality of early
investments in education and development matter
greatly.
Cognitive and non-cognitive ability gaps develop
very early on. Poor and otherwise disadvantaged
children are less likely to enroll in primary school at
the right age, more likely to attain lower
achievement levels or grades for their age and more
likely to have less cognitive ability throughout their
lives.6 These children are often disproportionately
affected by serious deficits in health, nutrition and
cognitive and non-cognitive stimulation and grow up
in poor households with few books, toys, and
learning materials, causing delays in physical and
brain development. Early investment helps
disadvantaged groups catch up and reduce the gap
between socioeconomic groups.
As urban centers are growing, demand for and
supply of ECD services has increased at a very rapid
pace and new models to reach these children are
required. In response to this need public, NGO and
private sector ECD programs have expanded in the
past few years. While greater attention has been
paid to government programs and NGO models,
little data has been gathered on the private sector
growth and response. New models to reach these
4 Puma, M,. S. Bell, R. Cook, C. Heid & M. Lopez. Head Start
Impact Study: First Year Findings. Washington DC : US Department of Health and Human Services, Administration for Children and Families. 2005. 5 Berlinski, S., Galiani, S., Gertler, P., 2006. The Effect of Pre-
Primary Education on Primary School Performance. Institute for Fiscal Studies, England, WP06/04. 6 Vegas and Santibañez. The Promise of Early Childhood
Development in Latin America and the Caribbean. Washington, dc: World Bank. 2010.

7
children are rapidly expanding in the private sector
to supplement and support simultaneous efforts by
the public and NGO sector in many cities. Some
anecdotal reports have documented this
phenomenon but limited information exists on the
availability of and quality of early childhood
educational instruction provided by the private
sector.
Policy makers, entrepreneurs and donors are seeking
innovative ways to boost developmental outcomes
for young children in developing countries, and sub-
Saharan Africa specifically, using cost-effective
sustainable models. While evidence on the overall
impact of early childhood interventions exists, such
research has been largely conducted in the United
States and Latin America, with few robust
longitudinal studies and limited evidence on cost-
effective models or educational returns. The one
rigorous impact evaluation of an ECD program
conducted in Africa completed to date showed short
run positive gains due to a community based ECD
program in Mozambique but further evidence on a
range of models and longer term returns is needed.7
Even more basic documentation on the existing
provision and quality of early childhood
development services has been wholly lacking in
low-income contexts. To lay the ground work for
future rigorous evaluations and the identification of
cost-effective models, further data is needed to
inform future programs and evaluations.
1.2. Goals of Study
The study aims to help address this lack of
information by providing foundational data on the
ECD landscape in peri-urban settings in Africa. The
study focused on a range of areas in the ECD sector
including:
7 Martinez, Nadeau, Pereira, The Promise of Preschool in Africa a
randomized impact evaluation of early childhood development in rural Mozambique. World Bank Working Paper. (2012).
Access and availability of ECD Services
Participation levels
Parental demand for ECD services, beliefs,
and willingness to pay
Costs of ECD services
Educational models and quality of instruction
School infrastructure and teacher quality
Differences by economic status across these
indicators were explored as well. Representative
data from the four communities provides a brief
snapshot of current access to and the quality of ECD
services. These studies are not broadly
representative, but do intend to provide useful
information on the state of the ECD sector in these
large peri-urban settings. Recognizing the urgent
need for data on the ECD sector, this study aims to
significantly increase the available information on
current trends such that policy makers, donors,
researchers and the broader communities can make
better informed decisions on the right teaching,
learning and investment strategies, particularly
where resources are highly limited.
This report provides a summary of findings as well as
cross-sites comparisons. City-specific reports are
available for more in-depth analysis of findings from
each study site.8
8 Available at www.poverty-action.org
2. Design of the study
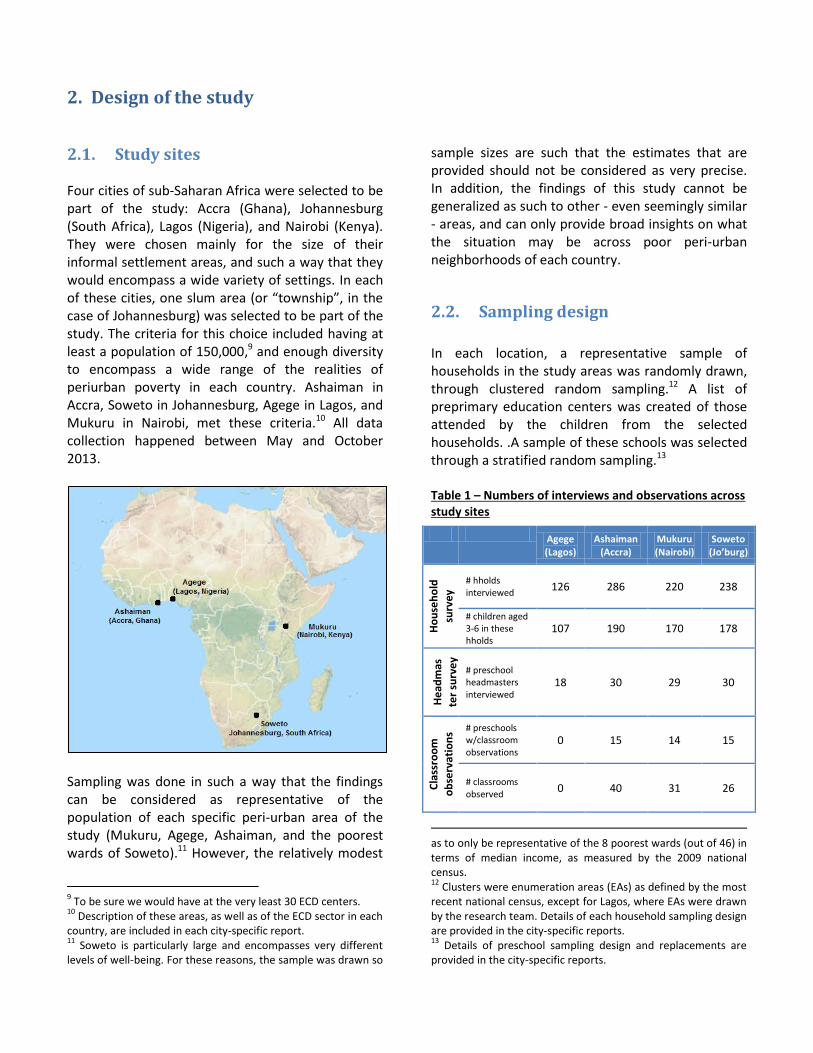
2.1. Study sites Four cities of sub-Saharan Africa were selected to be part of the study: Accra (Ghana), Johannesburg (South Africa), Lagos (Nigeria), and Nairobi (Kenya). They were chosen mainly for the size of their informal settlement areas, and such a way that they would encompass a wide variety of settings. In each of these cities, one slum area (or “township”, in the case of Johannesburg) was selected to be part of the study. The criteria for this choice included having at least a population of 150,000,9 and enough diversity to encompass a wide range of the realities of periurban poverty in each country. Ashaiman in Accra, Soweto in Johannesburg, Agege in Lagos, and Mukuru in Nairobi, met these criteria.10 All data collection happened between May and October 2013.
Sampling was done in such a way that the findings can be considered as representative of the population of each specific peri-urban area of the study (Mukuru, Agege, Ashaiman, and the poorest wards of Soweto).11 However, the relatively modest
9 To be sure we would have at the very least 30 ECD centers.
10 Description of these areas, as well as of the ECD sector in each
country, are included in each city-specific report. 11
Soweto is particularly large and encompasses very different levels of well-being. For these reasons, the sample was drawn so
sample sizes are such that the estimates that are provided should not be considered as very precise. In addition, the findings of this study cannot be generalized as such to other - even seemingly similar - areas, and can only provide broad insights on what the situation may be across poor peri-urban neighborhoods of each country.
2.2. Sampling design
In each location, a representative sample of households in the study areas was randomly drawn, through clustered random sampling.12 A list of preprimary education centers was created of those attended by the children from the selected households. .A sample of these schools was selected through a stratified random sampling.13 Table 1 – Numbers of interviews and observations across study sites
Agege (Lagos)
Ashaiman (Accra)
Mukuru (Nairobi)
Soweto (Jo’burg)
Ho
use
ho
ld
surv
ey
# hholds interviewed
126 286 220 238
# children aged 3-6 in these hholds
107 190 170 178
He
adm
as
ter
surv
ey
# preschool headmasters interviewed
18 30 29 30
Cla
ssro
om
ob
serv
atio
ns # preschools
w/classroom observations
0 15 14 15
# classrooms observed
0 40 31 26
as to only be representative of the 8 poorest wards (out of 46) in terms of median income, as measured by the 2009 national census. 12
Clusters were enumeration areas (EAs) as defined by the most recent national census, except for Lagos, where EAs were drawn by the research team. Details of each household sampling design are provided in the city-specific reports. 13
Details of preschool sampling design and replacements are provided in the city-specific reports.
9
2.3. Data collection instruments
Data was conducted in the four study sites between May and October 2013. Data was collected in each study site through three instruments: household surveys, preschool headmaster surveys and classroom observations.14 The same instruments were used across study sites, except for minor additions and context-specific adaptations in the successive cites. The Household Survey The household survey focuses on beliefs, priorities, and expenses around children’s preprimary education, as well as basic facts about the family, household finances and assets. The questions were largely close-ended with populated answer options pre-tested in each study site prior to the survey. This survey was between 10 and 40 minutes depending on the type of respondent. Specific questions were asked to caregivers for each child aged 3-12 per household, with more detailed questions regarding children aged 3-6 or attending a preprimary education center. The Headmaster (or “Principal”) Survey The headmaster survey contained detailed questions about schools finances, class size and school infrastructure, teacher qualifications, and curriculum and goals for students. It also sought to ascertain the challenges and characteristics distinctive to the school through open-ended questions. Some questions related to the whole school, but most were focused on the preschool classes. In all cases the respondent was the Headmaster or the Proprietor of the school, though they sometimes sought the assistance of senior preschool teachers where they did not know the answers to the preschool-specific questions.
14
Except for Lagos where timing did not allow for classroom observations to be conducted
The Classroom Observations In Accra, Nairobi, and Johannesburg, in addition to the headmaster survey, classroom observations were conducted for a subsample of preschools. A senior trained enumerator observed one classroom in each preschool grade for 60 continuous minutes. The data collection instrument included a number of general questions on observable details such as the number of children in the class, the proportion of girls, and the equipment in the classroom. The bulk of the 60 minutes, however, was spent answering questions relating to the substance of the lesson, and the activities of teachers and pupils. Every 3 minutes, the enumerator was instructed to record a ‘snap shot’ of the class activities by selecting from amongst an extensive pre-recorded list what the teacher was doing, what type of lesson was going on, and the exact activities of three specific children chosen at random at the start of the observation. The enumerator recorded the information silently, not disturbing the class. Observations were conducted only in the first half of the school day in an attempt to capture instructional lessons at similar times across schools, as children often slept or went home in the afternoon.

3. Overview: a thriving private preprimary education sector
Preschool participation rates were found to be particularly high, and the sector was found to be dominated by private schools.
3.1. Participation rates and number of preschools are surprisingly large
Participation rates are surprisingly high in Ashaiman (Accra), Agege (Lagos), and Mukuru (Nairobi), with lower but still striking rates in Soweto (Johannesburg). Lower rates in Soweto are mainly driven by relatively low participation rates for children aged 3 or 4 (just below 60%), showing that it is not atypical to enter preprimary school after the age of 4 in Johannesburg (whether pre-grade R or grade R). School participation means that the child “generally attends” preprimary or primary school. In Johannesburg, this includes pre-grade R, grade R, and primary school. In other sites, this includes preschool and primary school. Figure 1 provides a comparison of school participation rates for children aged 3-6 across study sites.
Figure 1 - School participation rate of children aged 3-6*
*Brackets showing 95% confidence intervals
No statistically significant gender gap was found in any study site.
While the participation rates were found to be positively correlated with income levels15, participation rates remain fairly large even for the poorest quintile: 77% in Mukuru (Nairobi), 52% in Soweto (Johannesburg), 73% in Agege (Lagos), and 84% in Ashaiman (Accra).16
This high participation rate is scattered across large numbers of different education centers. As demonstrated by Table 2, parents have a large number of preschool options to choose from. To put into perspective the numbers presented in this table, the average number of health centers known by respondents within walking distance is lower at only 2.7 in Agege (Lagos) and 1.7 in Ashaiman (Accra).17
Table 2 - Number of preprimary centers within walking Distance known by caregivers of children aged 3 to 6
Agege (Lagos)
Ashaiman (Accra)
Mukuru (Nairobi)
Soweto (Jo’burg)
Average number of preschool known within walking distance
3.4 3.6 4.9 2.7
These numbers suggest that many options are available to caregivers, particularly in Mukuru (Nairobi), where caregivers of children aged 3-6 know on average almost 5 preschools within walking distance. Combined with the fact that very few headmasters state that their school is at full capacity, these numbers suggest high levels of supply and competition among preprimary education providers in peri-urban areas of Sub-Saharan Africa.18
15
This association is statistically significant in most study sites (all except in Ashaiman. 16
Poverty status was estimated based on the Progress Out of Poverty Index® (PPI) relevant to each country. 17
This data is not available for Mukuru and Soweto. 18
Differences between survey sites on this number should be interpreted with caution. First, they might be related to actual
87% 93% 84%
71%
0%
10%
20%
30%
40%
50%
60%
70%
80%
90%
100%
Agege(Lagos)
Ashaiman(Accra)
Mukuru(Nairobi)
Soweto(Johannesb.)
11
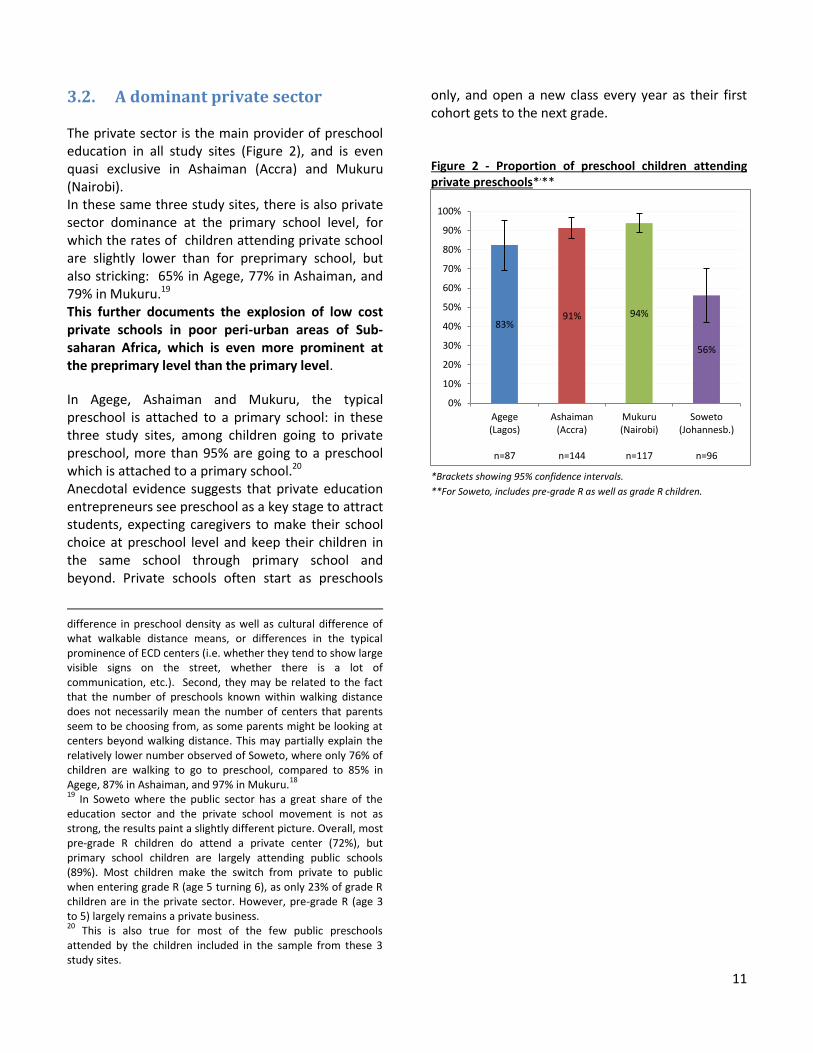
3.2. A dominant private sector The private sector is the main provider of preschool education in all study sites (Figure 2), and is even quasi exclusive in Ashaiman (Accra) and Mukuru (Nairobi). In these same three study sites, there is also private sector dominance at the primary school level, for which the rates of children attending private school are slightly lower than for preprimary school, but also stricking: 65% in Agege, 77% in Ashaiman, and 79% in Mukuru.19 This further documents the explosion of low cost private schools in poor peri-urban areas of Sub-saharan Africa, which is even more prominent at the preprimary level than the primary level.
In Agege, Ashaiman and Mukuru, the typical preschool is attached to a primary school: in these three study sites, among children going to private preschool, more than 95% are going to a preschool which is attached to a primary school.20 Anecdotal evidence suggests that private education entrepreneurs see preschool as a key stage to attract students, expecting caregivers to make their school choice at preschool level and keep their children in the same school through primary school and beyond. Private schools often start as preschools
difference in preschool density as well as cultural difference of what walkable distance means, or differences in the typical prominence of ECD centers (i.e. whether they tend to show large visible signs on the street, whether there is a lot of communication, etc.). Second, they may be related to the fact that the number of preschools known within walking distance does not necessarily mean the number of centers that parents seem to be choosing from, as some parents might be looking at centers beyond walking distance. This may partially explain the relatively lower number observed of Soweto, where only 76% of children are walking to go to preschool, compared to 85% in Agege, 87% in Ashaiman, and 97% in Mukuru.
18
19 In Soweto where the public sector has a great share of the
education sector and the private school movement is not as strong, the results paint a slightly different picture. Overall, most pre-grade R children do attend a private center (72%), but primary school children are largely attending public schools (89%). Most children make the switch from private to public when entering grade R (age 5 turning 6), as only 23% of grade R children are in the private sector. However, pre-grade R (age 3 to 5) largely remains a private business. 20
This is also true for most of the few public preschools attended by the children included in the sample from these 3 study sites.
only, and open a new class every year as their first cohort gets to the next grade. Figure 2 - Proportion of preschool children attending private preschools*
,**
*Brackets showing 95% confidence intervals.
**For Soweto, includes pre-grade R as well as grade R children.
83% 91% 94%
56%
0%
10%
20%
30%
40%
50%
60%
70%
80%
90%
100%
Agege(Lagos)
n=87
Ashaiman(Accra)
n=144
Mukuru(Nairobi)
n=117
Soweto(Johannesb.)
n=96

4. Quality aspects Supply side data was collected through headmaster
interviews in all four study sites, and classroom
observations in three of them: Ashaiman (Accra),
Mukuru (Nairobi), and Soweto (Johannesburg).
If preschool enrollment rates across the different
study sites are quite encouraging, concerns remain
when looking at various quality indicators.
4.1. Infrastructure, materials and services
Data on infrastructure, equipment, and health services show that preschools of Soweto are well equipped, while most Mukuru preschools are particularly deprived.
Basic equipment is widely available
The few infrastructure-related indicators available across multiple study sites indicate that basic infrastructures, such as latrines and playground, enclosure around the school, and electricity, are largely available in preschools in Soweto and Ashaiman (Figure 3). However, they are lacking in a substantial proportion of preschools in Mukuru, where they tend to be built of non-permanent materials and have limited access to public infrastructure, just like houses around them. In Agege, most are available except for playgrounds.
Figure 3 – Percentage of preschools where selected infrastructure is available*
*Brackets showing 95% confidence intervals.
Only Soweto preschool classrooms are
equipped with diverse materials
While most preschools in all study sites had basic materials such as textbooks (despite large discrepancies on quantities), materials allowing for more diverse and age-appropriate teaching methods, such as art materials or toys are particularly scarce in both Ashaiman and Mukuru (Figure 4). For instance, in both study sites, more than three quarters of preschool classrooms had no art materials of any kind. And as expected, results from classroom observations in the same two study sites show a strong academic focus and a low level of diversity in classroom activities, as described in section 0 below.
0% 20% 40% 60% 80% 100%
Equippedwith
electricity
Latrineson premises
Existenceof a
playground
The schoolis enclosed
Agege(lagos)n=16
Ashaiman(Accra)n=30
Mukuru(Nairobi)n=29
Soweto(Johannesb.)n=30

13
Figure 4 – Availability of selected materials*
*Data not available for Agege, Lagos. Percentage of classrooms where the material is available, as recorded by classroom observer. Brackets showing 95% confidence intervals. **E.g. reading corner, dramatic play space, block play space, etc.
Provision of health services is low in Mukuru
Preschool-based provision of health services is also
particularly rare in Mukuru and should be a source
of concern. The situation is more encouraging in the
two other study sites (Figure 5).21
Figure 5 – Percentage of preschool children attending a school providing certain health services*
*Reported by headmasters. Brackets showing 95% confidence intervals.
21
Preschool-based deworming is very rare in Soweto, but is less relevant given low wormloads.
4.2. Teachers
Quantity of teachers is not a priority concern
Student/teacher ratio varied considerably between
schools in each study site. However, averages across
schools are not as high as one could expect (Figure
6) and even quite low in Agege. One can also notice
that there are often multiple teachers or caregivers
per classroom, as shown by the larger class size than
student-teacher ratio, in particular in Ashaiman.
Figure 6 – Average class size and student-teacher ratio*
*Calculations performed with children-based weights, i.e. providing class
size and student-teacher ratio faced by the average preschool child.
Brackets showing 95% confidence intervals.
**Number of teachers includes staff described as ‘caregivers’ or
‘assistant teachers’ by headmasters
Teacher qualifications are unequal
Preschool teachers tend to be more educated in
Mukuru and Agege, where most teachers hold some
university or college degree, than in Ashaiman or
Soweto (Figure 7).
One should be cautious when comparing the
proportion of preschool teachers that have an ECD
specific training, given how different these trainings
are in the different countries. For example, the ECD
training system in South Africa is fairly sophisticated,
with multiple levels, typically associated with at least
0% 20% 40% 60% 80% 100%
Playmaterials
Artmaterials
Differentthematic
or interestspaces**
Ashaiman, Accra n=40Mukuru, Nairobi n=32Soweto, Johannesburg n=25
0% 20% 40% 60% 80% 100%
Generalhealth services
(first aid)
Immuni-zations
Deworming
Agege(Lagos)n=16
Ashaiman(Accra)n=30
Mukuru(Nairobi)n=29
Soweto(Johannesb.)n=30
21
25
27
32
23
34
11
14
0 5 10 15 20 25 30 35 40
Student-
teacherratio**
Classsize
Agege(Lagos)n=15
Ashaiman(Accra)n=29
Mukuru(Nairobi)n=29
Soweto(Johannesb.)n=30

14
one year of ECD-specific training, while ECD-specific
trainings are generally less structured in other study
sites and can encompass a wide range of training
durations and intensities. That being said, the fact
that only 40% of preschool teachers in Ashaiman,
have some sort of ECD-specific training, is certainly a
concern. Across the 18 preschools of the sample in
Agege, no teacher had completed any ECD specific
training. However, 61% had an education-specific
degree.
Figure 7 – Teacher qualifications
4.3. Nature of instruction within classrooms
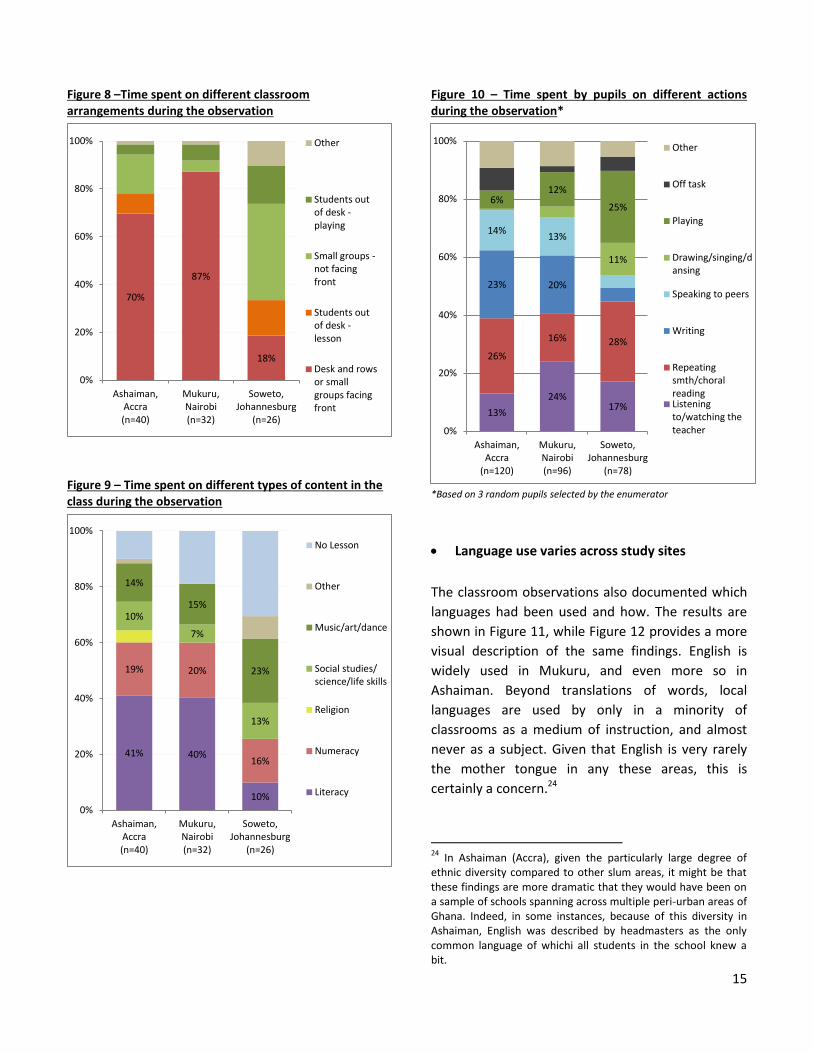
The majority of the classroom observations consisted of gathering snapshots of what was happening in the classroom, including what the classroom arrangement was, what the content of the lesson or the class was, and what randomly picked students were doing at that instant. The snapshots were gathered every 3 minutes, and allow to estimate the proportion of time spent on the different activities, classroom layouts, etc.
The graphs below present how time was spent across the different classroom observations for each study site.22 Break time is not taken into account in this analysis.23 These observations clearly indicate that the teaching approach and content in classrooms of Ashaiman and Mukuru are focused on literacy and numeracy and closely mimicked after primary school. Most of classroom time in Ashaiman and Mukuru is spent in the classical classroom settings with desks and rows facing front (Figure 8), focusing on literacy and numeracy (Figure 9), where children spend most of their time listening to the teacher, repeating something, or writing (Figure 10). In contrast, there is more variety in the activities observed in the classrooms of Soweto, where students were spending most of their time sitting in small groups, and literacy and numeracy only accounted for a quarter of classroom time. However, this data does not allow for a strong conclusion on whether teaching approaches and content would be preferable and more age-appropriate in Soweto, as similar findings would have been possible simply with a lower level of teacher involvement and therefore less structured classrooms where children are left by themselves. In fact, both highly disorganized and well-structured classes were observed in Soweto.
22
In each preschool assigned to the classroom observations, one class per level was observed. Sampling weights are used in the analysis to give more weight to the classrooms observed in larger schools, so that the results are giving an estimate of what is happening in the average classroom in the preschools attended by children from the household survey. 23
For instance, if a classroom happened to have a 20 minute break in the middle of the 60 minute observation, the analysis uses the 40 minutes of non-break time as the basis for the proportion assigned to that particular classroom observation. One reason for doing the analysis in this way is that the starting time of each classroom observation was not completely random, in that it had to be at a time where the classroom was not on a break. We therefore don’t have a representative proportion of time spent on break during the school day. One related caveat to the findings is that there might be a slight over-representation of what is happening in the hour following a break than what is happening later.
85%
9%
70%
76%
77%
100%
40%
7%
99%
0%
74%
92%
0% 50% 100%
Completedsome ECD-
specifictraining
Completedsome
university/collegedegree
Completedsecondary
school
Agege(Lagos)n=59
Ashaiman(Accra)n=119
Mukuru(Nairobi)n=107
Soweto(Johannesb.)n=75
15
Figure 8 –Time spent on different classroom arrangements during the observation
Figure 9 – Time spent on different types of content in the class during the observation
Figure 10 – Time spent by pupils on different actions during the observation*
*Based on 3 random pupils selected by the enumerator
Language use varies across study sites
The classroom observations also documented which
languages had been used and how. The results are
shown in Figure 11, while Figure 12 provides a more
visual description of the same findings. English is
widely used in Mukuru, and even more so in
Ashaiman. Beyond translations of words, local
languages are used by only in a minority of
classrooms as a medium of instruction, and almost
never as a subject. Given that English is very rarely
the mother tongue in any these areas, this is
certainly a concern.24
24
In Ashaiman (Accra), given the particularly large degree of ethnic diversity compared to other slum areas, it might be that these findings are more dramatic that they would have been on a sample of schools spanning across multiple peri-urban areas of Ghana. Indeed, in some instances, because of this diversity in Ashaiman, English was described by headmasters as the only common language of whichi all students in the school knew a bit.
70%
87%
18%
0%
20%
40%
60%
80%
100%
Ashaiman,Accra(n=40)
Mukuru,Nairobi(n=32)
Soweto,Johannesburg
(n=26)
Other
Students outof desk -playing
Small groups -not facingfront
Students outof desk -lesson
Desk and rowsor smallgroups facingfront
41% 40%
10%
19% 20%
16%
10%
7%
13%
14%
15%
23%
0%
20%
40%
60%
80%
100%
Ashaiman,Accra(n=40)
Mukuru,Nairobi(n=32)
Soweto,Johannesburg
(n=26)
No Lesson
Other
Music/art/dance
Social studies/science/life skills
Religion
Numeracy
Literacy
13%
24% 17%
26%
16% 28%
23% 20%
14% 13%
11%
6% 12%
25%
0%
20%
40%
60%
80%
100%
Ashaiman,Accra
(n=120)
Mukuru,Nairobi(n=96)
Soweto,Johannesburg
(n=78)
Other
Off task
Playing
Drawing/singing/dansing
Speaking to peers
Writing
Repeatingsmth/choralreadingListeningto/watching theteacher
16
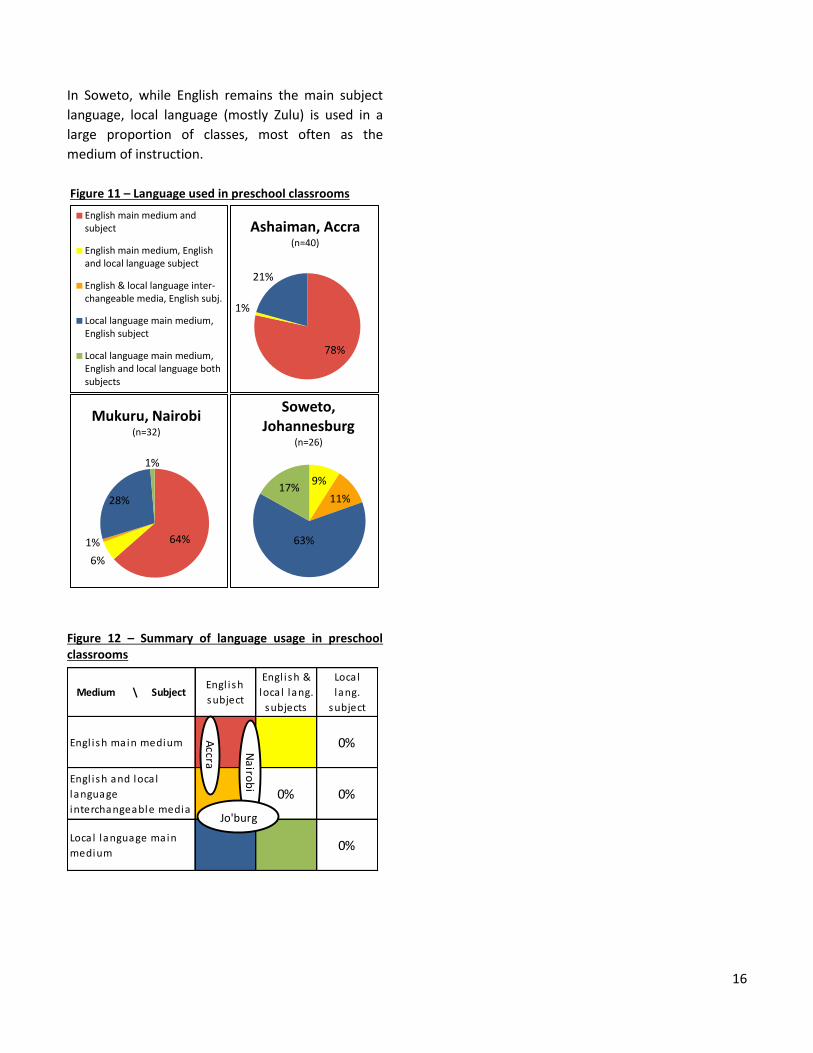
In Soweto, while English remains the main subject
language, local language (mostly Zulu) is used in a
large proportion of classes, most often as the
medium of instruction.
Figure 11 – Language used in preschool classrooms
Figure 12 – Summary of language usage in preschool classrooms
English main medium andsubject
English main medium, Englishand local language subject
English & local language inter-changeable media, English subj.
Local language main medium,English subject
Local language main medium,English and local language bothsubjects
78%
1%
21%
Ashaiman, Accra (n=40)
64%
6%
1%
28%
1%
Mukuru, Nairobi (n=32)
9%
11%
63%
17%
Soweto, Johannesburg
(n=26)
Medium \ SubjectEngl ish
subject
Engl ish &
local lang.
subjects
Local
lang.
subject
Engl ish main medium 0%
Engl ish and loca l
language
interchangeable media0% 0%
Local language main
medium0%
Accra
Na
irob
i
Jo'burg

17
5. Parental views on preprimary education
5.1. Preschool is highly valued by parents
Parents see preschools as education centers
primarily
Across all study sites, caregivers of preschool
children were asked the main reason why they were
sending their kid to preschool. The summary results
are presented in Figure 13.
Figure 13 – Main reason for sending children to preschool, as stated by caregivers
Parents prioritize educational benefits of preschool.
The data doesn’t allow disentangling between the
types of skills that they want their children to
acquire, though anecdotal evidence suggests that
they are primarily interested in having their children
acquire skills directly related to literacy and math.
Interestingly however, in Soweto, a substantial
portion of caregivers (13%) mention socialization
with other children as the main motivation for
sending the child to preschool.
There is very little sign that parents see preschools
as daycare centers primarily, since only small
portions state that children are sent to preschool
because parents or relatives are too busy to provide
care during the day.
Caregivers devote substantial resources to
preschool-related expenses
Figure 14 presents the total preprimary related
expenditures for the average child in each study site.
This includes all related expenses that are incurred
because a child is going preprimary education
center. Some are fees charged directly by the school
(such as nominal fees or school feeding fees), others
are expenses that are not paid to the school but
would not have been incurred if the child was not
going to preprimary (such as uniform and books).
The average total expenditure has been converted
into USD at purchasing power parity to allow for
more meaningful cross-country comparisons of what
preprimary education costs to parents in the
different study sites.
Figure 14 – Monthly preschool-related expenditures per child going to preschool
*PPP conversation rates used are for 2012. Source: http://data.worldbank.org/indicator/PA.NUS.PPP **Source: http://data.worldbank.org/indicator/NY.GDP.PCAP.CD
86% 80% 79%
53%
13%
2% 12% 8%
20%
0%
10%
20%
30%
40%
50%
60%
70%
80%
90%
100%
Agege(Lagos)n=65
Ashaiman(Accra)n=144
Mukuru(Nairobi)
n=119
Soweto(Jo'burg)
n=94
Other
Parents/relati-ves too busy
Socialize withother children
Learndiscipline
Learn skills /be preparedfor primaryschool
$49
$57
$32
$93 21%
28%
23%
8%
0%
5%
10%
15%
20%
25%
30%
$0
$20
$40
$60
$80
$100
$120
Agege(Lagos)n=70
Ashaiman(Accra)n=141
Mukuru(Nairobi)
n=119
Soweto(Jo'burg)
n=99
As a % of country
GDP/capita per month in 2012**
in USD at Purchasing
Power Parity*

18
In the absence of satisfactory survey income data across all 4 study sites, the red points in Figure 14 show total preschool expenses in each study site as a percentage of the GDP per capita for the whole country. With the strong caveat that peri-urban areas are typically quite different from the rest of a country, this is intended to only give a rough indication of the substantial expenses in each of the four contexts. It is clear that parents spend surprisingly large amounts of their income to send
their child to preschool.25
Interestingly, nominal fees in preschool related
expenses typically represent only around half of
total preschool related expenses. Food and school
feeding expenses also represent a substantial
portion everywhere –and especially in Ashaiman and
Soweto. Other expenses categories tend to differ
across cities: uniforms and sports clothes represent a
substantial portion only in Mukuru (14%), transport
is only particularly relevant in Soweto (8%), where
more children use a vehicle to go to preschool, as
well as school trips (9%). Parents spend sizeable
amounts on books and supplies in Agege, Ashaiman
and Mukuru, with 11%, 7%, and 6% of preschool
related expenses respectively, but not in Soweto,
where it represents less than 2%.
5.2. School choice is driven by multiple factors
Caregiver priorities vary by location and no uniform trend emerges (Figure 15).
25
Based on income data available from Mukuru (Nairobi) and Soweto (Johannesburg), the multiple school-related costs totaled on average about 12% and 11% of self-reported household income respectively. However, these figures should be treated with caution given the typically low level of reliability (and usually underestimation) inherent to self reported income data collected through short one-off surveys.
Figure 15 – Main reason for choosing a specific preschool
Caregivers in Agege choose their preschool primarily
based on teaching quality (ie curriculum or related,
or teacher qualifications, motivation,attendance) -
48% in total-, while only 8% mention cost as the
main factor in their decision. Ashaiman has the
highest share of parents looking primarily at
proximity or convenience (38%) as well as of parents
looking primarily at financial consideration (24%). In
Soweto, the statistics are relatively balanced
between convenience, financial considerations,
teaching quality and the quality of facilities is also an
important consideration (11%). In Mukuru,
caregivers are looking primarily at convenience
(35%) and teacher quality (23%).26
26
It should be noted that those are only stated preference, so thatthese differences might also reflect what in culturally acceptable to say. Beyond that, it is also important to emphasize that those are the aspects that the caregivers say they did consider in making their choices, not necessarily the aspects they wished they had been able to consider if they had full information. Different answers might be due to differences of information available, and not necessarily to different preferences. We are hoping to be able to approach this question -among others- in an upcoming research project.
19%
38% 35% 27%
8%
24%
13% 23%
28%
18%
23% 16%
20%
8%
9% 9%
11%
0%
10%
20%
30%
40%
50%
60%
70%
80%
90%
100%
Agege(Lagos)n=91
Ashaiman(Accra)n=138
Mukuru(Nairobi)
n=119
Soweto(Jo'burg)
n=89
Other
Facilities
Curriculum &related
Teachers qualif./motivation/attendance
Low fees or costs/ flexibility withpayment
proximity /convenience

6. Conclusion The preprimary education sector is thriving in all peri-urban areas included in this study. Preschools have mushroomed in all four study sites, and the dominance of the private sector is even stronger for preprimary education than it is for primary education. Very high proportion of children aged between 3 and 6 years old are being sent preschool. Parents are putting real value to preprimary education and are ready to spend substantial proportion of their income to send their child to preschool. Quality of instruction, however, is a source of concern. Except in Soweto, pedagogical practices are closely mimicked after those of primary school classrooms, there is an overwhelming focus on literacy and numeracy, the use of English instead of mother tongues is the norm, and the age-appropriateness of instruction is generally questionable. Interventions on the supply side (e.g. teacher trainings or coaching) as well as on the demand side (e.g. increasing parental awareness on internationally-recognized best practices in the sector, so as to spur demand for quality) could be explored to ensure that all dimensions of child development are at the center of the preschool experience.