Exploratory Spatial Analytics (ESA)
26
Understanding the fundamentals in ESA is Important as the data is to be used in a critical decision-making framework Many names have been used to cover this topic, such as GIS Analytics, Multi Criteria Decision Support Systems and so on. This presentation only covers the preparation phase for the GIS Analytics; a) Strategy to implement GIS Analytics into Exploration workflow b) what type of data will be required to create grids of c) deciding whether to make deterministic grids or geostatistical grids d) What other type of data can be made available apart from Raster data? Stig-Arne Kristoffersen, July 2011 (Based on a presentation made in February 2010) ESA assisting Exploration Performance Analysis EXPLORATION SPATIAL ANALYSES (ESA) WITHIN THE EXPLORER ENVIRONMENT
-
Upload
stig-arne-kristoffersen -
Category
Documents
-
view
49 -
download
3
Transcript of Exploratory Spatial Analytics (ESA)

Understanding the fundamentals in ESA is Important as the data is to be used in a critical decision-making
framework
Many names have been used to cover this topic, such as GIS Analytics, Multi Criteria Decision Support Systems and so on.
This presentation only covers the preparation phase for the GIS Analytics; a) Strategy to implement GIS Analytics into Exploration workflow
b) what type of data will be required to create grids of c) deciding whether to make deterministic grids or geostatistical grids
d) What other type of data can be made available apart from Raster data?
Stig-Arne Kristoffersen, July 2011 (Based on a presentation made in February 2010)
ESA assisting Exploration Performance Analysis
EXPLORATION SPATIAL ANALYSES (ESA) WITHIN THE EXPLORER ENVIRONMENT
GIS Strategy within Exploration
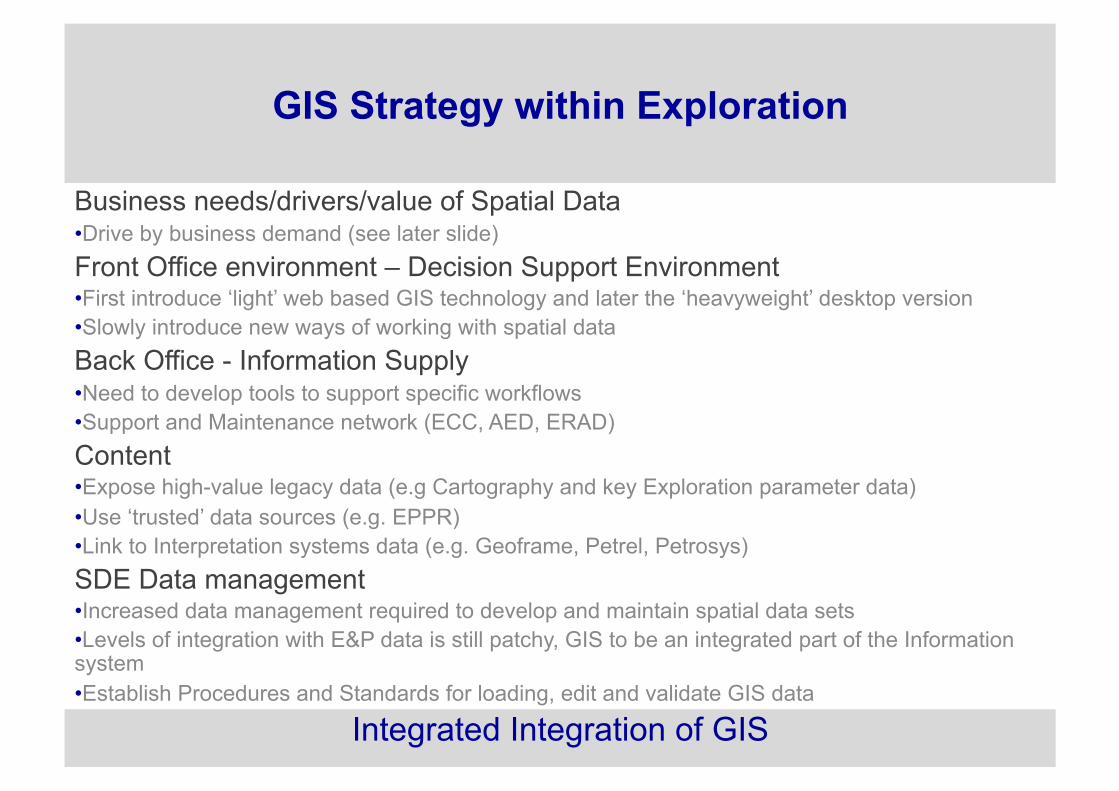
Business needs/drivers/value of Spatial Data • Drive by business demand (see later slide) Front Office environment – Decision Support Environment • First introduce ‘light’ web based GIS technology and later the ‘heavyweight’ desktop version • Slowly introduce new ways of working with spatial data Back Office - Information Supply • Need to develop tools to support specific workflows • Support and Maintenance network (ECC, AED, ERAD) Content • Expose high-value legacy data (e.g Cartography and key Exploration parameter data) • Use ‘trusted’ data sources (e.g. EPPR) • Link to Interpretation systems data (e.g. Geoframe, Petrel, Petrosys) SDE Data management • Increased data management required to develop and maintain spatial data sets • Levels of integration with E&P data is still patchy, GIS to be an integrated part of the Information system • Establish Procedures and Standards for loading, edit and validate GIS data
Integrated Integration of GIS
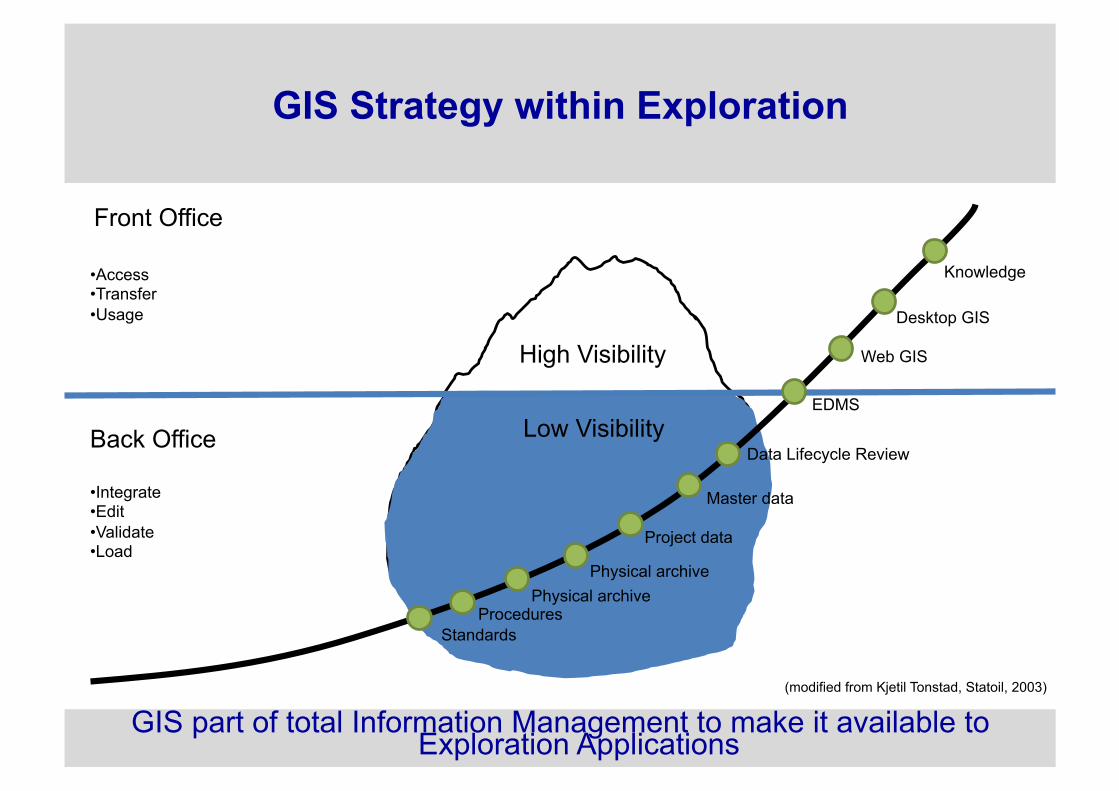
GIS Strategy within Exploration
GIS part of total Information Management to make it available to Exploration Applications
High Visibility
Low Visibility
Front Office
Back Office
Standards Procedures
Physical archive Physical archive
Project data
Master data
Data Lifecycle Review
EDMS
Web GIS
Desktop GIS
Knowledge
• Integrate • Edit • Validate • Load
• Access • Transfer • Usage
(modified from Kjetil Tonstad, Statoil, 2003)
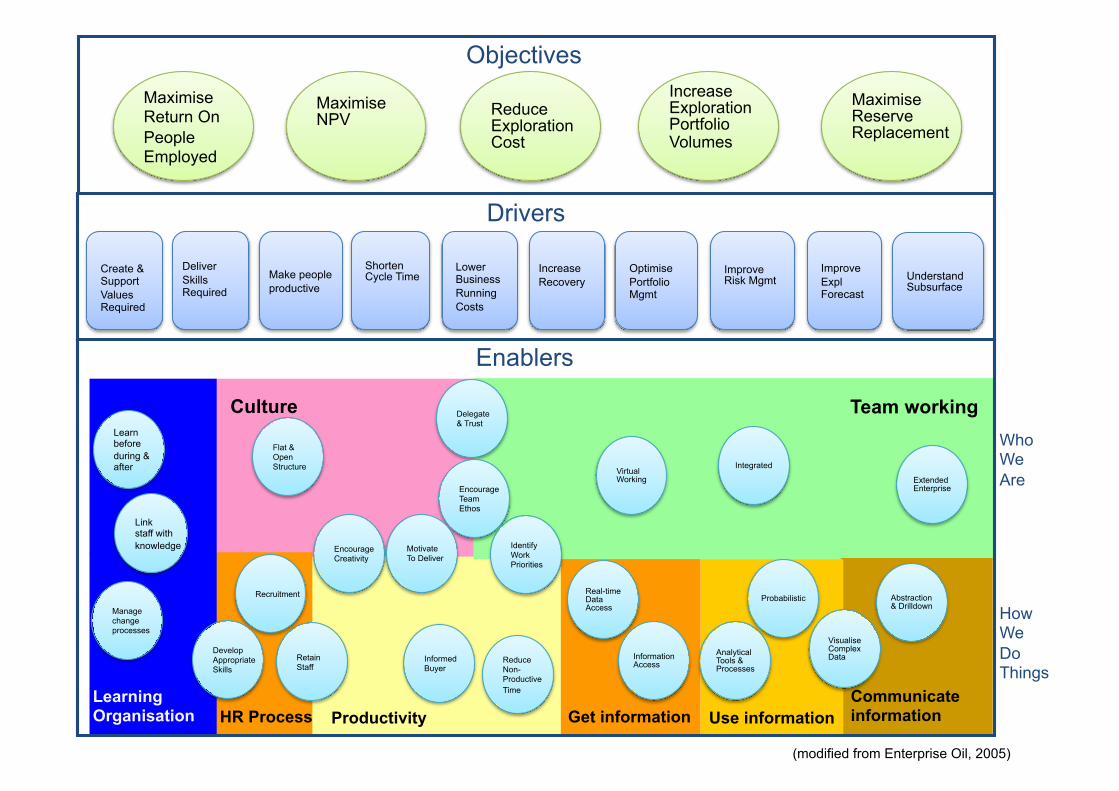
Who We Are
How We Do Things
Increase Recovery
Lower Business Running Costs
Improve Risk Mgmt
Improve Expl Forecast
Understand Subsurface
Shorten Cycle Time
Get information
Make people productive
Create & Support Values Required
Maximise Return On People Employed
Deliver Skills Required
Productivity
Maximise NPV
Increase Exploration Portfolio Volumes
Reduce Exploration Cost
Maximise Reserve Replacement
Optimise Portfolio Mgmt
Team working
Extended Enterprise
Integrated
Real-time Data Access
Information Access
Analytical Tools & Processes
Probabilistic
Visualise Complex Data
Abstraction & Drilldown
Use information Communicate information
Flat & Open Structure
Delegate & Trust
Encourage Team Ethos
Encourage Creativity
Motivate To Deliver
Identify Work Priorities
Retain Staff
Recruitment
Reduce Non- Productive Time
Informed Buyer
Culture
HR Process
Virtual Working
Learn before during & after
Link staff with knowledge
Manage change processes
Objectives
Drivers
Enablers
Learning Organisation
Develop Appropriate Skills
(modified from Enterprise Oil, 2005)

GIS Functionalities
We want to achieve Spatial Analysis
Spatial Analysis is lies at the core of GIS
All Exploration data has a spatial element to it, so GIS is required in our Analysis
A large range of Geospatial analysis capabilities
GIS Data model
Network Analyst
Cartographic Unit
Modeling interfaces Visualisation
Raster Analysis (Grid)
Geometric Analysis
(modified from Enterprise Oil, 2005)

GIS Refinement process
First step for us is to ensure all key data is represented in the GIS database (SDE) in the proper format, verified and maintained according to changes and available in database.
From collection of spatial data to Analytics and Reporting
ESRI Grid
Esri grid is a raster GIS file format developed by Esri, which has two formats: • A proprietary binary format, also known as an ARC/INFO GRID, ARC GRID and many other variations • A non-proprietary ASCII format, also known as an ARC/INFO ASCII GRID
Perform analysis and managing geographic data. Modeling and analysis capabilities. Simple buffers and polygon overlays, complex regression analysis and image classification. Automate GIS tasks and develop custom workflows that can be shared
• Mapping • Charting • Reporting • Visualization
Spotfire DecisionSite MapConnect
Point data
• Isolated plots • Integration of the ESRI map into a report. • Tightly integrate the rich spatial analytic capabilities with reporting function • Online GIS reports • GIS report portal
Collect all types of spatial data that can be used in GIS analysis • Points (parameters, wells, etc) • Cultural (open/restricted regions etc) • Infrastructure (pipelines, cities etc) • Geo referenced graphics (paleo geographic maps, surface maps) • Ascii Grids (surfaces, topography etc)
GIS report portal/dashboard
Cognos
• ArcMap built-in reporting tool • GIS and SAP Crystal Report
(modified from ExxonMobil, 2006)
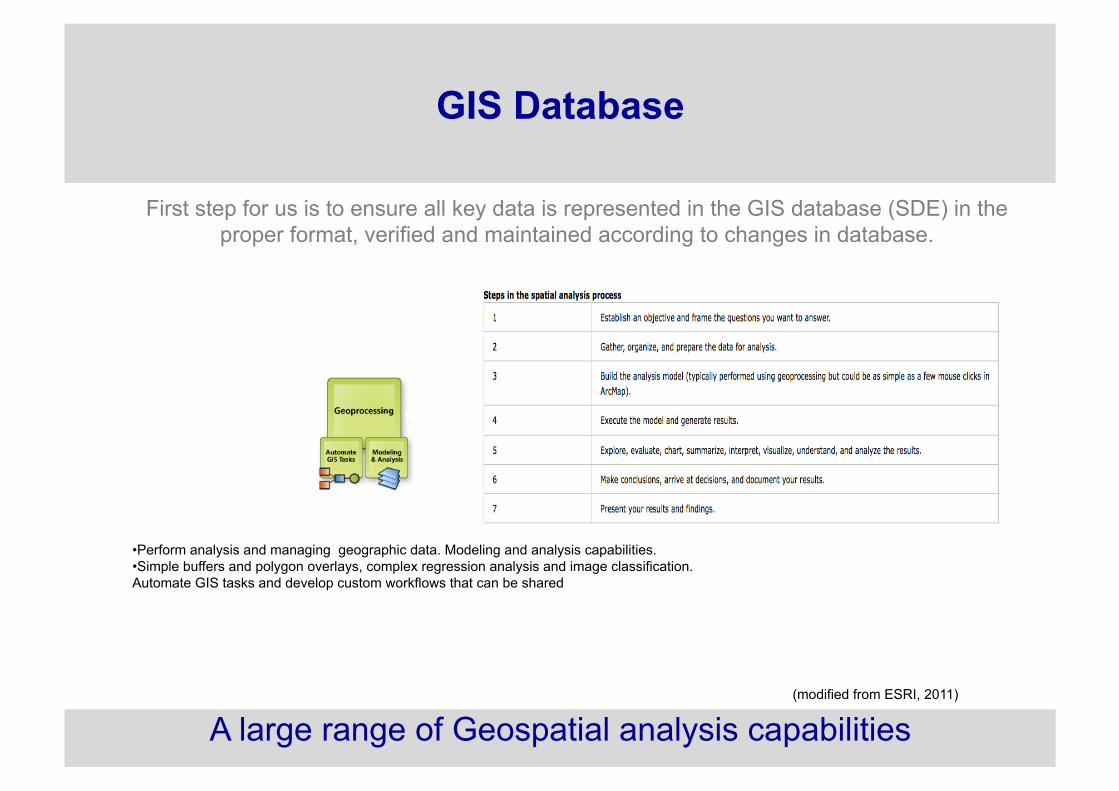
GIS Database
First step for us is to ensure all key data is represented in the GIS database (SDE) in the proper format, verified and maintained according to changes in database.
A large range of Geospatial analysis capabilities
• Perform analysis and managing geographic data. Modeling and analysis capabilities. • Simple buffers and polygon overlays, complex regression analysis and image classification. Automate GIS tasks and develop custom workflows that can be shared
(modified from ESRI, 2011)

WHAT IS EXPLORATION SPATIAL ANALYSES (ESA)?
“Exploration Spatial Analysis” (ESA) refers to a group of techniques whose aim is to:
• Analyze the data and to describe the spatial distribution of values, • Detect forms of spatial instability (non-stationary), • Identify anomalous locations (spatial outliers), • Discover unexpected directional components (trends) and spatial dependency among values.
ArcGIS offer tools to perform ESA: • Histogram and Normal QQ plot to check the distribution of the data and determine how far from a Gaussian (normal) distribution the input dataset is (spatial instability or non-stationary) • Trend Analysis for detecting and mapping unexpected long-range variations in the data • Voronoi map to identify local outliers • Semivariogram/ covariogram cloud for examining the degree of spatial auto-correlation among the variable’s values and to identify global outliers.
Combined Geo Statistics with Risk evaluation tools like: • Tornado diagrams • Spider diagrams
And it offers a solid decision support in the exploration process ESA assisted Exploration Performance Analysis
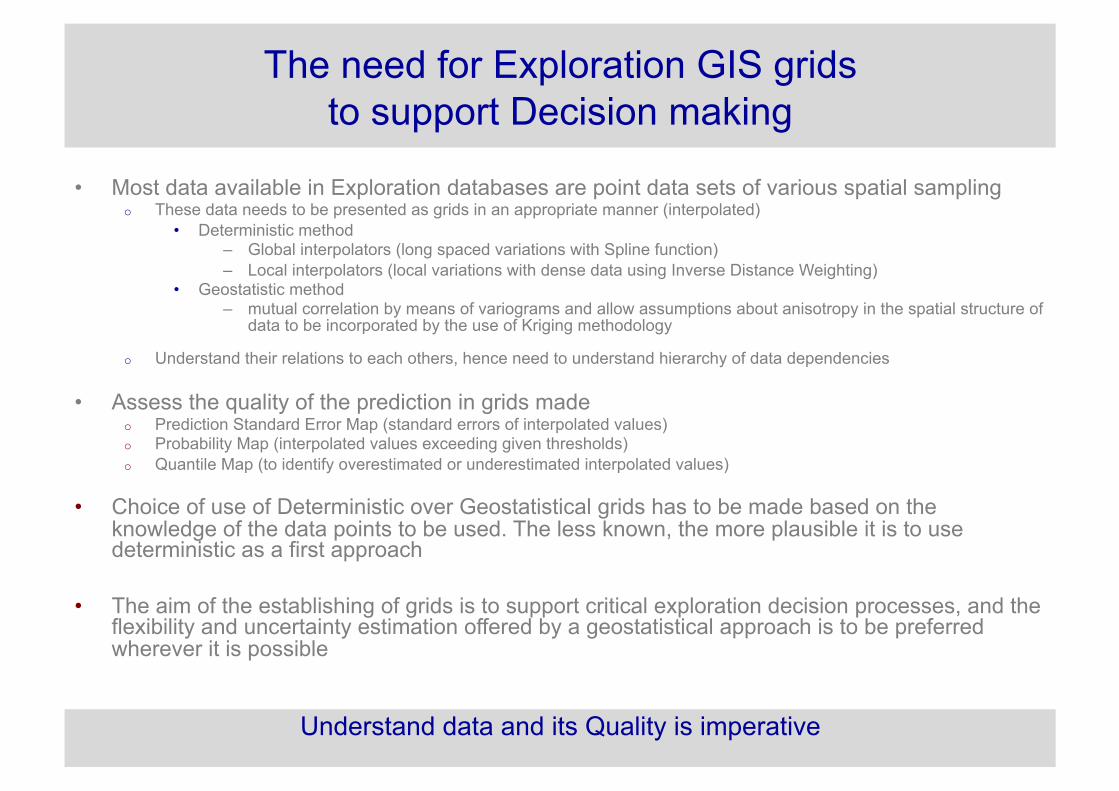
The need for Exploration GIS grids to support Decision making
• Most data available in Exploration databases are point data sets of various spatial sampling o These data needs to be presented as grids in an appropriate manner (interpolated)
• Deterministic method – Global interpolators (long spaced variations with Spline function) – Local interpolators (local variations with dense data using Inverse Distance Weighting)
• Geostatistic method – mutual correlation by means of variograms and allow assumptions about anisotropy in the spatial structure of
data to be incorporated by the use of Kriging methodology
o Understand their relations to each others, hence need to understand hierarchy of data dependencies
• Assess the quality of the prediction in grids made o Prediction Standard Error Map (standard errors of interpolated values) o Probability Map (interpolated values exceeding given thresholds) o Quantile Map (to identify overestimated or underestimated interpolated values)
• Choice of use of Deterministic over Geostatistical grids has to be made based on the knowledge of the data points to be used. The less known, the more plausible it is to use deterministic as a first approach
• The aim of the establishing of grids is to support critical exploration decision processes, and the flexibility and uncertainty estimation offered by a geostatistical approach is to be preferred wherever it is possible
Understand data and its Quality is imperative

Critical E&P Data and how to use them in Exploration Spatial Analysis ?
• FOR PLAY TYPES, PROSPECTS AND LEADS o RESERVOIR o TRAP (called Closure in PAL) o SEAL o CHARGE
• FOR CONTINGENT RESOURCES o SHOWS o UNTESTED HYDROCARBON COLUMN o UNDEVELOPED DISCOVERIES
• FOR DRILLING OPERATIONS DATA
• FOR WELL DATA REQUIREMENTS
Determine data dependencies to understand Probability Of Success (POS) trends

Create GIS Grids
Derive a continuous surface from point observations with little understanding. (from Exprodat, 2010)
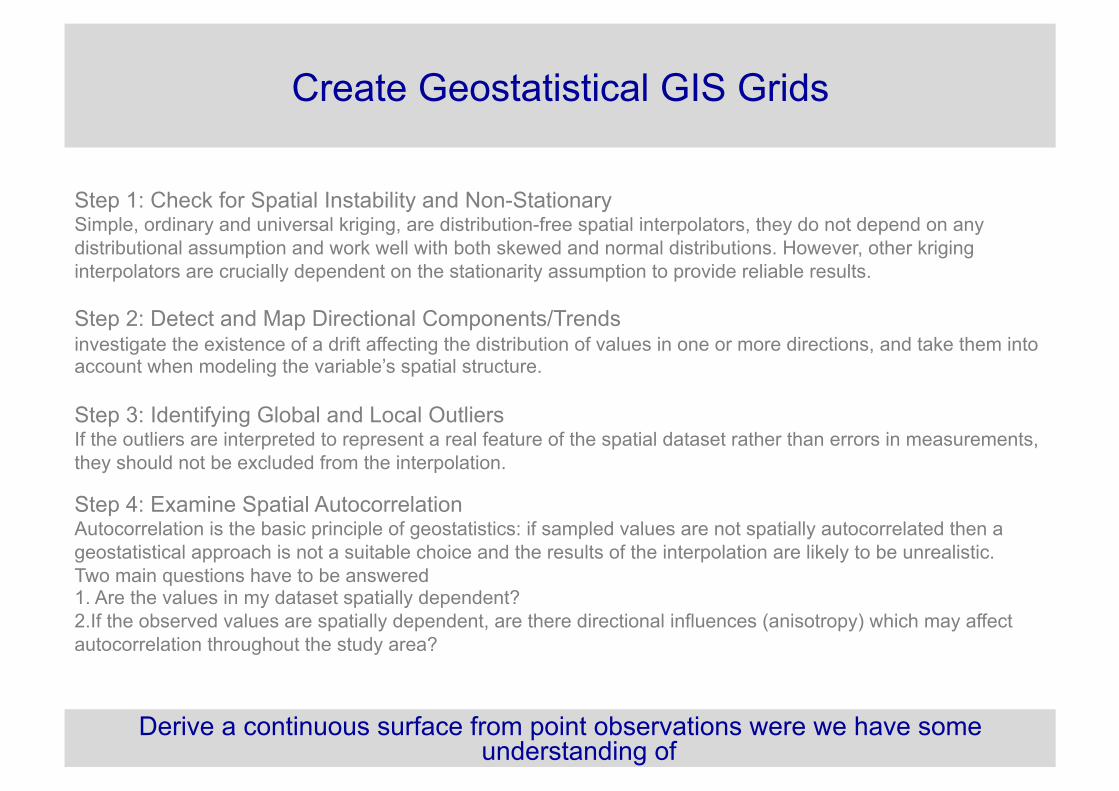
Create Geostatistical GIS Grids
Derive a continuous surface from point observations were we have some understanding of
Step 1: Check for Spatial Instability and Non-Stationary Simple, ordinary and universal kriging, are distribution-free spatial interpolators, they do not depend on any distributional assumption and work well with both skewed and normal distributions. However, other kriging interpolators are crucially dependent on the stationarity assumption to provide reliable results.
Step 2: Detect and Map Directional Components/Trends investigate the existence of a drift affecting the distribution of values in one or more directions, and take them into account when modeling the variable’s spatial structure.
Step 3: Identifying Global and Local Outliers If the outliers are interpreted to represent a real feature of the spatial dataset rather than errors in measurements, they should not be excluded from the interpolation.
Step 4: Examine Spatial Autocorrelation Autocorrelation is the basic principle of geostatistics: if sampled values are not spatially autocorrelated then a geostatistical approach is not a suitable choice and the results of the interpolation are likely to be unrealistic. Two main questions have to be answered 1. Are the values in my dataset spatially dependent? 2.If the observed values are spatially dependent, are there directional influences (anisotropy) which may affect autocorrelation throughout the study area?
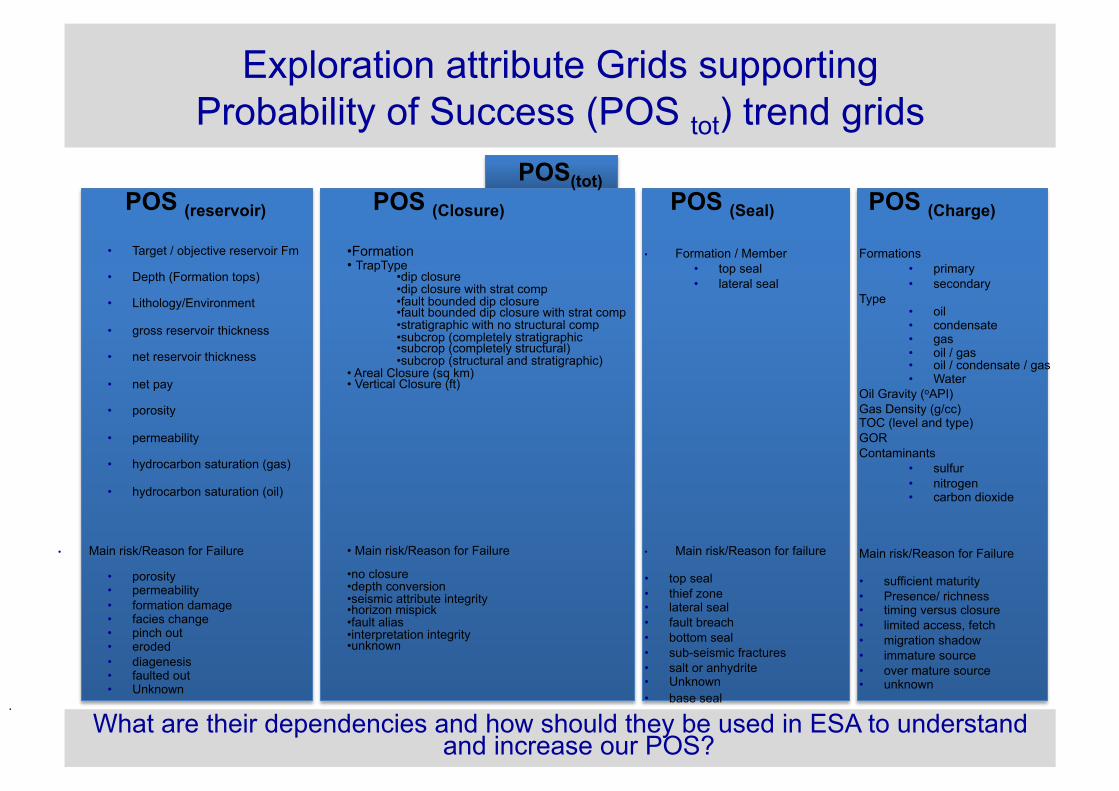
Exploration attribute Grids supporting Probability of Success (POS tot) trend grids
What are their dependencies and how should they be used in ESA to understand and increase our POS?
POS(tot) POS (reservoir) POS (Closure) POS (Seal) POS (Charge)
• Target / objective reservoir Fm
• Depth (Formation tops)
• Lithology/Environment
• gross reservoir thickness
• net reservoir thickness
• net pay
• porosity
• permeability
• hydrocarbon saturation (gas)
• hydrocarbon saturation (oil)
• Main risk/Reason for Failure
• porosity • permeability • formation damage • facies change • pinch out • eroded • diagenesis • faulted out • Unknown
.
• Formation • TrapType
• dip closure • dip closure with strat comp • fault bounded dip closure • fault bounded dip closure with strat comp • stratigraphic with no structural comp • subcrop (completely stratigraphic • subcrop (completely structural) • subcrop (structural and stratigraphic)
• Areal Closure (sq km) • Vertical Closure (ft)
• Main risk/Reason for Failure
• no closure • depth conversion • seismic attribute integrity • horizon mispick • fault alias • interpretation integrity • unknown
• Formation / Member • top seal • lateral seal
• Main risk/Reason for failure
• top seal • thief zone • lateral seal • fault breach • bottom seal • sub-seismic fractures • salt or anhydrite • Unknown • base seal
Formations
• primary • secondary
Type • oil • condensate • gas • oil / gas • oil / condensate / gas • Water
Oil Gravity (oAPI) Gas Density (g/cc) TOC (level and type) GOR Contaminants
• sulfur • nitrogen • carbon dioxide
Main risk/Reason for Failure
• sufficient maturity • Presence/ richness • timing versus closure • limited access, fetch • migration shadow • immature source • over mature source • unknown
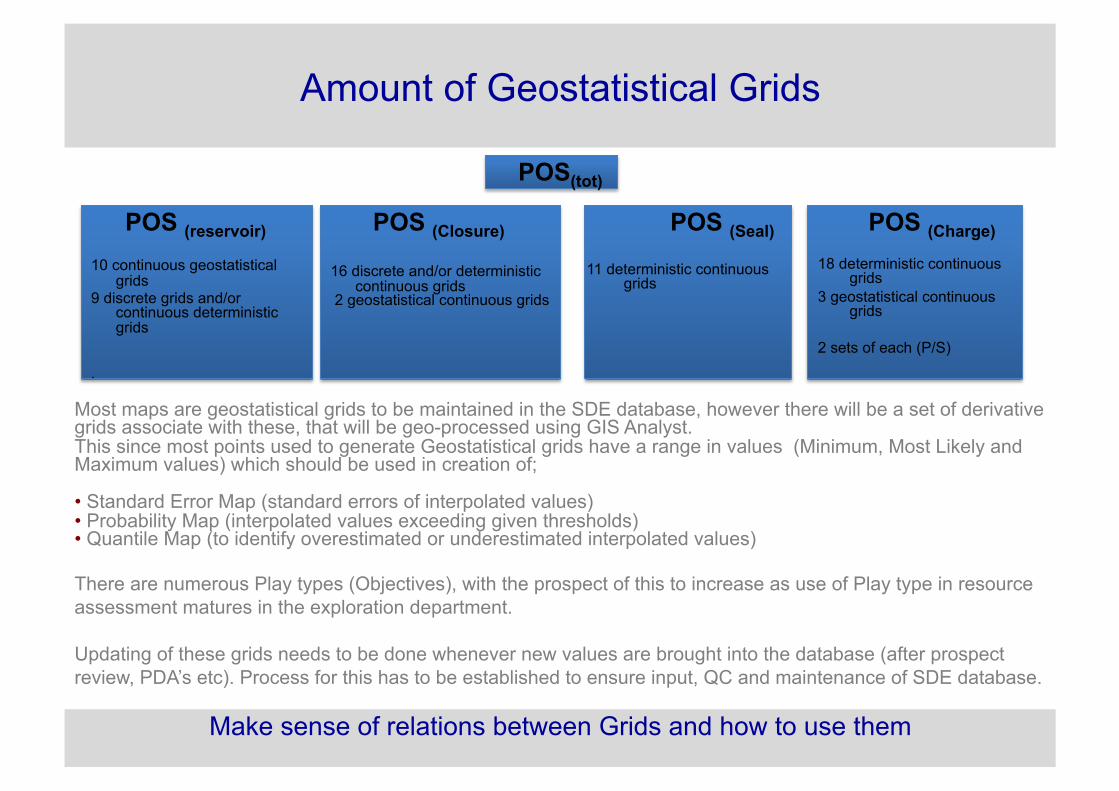
Amount of Geostatistical Grids
Make sense of relations between Grids and how to use them
POS(tot)
POS (reservoir) POS (Closure) POS (Seal) POS (Charge)
10 continuous geostatistical grids
9 discrete grids and/or continuous deterministic grids
.
16 discrete and/or deterministic continuous grids
2 geostatistical continuous grids
11 deterministic continuous grids
18 deterministic continuous grids
3 geostatistical continuous grids
2 sets of each (P/S)
Most maps are geostatistical grids to be maintained in the SDE database, however there will be a set of derivative grids associate with these, that will be geo-processed using GIS Analyst. This since most points used to generate Geostatistical grids have a range in values (Minimum, Most Likely and Maximum values) which should be used in creation of;
• Standard Error Map (standard errors of interpolated values) • Probability Map (interpolated values exceeding given thresholds) • Quantile Map (to identify overestimated or underestimated interpolated values)
There are numerous Play types (Objectives), with the prospect of this to increase as use of Play type in resource assessment matures in the exploration department.
Updating of these grids needs to be done whenever new values are brought into the database (after prospect review, PDA’s etc). Process for this has to be established to ensure input, QC and maintenance of SDE database.
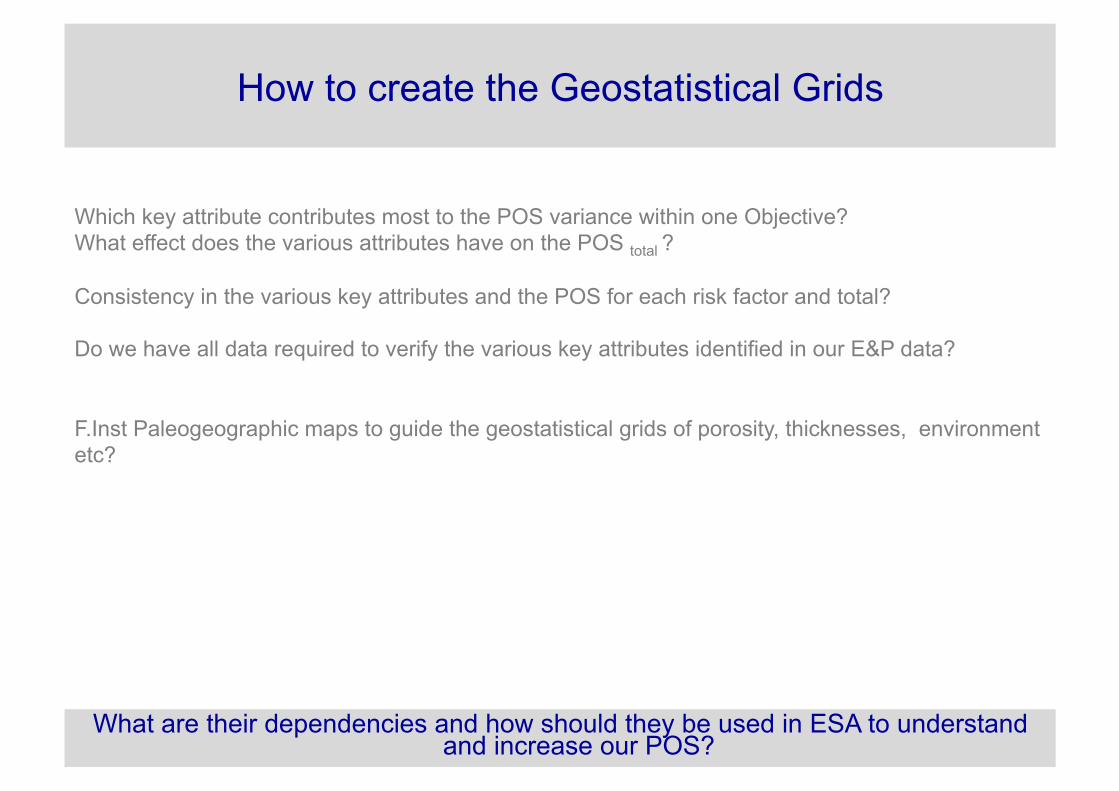
How to create the Geostatistical Grids
What are their dependencies and how should they be used in ESA to understand and increase our POS?
Which key attribute contributes most to the POS variance within one Objective? What effect does the various attributes have on the POS total ?
Consistency in the various key attributes and the POS for each risk factor and total?
Do we have all data required to verify the various key attributes identified in our E&P data?
F.Inst Paleogeographic maps to guide the geostatistical grids of porosity, thicknesses, environment etc?
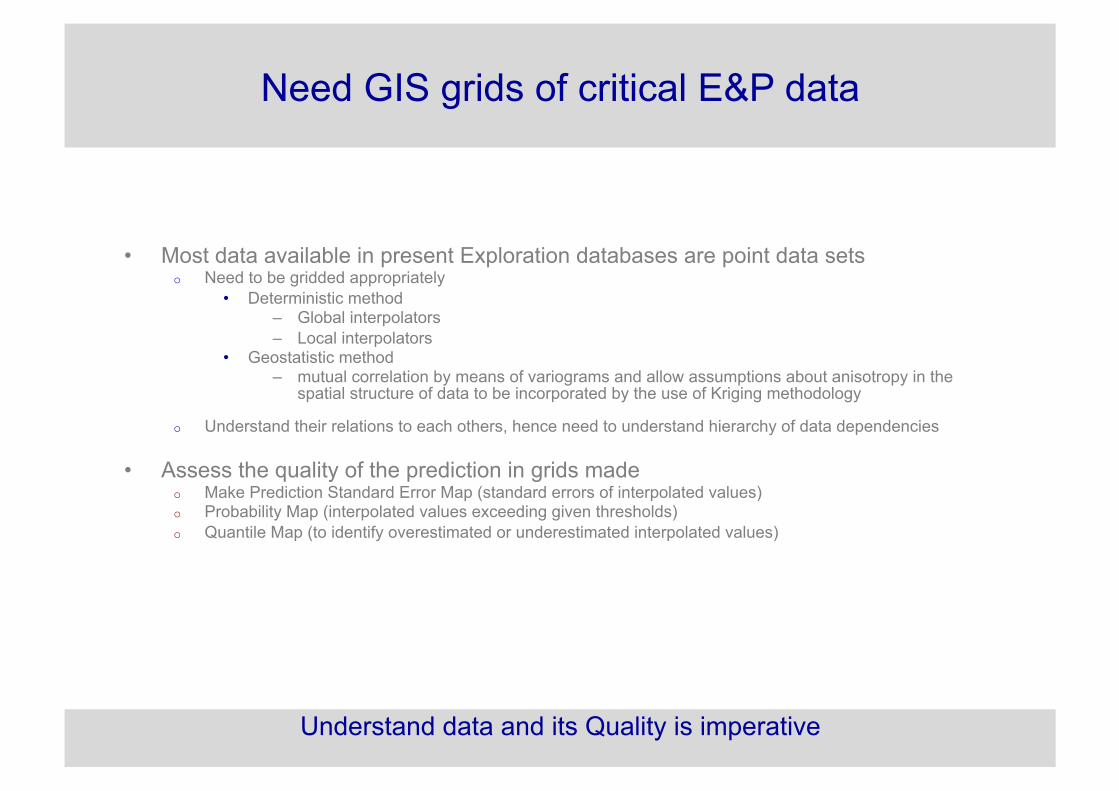
Need GIS grids of critical E&P data
• Most data available in present Exploration databases are point data sets o Need to be gridded appropriately
• Deterministic method – Global interpolators – Local interpolators
• Geostatistic method – mutual correlation by means of variograms and allow assumptions about anisotropy in the
spatial structure of data to be incorporated by the use of Kriging methodology
o Understand their relations to each others, hence need to understand hierarchy of data dependencies
• Assess the quality of the prediction in grids made o Make Prediction Standard Error Map (standard errors of interpolated values) o Probability Map (interpolated values exceeding given thresholds) o Quantile Map (to identify overestimated or underestimated interpolated values)
Understand data and its Quality is imperative

These entities will have the same parameters as any other Prospect in the portfolio would have (see slides ahead), however in addition these entities would have more emphasis on parameters stated below.
• SHOWS
o Stratigraphy (name) o Type (oil/gas/condensate) o Quality (classification 1-5 based on scale determined)
• UNTESTED HYDROCARBON COLUMN o stratigraphy (name) o Interval (ft) o type of hydrocarbon (oil, gas, condensate)
• UNDEVELOPED DISCOVERIES (where, production test volumes
Not any different from other Exploration data apart from the fact; there is more data associated with these entities to perform analysis on
Contingent Resources Analysis

WELL DATA REQUIREMENTS
These data would be able to analyze at objective level combined with any other type of attribute set from all risk factors (reservoir, closure, seal and charge) and contingent resources entities.
o Wireline and Mud Logs o Tests (DSTs, RFTs, etc.) o Cores, SWCs, Cuttings o Mud Type o Pressure Data
• depth • Formation
Support decisions on well log program and guide interpreters to what data is available for analysis of wells
Overview of available data and assist in optimizing future evaluation programs
Visualize well data

• DRILLING OPERATIONS DATA
o Drilling Time / Depth Curve o Drill time to all objectives (days)
o Coring o Time used for coring ( hours)
o Logging o Testing o Pressure
• WELL RESULTS o Success o Failure o Well Classification o Technical Drilling Operations Problems
Support interpreters understanding drilling technical aspects of their prospects
Drilling related data in GIS Analytics
Quick look Analysis on Play type/ Objective level
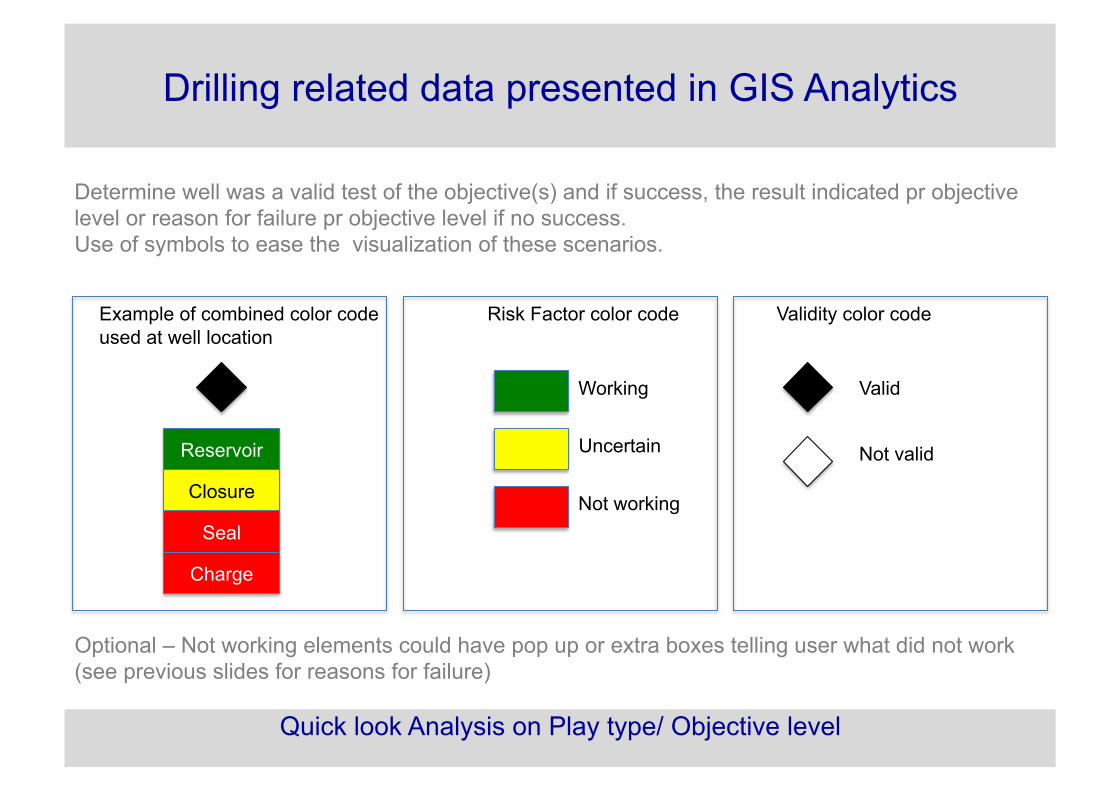
Drilling related data presented in GIS Analytics
Determine well was a valid test of the objective(s) and if success, the result indicated pr objective level or reason for failure pr objective level if no success. Use of symbols to ease the visualization of these scenarios.
Risk Factor color code Validity color code Example of combined color code used at well location
Reservoir
Closure
Seal
Charge
Working
Uncertain
Not working
Valid
Not valid
Optional – Not working elements could have pop up or extra boxes telling user what did not work (see previous slides for reasons for failure)

Examples of analyzing data before creating deterministic grids
Normal QQ plots for Eocene depth values Normal QQ plots for Eocene thickness values
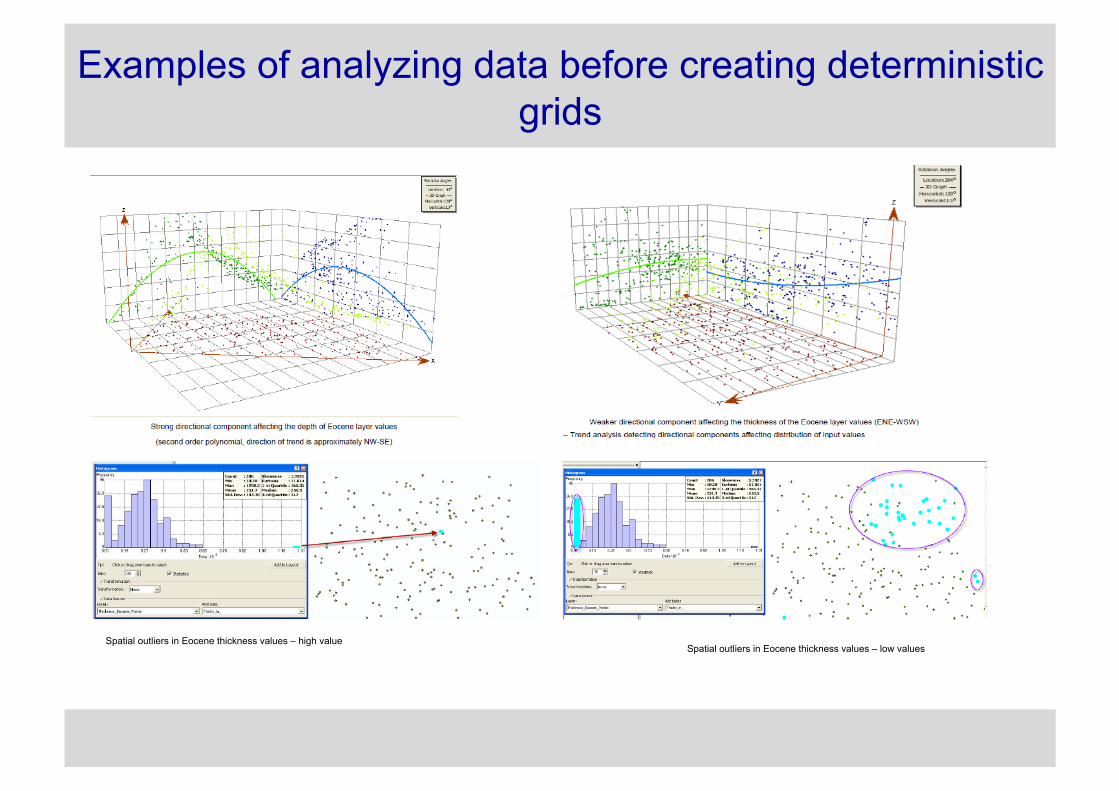
Examples of analyzing data before creating deterministic grids
Spatial outliers in Eocene thickness values – high value Spatial outliers in Eocene thickness values – low values

Examples of analyzing data before creating deterministic grids
Spatial local outliers in Eocene thickness values
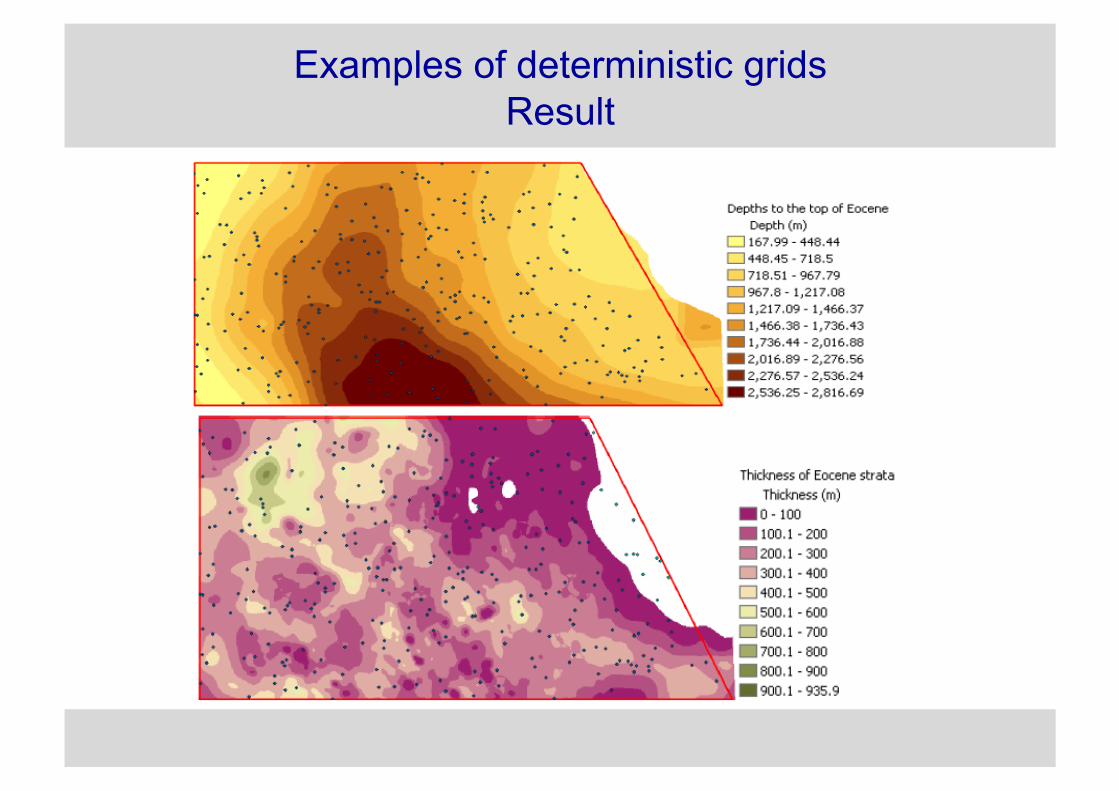
Examples of deterministic grids Result
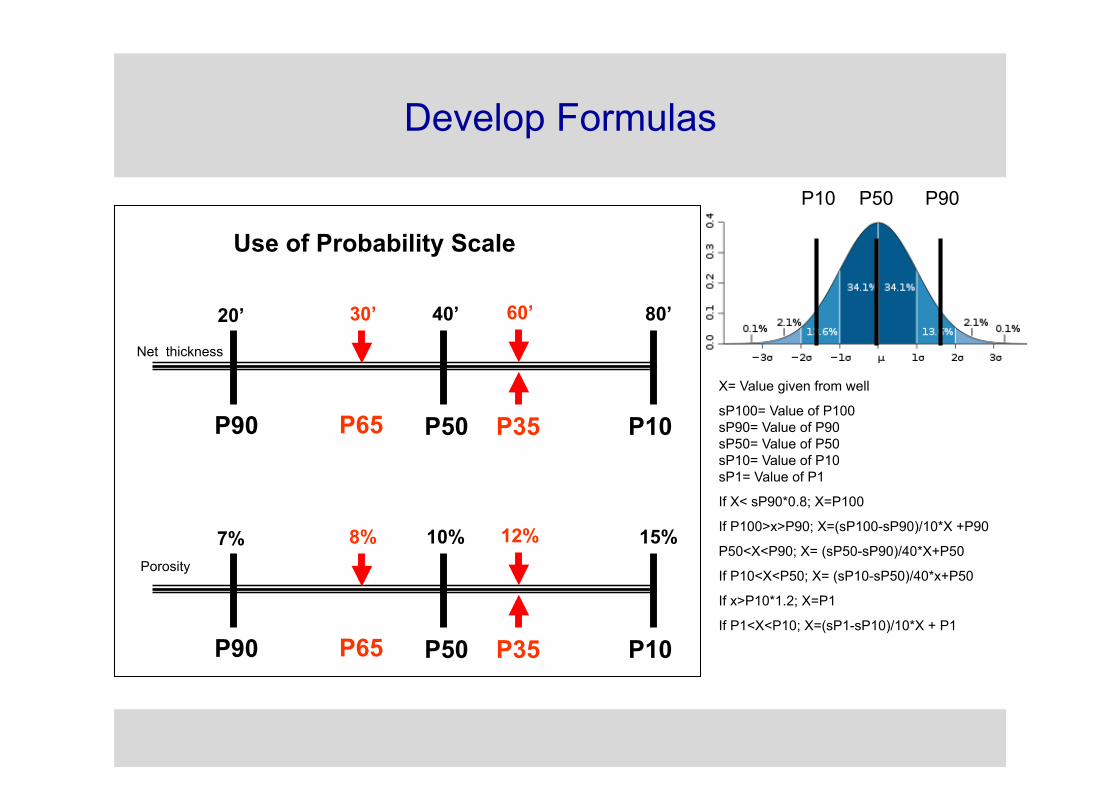
Develop Formulas
Use of Probability Scale
P10 P50 P90
Net thickness
P65 P35
20’ 40’ 80’ 30’ 60’
P10 P50 P90
Porosity
P65 P35
7% 10% 15% 8% 12%
X= Value given from well
sP100= Value of P100 sP90= Value of P90 sP50= Value of P50 sP10= Value of P10 sP1= Value of P1
If X< sP90*0.8; X=P100
If P100>x>P90; X=(sP100-sP90)/10*X +P90
P50<X<P90; X= (sP50-sP90)/40*X+P50
If P10<X<P50; X= (sP10-sP50)/40*x+P50
If x>P10*1.2; X=P1
If P1<X<P10; X=(sP1-sP10)/10*X + P1
P10 P50 P90

Risk Factor Ranking
illustrate key messages regarding pre and post drill risk factor ranking
RESERVOIR CLOSURE SEAL CHARGE Comments
90 80 70 60 POS (%)
4 3 2 1 Risk Factor Rank (1 is highest risk)
4 1 3 2 post drill cause of failure (1 is primary; 2 secondary)