Exploratory Data Analysis Continued
53
-
Upload
yasir-molina -
Category
Documents
-
view
56 -
download
2
description
Exploratory Data Analysis Continued. Exploratory Data Analysis. Set of techniques The flexibility to respond to the patterns revealed by successive iterations in the discovery process is an important attribute Free to take many paths in revealing mysteries in the data - PowerPoint PPT Presentation
Transcript of Exploratory Data Analysis Continued


Exploratory Data Analysis• Set of techniques• The flexibility to respond to the patterns
revealed by successive iterations in the discovery process is an important attribute
• Free to take many paths in revealing mysteries in the data
• Emphasizes visual representations and graphical techniques over summary statistics
EDA
• Summary statistics , may obscure, conceal the underlying structure of the data
• When numerical summaries are used exclusively and accepted without visual inspection, the selection of confirmatory modes may be based on flawed assumptions and may produce erroneous conclusions

Previously Discussed Techniques for Displaying Data
• Frequency Tables
• Bar Charts (Histograms)
• Pie Charts
• Stem and Leaf Displays
• Boxplots

Resistant Statistics• Example: data set = [5,6,6,7,7,7,8,8,9]• The mean is 7 and the standard deviation 1.23• Replace the 9 with 90 and the mean becomes 16 and the
standard deviation 27.78.• Changing only one of the nine values has disturbed the
location and spread summaries to the point where they no longer represent the other eight values. Both mean and standard deviation are considered nonresistant statistics
• The median remained at 7 and the lower and upper quartiles stayed at 6 and 8, respectively.
Visual Techniques of EDA
• Gain insight into the data• More common ways of summarizing
location, spread, and shape• Used resistant statistics• From these we could make decisions on test
selection and whether the data should be transformed or reexpressed before further analysis
More Techniques
• Last section focused on primarily single-variable distributions
• inspect relationships between and among variables

Crosstabulation
• Technique for comparing two classification variables
• uses tables having rows and columns that correspond to the levels or values of each of the variable’s categories

Example of a Crosstabulation Oversees Assignment YES NO Row Total Gender Male 22 40 62 Row % 35.5 64.5 62.0 Col % 78.6 55.6 Tot % 22.0 40.0 Female 6 32 38 Row % 15.8 84.2 38.0 Col % 21.4 44.4 Tot % 6.0 32.0 Column 28 72 100 28.0 72.0 100.0

The Use of Percentages
• simplify the data by reducing all numbers to a range from 0 to 100
• translate the data into standard form, with a base of 100, for relative comparisons– A raw count has little value unless we know it is from a
sample of 100 (28%)
– while this is useful, it even more useful when the research calls for a comparison of several distributions of the data

Comparison of a Crosstabulations Oversees Assignment YES NO Row Total Gender Male 225 675 900 Row % 25.0 75.0 60.0 Col % 62.5 59.2 Tot % 15.0 45.0 Female 135 465 600 Row % 22.5 77.5 40.0 Col % 37.5 40.8 Tot % 9.0 31.0 Column 360 1140 1500 24.0 76.0 100.0

Use of Percentages
• Comparing the present sample (100) and the previous sample (1500), we can view the relative relationships and shifts in the data.
• In comparing two-dimensional tables, the selection of either the row or the column will accentuate a particular distribution or comparison. ( Note in our last tables both column and row were presented)
Presenting Percentages
• When one variable is hypothesized to the presumed cause, it is thought to affect or predict a response, label it the independent variable and % should be computed in the direction of this variable
• Which direction should the last example(s), gender by oversees assignment run?

Independent Variable
• (row) - the implication is that gender influences selection for oversees assignments
• if you said column, you are implying that the assignment status has some effect on the gender and this is implausible!
• Note that you can do the calculations, but they may not make sense!
Other Guidelines for Percentages
• Averages percentages: Percentages cannot be averaged unless each is weighted by the size of the group from which it is derived. (weighted average)
• Use of too large percentages: A large percentage is difficult to understand. If a 1000 % increase, better to state it as a tenfold increase.
Other Guidelines for Percentages
• Using too small of a base: Percentages hide the base from which they have been computed
• Percentage decrease can never exceed 100 percent. The higher figure should be always used as the base.

Other Table-Based Analysis
• Recognition of a meaningful relationship between variables generally signals a need for further investigation.
• Even if one finds a statistically significant relationship, the questions of why and under what conditions remain.
• Normally introduce a control variable• Statistical packages can handle complex tables
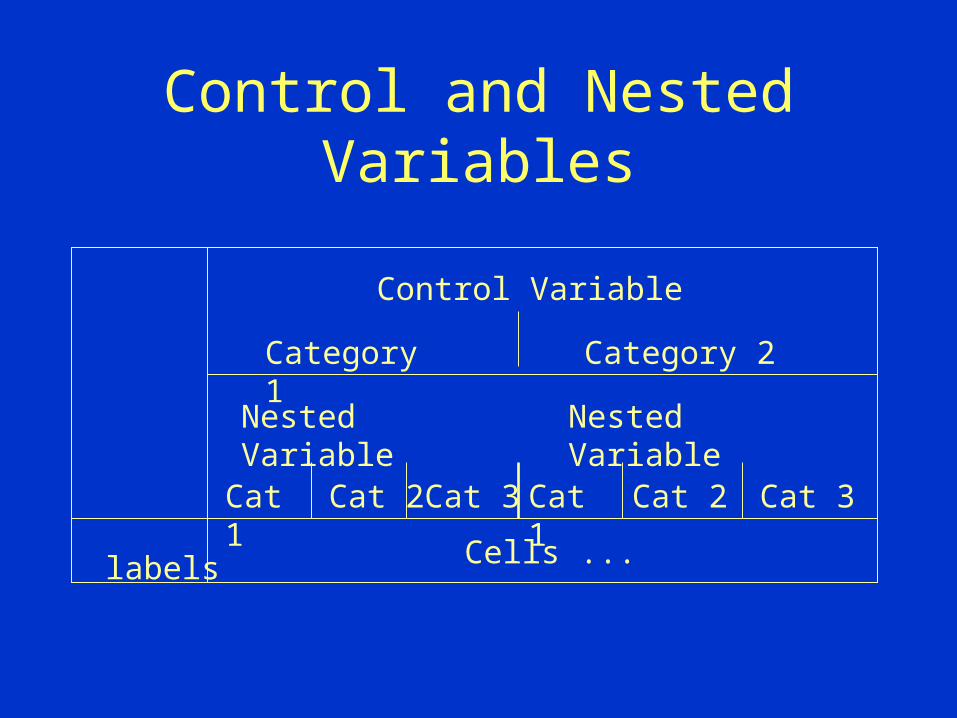
Control and Nested Variables
Control Variable
Category 1 Category 2
Nested Variable Nested Variable
Cat 1 Cat 2 Cat 3 Cat 1 Cat 2 Cat 3
Cells ...labels

Data Mining• Describes the concept of discovering knowledge
from databases• the idea behind it is the process of identifying
valid, novel, useful, and ultimately understandable patterns in data
• provides two unique capabilities to the researcher– pattern discovery
– predicting trend and behavior


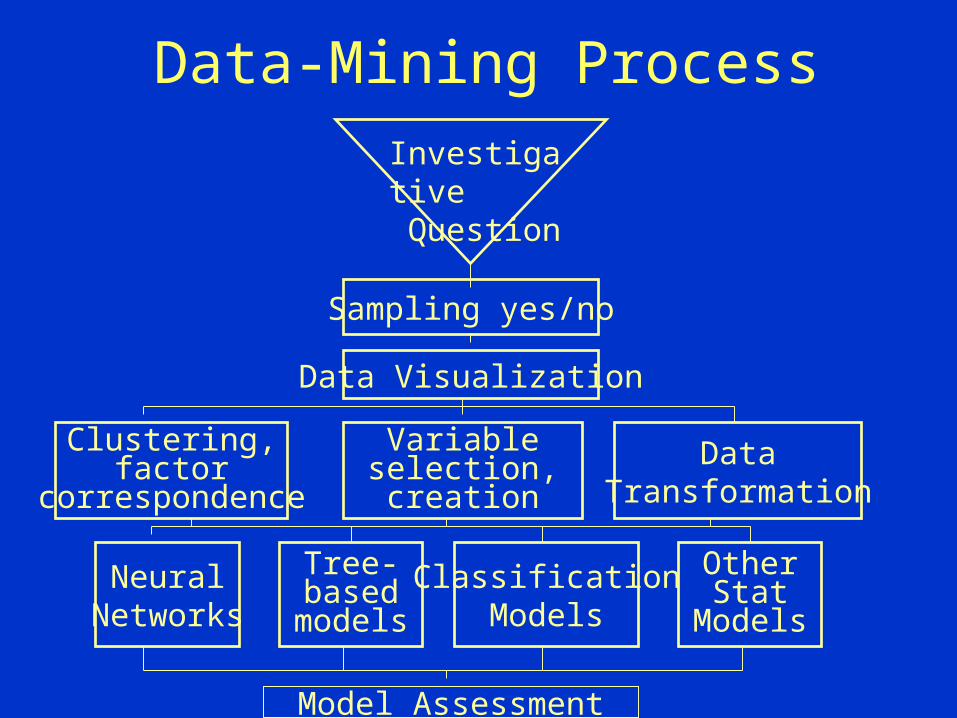
Data-Mining Process
Investigative Question
Sampling yes/no
Clustering,factor
correspondenceData
Transformation
NeuralNetworks
Tree-based
modelsClassification
Models
OtherStat
Models
Data Visualization
Variableselection,creation
Model Assessment
Sampling Yes/No
• Use the entire set or a sample of the data
• if fast turnaround is more important than absolute accuracy, sampling may be appropriate
• Sample - if data set is large - terabytes

Modify
• Based on discoveries, data may require modification– Clustering, factor, correspondence analysis– Variable selection, creation– Data transformation

Factor Analysis
• General term for several specific computational techniques
• All have the objective of reducing to a manageable number many variables that belong together and have overlapping measurement characteristics

Factor Analysis Method
• Begins with construction of a new set variables based on the relationships in the correlation matrix
• Can be done in a variety of ways
• most popular is principal components analysis.

Principal Components Analysis
• Transforms a set of variables into a new set that are not correlated with each other.
• These linear combinations of variables, called factors, account for the variance in the data as a whole.
• All factors being the best linear combination of variables not accounted for by previous factors

Principal Components Analysis
• Process continues until all the variance is accounted for
Extracted components % of variance cumulative accounted for variance Component 1 63% 63%Component 2 29 92Component 3 8 100

Cluster Analysis
• Unlike the techniques for analyzing the relationships between variables
• Set of techniques for grouping similar objects
• Cluster starts with a undifferentiated group• Different that discriminant analysis where
you search for set of variables to separate them

Cluster Analysis Method
• Select the sample (employees, buyers)• Definition of the variables on which to measure
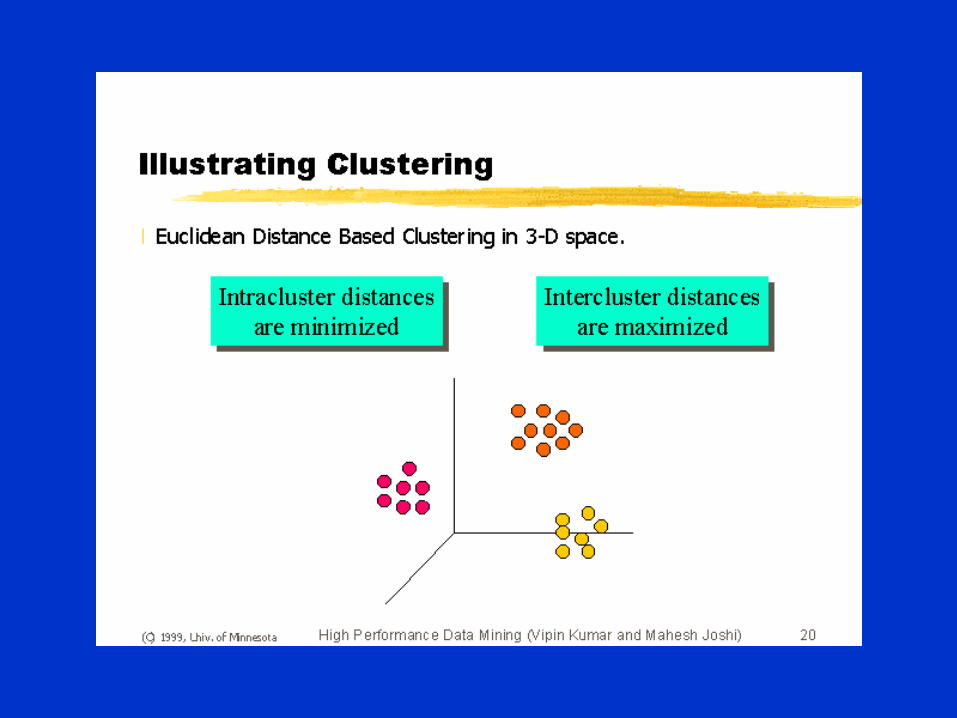
the objects• Computation of similarities amount entities
through correlation, Euclidean distances and other techniques
• Selection of mutually exclusive clusters ( maximization of within-cluster similarity and between-cluster differences)
• Cluster comparison and validation

ClusteringDifferent methods produce different solutions• Cluster analysis methods are not clearly established.
There are many options one may select when doing a cluster analysis using a statistical package. Cluster analysis is thus open to the criticism that a statistician may mine the data trying different methods of computing the proximities matrix and linking groups until he or she "discovers" the structure that he or she originally believed was contained in the data. One wonders why anyone would bother to do a cluster analysis for such a purpose.

A Very Simple Cluster Analysis
• In cases of one or two measures, a visual inspection of the data using a frequency polygon or scatterplot often provides a clear picture of grouping possibilities. For example, "Example Assignment" is data from a cluster analysis homework assignment.
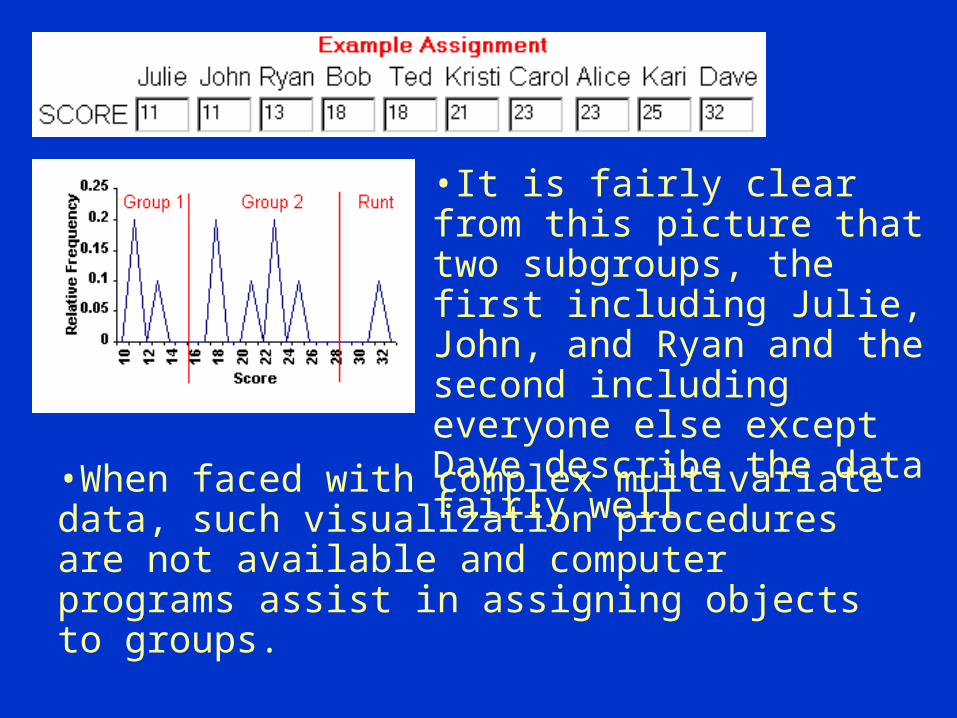
•It is fairly clear from this picture that two subgroups, the first including Julie, John, and Ryan and the second including everyone else except Dave describe the data fairly well.
•When faced with complex multivariate data, such visualization procedures are not available and computer programs assist in assigning objects to groups.

DendogramThe clusters and their relative distances are displayed in a diagram called a dendogram

The following HTML page describes the logic involved in cluster analysis
algorithms.
http://www.cs.bsu.edu/homepages/dmz/cs689/ppt/entire_cluster_example.html
Correspondence Analysis• a descriptive/exploratory technique designed to analyze
simple two-way and multi-way tables containing some measure of correspondence between the rows and columns.
• provide information which is similar in nature to those produced by factor analysis techniques
• allow one to explore the structure of categorical variables included in the table.
• The most common kind of table of this type is the two-way frequency crosstabulation table
• See http://www.statsoft.com/textbook/stcoran.html

Variable Selection, Creation
• If important constructs were discovered, new factors would be introduced to categorize the data
• Some may be dropped

WinSTAThttp://www.winstat.com/
Welcome! (text from their home page)WinSTAT is the statistics Add-In for Microsoft Excel, and this is
the place to find out all about it.Tired of your hard-to-use, need-to-be-a-fulltime-expert statistics
package? Find out why WinSTAT is the program for you.Wondering if WinSTAT covers the functions and graphics you
need? Let the function reference page surprise you, complete with sample outputs of tables and graphics for all functions.
Still not convinced? There's no way to be sure until you've tried WinSTAT for yourself. We've got the demo download right here.
Dmz Note WinSTAT also does clustering, factor analysis, and the usual EDA techniques

Model
• If a complex predictive model is needed, the researcher will move to the next step of the process, building a model
• Modeling techniques include, neural networks, decision tree, sequence-based, classification and estimation

Neural Networks
• Also called artificial neural networks (ANN) • Collections of simple processing nodes that are
connected• Each node operates only its local data and on the
inputs it receives through connections• The result is a nonlinear predictive model that
resembles biological neural networks and learns through training.

Neural Networks
• The neural model has to train its network on a training data set.

Tree Models
• Segregates data by using a hierarchy of if-then statements based on the values of variables and creates a tree-shaped structure that represents the segregation decisions.


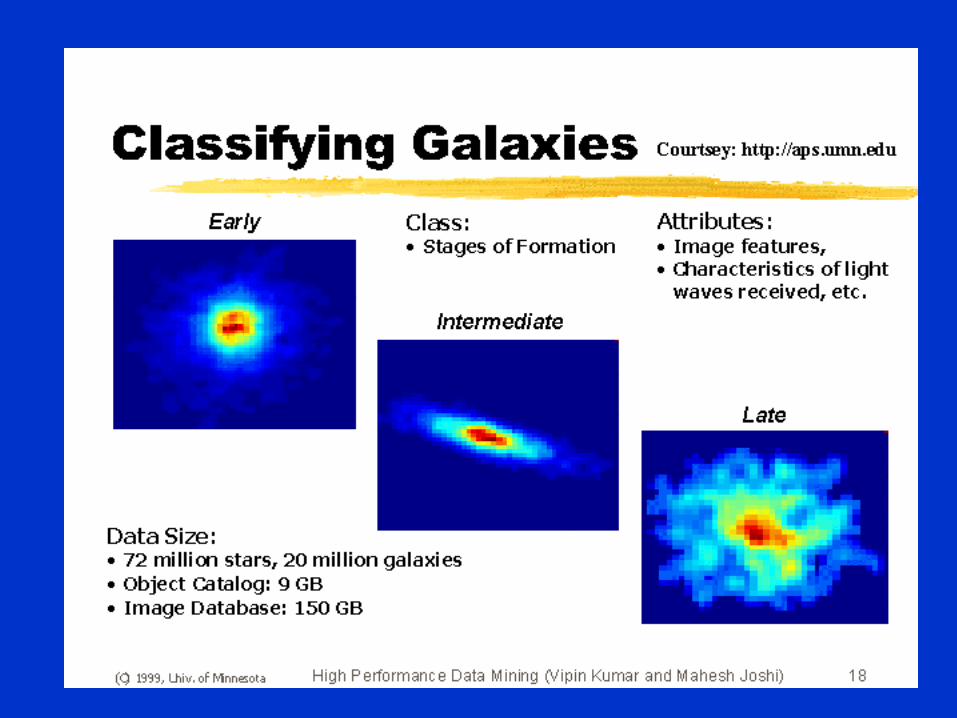
Classification –Sky Surveying Cataloging
• To predict class (star or galaxy) of sky objects, especially faint ones, based on telescopic survey images (from Palomar Observatory)
• 3000 images with 23,040 x 23,040 pixels per image
– Approach:– Segment the image– Measure the image attributes (features) 40 of them per
object.– Model the class based on these features– Success Story: Could find 16 new red-shift quasars,
some of the farthest objects that are difficult to find
Estimation
• Variation of classification
• Instead of just “yes” or ‘no” outcome, generates a score
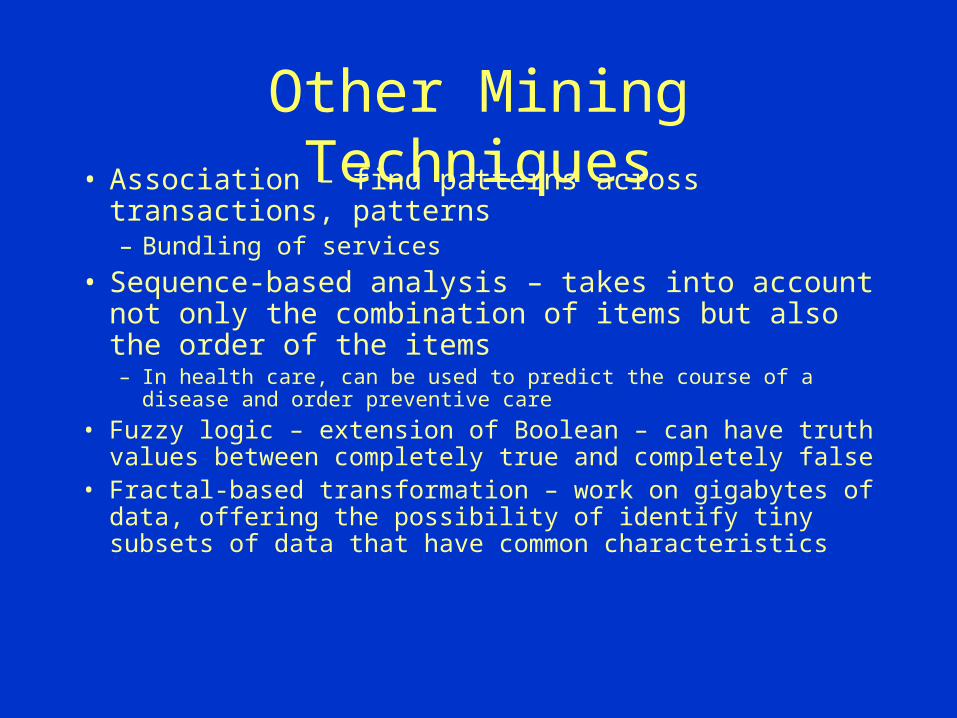
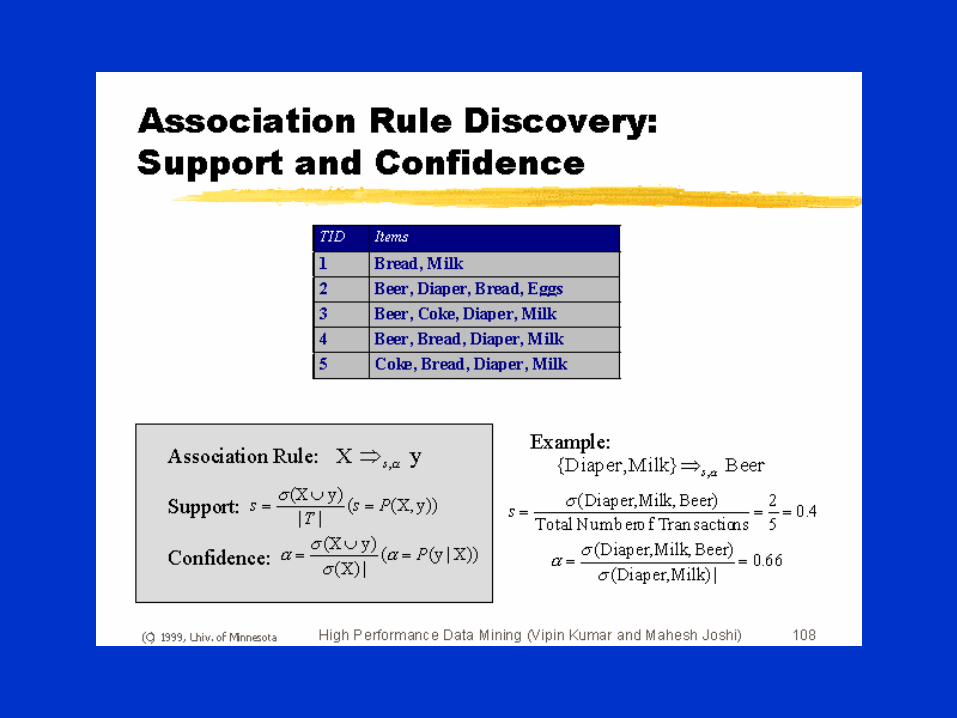
Other Mining Techniques• Association – find patterns across transactions, patterns
– Bundling of services
• Sequence-based analysis – takes into account not only the combination of items but also the order of the items – In health care, can be used to predict the course of a disease and order
preventive care
• Fuzzy logic – extension of Boolean – can have truth values between completely true and completely false
• Fractal-based transformation – work on gigabytes of data, offering the possibility of identify tiny subsets of data that have common characteristics


Other Statistical Products
• http://www.statsoftinc.com/ - also includes an online statistical textbook
• Statlib: a major site for statistical software of all sorts. – Gopher to lib.stat.cmu.edu– Anonymous ftp to lib.stat.cmu.edu– URL: http://lib.stat.cmu.edu/