Exploration of Temporal and Time-Averaged Two-Phase Flow ... · Exploration of Temporal and...
16
ILASS Americas, 29 th Annual Conference on Liquid Atomization and Spray Systems, Atlanta, GA, May 15-18, 2017 Exploration of Temporal and Time-Averaged Two-Phase Flow Structures Using X-Ray Diagnostics Kuo-Cheng Lin* Taitech, Inc. Beavercreek, Ohio 45430 Alan Kastengren Argonne National Laboratory Argonne, Illinois 60439 Campbell Carter Air Force Research Laboratory, Aerospace Systems Directorate Wright-Patterson AFB, Ohio 45433 Abstract Time-averaged and temporal structures of the two-phase flows within the nozzle of an aerated-liquid injector were experimentally explored with synchrotron x-ray diagnostics, including pathlength-integrated and confocal x-ray fluo- rescence and x-ray high-speed imaging. A beryllium nozzle with a constant passage diameter was fabricated to mate with an aerated-liquid injector featuring the outside-in aerating scheme. Water and nitrogen were doped with x-ray fluorescent elements at low concentrations to facilitate the x-ray diagnostics. The present study shows that the two- phase flows inside the nozzle section exhibit an annular-like flow pattern, while the aerating gas is distributed in a Gaussian-like pattern. Axial distributions of the average liquid density, gas density, and liquid velocity were also explored by integrating the line-of-sight properties over several cross-sectional areas and axial locations within the nozzle section. For the first time on these sprays, a confocal x-ray fluorescence measurement was carried out with a polycapillary x-ray optic to spatially resolve the cross-sectional mass distributions within the near field of various discharged plumes. Plume separation phenomena were readily observed in both liquid and gas plumes. High-speed imaging shows that large-scale structures are mainly present in the plenum section and can be aerodynamically stretched into fine structures near the nozzle exit. __________________________________________ * Corresponding author, [email protected]
Transcript of Exploration of Temporal and Time-Averaged Two-Phase Flow ... · Exploration of Temporal and...

ILASS Americas, 29th Annual Conference on Liquid Atomization and Spray Systems, Atlanta, GA, May 15-18, 2017
Exploration of Temporal and Time-Averaged Two-Phase Flow Structures Using
X-Ray Diagnostics
Kuo-Cheng Lin*
Taitech, Inc.
Beavercreek, Ohio 45430
Alan Kastengren
Argonne National Laboratory
Argonne, Illinois 60439
Campbell Carter
Air Force Research Laboratory, Aerospace Systems Directorate
Wright-Patterson AFB, Ohio 45433
Abstract
Time-averaged and temporal structures of the two-phase flows within the nozzle of an aerated-liquid injector were
experimentally explored with synchrotron x-ray diagnostics, including pathlength-integrated and confocal x-ray fluo-
rescence and x-ray high-speed imaging. A beryllium nozzle with a constant passage diameter was fabricated to mate
with an aerated-liquid injector featuring the outside-in aerating scheme. Water and nitrogen were doped with x-ray
fluorescent elements at low concentrations to facilitate the x-ray diagnostics. The present study shows that the two-
phase flows inside the nozzle section exhibit an annular-like flow pattern, while the aerating gas is distributed in a
Gaussian-like pattern. Axial distributions of the average liquid density, gas density, and liquid velocity were also
explored by integrating the line-of-sight properties over several cross-sectional areas and axial locations within the
nozzle section. For the first time on these sprays, a confocal x-ray fluorescence measurement was carried out with a
polycapillary x-ray optic to spatially resolve the cross-sectional mass distributions within the near field of various
discharged plumes. Plume separation phenomena were readily observed in both liquid and gas plumes. High-speed
imaging shows that large-scale structures are mainly present in the plenum section and can be aerodynamically
stretched into fine structures near the nozzle exit.
__________________________________________ * Corresponding author, [email protected]

ILASS Americas, 29th Annual Conference on Liquid Atomization and Spray Systems, Atlanta, GA, May 15-18, 2017
INTRODUCTION
Liquid aeration, also called ‘effervescence’ or
‘barbotage,’ is a plausible approach to enhance liquid
atomization in several applications.1-5 The working
principle involves the mixing of a relatively small
amount of aerating gas (by mass) with liquid for the
creation of a two-phase mixture inside the injector prior
to discharge. For well-designed injector and injection
conditions, a well-dispersed plume can be generated for
effective mixing with the ambient air. With the
application of optical-based disgnostics, such as
shadowgraph and phase Doppler particle analyzer, it has
also been shown that the liquid aeration technique can
generate a spray that penetrates deeply into high-speed
crossflows and produces favorable plume/droplet
properties, such as a high-concentration smaller droplets
distributed over a larger plume cross section.6-8
Recently, efforts to characterize the near-field
structures of aerated-liquid jets were carried out with
various x-ray diagnostics, including x-ray phase contrast
imaging (PCI), x-ray radiography, and x-ray
fluorescence.9-14 For instance, the x-ray PCI technique is
capable of providing qualitative visualization of
droplets, ligaments, and even bubbles within the near
field of the aerated-liquid jets.9-11 Droplet diameter,
bubble diameter, and bubble film thickness within the
periphery of the spray could also be measured from the
x-ray PCI images. The studies with pathlength-inte-
grated x-ray radiography and fluorescence techniques
provide quantitative and time-averaged characterization
of liquid and mass distributions within the near fields of
aerated-liquid jets.12-15 Both techniques were also used to
quantitatively characterize the two-phase flow structures
inside an aerated-liquid injector, which was made out of
beryllium and features the outside-in aeration scheme.16
Beryllium has fairly low x-ray absorption and, therefore,
allows for high transmittance of incident, transmitted,
and emitted x-ray photons.
The objective of the present study is to characterize
both time-averaged and temporal two-phase flow struc-
tures generated from an aerated-liquid injector featuring
the outside-in aeration scheme. For this aeration scheme,
the aerating gas flows through an annular passage before
entering the central liquid stream for mixing. Time-aver-
aged flow properties within the beryllium nozzle and
also the near field of discharged plumes were character-
ized with pathlength-integrated and confocal x-ray fluo-
rescence techniques. In addition, high-speed imaging
with “white beam” x-rays was utilized temporally re-
solve qualitative flow evolution and even quantitative
flow velocity in this study.
EXPERIMENTAL METHODS
Experimental Setup The experiment was conducted at the 7-BM beam-
line of the Advanced Photon Source (APS) at Argonne
National Laboratory. For the present study, the injector
assembly and liquid spray were placed in the path of a
small x-ray beam. Water and aerating gas were supplied
into the aerated-liquid injector at the desired flow rates
to form a two-phase mixture inside the injector before
discharge into a quiescent environment. The aerated-liq-
uid injector features the outside-in aeration configuration
with the aerating gas flowing through an annular passage
before entering the central liquid stream for mixing. Fig-
ure 1 shows a schematic of the injection assembly, which
has a stainless steel injector body, an aerating tube, and
an exchangeable beryllium nozzle. The aerating tube has
an internal diameter of 2.2 mm and features 32 small or-
ifices located in 16 rows with two 0.18-mm diameter or-
ifices in each row. Orifices in each row are offset by 90
degrees from the orifices in adjacent rows, resulting in
an orifice distribution pattern in four columns on the aer-
ating tube.
A beryllium nozzle was fabricated for the present
study. Beryllium has high x-ray transmittance compared
to other metals and permits interrogation of the two-
phase flow inside the nozzle passage. Schematics of the
nozzle are shown in Fig. 2. The nozzle features a con-
toured entrance, followed by a cylindrical passage with
a constant diameter (do) of 1.0 mm (0.04 in.) and a pas-
sage length (L) of 10 mm, which lead to L/do of 10. The
nozzle has a short plenum section with a diameter of 2.2
mm to smoothly connect with the aerating tube.
The aerated-liquid jet was vertically discharged into
a collecting bucket with a small opening on the cap to
minimize the probability of stray droplets entering the
beam path. The distance between the nozzle exit and the
bucket cap was kept around 5 mm for probing inside the
beryllium nozzle and 15 mm for probing of the dis-
charged jet, in order to avoid splashing. Both the aerated-
liquid injector and the collecting bucket were rigidly
mounted on a traversing table, which provided move-
ment normal to the x-ray beam.
X-Ray Measurements
7-BM beamline at Argonne National Laboratory is
dedicated to ultrafast x-ray radiography, fluorescence,
and tomography experiments in fuel sprays and associ-
ated phenomena. The x-ray source for the beamline is a
synchrotron bending magnet, which produces nearly col-
limated, broadband x-ray emission. The beamline con-
sists of two radiation enclosures. The first enclosure
(7BM-A) houses a pair of slits to limit the x-ray beam
size and a double multilayer monochromator (1.2 – 4.3%
∆E/E). The monochromatic beam then passes into the
second radiation enclosure (7BM-B), which houses the
experimental equipment. More information regarding
the beamline performance can be found in the study of
Kastengren et al.17
Based on previous success in probing the two-phase
mixtures inside a beryllium nozzle,16 x-ray fluorescence
was used to simultaneously measure gas and liquid con-
centrations. When an element is illuminated with x-rays,
ionization of core shell electrons occurs. To relax from
this highly excited state, atoms can emit an x-ray fluo-
rescence photon. The energy of this photon is character-
istic of the atomic number of the atom emitting the pho-
ton, and the emitted fluorescence flux is proportional to
the amount of fluorescent material in the beam. As such,
x-ray fluorescence is commonly used for nondestructive
elemental analysis. More detail of the x-ray fluorescence
process is given in Refs. [16, 18, 19].
X-ray fluorescence from the liquid and gas phases
can be used to determine the distributions of liquid and
gas independently, by doping the working fluids with
bromine (Br) and krypton (Kr) atoms, respectively. So-
dium bromide (NaBr) was dissolved into the water at a
concentration of 0.13% by mass. This concentration was
monitored during the experiment by measuring the elec-
trical conductivity of the water, which was approxi-
mately 1500 µS/cm. The gas phase was pre-mixed (by
the gas vendor) to a concentration of 3% Kr (and 97%
N2) by volume. The fluorescence signals were measured
by a silicon drift diode detector, which was oriented 90°
to the x-ray beam in order to minimize elastic x-ray scat-
tering. For the current x-ray fluorescence experiments,
the mean x-ray beam photon energy was set at 15 keV; a
photon energy of at least 14.3 keV is required to excite
both Br and Kr. The beam was focused using a pair of
300 mm long Kirkpatrick-Baez focusing mirrors. The
beam focus is approximately 5 6 µm FWHM V H,
located approximately 500 mm from the center of the
horizontal focusing mirror. The effective size of the
beam for the current sprays (which are several mm wide)
is somewhat greater than this minimum focus size. The
experimental setup at the 7-BM beamline is shown in
Fig. 3.
Two setups for the fluorescence detector were used
in the present study. The first setup measured the path-
length-integrated mass distributions within the beryllium
nozzles or within the discharged plumes, as illustrated by
the schematics in Fig. 4(a). This is similar to the setup
used in previous x-ray fluorescence measurements of
aerated sprays.15,16 Obliquely scattered x-rays were mit-
igated using a set of Soller slits. In addition, aluminum
and selenium filters were used to filter out elastically
scattered photons and x-ray fluorescence photons from
impurities (e.g., Fe, Cu) in the beryllium nozzle. The de-
tector area measures 100 mm2, and was positioned ap-
proximately 100 mm from the injector.
The second setup used confocal x-ray fluorescence
to examine only a small part of the beam path through
the spray, as illustrated by the schematics in Fig. 4(b). A
polycapillary x-ray optic with a focal length of 100 mm
was placed in front of the fluorescence detector.20 The
optic only allowed x-rays from a region approximately
300 m in width to reach the fluorescence detector. The
polycapillary and detector were aligned with the x-ray
beam. Distributions of liquid and gas mass resolved in
three dimensions can be established by moving the spray
normal to the x-ray beam and the detector and polycapil-
lary together along the x-ray beam. This setup was only
used to interrogate the plume structures outside the in-
jector, in order to avoid the absorption of the scattered
photons by the beryllium body. Given that only a small
portion of the beam path was sampled in these measure-
ments, the NaBr concentration was increased to 0.45%
by mass for these measurements.
The first parameter derived from the processed flu-
orescence signals is the equivalence path length (EPL),
which is the equivalent length for continuous distribution
of the media of interest, such as liquid or gas phase, to
generate identical fluorescence intensity measured from
the two-phase mixture along the x-ray beam path. The
schematics in Fig. 5 conceptually illustrate the EPL
measurement from the present x-ray diagnostics. With
the successful measurement of EPLs for both liquid and
gas phases, densities of liquid and gas phases and veloc-
ity of the liquid phase can be averaged over the cross
section of the interrogation plane, if the boundary of the
cross section can be reasonably defined.13 Note that only
time-averaged properties are measured by the present x-
ray fluorescence diagnostics.
In order to temporally resolve the two-phase flow
structures, high-speed images of these flowfields were
also performed. For these measurements, the raw x-ray
emission from the bending magnet source (termed
“white beam”) was used to illuminate the sample with no
filtering (other than that inherent in the 750 µm of beryl-
lium windows and 50 µm of polyimide in the beamline
and the air gaps in the experimental setup). The x-ray
beam, measuring about 3 mm (H) × 8 mm (W), was
transmitted through the injector and then impinged on a
LuAG:Ce scintillator crystal (100 µm thick) to convert
the x-ray image to visible light. For this purpose, a Pho-
tron SA-Z camera was operated at a framing rate of
271,554 fps (equaling the synchrotron ring frequency)
and a shutter speed of 1.0 s. At this framing rate, the
maximum frame size for the camera is 144 (H) × 256
(W) pixels. The field was then imaged 1:1, using a Ni-
kon 105-mm f/2.8 macro lens, giving a spatial resolution
of 20 m/pixel and a field of view of approximately 5.0
mm (H) × 2.8 mm (V). Two approaches were utilized to
enhance the image contrast ratio. First, water was doped
with 10% potassium iodide (KI) and 0.45% NaBr by
mass, in order to increase the absorption coefficient of
the liquid phase under the x-ray. Second, each of the ob-
tained images was normalized by an average reference
image (a so-called flatfield image) at each imaging loca-
tion and then saved as a 32-bit floating-point image using
the ImageJ software package.21 Image acquisition was
carried out at several locations, in order to cover the en-
tire x-ray accessible region within the beryllium nozzle

and a small portion of the discharged plume. A total of
20,000 images were acquired at each location. For the
present study, however, only the first 2,000 images were
selected for analysis. A commercially available software
package (DaVis, Version 8.1.4, LaVision, Inc.), which is
mainly used for data analysis of particle image veloci-
metry (PIV), was utilized to derive the liquid phase ve-
locity, using a cross-correlation algorithm. Multi-pass
cross correlation iterations were carried out with three
passes with initial window size of 64 pixels × 64 pixels
and two passes with a final window size of 4 pixels × 4
pixels with 50% overlap between windows. Post pro-
cessing was done with one pass of smoothing with a cell
size of 3 pixels × 3 pixels.
RESULTS AND DISCUSSION
Time-Averaged Flow Characterization
Pathlength-Integrated Fluorescence Measurements
Contours of line-of-sight EPL distributions for both
liquid and gas phases inside the nozzle are shown in Fig.
6. The injection condition has a liquid flow rate of 18.2
g/s and a gas-to-liquid mass ratio (GLR) of 4%. Please
note that the discontinuities in these contours result from
the limited number of measurement locations in the axial
direction. The injector body and flange, which are made
out of stainless steel, prevent x-ray access at the further
upstream locations in the plenum section. Also, the re-
gion with contoured transition from plenum to constant-
diameter passage was ignored. Nonetheless, the results
show that the two-phase flow inside the plenum region
is not uniform. Less liquid is distributed to the right of
the plenum section. Also, several localized regions of
high liquid concentration are clearly visible near the end
of the plenum section. The non-uniformity in liquid mass
distribution may come from imperfections in fabricating
or positioning the aerating tube inside the injector body,
or the distribution pattern of the aerating orifices on the
aerating tube. The corresponding gas EPL contours also
exhibit non-uniformity in gas phase distribution, as ex-
pected. In the nozzle passage region, however, non-uni-
formity in both liquid and gas distributions diminishes
substantially. Values of both water and gas EPLs are
smaller in the passage region, due to a reduction in pas-
sage diameter and the expansion of the two-phase mix-
ture toward the nozzle exit, which will be discussed be-
low.
Line profiles of the line-of-sight liquid densities are
shown in Fig. 7 for three injection conditions with vari-
ation in liquid flow rate, mL, at the same aeration level of
GLR = 4%. In general, the line profiles are not symmetric
with respect to the injector axis. More liquid is distrib-
uted to the left of the injector, due to the non-uniform
liquid mass distribution observed near the end of the ple-
num section. The liquid mass distribution exhibits an an-
nular-like pattern, with more liquid on the nozzle wall
and less liquid in the core flow for all three injection con-
ditions. The injection condition with a low liquid flow
rate of mL = 9.1 g/s has the most distinct annular distri-
bution pattern, with the largest difference in liquid den-
sity being between the region adjacent to the nozzle wall
and the region around the injector axis. As liquid flow
rate increases, more liquid can be distributed in the core
region, resulting in a less distinct annular distribution
pattern. The asymmetric liquid mass distribution is grad-
ually improved as the two-phase mixture moves toward
the nozzle exit, where more liquid is redistributed toward
the core region. The spikes in liquid density at the x = -8
mm location for the injection condition with mL = 9.1 g/s
mainly come from droplets adhering to the exterior of the
nozzle body within the x-ray beam path.
Line profiles of line-of-sight gas density are shown
in Fig. 8. Gas phase is mainly distributed in the core re-
gion of the nozzle passage. The gradual reduction in gas
phase concentration toward the nozzle exit indicates the
expansion process of the two-phase mixture within the
nozzle section. As the pressure gradually drops toward
the nozzle exit, the gas phase density decreases accord-
ingly. For the injection condition with mL = 27.2 g/s in
Fig. 8(c), a quick transition in gas density distribution
profile can be observed between x = -8 mm and -6 mm.
A similar observation can be made in the corresponding
liquid phase distribution profiles in Fig. 7(c). This obser-
vation, along with the phenomena noted above, indicates
that macro non-uniformity in two-phase flow structures
can be quickly filtered out as the flow passes through a
small-orifice nozzle.
Spanwise integration (x direction) of the above line
profiles for each spanwise probing line (y location) can
provide a useful measure of the axial development of the
flowfield. Figure 9 shows the axial distribution profiles
of average liquid density (L), average gas density (G),
and average liquid velocity (uL) for the injection condi-
tions discussed in Figs. 7 and 8. Within the present x-ray
probing range, the average liquid density gradually in-
creases toward the end of the plenum section, resulting
in a corresponding reduction in liquid velocity, due to
continuity. As the flow enters the nozzle passage, the av-
erage liquid density gradually decreases toward the noz-
zle exit. The corresponding liquid velocity exhibits a sig-
nificant increase across the nozzle entrance, due to a
400% reduction in flow cross-sectional area, and a con-
tinuous increase toward the nozzle exit, due to flow ex-
pansion. For a given nozzle geometry, an increase in liq-
uid flow rate leads to an increase in both average liquid
density and average liquid velocity, as expected.
The axial distribution profile for the average gas
density exhibits a trend similar to that of the average liq-
uid density. With the same aeration level of GLR = 4%,
the absolute amount of aerating increases for the injec-
tion condition with a high liquid flow rate. It should be
noted that the gas density levels at the location nearest

the nozzle exit plane are still far higher than the density
at room temperature and pressure. This strongly suggests
that the flow inside the nozzle is underexpanded, and an
abrupt gas expansion should be expected at the exit
plane.
Using the same analysis approaches, the effects of
aeration level on the two-phase flow structures within the
nozzle are characterized in terms of line profiles and av-
erage properties in Figs. 10-12. The liquid flow rate was
kept at mL = 18.2 g/s. With an increase in aeration level
to add more aerating gas into the same liquid flow rate,
the present results show that liquid density decreases and
gas density increases in general, as can be seen in the line
profiles of liquid and gas densities in Figs. 10 and 11,
respectively. Similar to previous observations, the liquid
distribution is mainly in an annular-like pattern, with
more liquid distributed adjacent to the nozzle wall, while
aerating gas is mainly distributed in the core flow. For
the present injector design, it seems that the injection
condition with a high liquid flow rate and a high aeration
level, i.e., mL = 18.2 g/s and GLR = 6% in Figs. 10(c) and
11(c), has a tendency to create asymmetric flow struc-
tures near the nozzle entrance region (x = -8 mm). The
asymmetric flow structures, however, transition quickly
into more symmetric structures as the flow proceeds
downstream. The axial distributions of average proper-
ties in Fig. 12 show that an increase in aeration level
leads to an increase in average gas density (due to in-
creases in both gas flow rate and the required injection
pressure), a reduction in average liquid density (due to
enhanced aeration), and an increase in average liquid ve-
locity (due to continuity).
Confocal Fluorescence Measurements
Figure 13 shows the cross-sectional distributions of
liquid and gas densities at an axial location of 5 mm from
the nozzle exit (x = 5 mm) for three injection conditions.
To the best of our knowledge, this is the first time the
confocal x-ray fluorescence technique has been used to
spatially resolve liquid and gas distributions within the
near field of spray plumes. For the injection condition
with mL = 18.2 g/s and GLR = 1%, the injected liquid is
mainly distributed in an annular ring without any signif-
icant changes in liquid distribution pattern inside the
nozzle (depicted in Fig. 10(a)). The plume diameter is
bigger than the nozzle exit diameter, indicating a further
but limited expansion process after the nozzle exit. The
gas plume preserves the Gaussian-like distribution pat-
tern observed in the internal flow (Fig. 10(b)), with a
plume diameter smaller than that of the liquid plume. As
the aeration level is increased to GLR = 4% at the same
liquid flow rate, the liquid plume is dispersed to a wider
plume with a Gaussian-like liquid distribution pattern.
The line profiles for the same injection condition in Fig.
7(b), however, show that the two-phase flow at the noz-
zle exit is still in the annular-like pattern, indicating a
fairly quick transition in liquid distribution pattern for
this highly-dispersed spray within a short distance. With
more aerating gas added to reach GLR = 4%, the gas
plume is wider than in the case with GLR = 1%. The gas
plume diameter, however, is still significantly smaller
than that of the liquid plume, indicating once again the
separation between liquid and gas plumes within the aer-
ated-liquid jets. The injection condition with mL = 9.1 g/s
and GLR = 4% generates a highly annular-like distribu-
tion pattern for the liquid plume. Recall that the line pro-
files for the line-of-sight liquid density in Fig. 8(a) also
exhibits a highly annular-like distribution pattern within
the nozzle, indicating a fairly limited expansion process
in the plume. The liquid plume diameter for the injection
condition with mL = 9.1 g/s and GLR = 4% is the smallest
among the three injection conditions.
Integration of the spatially-resolved EPLs obtained
by the confocal x-ray fluorescence technique along the
beam path direction (y direction) is expected to give the
line-of-sight EPLs obtained by the pathlength-integrated
x-ray fluorescence technique without the polycapillary
optic. Figure 14 shows comparisons in line-of-sight wa-
ter and gas EPLs using confocal (with polycapillary op-
tic) and pathlength-integrated (without polycapillary op-
tic) x-ray fluorescence measurements for the injection
condition with mL = 18.2 g/s and GLR = 4%. Good agree-
ment between both measurement techniques can be ob-
served. For the line-of-sight gas EPL obtained using the
pathlength-integrated x-ray fluorescence technique in
Fig. 14(b), however, a region outside the gas plume still
exhibits non-zero values, probably due to some spectral
bleed-through from the Br fluorescence in the liquid
phase. The bleed-through should be further explored ex-
perimentally to reduce this minor uncertainty. Nonethe-
less, the present study shows that the confocal x-ray flu-
orescence technique can be used to map out the time-av-
eraged mass distributions within a plume cross section.
Any non-uniformity and asymmetry in spatial mass dis-
tribution can be directly visualized, as can be seen in the
non-uniform liquid density contours within the annular
rings of two injection conditions in Fig. 13. If the path-
length-integrated x-ray fluorescence technique were
used to visualize the spatial mass distribution within a
spray cross section, limited-view tomography algorithms
along with multiple transverse scans at various azimuthal
angles would be required to depict any non-uniformity
features.
The advantage of using the confocal x-ray fluores-
cence technique to map out the cross-sectional mass dis-
tributions within an asymmetric spray is further illus-
trated, using injection of an aerated-liquid jet injected at
small angle relative to the horizontal plane. Figure 15
shows the macroscopic spray appearance of an aerated-
liquid jet injected at a shallow angle. The spray structure
is highly asymmetric, with the two-phase mixture mainly
expanding on the acute side of the plume. The plume

edge on the obtuse side is more or less parallel to the in-
clined injector axis. Figure 16 shows the cross-sectional
density distributions at two axial locations of 5 and 10
mm from the nozzle exit. The injection condition has an
injection angle of 30 degrees, a liquid flow rate of 18.2
g/s, and a GLR of 4%. Both liquid and gas plumes are
highly asymmetric. In the liquid plume, early relief of the
high-pressure two-phase mixture on the acute side at the
nozzle exit plane effectively disperses the liquid over a
large cross-sectional area. More gas mass is also concen-
trated on this side of the plume. The two-phase mixture
on the obtuse side of the nozzle exit plane, however, is
bounded by the final passage for a slightly longer dis-
tance, and experiences reduced pressure for limited lat-
eral expansion, resulting in a small region with highly
concentrated liquid. The region with a high liquid con-
centration travels downstream almost along the inclined
injection angle. The gas plume on the obtuse side is
small, since the majority of the aerating gas has been re-
leased on the acute side. As observed previously, the size
of the gas plume is smaller than that of the liquid plume.
High fidelity realization of both liquid and gas cross-sec-
tional structures for this injection condition by the con-
ventional pathlength-integrated x-ray fluorescence tech-
nique can be fairly challenging.
Time-Resolved Flow Characterization
Instantaneous Flow Structures
Figure 17 shows the composite images from uncor-
related individual instantaneous images taken at various
locations to illustrate the two-phase flow structures in-
side the beryllium nozzles at the injection condition of
mL = 18.2 g/s, and GLR = 4%. Please note that the present
camera setup has a spatial resolution of 20 m per pixel.
Any interface features below that spatial resolution can-
not be resolved. The camera shutter speed of 1.0 s cre-
ates additional ambiguity in accurately capturing the pre-
cise interface locations. For instance, an object travelling
at a speed of 50 m/s can travel a distance equal to 2.5
pixels of a 1.0 s span. Nonetheless, the images in Fig.
17 show that large-scale structures with identifiable in-
terfaces are mainly located in the plenum section. The
length scale of the two-phase structures dramatically de-
creases in the nozzle passage section, probably due to
aerodynamic stretch during flow acceleration from the
plenum section to the nozzle section. In the nozzle pas-
sage, it appears that clusters of high-concentration liquid
are present in the upstream section. At the further down-
stream locations near the nozzle exit, the two-phase
flows mainly consist of relatively “fine” structures for all
three nozzles. The obtained images can be compiled to
create movies at a low playback speed to further under-
standing of the temporal evolution of the two-phase
flows within the nozzles. Areas of improvement for the
present high-speed imaging approach include increases
in spatial resolution, camera shutter speed, and the use of
higher potassium iodide concentration to enhance image
contrast ratio.
Velocity Measurements
Despite the observed limitations in the present high-
speed imaging setup, attempts to measure the axial ve-
locity of identifiable interface features was carried out,
using sequential high-speed images within the nozzle
section. Noting that an annular-like flow structure in the
liquid phase inside the nozzle for most of the injection
conditions, a thin layer of liquid is expected to flow
along the nozzle wall. Interfaces on the liquid film are
probably the most identifiable features in the high-speed
images. The measured velocity is, therefore, more repre-
sentative of the liquid film velocity. Figure 18 shows the
contours of average and standard deviation of axial ve-
locity for the two-phase mixture inside the nozzle with
mL = 18.2 g/s and GLR = 4%. The sudden increase in ax-
ial velocity around the nozzle entrance is clearly de-
picted, as observed in the average liquid velocity derived
from x-ray fluorescence measurements at the corre-
sponding injection condition shown in Fig. 9(c). The
flow then gradually accelerates toward the nozzle exit
and reaches an average velocity of around 95 m/s at the
x = -3 mm location. This relatively high velocity is
higher than at the maximum average liquid velocity of
around 75 m/s at the nozzle exit in Fig. 9(c). The meas-
ured velocity near the nozzle exit (x > -1.5 mm), how-
ever, exhibits a reduced average velocity of around 50
m/s, with a high standard deviation. The average liquid
velocity derived from fluorescence measurements exhib-
its a trend of continuous increase up to the nozzle exit.
The factors contributing to this discrepancy are unknown
and should be explored in the future.
SUMMARY
Time-averaged and temporal structures of the two-
phase flows within the nozzle of an aerated-liquid injec-
tor were experimentally explored with synchrotron x-ray
diagnostics, including x-ray fluorescence and x-ray high-
speed imaging, at the Advanced Photon Source at Ar-
gonne National Laboratory. The aerated-liquid injector
features an outside-in aerating scheme with the aerating
gas flowing through aerating orifices from an annular
passage to mix with the core liquid flow. A beryllium
nozzle with a constant passage diameter of 1.0 mm and
a length of 10 mm was fabricated for high x-ray trans-
parency. Water and nitrogen were doped with bromine
and krypton, respectively, at low concentrations, to facil-
itate both confocal and pathlength-integrated x-ray fluo-
rescence measurements. Water was also doped with po-
tassium iodide for high-speed imaging, in order to tem-
porally resolve the two-phase flow evolution.
The present study shows that time-averaged mass
distributions of liquid and gas phases within the two-
phase flows of aerated-liquid jets can be quantitatively

characterized by both x-ray fluorescence approaches.
Within the beryllium nozzle, the pathlength-integrated
fluorescence technique was utilized to provide line-of-
sight mass distributions for the two-phase flows inside
the nozzle. It was found that the two-phase flows inside
the nozzle section exhibit an annular-like flow pattern
with more liquid distributed mainly within a thin layer of
liquid film flowing along the nozzle wall. The aerating
gas is distributed in a Gaussian-like pattern. Non-uni-
formity or asymmetry in liquid distributions within the
plenum section can diminish quickly within a short dis-
tance from the nozzle entrance, and the liquid distribu-
tion reaches a more uniform/symmetric pattern near the
nozzle exit. Axial distributions of the average liquid den-
sity, gas density, and liquid velocity were also explored
by integrating the line-of-sight properties over the cross-
sectional areas at several axial locations within the noz-
zle section. For the present nozzle configuration with a
constant-diameter passage, an increase in liquid flow rate
and aeration level increases the liquid velocity toward
the nozzle exit.
For the first time, confocal x-ray fluorescence meas-
urements were carried out with a polycapillary x-ray op-
tic to resolve the time-averaged cross-sectional liquid
and gas distributions in three dimensions within the near
field of discharged plumes. Preservation of the annular-
like flow structures within the discharged plumes was di-
rectly observed for injection conditions with a low liquid
flow rate or a low aeration level. It was found that a quick
transition in flow pattern from annular-like within the
nozzle passage to Gaussian-like within the discharged
plume can be achieved for the injection condition with a
high liquid flow and a high aeration level. Plume separa-
tion phenomena for both liquid and gas plumes were
readily observed using this technique. The capability of
the confocal x-ray fluorescence technique to spatially re-
solve a highly asymmetric flow structure was further
demonstrated, using an injection configuration with an
aerated-liquid jet injected at a shallow angle. It should be
noted that these 3D resolved measurements were made
without resorting to tomographic measurements, which
require rotating the injector with respect to the x-ray
beam. As such, they are more amenable to flowfields
with limited optical access. Comparison of the line-of-
sight mass distributions between focused and unfocused
x-ray fluorescence techniques reaches a fairly good
agreement, providing an enhanced level of confidence in
applying the focused fluorescence technique for two-
phase flow characterization.
High-speed radiographic x-ray imaging shows that
large-scale structures are mainly present in the plenum
section and can be aerodynamically stretched into fine
structures in the nozzle within a short distance. Axial
flow velocity of the two-phase flow was also measured
from the sequential high-speed images and compared
with the average liquid velocity derived from fluores-
cence measurements. Qualitative agreements in axial ve-
locity distribution were partially reached between both
velocity measurement approaches. Improvement to the
present imaging setup is needed, in order to better re-
solve the flow structures both spatially and temporally in
the future.
ACKNOWLEDGEMENTS
This work was sponsored by the AFRL/Aerospace Sys-
tems Directorate under contract number FA8560-14-D-
2316 (Contract monitor: Stephen Smith) and by the Air
Force Office of Scientific Research (AFOSR). Use of the
Advanced Photon Source at Argonne National Labora-
tory was supported by the U. S. Department of Energy,
Office of Science, Office of Basic Energy Sciences, un-
der Contract No. DE-AC02-06CH11357. The authors
would like to thank Travis Tidball, Steve Enneking, Matt
Streby, and Justin Stewart of Taitech, Inc. for their assis-
tance in hardware design, setup, data acquisition, and
data reduction.
REFERENCES
1. Lefebvre, A.H., Wang, X.F., and Martin, C.A.,
Spray Characteristics of Aerated-Liquid Pressure
Atomizers, J. Propulsion Power, Vol. 4, pp. 293-
298, 1988.
2. Sovani, S. D., Sojka, P. E., Lefebvre, A. H., “Effer-
vescent Atomization,” Progress in Energy and
Combustion Science, Vol. 27, 2001, pp. 483-521.
3. Mathur, T., Lin, K.-C., Kennedy, P., Gruber, M.,
Donbar, J., Jackson, T., and Billig, F., “Liquid JP-7
Combustion in a Scramjet Combustor,” AIAA Pa-
per 2000-3581, August 2000.
4. Wade, R. A., Weerts, J. M., Sojka, P. E., Gore, J. P.,
and Eckerle, W. A. “Effervescent Atomization at In-
jection Pressures in the MPa Range,” Atomization
and Sprays, Vol. 9, 1999, pp. 651-657.
5. Mostafa, A. and Khail, A., “Measurements of Coal
Water Slurry Sprays Produced by an Effervescent
Atomizer,” 42nd AIAA/ASME/SAE/ASEE Joint
Propulsion Conference & Exhibit, July, 2006.
6. Lin, K.-C., Kennedy, P. J., and Jackson, T. A.,
“Spray Structures of Aerated-Liquid Jets in Sub-
sonic Crossflows,” AIAA Paper 2001-0330, Janu-
ary 2001.
7. Lin, K.-C., Kennedy, P. J., and Jackson, T. A.,
“Structures of Aerated Liquid Jets in High Speed
Crossflows,” AIAA Paper 2002-3178, August 2002.
8. Linne, M., Sedarsky, D., Meyer, T., Gord, J., and
Carter, C., “Ballistic imaging in the near-field of an
effervescent spray,” Experiments in Fluids, Vol. 49,
2010, pp. 911923.
9. Lin, K.-C., Carter, C., Fezzaa, K., Wang, J., Liu, Z.,
“X-Ray Study of Pure- and Aerated-Liquid Jets in a

Quiescent Environment,” AIAA Paper 2009-0994,
January 2009.
10. Lin, K.-C., Rajnicek, C., McCall, J., Fischer, B.,
Carter, C., and Fezzaa, K., “Structures of Aerated-
Liquid Jets Injected from Various Nozzle Con-
tours,” AIAA Paper 2011-0232, January 2011.
11. Lin, K.-C., Rajnicek, C., McCall, J., Carter, C., and
Fezzaa, K., “Investigation of Pure- and Aerated-Liq-
uid Jets Using X-Ray Phase Contrast Imaging Tech-
nique,” Nuclear Instruments and Methods in Phys-
ics Research Section A, Vol. 649, No. 1, 2011, pp.
194-196.
12. Lin, K.-C., Carter, C., Smith, S., and Kastengren, A.,
“Exploration of Aerated-Liquid Jets Using X-Ray
Radiography,” AIAA Paper 2012-0347, January
2012.
13. Lin, K.-C., Carter, C., Smith, S., and Kastengren, A.,
“Exploration of Near-Field Plume Properties for
Aerated-Liquid Jets Using X-Ray Radiography,”
AIAA Paper 2014-1183, January 2014.
14. Lin, K.-C., Carter, C., Smith, S., and Kastengren, A.,
“Characterization of Aerated-Liquid Jets Using
Simultaneous X-Ray Radiography and X-Ray Fluo-
rescence Measurements,” ILASS Americas, May
2014.
15. Lin, K.-C., Carter, C., Kastengren, A., and Peltier,
S., “Exploration of Gas Phase Properties in Aerated-
Liquid Jets Using X-Ray Fluorescence,” AIAA Pa-
per 2015-0165, January 2015.
16. Peltier, S., Lin, K.-C., Carter, C., and Kastengren,
A., “Characterization of Flow Structures Inside an
Aerated-Liquid Injector Using X-Ray Diagnostics,”
ILASS Americas 27th Annual Conference on Liq-
uid Atomization and Spray Systems, Raleigh, NC,
May 2015.
17. Kastengren, A. L., Powell, C. F., Arms, D., Du-
fresne, E., and Wang, J., “Spray Diagnostics at the
Advanced Photon Source 7-BM Beamline,” ILASS
Americas, 22nd Annual Conference on Liquid Atom-
ization and Spray Systems, Cincinnati, OH, May
2010.
18. Kastengren, A.L. and Powell, C.F., “Synchrotron X-
Ray Techniques for Fluid Dynamics,” Experiments
in Fluids, Vol. 55, No. 3, Article 1686, 2014.
19. Kastengren, A.L., “X-Ray Fluorescence as a Gas-
Phase Mixing Diagnostic,” Central States Section of
the Combustion Institute Spring Technical Meeting,
March 2014, Tulsa, OK.
20. MacDonald, C., “Focusing Polycapillary Optics and
Their Applications,” X-Ray Optics and Instrumen-
tation, Vol. 2010, Article ID 867049, 17 pages,
2010.
21. Schneider, C. A., Rashband, W. S., and Eliceiri, K.
W., “NIH Image to ImageJ: 25 Years of Image
Analysis,” Nat. Methods, Vol. 9, pp. 671–675, 2012.
ILASS Americas, 29th Annual Conference on Liquid Atomization and Spray Systems, Atlanta, GA, May 15-18, 2017
Figure 1. Schematic of the aerated-liquid injector as-
sembly
Figure 2. Schematic of the beryllium nozzle. d0 = 1.0
mm, L = 10 mm
Figure 3. X-ray and injection stand setup at the 7-BM beamline at the Argonne National Laboratory.
(a) (b)
Figure 4. Schematics to illustrate (a) pathlength-integrated and (b) confocal fluorescence setups

Figure 5. Schematics to illustrate the concept of equivalent path length (EPL) in the present x-ray measurement
(a) (b)
Figure 6. Contour plots for line-of-sight EPL of (a) water and (b) nitrogen in the beryllium nozzle. mL=18.2 g/s,
GLR=4%.
(a) (b) (c)
Figure 7. Line-of-sight water density profiles to illustrate the effects of liquid flow rate on two-phase flow structures
in the nozzle section. (a) mL=9.1 g/s, (b) 18.2 g/s, and (c) 27.2 g/s. GLR=4%.
(a) (b) (c)
Figure 8. Line-of-sight nitrogen density profiles to illustrate the effects of liquid flow rate on two-phase flow struc-
tures in the nozzle section. (a) mL=9.1 g/s, (b) 18.2 g/s, and (c) 27.2 g/s. GLR=4%.
(a) (b) (c)
Figure 9. Averaged properties of the two-phase flow structures in the nozzle section at various liquid flow rates. (a)
Water density, (b) nitrogen density, and (c) liquid velocity. GLR=4%.
-1.2 -0.8 -0.4 0 0.4 0.8 1.2y (mm)
0
200
400
600
800
1000
L (
Kg
/m3)
mL=9.1 g/s, GLR=4%, Config. #1, L/d0=10
Line x (mm)
-8
-6
-4
-2
-0.5
-1.2 -0.8 -0.4 0 0.4 0.8 1.2y (mm)
0
200
400
600
800
1000
L (
Kg
/m3)
mL=18.2 g/s, GLR=4%, Config. #1, L/d0=10
Line x (mm)
-8
-6
-4
-2
-0.5
-1.2 -0.8 -0.4 0 0.4 0.8 1.2y (mm)
0
200
400
600
800
1000
L (
Kg
/m3)
mL=27.2 g/s, GLR=4%, Config. #1, L/d0=10
Line x (mm)
-8
-6
-4
-2
-0.5
-1.2 -0.8 -0.4 0 0.4 0.8 1.2y (mm)
0
4
8
12
16
20
24
G (
Kg
/m3)
mL=9.1 g/s, GLR=4%, Config. #1, L/d0=10
Line x (mm)
-8
-6
-4
-2
-0.5
-1.2 -0.8 -0.4 0 0.4 0.8 1.2y (mm)
0
4
8
12
16
20
24
G (
Kg
/m3)
mL=18.2 g/s, GLR=4%, Config. #1, L/d0=10
Line x (mm)
-8
-6
-4
-2
-0.5
-1.2 -0.8 -0.4 0 0.4 0.8 1.2y (mm)
0
4
8
12
16
20
24
G (
Kg
/m3)
mL=27.2 g/s, GLR=4%, Config. #1, L/d0=10
Line x (mm)
-8
-6
-4
-2
-0.5
-12 -10 -8 -6 -4 -2 0x (mm)
0
200
400
600
800
1000
L(
kg
/m3)
Config. #1, d0= 1.0 mm, L/d0=10
GLR=4%
Nozzle
Passage
SYM. mL (g/s)
9.1
18.2
27.2
-12 -10 -8 -6 -4 -2 0x (mm)
0
4
8
12
16
20
24
G (
kg
/m3)
Config. #1, d0= 1.0 mm, L/d0=10
GLR=4%
Nozzle
Passage
SYM. mL (g/s)
9.1
18.2
27.2
-12 -10 -8 -6 -4 -2 0x (mm)
0
20
40
60
80
100
uL (
m/s
)
Config. #1, d0= 1.0 mm, L/d0=10
GLR=4%
Nozzle
Passage
SYM. mL (g/s)
9.1
18.2
27.2

(a) (b) (c)
Figure 10. Line-of-sight water density profiles to illustrate the effects of aeration level on two-phase flow structures
in the nozzle section. (a) GLR=1%, (b) 2%, and (c) 6%. mL=18.2 g/s.
(a) (b) (c)
Figure 11. Line-of-sight nitrogen density profiles to illustrate the effects of aeration level on two-phase flow struc-
tures in the nozzle section. (a) GLR=1%, (b) 2%, and (c) 6%. mL=18.2 g/s.
(a) (b) (c)
Figure 12. Averaged properties of the two-phase flow structures in the nozzle section at various aeration levels. (a)
Water density, (b) nitrogen density, and (c) liquid velocity. mL=18.2 g/s.
-1.2 -0.8 -0.4 0 0.4 0.8 1.2y (mm)
0
200
400
600
800
1000
L (
Kg
/m3)
mL=18.2 g/s, GLR=1%, Config. #1, L/d0=10
Line x (mm)
-8
-6
-4
-2
-0.5
-1.2 -0.8 -0.4 0 0.4 0.8 1.2y (mm)
0
200
400
600
800
1000
L (
Kg
/m3)
mL=18.2 g/s, GLR=2%, Config. #1, L/d0=10
Line x (mm)
-8
-6
-4
-2
-0.5
-1.2 -0.8 -0.4 0 0.4 0.8 1.2y (mm)
0
200
400
600
800
1000
L (
Kg
/m3)
mL=18.2 g/s, GLR=6%, Config. #1, L/d0=10
Line x (mm)
-8
-6
-4
-2
-0.5
-1.2 -0.8 -0.4 0 0.4 0.8 1.2y (mm)
0
4
8
12
16
20
24
G (
Kg
/m3)
mL=18.2 g/s, GLR=1%, Config. #1, L/d0=10
Line x (mm)
-8
-6
-4
-2
-0.5
-1.2 -0.8 -0.4 0 0.4 0.8 1.2y (mm)
0
4
8
12
16
20
24
G (
Kg
/m3)
mL=18.2 g/s, GLR=2%, Config. #1, L/d0=10
Line x (mm)
-8
-6
-4
-2
-0.5
-1.2 -0.8 -0.4 0 0.4 0.8 1.2y (mm)
0
4
8
12
16
20
24
G (
Kg
/m3)
mL=18.2 g/s, GLR=6%, Config. #1, L/d0=10
Line x (mm)
-8
-6
-4
-2
-0.5
-12 -10 -8 -6 -4 -2 0x (mm)
0
200
400
600
800
1000
L(
kg
/m3)
Config. #1, d0= 1.0 mm, L/d0=10
mL=18.2 g/s
Nozzle
Passage
SYM. GLR (%)
1
2
4
6
-12 -10 -8 -6 -4 -2 0x (mm)
0
4
8
12
16
20
24
G (
kg
/m3)
Config. #1, d0= 1.0 mm, L/d0=10
mL=18.2 g/s
Nozzle
Passage
SYM. GLR (%)
1
2
4
6
-12 -10 -8 -6 -4 -2 0x (mm)
0
20
40
60
80
100
uL (
m/s
)
Config. #1, d0= 1.0 mm, L/d0=10
mL=18.2 g/s
Nozzle
Passage
SYM. GLR (%)
1
2
4
6

(a) (b)
Figure 13. Contour plots for cross-sectional density distributions of (a) water and (b) nitrogen at various injection
conditions. 5.0 mm from the nozzle exit (x=5.0 mm).

(a) (b)
Figure 14. Line-of-sight EPL comparison between confocal and pathlength-integrated x-ray fluorescence measure-
ments. (a) Water and (b) nitrogen. mL=18.2 g/s, GLR=4%, 5.0 mm from the nozzle exit (x=5.0 mm).
Figure 15. Photograph of an aeraed-liquid jet injected at a shadow angle to illustrate the spray structure.
-8 -4 0 4 8y (mm)
0
0.01
0.02
0.03
0.04
0.05
0.06L
ine
-of-
Sig
ht
Wa
ter E
PL
(m
m)
Config. #1
L/d0=10
mL=18.2 g/s
GLR=4%
x=5 mm
SYM. Fluorescence Diagnostics
Pathlength-Integrated
Confocal
-8 -4 0 4 8y (mm)
0
1
2
3
Lin
e-o
f-S
igh
t N
itro
ge
n E
PL
(m
m)
Config. #1
L/d0=10
mL=18.2 g/s
GLR=4%
x=5 mm
SYM. Fluorescence Diagnostics
Pathlength-Integrated
Confocal

Figure 16. Cross-sectional contour plots for water and nitrogen densities at two axial locations for the aerated-liquid
jet injected at a 30 angle. d0=1.0 mm, L/d0=10, mL=18.2 g/s, GLR=4%. Injector orifice at (Y, Z) = (0, 0).
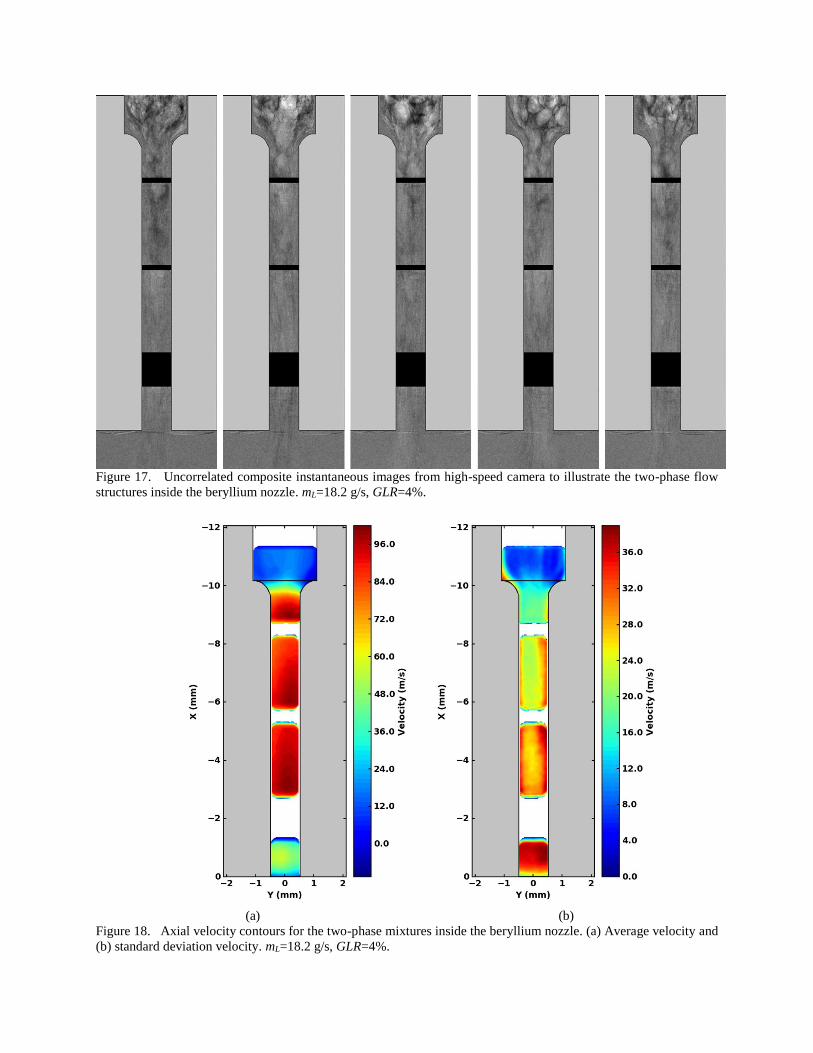
Figure 17. Uncorrelated composite instantaneous images from high-speed camera to illustrate the two-phase flow
structures inside the beryllium nozzle. mL=18.2 g/s, GLR=4%.
(a) (b)
Figure 18. Axial velocity contours for the two-phase mixtures inside the beryllium nozzle. (a) Average velocity and
(b) standard deviation velocity. mL=18.2 g/s, GLR=4%.


![Multi-Level Visualization for the Exploration of Temporal ...vcg.informatik.uni-rostock.de/~hadlak/pub_files/2010Holzhueter-MLT.pdf · Multiple views visualization framework MOSAN[1],](https://static.fdocuments.in/doc/165x107/5e8453b28b28811f3917bead/multi-level-visualization-for-the-exploration-of-temporal-vcg-hadlakpubfiles2010holzhueter-mltpdf.jpg)